

Abstract
Background
Cancer is the second leading cause of death worldwide. Alongside other interventions, access to certain medicines may decrease cancer‐associated mortality. Listing medicines on national essential medicines lists may improve health outcomes. We examine the association between cancer mortality amenable to care and the listing of cancer medicines on national essential medicines lists (NEMLs) of 124 countries.
Methods
In this cross‐sectional study, we determined the number of medicines used to treat eight cancers on NEMLs and used multiple linear regression to analyze the association between cancer health outcome scores and the number of medicines on NEMLs while controlling for GDP. A sensitivity analysis was also conducted using selected medicines.
Findings
The number of cancer medicines on NEMLs was not associated with cancer health outcome scores when GDP was controlled for non‐melanoma skin (p = 0.224), uterine (p = 0.221), breast (p = 0.145), Hodgkin's lymphoma (p = 0.697), colon (p = 0.299), leukemia (p = 0.103), cervical (p = 0.834), and testicular cancers (p = 0.178).
Interpretation
There was a weak association between listing medicines for eight cancers in NEMLs and amenable mortality. Further studies are required to explore association between cancer health outcomes and other factors such as actual availability of medicines listed, access to surgeries, accurate diagnosis, radiotherapy, and early detection.
1. INTRODUCTION
Cancer is the second cause of death globally and accounts for 17% of worldwide deaths. 1 The global cancer burden is estimated to have risen to 19.3 million new cases and 10.0 million deaths in 2020. 1 One in 5 people worldwide develop cancer during their lifetime, and one in 8 men and one in 11 women die from the disease. 2 Highly effective medicines are one part of care that prevents deaths arising from a number of cancers. 3 The World Health Organization (WHO) therefore includes essential medicines for cancer treatments on its Model List of Essential Medicines (WHO EML). 4 Essential medicines are those that satisfy the priority health care needs of the population and are “selected with due regard to disease prevalence and public health relevance, evidence of clinical efficacy and safety, and comparative costs and cost‐effectiveness.” 5 In 1977, the WHO EML initially listed seven anticancer medicines; this number has increased over time and presently it lists 62 medicines used in the management of cancers. 6 For the management of cancer, the WHO EML lists alkylating agents, antitumor antibiotics, antimetabolites, mitotic inhibitors, anthracyclines, hormones and antagonists, other cytotoxic drugs, biological agents, and supportive therapy (such as medicines used in the management of pain associated with cancers). 4 The WHO recommends countries to establish national essential medicines lists (NEMLs) as they select medicines intended to be “available within the context of functioning health systems at all times in adequate amounts, in the appropriate dosage forms, with assured quality, and at a price the individual and the community can afford.” 5 These lists influence access to selected medicines that meet the priority health care needs of countries as they are often the primary resource used for selection of medicines in the public sector where many patients are managed for cancers. 7
Access to quality health care has shown to improve several health outcomes. 8 , 9 Health care and access quality can be estimated using amenable mortality, which measures mortality rates from causes that should not be catastrophic in the presence of adequate health care. 10 , 11 , 12 , 13 Amenable causes include communicable diseases (e.g., tuberculosis, upper respiratory tract infections) and non‐communicable diseases (NCDs) (e.g., cancers). 3 Amenable mortality can be therefore used as a tool to assess the performance of health care systems worldwide. 14
The purpose of this study was to determine if there is an association between listing medicines used in the management of 8 cancers and amenable mortality for these conditions measured by the health care access and quality (HAQ) score. 3
2. METHODS
2.1. Dataset sources
NEMLs from the WHO's National Essential Medicines Lists Repository were obtained and all medicines listed for each country, with some exceptions, were recorded. These lists were used to create a Global Essential Medicines (GEM) database of 2182 medicines. 15 , 16
Each country was assigned a HAQ health outcomes score for each of the eight cancers. 3 The HAQ score is based on the Global Burden of Diseases Study, and the disease specific HAQ scores for cancers are based on mortality‐to‐incidence ratios that utilize cancer registry data for each country. 3 Each HAQ score is age‐standardized and scaled to range from 0 to 100 based on the percentile in comparison with other countries.
2.2. Data collection
To create a list of medications used in the management of eight common cancers that are substantial contributors to global mortality (breast, non‐melanoma [NM] skin, colon, Hodgkin's, Leukemia, testicular, uterine, and cervical cancers), we searched the WHO website for international treatment guidelines for the management of cancers in June 2019. Three guidelines published by the WHO were used to provide guidelines for the management of NCDs and one for breast cancer. The guidelines selected were WHO Package of Essential Non communicable (PEN) Diseases Interventions for Primary Health Care in Low‐Resource Settings, 17 “Best Buys” and other recommended interventions for the prevention and control of non‐communicable diseases 18 and WHO EMRO Technical Publication series 31‐Guidelines for management of breast cancer. 19 For the other seven cancer causes which did not have an international treatment guideline, medicines retrieved from MIA and MEDI‐HPS searches based on ICD‐9/10 codes mapped to causes were included if determined to be clinically appropriate to treat the conditions associated with the cause. If more than 2 medications from a drug class (based on ATC codes) appeared in the searches for a cause, all other drugs from that class were included in the final list if determined to be clinically appropriate as well. The 20th WHO EML 4 along with these guidelines were used to create a final list of medications for each cancer cause after duplicates were collapsed.
2.3. Data extraction
The list of medications was reviewed by a medical oncologist (CB) to ensure they were correctly matched to specific cancers. The list of the medications associated with each of the eight cancers were coded into the GEM database 15 and medications overlapping on these lists and each country's NEML were identified, totaled, and a coverage score for each country per cancer cause was created. Data for gross domestic product (GDP) per capita was obtained from the World Bank for the year 2016. World bank data from 2016 was used to match the 2017 NEML as it was the closest year to 2017 with available data. 20
2.4. Data analysis
Statistical analysis was carried out in R version 3.6.0, and for this model, the co‐efficient for each medicine and covariate, the lower 95% CI, the upper 95% CI, and p‐value of the association were recorded. For this analysis, GDP per capita in international dollars was included as a covariate. GDP represents health expenditure and is generally known to influence health systems. Multiple linear regression was used to assess the association between the HAQ cancer health outcome scores and the number of medicines listed in each country's NEML for each cancer cause. Linear regression was run both unadjusted and adjusted with GDP as a covariate. Countries were excluded from the analysis if data for the cancer health outcome and covariate were unavailable.
We conducted a sensitivity analysis using a set of medicines selected by an oncologist as first line drugs used for the management of each of seven cancers. (NM skin cancer was excluded, as no select medicines are required for its treatment based on standard treatment guidelines.) Medicines used as supportive care, such as analgesics, were excluded. For each cancer, four models were run: all medicines unadjusted, all medicines adjusted, oncologist selected medicines unadjusted, and oncologist selected medicines adjusted.
2.5. Role of the funding source
The study was supported by funding from the Canadian Institutes of Health Research (CIHR), Ontario SPOR Support Unit, St Michael's Hospital Foundation, and Canada Research Chairs Program. The funding source played no role in study design; in the collection, analysis, and interpretation of data; in the writing of the report; and in the decision to submit the paper for publication.
3. RESULTS
We collected health outcome score data for 131 of the 137 countries with NEMLs for each of the eight cancer causes (see Appendix A; Table A1). Cook Islands, Nauru, Niue, Palau, Tuvalu, and Saint Kitts and Nevis were excluded from the analysis as no cancer health outcome score data was available for them. The following countries were excluded from the analysis due to missing covariate data: Cook Islands, Cuba, Democratic People's Republic of Korea, Djibouti, Eritrea, Niue, Somalia, Syrian Arab Republic, and Venezuela. A total of 124 countries with HAQ scores and GDP data were included in this analysis.
National essential medicines lists included a median of 81 (IQR: 55.75 (56.25–112), range: 1–177) cancer treatments. The most commonly listed medicines were morphine (included on 95% of lists), methotrexate (92%) and medroxyprogesterone (87%). The number of medicines recorded for each cancer was: 10 medicines for NM skin cancer, 6 for uterine cancer, 37 for breast cancer, 36 for Hodgkin's lymphoma, 18 for colon cancer, 71 for leukemia, 12 for cervical cancer, and 13 for testicular cancer. The number of medicines selected by the oncologist for the sensitivity analysis were: 5 for uterine cancer, 3 for testicular cancer, 4 for colon cancer, 2 for cervical cancer, 7 for Hodgkin's lymphoma, 24 for leukemia, and 10 for breast cancer. The median medicine coverage scores and IQR for each cancer were: NM skin cancer 4 (IQR 3 (3–6)), uterine cancer 4 (IQR 2 (3–5)), breast cancer 12 (IQR 11 (8–19)), Hodgkin's lymphoma 17 (IQR 9 (12–21)), colon cancer 6 (IQR 5 (4–9)), leukemia 22 (IQR 17 (14–31), cervical cancer 5 (IQR 3 (4–7), and testicular cancer 8 (IQR 7 (3–10)).
The adjusted relationship between variables by regions, with the size of the bubbles representing GDP for all eight cancers is shown in Figures 1 and 2. Briefly, there were associations between medicine listing and outcomes for three of the eight examined cancers (Hodgkin's lymphoma (p = 0.0015), testicular (p = 0.0002), and cervical (p = 0.0004)) and the multiple linear regression model indicated that there was no association between the number of medicines listed and the health outcomes scores when GDP was taken into consideration. For each of the eight cancer causes, the relationship between listing medicines and cancer outcomes are detailed below.
FIGURE 1.
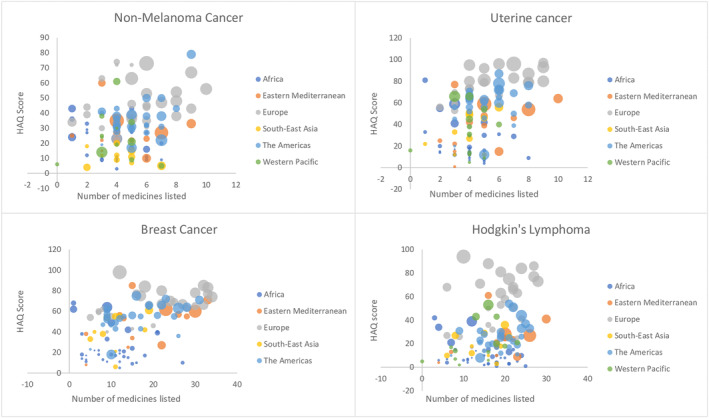
Relationship between number of medicines listed and HAQ scores by regions, with the size of the bubbles representing GDP.
FIGURE 2.

Relationship between number of medicines listed and HAQ scores by regions, with the size of the bubbles representing GDP.
3.1. Non‐melanoma skin cancer
The unadjusted linear regression model showed that the number of medicines listed on NEMLs account for 9.64% of the differences in cancer health outcome scores between countries (R 2 = 0.096). Adjusting the regression for GDP showed that 20% of the difference in HAQ scores for NM skin cancer (R = 0.20) was explained by listing medicines for NM skin cancer and taking the covariate into consideration. In the GDP unadjusted model (p = 0.000208), there was an association between listing the medicines and the HAQ scores. When GDP was taken into consideration with the adjusted model, this association was lost (p = 0.224) (see Figure 1).
3.2. Uterine cancer
For uterine cancer, all four models showed no association between listing medicines and HAQ scores. An unadjusted regression model showed listing medicines for uterine cancer explained approximately 20% of the differences in HAQ scores (R 2 = 0.1974). For the medicines selected by the oncologist, the model showed listing these medicines accounted for 14% difference in countries' HAQ scores (R 2 = 0.14). For the GDP adjusted model, 64% of differences in the HAQ score for uterine cancer (R 2 = 0.64) was explained by listing medicines for uterine cancer along with the GDP. For the medicines selected by the specialist, listing these medicines for uterine cancer explained the same difference of 65% (R 2 = 0.65) (see Figure 1).
3.3. Breast cancer
Like uterine cancer, all four models showed there was no association between listing breast cancer medicines and HAQ scores. The unadjusted model showed listing medicines for breast cancer explained approximately 24% of the differences in HAQ scores (R 2 = 0.2436). For the medicines selected by the specialist, the model showed listing these medicines accounted for 19% difference in countries' HAQ scores (R 2 = 0.19). For the GDP adjusted model, 64% of differences in the HAQ score for uterine cancer (R 2 = 0.64) were explained by listing medicines for breast cancer along with the GDP. For the medicines selected by the specialist, listing these medicines for breast cancer showed the same extent of difference in HAQ scores for uterine cancer (R 2 = 0.64) (see Figure 1).
3.4. Hodgkin's lymphoma
For Hodgkin's lymphoma, the unadjusted model indicated that there was an association between listing medicines for HL and HAQ scores (p = 0.001). Listing one of these medicines was associated with a 1.002 increase in HAQ scores. This relationship was not significant with the medicines selected by the specialist (p = 0.114). With adjustment for GDP, neither model showed any association between listing medicines for HL and HAQ scores. For the adjusted model, 67% of differences in the HAQ score for Hodgkin's lymphoma (R 2 = 0.66) were explained by listing medicines for HL along with the GDP. This was also the same for the medicines specially selected (R 2 = 0.66) (see Figure 1).
3.5. Colon cancer
The results of the unadjusted analysis for colon cancer indicated that listing all the medicines for colon cancer had no association with HAQ scores (p = 9.219). With listing the medicines selected by the oncologist, this relationship was present (p = 0.0003). Listing each medicine selected by the oncologist was associated with a 5.3 increase in HAQ scores. 17% of the difference in HAQ scores is explained by listing the total number of medicines (R 2 = 0.17) while only 10% of this difference is explained by countries' listing the specially selected medicines (R 2 = 0.095). The results of the adjusted analysis for GDP showed no association between listing medicines for colon cancer and HAQ scores. For these models, 59% of the difference in HAQ scores is explained by listing the total number of medicines and GDP (R 2 = 0.59). This was also the same association with the oncologist selected medicines (R 2 = 0.59) (see Figure 2).
3.6. Leukemia
For leukemia, the unadjusted analysis indicated that listing all the medicines for Leukemia had no association with HAQ scores (p = 0.545). With the medicines selected by the oncologist, this relationship was present (p = 0.0001). Listing each medicine selected by the specialist was associated with a 1.4 increase in HAQ scores. 16% of the difference in HAQ scores is explained by listing the total number of medicines (R 2 = 0.16) while 11% of this difference is explained by countries' listing the specially selected medicines (R 2 = 0.11). The results of the adjusted analysis for GDP showed no association between listing medicines for colon cancer and HAQ scores. For these models, 52% of the difference in HAQ scores is explained by listing the total number of medicines and GDP (R 2 = 0.5181). This was also similar to the association with the specialist selected medicines (R 2 = 0.5139) (see Figure 2).
3.7. Cervical cancer
For cervical cancer, the unadjusted analysis showed that there was a relationship between listing medicines and HAQ scores. For the total number of medicines, listing one of these medicines was associated with a 2.3 increase in HAQ scores (p = 0.0004) while listing any of the specialist selected medicines was associated with a 5.3 increase in HAQ scores (p = 0.009). This association was not observed when the models were adjusted for GDP (see Figure 2).
3.8. Testicular cancer
The unadjusted analysis showed that there was a relationship between listing medicines for testicular cancer and HAQ scores. For the total number of medicines, listing one of these medicines was associated with a 2.0 increase in HAQ scores (p = 0.0002) while listing any of the specialist selected medicines was associated with a 4.4 increase in HAQ scores (p = 0.014). This association was lost when the models were adjusted for GDP (see Figure 2).
4. DISCUSSION
Listing essential medicines for Hodgkin's lymphoma (p = 0.0015), testicular cancer (p = 0.0002), and cervical cancer (p = 0.0004) was associated with better disease‐specific avoidable mortality but this relationship was not present for five other examined cancers (NM skin cancer, uterine cancer, breast cancer, colon cancer, and leukemia), or for any of the eight examined cancers when models were adjusted for GDP. These results could be explained by the listed medicines not being available, by aspects of cancer care outside of medicine access, or by limits of the benefits of cancer treatments.
Cancer treatments included in NEMLs are not always available 21 ; therefore, merely listing these medicines will not necessarily have an effect on amenable mortality. Shortages of anticancer medicines listed on NEMLs have been reported in a number of countries. 22 These shortages are not limited to low‐ and middle‐income countries (LMICs) and sometimes affect high‐income countries. 23 In high‐income countries, these shortages have been linked to a lack of financial gains for generic drug manufacturers of inexpensive anticancer medicines, while in LMICs, shortages are caused by poor infrastructures to purchase these medicines. 22 A study in Botswana reported shortages in 50% of drugs listed on the NEML, including cancer medicines. 24 Screening, diagnostics, surgery, and radiation are other factors that affect cancer outcomes.
Several studies have attributed higher survival rates of cancer patients in high‐income countries to greater investments in screening and diagnostic services when compared to low‐income countries. 25 , 26 , 27 , 28 , 29 Cancer treatment efficacy depends on early and accurate diagnosis. 30 Some LMICs lack the ability to determine whether breast cancers are estrogen dependent. 9 , 29 With cervical cancer, treatment outcomes are better with the concomitant use of cisplatin and radiotherapy. 31 Adjuvant treatment modalities may also explain variation in outcomes. The use of cisplatin alone in settings with no radiotherapy centers is likely to have no curative effect on patients with stage 2B cervical cancer. 30 Cancer mortality is related to the availability of radiation. 32 The lack of effective screening, diagnosis and adjuvant treatments could together explain variation in outcomes. 25 , 29 , 33 , 34
There are concerns that some newer cancer treatments provide little benefit in general and, together with our findings, this may indicate that recently developed cancer treatments will not affect global mortality regardless of the clinical effects of these newer treatments. Our findings indicate that there is only a weak link between listing established cancer treatments and avoidable cancer mortality even for older proven medicines, so it would be surprising if listing newer treatments resulted in large benefits. Studies of some newer cancer treatments have a high risk of bias based on study design, conduct, or analysis. 35 Some medicines gain approval by the European Medicines Agency and Food and Drug Administration without any randomized controlled trials demonstrating evidence of the medicine's efficacy and some recently approved cancer medicines gained market access with “conditional marketing authorizations” to treat conditions with unmet medical needs. 36 Any expected benefit of adding newer cancer treatments to NEMLs should be balanced against the financial costs. In 2010 the cost of cancer care was >$124 billion in the United States and is expected to rise by 2020. 37 By 2040, 65% of cancer incidences will occur in LMICs sand 71% of cancer deaths will occur in these regions. 33 Our findings underline the need to attend to all aspects of cancer care including screening and diagnosis.
4.1. Strengths and limitations
We included a large number of countries and tracked disease‐specific avoidable mortality. The main findings did not depend on our classification of medicines. Accuracy of the subcomponents of the HAQ score depends on deaths being classified properly. Medicines listed on NEMLs may be unaffordable and therefore not readily available for use especially in LMICs. 22 , 23 , 24 Screening, diagnostics, surgery, and radiation also influence cancer outcomes and were not the focus of this study. Age standardized mortality rates were used from breast cancer broadly and this may be a limitation. Finally, the most recent NEMLs were obtained for the year of study from the WHO repository, but newer NEMLs may be posted elsewhere. 15
5. CONCLUSION
There was a weak association between listing medicines and avoidable cancer mortality. GDP seems to be a better predictor of avoidable mortality perhaps because cancer depends on non‐medicinal interventions such as screening, early detection, accurate diagnosis, access to surgery, targeted therapy, chemotherapy and radiotherapy, and actual availability of medicines listed. Further studies are required to explore the association of these interventions and health outcome scores.
AUTHOR CONTRIBUTIONS
Oghenefejiro (Theresa) Ikpeni: Conceptualization (equal); data curation (equal); formal analysis (equal); validation (equal); writing – original draft (equal); writing – review and editing (equal). Darshanand Maraj: Conceptualization (equal); data curation (equal); formal analysis (equal); validation (equal); writing – review and editing (equal). Hannah Woods: Data curation (equal); formal analysis (equal); writing – review and editing (equal). Aine Workentin: Data curation (equal); formal analysis (equal); writing – review and editing (equal). Christopher M. Booth: Conceptualization (equal); supervision (equal); writing – review and editing (equal). Nav Persaud: Conceptualization (equal); formal analysis (equal); funding acquisition (equal); methodology (equal); supervision (equal); validation (equal); writing – original draft (equal); writing – review and editing (equal).
FUNDING INFORMATION
The study was supported by funding from the Canadian Institutes of Health Research (CIHR), Ontario SPOR Support Unit, St Michael's Hospital Foundation, and Canada Research Chairs Program. The funders were not involved in the study design; in the collection, analysis and interpretation of the data; in the writing of the report; and in the decision to submit the paper for publication.
CONFLICT OF INTEREST STATEMENT
NP reports grants from the CIHR, the Ontario SPOR Support Unit, the Canada Research Chairs Program and Physicians Services Incorporated during the conduct of the study. OI, DM, HW, AW and CB declare no competing interests.
APPENDIX A.
TABLE A1.
Medicine coverage score a for each cancer per Country.
| Country | Health expenditure (PPP, 2016; $Int'l) | Total country population (2016) | NEML year | Medicine coverage score: NM Skin | Medicine coverage score: uterine | Medicine coverage score: Breast | Medicine coverage score: Hodgkin's | Medicine coverage score: colon | Medicine coverage score: leukemia | Medicine coverage score: cervical | Medicine coverage score: testicular |
|---|---|---|---|---|---|---|---|---|---|---|---|
| Afghanistan | 234 | 34,636,207 | 2014 | 3 | 3 | 4 | 4 | 3 | 5 | 2 | 1 |
| Albania | 592 | 2,876,101 | 2011 | 2 | 3 | 10 | 9 | 2 | 13 | 2 | 1 |
| Algeria | 768 | 40,339,329 | 2016 | 1 | 3 | 10 | 7 | 2 | 16 | 1 | 1 |
| Angola | 193 | 29,154,746 | 2008 | 5 | 5 | 10 | 14 | 6 | 17 | 5 | 4 |
| Antigua and Barbuda | 1020 | 90,564 | 2007 | 1 | 1 | 1 | 3 | 1 | 5 | 1 | 1 |
| Argentina | 1832 | 43,590,368 | 2011 | 5 | 5 | 22 | 25 | 8 | 39 | 6 | 11 |
| Armenia | 1065 | 2,865,835 | 2010 | 4 | 3 | 8 | 16 | 4 | 18 | 4 | 6 |
| Bahrain | 2176 | 1,409,661 | 2015 | 4 | 5 | 23 | 20 | 10 | 40 | 8 | 12 |
| Bangladesh | 95 | 159,784,568 | 2008 | 2 | 1 | 6 | 12 | 2 | 11 | 3 | 3 |
| Barbados | 1066 | 278,649 | 2011 | 4 | 6 | 23 | 21 | 9 | 30 | 6 | 10 |
| Belarus | 1054 | 9,469,379 | 2012 | 6 | 5 | 19 | 20 | 10 | 34 | 5 | 8 |
| Belize | 441 | 367,313 | 2008 | 7 | 7 | 11 | 21 | 7 | 18 | 8 | 7 |
| Bhutan | 353 | 749,761 | 2016 | 4 | 4 | 8 | 12 | 5 | 14 | 4 | 2 |
| Bolivia (Plurinational State of) | 512 | 11,263,015 | 2011 | 6 | 5 | 17 | 19 | 8 | 26 | 7 | 11 |
| Bosnia and Herzegovina | 1209 | 3,480,986 | 2009 | 2 | 2 | 5 | 6 | 2 | 5 | 2 | 2 |
| Botswana | 960 | 2,352,416 | 2012 | 3 | 4 | 9 | 17 | 4 | 23 | 4 | 6 |
| Brazil | 1307 | 206,859,578 | 2014 | 3 | 4 | 9 | 9 | 4 | 15 | 4 | 2 |
| Bulgaria | 1491 | 7,127,822 | 2011 | 1 | 4 | 16 | 6 | 3 | 10 | 2 | 2 |
| Burkina Faso | 113 | 19,275,498 | 2014 | 5 | 5 | 12 | 16 | 6 | 19 | 5 | 6 |
| Burundi | 62 | 10,903,327 | 2012 | 3 | 4 | 4 | 12 | 3 | 10 | 4 | 4 |
| Cambodia | 225 | 15,624,584 | 2003 | 0 | 0 | 0 | 0 | 0 | 1 | 0 | 0 |
| Cameroon | 127 | 23,711,630 | 2010 | 5 | 5 | 18 | 21 | 9 | 27 | 7 | 10 |
| Cape Verde (Cabo Verde) | 306 | 558,394 | 2009 | 5 | 7 | 21 | 24 | 9 | 35 | 9 | 13 |
| Central African Republic | 46 | 4,904,177 | 2009 | 3 | 3 | 6 | 13 | 4 | 13 | 4 | 3 |
| Chad | 85 | 14,592,585 | 2007 | 4 | 4 | 8 | 11 | 4 | 11 | 5 | 5 |
| Chile | 1997 | 18,083,879 | 2005 | 5 | 6 | 16 | 22 | 7 | 35 | 9 | 12 |
| China | 659 | 1,387,790,000 | 2012 | 5 | 4 | 11 | 13 | 6 | 23 | 4 | 7 |
| Colombia | 1040 | 47,625,955 | 2011 | 7 | 7 | 19 | 21 | 9 | 29 | 8 | 8 |
| Congo | 107 | 5,186,824 | 2013 | 5 | 4 | 15 | 17 | 6 | 20 | 6 | 8 |
| Cook Islands | 2007 | 1 | 2 | 3 | 7 | 1 | 7 | 1 | 0 | ||
| Costa Rica | 1402 | 4,945,205 | 2014 | 6 | 6 | 19 | 19 | 11 | 30 | 8 | 13 |
| Côte d'Ivoire (Ivory Coast) | 158 | 24,213,622 | 2014 | 7 | 8 | 27 | 25 | 13 | 36 | 9 | 13 |
| Croatia | 1692 | 4,174,349 | 2010 | 8 | 9 | 33 | 27 | 14 | 47 | 11 | 13 |
| Cuba | 2494 | 11,342,012 | 2012 | 5 | 5 | 22 | 24 | 8 | 39 | 7 | 12 |
| Czechia (Czech Republic) | 2568 | 10,566,332 | 2012 | 9 | 8 | 32 | 24 | 16 | 50 | 11 | 10 |
| Democratic Peoples Republic of Korea (North Korea) | 25,389,611 | 2012 | 4 | 3 | 8 | 8 | 4 | 9 | 4 | 3 | |
| Democratic Republic of Congo | 42 | 81,430,977 | 2010 | 5 | 4 | 15 | 17 | 6 | 20 | 6 | 8 |
| Djibouti | 129 | 1,023,261 | 2007 | 2 | 2 | 2 | 8 | 2 | 8 | 2 | 1 |
| Dominica | 612 | 70,075 | 2007 | 4 | 4 | 9 | 14 | 5 | 17 | 4 | 3 |
| Dominican Republic | 939 | 10,527,592 | 2015 | 4 | 4 | 15 | 19 | 6 | 25 | 7 | 11 |
| Ecuador | 803 | 16,439,585 | 2013 | 8 | 8 | 25 | 22 | 13 | 39 | 10 | 13 |
| Egypt | 600 | 99,784,030 | 2012 | 4 | 4 | 12 | 18 | 5 | 25 | 5 | 9 |
| El Salvador | 619 | 6,250,510 | 2009 | 4 | 3 | 13 | 18 | 5 | 29 | 5 | 9 |
| Eritrea | 60 | 3,365,287 | 2010 | 3 | 3 | 6 | 15 | 4 | 20 | 3 | 3 |
| Estonia | 2030 | 1,315,790 | 2012 | 7 | 6 | 17 | 16 | 7 | 29 | 5 | 4 |
| Ethiopia | 68 | 105,293,228 | 2014 | 7 | 5 | 16 | 23 | 9 | 33 | 7 | 8 |
| Fiji | 414 | 918,371 | 2015 | 5 | 5 | 13 | 18 | 6 | 23 | 6 | 7 |
| Gambia (The Gambia) | 76 | 2,317,206 | 2001 | 2 | 2 | 3 | 4 | 2 | 6 | 2 | 1 |
| Georgia | 955 | 3,727,505 | 2007 | 3 | 3 | 7 | 17 | 4 | 19 | 4 | 6 |
| Ghana | 169 | 29,554,303 | 2010 | 5 | 4 | 13 | 18 | 6 | 24 | 5 | 6 |
| Grenada | 667 | 119,966 | 2007 | 4 | 4 | 9 | 14 | 5 | 17 | 4 | 3 |
| Guinea | 112 | 11,930,985 | 2012 | 2 | 3 | 4 | 10 | 2 | 10 | 3 | 2 |
| Guyana | 454 | 759,087 | 2010 | 5 | 4 | 10 | 14 | 5 | 14 | 5 | 4 |
| Haiti | 148 | 10,713,849 | 2012 | 3 | 3 | 5 | 7 | 4 | 9 | 2 | 1 |
| Honduras | 396 | 9,460,798 | 2009 | 6 | 7 | 26 | 23 | 11 | 37 | 8 | 12 |
| India | 205 | 1,338,636,340 | 2015 | 4 | 3 | 18 | 19 | 9 | 33 | 5 | 9 |
| Indonesia | 317 | 261,850,182 | 2011 | 5 | 5 | 12 | 21 | 6 | 27 | 7 | 10 |
| Iran (Islamic Republic of) | 1201 | 83,306,231 | 2014 | 9 | 10 | 33 | 30 | 15 | 56 | 11 | 13 |
| Iraq | 331 | 38,697,943 | 2010 | 6 | 6 | 22 | 23 | 11 | 37 | 8 | 11 |
| Jamaica | 524 | 2,802,695 | 2012 | 6 | 6 | 17 | 24 | 8 | 31 | 9 | 12 |
| Jordan | 676 | 9,964,656 | 2011 | 6 | 7 | 28 | 22 | 12 | 44 | 9 | 13 |
| Kenya | 187 | 47,894,670 | 2016 | 6 | 6 | 21 | 22 | 10 | 31 | 9 | 13 |
| Kiribati | 206 | 118,513 | 2009 | 4 | 4 | 7 | 9 | 4 | 9 | 4 | 3 |
| Kyrgyzstan | 300 | 6,079,500 | 2009 | 5 | 4 | 15 | 12 | 6 | 19 | 3 | 5 |
| Latvia | 1631 | 1,959,537 | 2012 | 5 | 5 | 27 | 14 | 7 | 23 | 6 | 8 |
| Lebanon | 1225 | 6,258,619 | 2014 | 3 | 3 | 15 | 16 | 5 | 27 | 6 | 7 |
| Lesotho | 263 | 2,143,872 | 2005 | 2 | 1 | 3 | 8 | 3 | 11 | 1 | 1 |
| Liberia | 135 | 4,706,097 | 2011 | 1 | 2 | 4 | 6 | 2 | 8 | 1 | 0 |
| Lithuania | 2038 | 2,868,231 | 2012 | 5 | 4 | 24 | 19 | 7 | 27 | 7 | 9 |
| Madagascar | 84 | 25,501,941 | 2008 | 3 | 3 | 7 | 15 | 4 | 15 | 4 | 4 |
| Malawi | 113 | 17,405,624 | 2015 | 4 | 4 | 12 | 19 | 4 | 19 | 6 | 9 |
| Malaysia | 942 | 31,526,418 | 2014 | 3 | 3 | 11 | 16 | 4 | 23 | 5 | 7 |
| Maldives | 1790 | 454,252 | 2011 | 5 | 4 | 9 | 8 | 6 | 13 | 3 | 3 |
| Mali | 83 | 18,700,106 | 2012 | 4 | 5 | 14 | 18 | 8 | 22 | 7 | 9 |
| Malta | 3599 | 455,356 | 2008 | 5 | 5 | 18 | 21 | 9 | 28 | 7 | 9 |
| Marshall Islands | 532 | 48,329 | 2007 | 3 | 4 | 5 | 7 | 3 | 9 | 3 | 2 |
| Mauritania | 146 | 4,051,890 | 2008 | 2 | 2 | 3 | 6 | 2 | 8 | 2 | 1 |
| Mexico | 1073 | 121,519,221 | 2011 | 9 | 8 | 31 | 26 | 16 | 46 | 10 | 12 |
| Mongolia | 475 | 3,029,555 | 2009 | 4 | 4 | 10 | 18 | 5 | 21 | 6 | 9 |
| Montenegro | 1559 | 622,303 | 2011 | 5 | 4 | 25 | 22 | 11 | 38 | 7 | 11 |
| Morocco | 378 | 35,107,264 | 2012 | 5 | 5 | 13 | 18 | 8 | 24 | 7 | 11 |
| Mozambique | 98 | 27,696,493 | 2016 | 4 | 4 | 9 | 11 | 5 | 14 | 5 | 3 |
| Myanmar | 206 | 51,892,349 | 2010 | 5 | 5 | 11 | 18 | 6 | 20 | 7 | 9 |
| Namibia | 972 | 2,323,352 | 2016 | 6 | 5 | 14 | 21 | 8 | 31 | 7 | 10 |
| Nauru | 1462 | 11,437 | 2010 | 3 | 4 | 5 | 7 | 3 | 7 | 3 | 2 |
| Nepal | 162 | 27,861,186 | 2011 | 3 | 3 | 11 | 16 | 4 | 24 | 5 | 9 |
| Nicaragua | 458 | 6,389,235 | 2011 | 3 | 3 | 8 | 15 | 4 | 22 | 5 | 9 |
| Nigeria | 191 | 188,666,931 | 2010 | 5 | 5 | 9 | 16 | 5 | 16 | 6 | 6 |
| Niue | 2006 | 2 | 3 | 3 | 7 | 2 | 7 | 2 | 1 | ||
| Oman | 1260 | 4,398,070 | 2009 | 7 | 8 | 30 | 26 | 12 | 44 | 10 | 12 |
| Pakistan | 128 | 213,524,840 | 2016 | 4 | 3 | 15 | 18 | 8 | 29 | 6 | 10 |
| Palau | 2189 | 17,816 | 2006 | 3 | 4 | 3 | 9 | 3 | 8 | 3 | 2 |
| Papua New Guinea | 97 | 8,899,169 | 2012 | 4 | 4 | 9 | 16 | 4 | 17 | 5 | 8 |
| Paraguay | 804 | 6,266,615 | 2009 | 4 | 4 | 12 | 16 | 6 | 21 | 6 | 10 |
| Peru | 607 | 31,132,779 | 2012 | 6 | 5 | 21 | 23 | 9 | 38 | 8 | 11 |
| Philippines | 305 | 104,875,266 | 2008 | 7 | 6 | 22 | 23 | 10 | 33 | 8 | 11 |
| Poland | 1851 | 37,970,087 | 2017 | 6 | 7 | 30 | 22 | 13 | 46 | 9 | 11 |
| Portugal | 2965 | 10,325,452 | 2011 | 8 | 8 | 22 | 19 | 9 | 30 | 8 | 7 |
| Republic of Moldova | 631 | 2,803,186 | 2011 | 6 | 5 | 20 | 23 | 11 | 30 | 7 | 12 |
| Romania | 1211 | 19,702,267 | 2012 | 9 | 8 | 32 | 23 | 14 | 48 | 9 | 11 |
| Russian Federation | 1289 | 144,342,397 | 2014 | 4 | 4 | 22 | 22 | 11 | 36 | 6 | 10 |
| Rwanda | 131 | 11,930,899 | 2010 | 4 | 4 | 7 | 11 | 5 | 15 | 4 | 3 |
| Saint Kitts and Nevis | 1404 | 47,788 | 2007 | 4 | 4 | 9 | 15 | 5 | 18 | 4 | 3 |
| Saint Lucia | 702 | 176,413 | 2007 | 4 | 4 | 9 | 15 | 5 | 18 | 4 | 3 |
| Saint Vincent and the Grenadines | 519 | 105,963 | 2010 | 5 | 5 | 11 | 17 | 6 | 19 | 6 | 7 |
| Senegal | 131 | 14,751,356 | 2013 | 6 | 5 | 15 | 18 | 7 | 20 | 7 | 8 |
| Serbia | 1338 | 7,058,322 | 2010 | 6 | 6 | 30 | 19 | 12 | 34 | 8 | 10 |
| Seychelles | 1316 | 94,677 | 2010 | 4 | 3 | 9 | 12 | 5 | 15 | 4 | 3 |
| Slovakia | 2111 | 5,430,798 | 2012 | 8 | 9 | 34 | 27 | 15 | 57 | 11 | 11 |
| Slovenia | 2873 | 2,065,042 | 2017 | 10 | 9 | 33 | 28 | 16 | 50 | 12 | 11 |
| Solomon Islands | 115 | 628,102 | 2017 | 5 | 5 | 10 | 16 | 6 | 21 | 6 | 5 |
| Somalia | 14,292,847 | 2006 | 0 | 0 | 0 | 2 | 0 | 3 | 0 | 0 | |
| South Africa | 1111 | 56,422,274 | 2014 | 1 | 2 | 1 | 4 | 2 | 6 | 2 | 0 |
| Sri Lanka | 476 | 21,203,000 | 2013 | 2 | 4 | 11 | 15 | 5 | 18 | 6 | 10 |
| Sudan | 305 | 39,377,169 | 2014 | 1 | 2 | 4 | 7 | 1 | 9 | 1 | 0 |
| Suriname | 903 | 581,453 | 2014 | 4 | 4 | 9 | 19 | 5 | 22 | 6 | 7 |
| Sweden | 5513 | 9,923,085 | 2016 | 6 | 7 | 12 | 10 | 6 | 11 | 6 | 3 |
| Syrian Arab Republic | 18,964,252 | 2008 | 6 | 8 | 32 | 26 | 11 | 41 | 9 | 12 | |
| Tajikistan | 217 | 8,725,318 | 2009 | 4 | 4 | 9 | 15 | 4 | 20 | 4 | 8 |
| Thailand | 624 | 70,607,037 | 2013 | 7 | 6 | 19 | 20 | 9 | 33 | 7 | 12 |
| The former Yugoslav Republic of Macedonia (North Macedonia) | 962 | 2,072,490 | 2008 | 6 | 6 | 28 | 24 | 9 | 38 | 9 | 12 |
| Timor‐Leste | 216 | 1,224,562 | 2015 | 4 | 4 | 5 | 6 | 5 | 8 | 3 | 2 |
| Togo | 105 | 7,661,354 | 2012 | 4 | 4 | 12 | 15 | 5 | 19 | 5 | 7 |
| Tonga | 313 | 105,707 | 2007 | 3 | 4 | 5 | 8 | 3 | 9 | 3 | 2 |
| Trinidad and Tobago | 1803 | 1,469,330 | 2010 | 7 | 6 | 26 | 24 | 12 | 38 | 8 | 13 |
| Tunisia | 685 | 11,685,667 | 2012 | 4 | 5 | 26 | 20 | 8 | 35 | 5 | 9 |
| Tuvalu | 627 | 10,852 | 2010 | 4 | 4 | 7 | 7 | 4 | 7 | 3 | 2 |
| Uganda | 108 | 38,748,299 | 2012 | 4 | 4 | 12 | 20 | 6 | 26 | 7 | 7 |
| Ukraine | 803 | 45,004,673 | 2009 | 3 | 3 | 7 | 16 | 4 | 17 | 5 | 5 |
| United Republic of Tanzania | 95 | 54,401,802 | 2013 | 6 | 4 | 13 | 16 | 8 | 19 | 5 | 6 |
| Uruguay | 1948 | 3,413,766 | 2011 | 7 | 6 | 28 | 24 | 11 | 45 | 8 | 11 |
| Vanuatu | 86 | 283,218 | 2006 | 3 | 4 | 6 | 8 | 3 | 9 | 3 | 2 |
| Venezuela (Bolivarian Republic of) | 567 | 30,741,464 | 2004 | 5 | 5 | 13 | 21 | 6 | 25 | 7 | 10 |
| Viet Nam | 372 | 93,126,529 | 2008 | 5 | 4 | 19 | 20 | 10 | 31 | 7 | 12 |
| Yemen | 29,274,002 | 2009 | 3 | 3 | 14 | 18 | 4 | 22 | 5 | 8 | |
| Zambia | 152 | 16,767,761 | 2013 | 3 | 3 | 10 | 18 | 4 | 25 | 5 | 8 |
| Zimbabwe | 215 | 14,452,704 | 2011 | 4 | 4 | 11 | 21 | 5 | 28 | 6 | 10 |
Coverage score was calculated by coding the medications associated with each cancer into the GEM database, and then the medications overlapping on these lists and each country's NEML were identified and totaled, resulting in a coverage score per cancer cause.
Cancer medicines selected by oncologist for sensitivity analysis
| Uterine cancer |
| Megestrol |
| Medroxyprogesterone |
| Gestonorone |
| Carboplatin |
| Paclitaxel |
| Testicular cancer |
| Etoposide bleomycin |
| Cisplatin |
| Colon cancer |
| Fluorouracil |
| Capecitabine |
| Oxaliplatin |
| Irinotecan |
| Cervical cancer |
| Cisplatin |
| Carboplatin |
| Hodgkin |
| Dacarbazine |
| Vincristine |
| Doxorubicin |
| Bleomycin |
| Cisplatin |
| Gemcitabione |
| Dexamethasone |
| Leukemia |
| Vitamin A (Retinol) |
| Tretinoin |
| Isotretinoin |
| Any selected glucocorticoid (dexamethasone, methylprednisolone, prednisone, hydrocortisone, cortisone) |
| Cyclophosphamide |
| Chlorambucil |
| Melphalan |
| Mercaptopurine |
| Cladribine |
| Fludarabine |
| Cytarabine |
| Vinblastine |
| Daunorubicin |
| Rituximab |
| Imatinib |
| Dasatinib |
| Nilotinib |
| Asparaginase |
| Pegaspargase |
| Arsenic |
| Methotrexate |
| MESNA |
| Calcium folinate (folinic acid, levoleucovorin, leucovorin) |
| Rasburicase |
| Breast cancer |
| Cyclophosphamide |
| Paclitaxel |
| Docetaxel |
| Doxorubicin |
| Epirubicin |
| Trastuzumab |
| Tamoxifen |
| Anastrozole |
| Letrozole |
| Exemestane |
Ikpeni OT, Maraj D, Woods H, Workentin A, Booth CM, Persaud N. Essential cancer medicines and cancer outcomes: Cross‐sectional study of 124 countries. Cancer Med. 2023;12:20745‐20758. doi: 10.1002/cam4.6642
DATA AVAILABILITY STATEMENT
The data that support the findings of this study are available in the Global Essential Medicines database at https://global.essentialmeds.org/dashboard/countries.
REFERENCES
- 1. Stewart BW, Wild CP. World Cancer Report 2014. [cited 2023 May 23]. https://publications.iarc.fr/Non‐Series‐Publications/World‐Cancer‐Reports/World‐Cancer‐Report‐2014
- 2. Sung H, Ferlay J, Siegel RL, et al. Global cancer statistics 2020: GLOBOCAN estimates of incidence and mortality worldwide for 36 cancers in 185 countries. CA Cancer J Clin. 2021;71(3):209‐249. [DOI] [PubMed] [Google Scholar]
- 3. Fullman N, Yearwood J, Abay SM, et al. Measuring performance on the healthcare access and quality index for 195 countries and territories and selected subnational locations: a systematic analysis from the Global Burden of Disease Study 2016. Lancet. 2018;391(10136):2236‐2271. [DOI] [PMC free article] [PubMed] [Google Scholar]
- 4. World Health Organization . WHO model list of essential medicines, 20th list. 2017. [cited 2023 May 23]. https://www.who.int/publications‐detail‐redirect/eml‐20
- 5. World Health Organization . Essential medicines. [cited 2023 May 23]. https://www.who.int/westernpacific/health‐topics/essential‐medicines
- 6. Jenei K, Aziz Z, Booth C, et al. Cancer medicines on the WHO model list of essential medicines: processes, challenges, and a way forward. Lancet Glob Health. 2022;10(12):e1860‐e1866. [DOI] [PubMed] [Google Scholar]
- 7. Bazargani YT, de Boer A, Schellens JHM, Leufkens HGM, Mantel‐Teeuwisse AK. Selection of oncology medicines in low‐ and middle‐income countries. Ann Oncol. 2014;25(1):270‐276. [DOI] [PubMed] [Google Scholar]
- 8. Richards MA, Stockton D, Babb P, Coleman MP. How many deaths have been avoided through improvements in cancer survival? BMJ. 2000;320(7239):895‐898. [DOI] [PMC free article] [PubMed] [Google Scholar]
- 9. Bazargani YT, de Boer A, Schellens JHM, Leufkens HGM, Mantel‐Teeuwisse AK. Essential medicines for breast cancer in low and middle income countries. BMC Cancer. 2015;15(1):591. [DOI] [PMC free article] [PubMed] [Google Scholar]
- 10. Currie J, Guzman Castillo M, Adekanmbi V, Barr B, O'Flaherty M. Evaluating effects of recent changes in NHS resource allocation policy on inequalities in amenable mortality in England, 2007–2014: time‐series analysis. J Epidemiol Community Health. 2019;73(2):162‐167. [DOI] [PMC free article] [PubMed] [Google Scholar]
- 11. Hone T, Rasella D, Barreto M, Atun R, Majeed A, Millett C. Large reductions in amenable mortality associated with Brazil's primary care expansion and strong health governance. Health Aff (Millwood). 2017;36(1):149‐158. [DOI] [PubMed] [Google Scholar]
- 12. Mackenbach JP, Hu Y, Artnik B, et al. Trends in inequalities in mortality amenable To health care in 17 European countries. Health Aff (Millwood). 2017;36(6):1110‐1118. [DOI] [PubMed] [Google Scholar]
- 13. Tobias M, Yeh LC. How much does health care contribute to health inequality in New Zealand? Aust N Z J Public Health. 2007;31(3):207‐210. [DOI] [PubMed] [Google Scholar]
- 14. Surenjav E, Sovd T, Yoshida Y, Yamamoto E, Reyer JA, Hamajima N. Trends in amenable mortality rate in the Mongolian population, 2007‐2014. Nagoya J Med Sci. 2016;78(1):55‐68. [PMC free article] [PubMed] [Google Scholar]
- 15. Persaud N, Jiang M, Shaikh R, et al. Comparison of essential medicines lists in 137 countries. Bull World Health Organ. 2019;97(6):394‐404C. [DOI] [PMC free article] [PubMed] [Google Scholar]
- 16. EMLs around the world. Global essential medicines. [cited 2023 May 23]. https://global.essentialmeds.org/dashboard/countries
- 17. World Health Organization . WHO package of essential noncommunicable (PEN) disease interventions for primary health care. 2020. [cited 2023 May 23]. https://www.who.int/publications/i/item/9789240009226
- 18. World Health Organization . Tackling NCDs: “Best Buys” and Other Recommended Interventions for the Prevention and Control of Noncommunicable Diseases. World Health Organization; 2017. https://apps.who.int/iris/handle/10665/259232 [Google Scholar]
- 19. World Health Organization . Regional Office for the Eastern Mediterranean. Guidelines for management of breast cancer. 2006. https://apps.who.int/iris/handle/10665/119806
- 20. GDP per capita. World Bank Open Data. [cited 2023 May 23]. https://data.worldbank.org
- 21. Fundytus A, Sengar M, Lombe D, et al. Access to cancer medicines deemed essential by oncologists in 82 countries: an international, cross‐sectional survey. Lancet Oncol. 2021;22(10):1367‐1377. [DOI] [PMC free article] [PubMed] [Google Scholar]
- 22. Becker DJ, Talwar S, Levy BP, et al. Impact of oncology drug shortages on patient therapy: unplanned treatment changes. J Oncol Pract. 2013;9(4):e122‐e128. [DOI] [PMC free article] [PubMed] [Google Scholar]
- 23. Chabner BA. Drug shortages — a critical challenge for the generic‐drug market. N Engl J Med. 2011;365(23):2147‐2149. [DOI] [PubMed] [Google Scholar]
- 24. Martei YM, Chiyapo S, Grover S, et al. Availability of WHO essential medicines for cancer treatment in Botswana. J Glob Oncol. 2018;4:1‐8. [DOI] [PMC free article] [PubMed] [Google Scholar]
- 25. Awadelkarim KD, Mohamedani AA, Barberis M. Role of pathology in sub‐Saharan Africa: an example from Sudan. Pathol Lab Med Int. 2010;2:49‐57. [Google Scholar]
- 26. Agarwal G, Ramakant P, Forgach ERS, et al. Breast cancer care in developing countries. World J Surg. 2009;33(10):2069‐2076. [DOI] [PubMed] [Google Scholar]
- 27. Gakidou E, Nordhagen S, Obermeyer Z. Coverage of cervical cancer screening in 57 countries: low average levels and large inequalities. PLoS Med. 2008;5(6):e132. [DOI] [PMC free article] [PubMed] [Google Scholar]
- 28. Benson VS, Patnick J, Davies AK, et al. Colorectal cancer screening: a comparison of 35 initiatives in 17 countries. Int J Cancer. 2008;122(6):1357‐1367. [DOI] [PubMed] [Google Scholar]
- 29. Adesina A, Chumba D, Nelson AM, et al. Improvement of pathology in sub‐Saharan Africa. Lancet Oncol. 2013;14(4):e152‐e157. [DOI] [PubMed] [Google Scholar]
- 30. Shulman LN, Wagner CM, Barr R, et al. Proposing essential medicines to treat cancer: methodologies, processes, and outcomes. J Clin Oncol. 2016;34(1):69‐75. [DOI] [PMC free article] [PubMed] [Google Scholar]
- 31. Saslow D, Castle PE, Cox JT, et al. American Cancer Society Guideline for human papillomavirus (HPV) vaccine use to prevent cervical cancer and its precursors. CA Cancer J Clin. 2007;57(1):7‐28. [DOI] [PubMed] [Google Scholar]
- 32. Medenwald D, Vordermark D, Dietzel CT. Number of radiotherapy treatment machines in the population and cancer mortality: an ecological study. Clin Epidemiol. 2018;10:1249‐1273. [DOI] [PMC free article] [PubMed] [Google Scholar]
- 33. Baxi SM, Beall R, Yang J, Mackey TK. A multidisciplinary review of the policy, intellectual property rights, and international trade environment for access and affordability to essential cancer medications. Glob Health. 2019;15(1):57. [DOI] [PMC free article] [PubMed] [Google Scholar]
- 34. Robertson J, Barr R, Shulman LN, Forte GB, Magrini N. Essential medicines for cancer: WHO recommendations and national priorities. Bull World Health Organ. 2016;94(10):735‐742. [DOI] [PMC free article] [PubMed] [Google Scholar]
- 35. Naci H, Davis C, Savović J, et al. Design characteristics, risk of bias, and reporting of randomised controlled trials supporting approvals of cancer drugs by European Medicines Agency, 2014‐16: cross sectional analysis. BMJ. 2019;366:l5221. [DOI] [PMC free article] [PubMed] [Google Scholar]
- 36. Hatswell AJ, Baio G, Berlin JA, Irs A, Freemantle N. Regulatory approval of pharmaceuticals without a randomised controlled study: analysis of EMA and FDA approvals 1999–2014. BMJ Open. 2016;6(6):e011666. [DOI] [PMC free article] [PubMed] [Google Scholar]
- 37. Mariotto AB, Robin Yabroff K, Shao Y, Feuer EJ, Brown ML. Projections of the cost of cancer care in the United States: 2010–2020. J Natl Cancer Inst. 2011;103(2):117‐128. [DOI] [PMC free article] [PubMed] [Google Scholar]
Associated Data
This section collects any data citations, data availability statements, or supplementary materials included in this article.
Data Availability Statement
The data that support the findings of this study are available in the Global Essential Medicines database at https://global.essentialmeds.org/dashboard/countries.