

Abstract
Identifying metabolic steps that are specifically required for the survival of cancer cells but dispensable in normal cells remains a challenge1. Here, we report a therapeutic vulnerability in a sugar nucleotide biosynthetic pathway that can be exploited in cancer cells with limited impact on normal cells. A systematic examination of conditionally essential metabolic enzymes revealed that UXS1, a Golgi enzyme that converts one sugar nucleotide (UDP-glucuronic acid; UDPGA) to another (UDP-xylose), is essential only in cells that express high levels of its immediate upstream enzyme UGDH. This conditional relationship exists because UXS1 is required to prevent excess accumulation of UDPGA produced by UGDH. UXS1 functions not only to clear UDPGA, but limits UDPGA production through negative feedback on UGDH. Excess UDPGA disrupts Golgi morphology and function, which impedes the trafficking of surface receptors such as EGFR to the plasma membrane and diminishes cell signaling capacity. UGDH expression is elevated in several cancers, including lung adenocarcinoma, and is further enhanced during chemo-resistant selection. As a result, these cancer cells are selectively dependent on UXS1 for UDPGA detoxification, revealing a potential Achilles’ heel for UGDH-high tumors.
Altered metabolism is a hallmark of cancer and can support cancer functions such as rapid proliferation and survival under various stress states1. Recently, it is emerging that certain metabolic activities play important detoxifying roles by preventing the accumulation of toxic metabolic intermediates2–4. Importantly, a ‘kitchen sink’ model has been observed where a detoxifying enzyme is only required in cells with high metabolic production of the toxic metabolite, much as a drain is only needed when the faucet is turned on5.
Identifying UXS1 as a candidate detoxifier
We wondered whether candidate detoxifying enzymes might be identified on this basis, i.e., whether it is required for cell survival only in the cells where its substrate is produced at high levels (Fig.1a). First, based on the notion that the detoxifying enzyme would be required in some cells but not others, we utilized the DEPMAP database of cancer cell line dependency6 to identify metabolic enzymes with differential essentiality: they are required for the survival of some cancer lines but not others. This was determined by a standard deviation metric (formula: √{Σ(x-x̄)2/(n-1)) based data mining of gene dependency scores for all metabolic genes (determined via CRISPR/Cas9 pooled screen6 across 572 different cancer cell lines across 25 solid tumor lineages (Methods). The selenium detoxifying enzyme ‘SEPHS2’3 was near the top of this list, supporting the notion that detoxifying enzymes can have varying essentiality across lines (Extended Fig.1a).
Figure 1. Identification of UXS1 as an enzyme that is essential for cell survival in a manner that correlates with each cell line’s expression of the upstream enzyme UGDH.
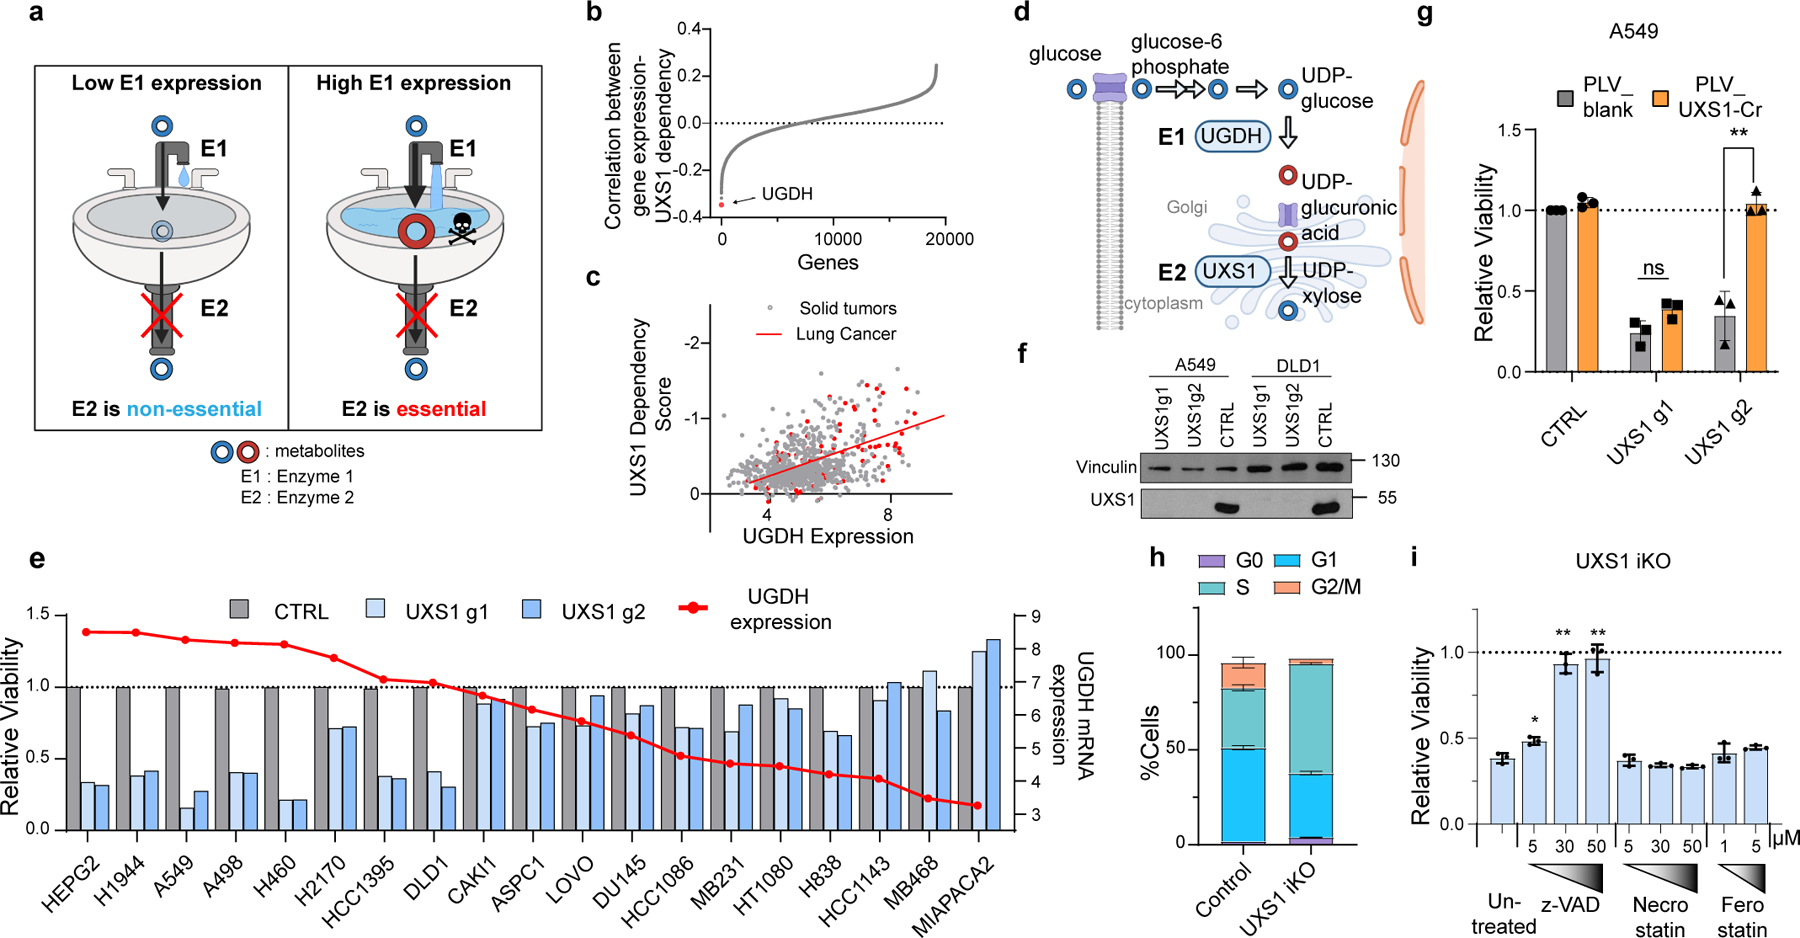
(a) Strategy for identification of toxic metabolite clearing enzymes by finding scenarios where E2 is only essential in cells where E1 is highly expressed, suggesting that E2 is needed to get rid of E1’s product. (b) Correlation between mRNA expression of all genes (17386) with UXS1 dependency across 572 solid tumor cancer cell lines (Methods), showing UGDH as the top hit. (c) Correlation between UXS1 dependency and UGDH mRNA expression [log2(transcripts per million+1)] (Methods) in all 572 cell lines, spearman coefficient =−0.41, R2 = 0.17. The 122 lung cancer cell lines (red) show spearman coefficient = −0.61, R2 = 0.37. (d) Simplified diagram illustrating the metabolic pathway for UDPGA production. (e) Relative viability of various cell lines following lentiviral transduction with CRISPR/Cas9 with guides against UXS1 (light and dark blue bars) or CTRL (gray bars = 1.0) for 10 days (left Y axis). Cells are arranged in decreasing order of UGDH mRNA expression levels [log2(transcripts per million+1), overlaid as red line and dots; right Y axis]. (f) Immunoblots of UXS1 in A549 and DLD1 cell lines 9 days post-transduction. (g) Relative viability of A549 cells either overexpressing blank vector or g2-resistant UXS1 then subjected to UXS1 KO with g1 or g2 (n=3 per group) (CTRL = 1.0). (h) Cell cycle distribution in dox-inducible UXS1 iKO A549 cells, with (n=3) or without (n=3) induction for 5 days. (i) Relative viability of UXS1 iKO cells subjected to KO then treated with z-vad, Necrostain, or Ferrostatin at the indicated concentrations (n=3 per group) (Untreated = 1.0). Data are shown as mean ± s.d. Two-tailed unpaired Student’s t-test (g, i). P values from left to right in g: p=0.227, p=0.0001, i: p=0.011, p=0.001, p=0.003 (n.s. not significant (p>0.05) **p<0.01, ****p<0.0001). a and d were created using Biorender (https://biorender.com/).
Following the kitchen sink model, we wondered whether these enzymes’ essentiality (as determined in the Cancer Dependency Map7 in each cell line) correlates with the expression level of an upstream enzyme(s) producing the putatively toxic metabolite. Indeed, we found that for one of these variably essential enzymes, UXS1 (Extended Data Fig.1b), the immediate upstream enzyme UGDH was the gene whose expression correlated the most with whether a cell required UXS1 or not (Fig.1b, c, d). This raised the possibility that the product of UGDH - UDP-glucuronic acid (UDPGA) - is a toxic metabolite so that only the cells expressing high UGDH and thus producing high UDPGA would be dependent on UXS1 for detoxification.
To confirm the UGDH expression-dependent requirement of UXS1 suggested by our data mining, we lentivirally transduced CRISPR-Cas9 knock-out (KO) of UXS1 in 19 cancer cell lines of different tissue origin with varying levels of UGDH mRNA expression. Loss of UXS1 was detrimental only to cell lines expressing high UGDH (Fig.1e, f, Extended Fig.1c). Furthermore, in these sensitive lines, which included the lung adenocarcinoma line A549 and the colorectal adenocarcinoma line DLD1, overexpression of UXS1 with CRISPR-resistant silent mutations against UXS1-g2 fully rescued against the toxicity from UXS1-g2 but not from UXS1-g1, verifying that the toxicity from UXS1 KO is on-target (Fig.1g, Extended Data Fig.1d–g). We generated a UXS1 doxycycline(dox)-inducible KO (iKO) line (Extended Data Fig.1h, i) which revealed that UXS1 loss leads to cell cycle defects and cell death consistent with apoptosis (Fig.1h, i, Extended Data Fig.2a–d). Thus, UXS1 disruption selectively kills only those cancer cells with high expression levels of UGDH.
UXS1 prevents toxic UDPGA accumulation
We considered two potential mechanisms for UXS1 toxicity: 1) that accumulation of its substrate may be toxic, as suggested by the kitchen sink model, or 2) that loss of downstream product may be detrimental. To this end, we considered the known biological functions of this pathway. UGDH produces the sugar nucleotide UDP-glucuronic acid (UDPGA), the substrate of UXS18. UDPGA is used in glycosylation reactions which add glucuronic acid to proteoglycans and glycoproteins in the Golgi apparatus9. It is also a key substrate for reactions performed by UDP-glucuronosyltransferases (UGTs) to conjugate glucuronic acid to xenobiotics (such as chemotherapeutic compounds), aiding in their deactivation and secretion, a process referred to as ‘glucuronidation’10. UXS1 converts UDPGA to UDP-xylose, another sugar nucleotide precursor for glycosylation used in proteoglycans (Fig.1d)9,11. Thus, excessive UDPGA could introduce aberrant changes in the Golgi or the glucuronidation system; alternatively, the loss of xylose sugar modifications could be detrimental to cells.
To determine whether overabundance of UDPGA or loss of xylose modifications is the cause for toxicity, we first measured intracellular levels of UDPGA by LC-MS following UXS1 ablation. As expected, UXS1 disruption, but not UGDH loss, caused about 70-fold accumulation of UDPGA in a time-dependent manner, while several other UDP-sugars were not substantially impacted (Fig.2a). Using U-13C glucose labeling, we confirmed that UXS1 KO resulted in the complete ablation of UDP-xylose formation (Fig 2b, c). Next, to test the kitchen-sink model (Fig.2d), we disrupted UGDH to prevent UDPGA production (Fig.2e), which completely protected both A549 and DLD1 cells against the toxic effects of UXS1 loss (Fig.2f, g, Extended Data Fig.3a, b). Similarly, 4MU, a drug that depletes UDPGA by consuming it for 4MU glucuronidation12–14, also rescued these cells from UXS1 loss toxicity (Fig.2h). We examined cell lines expressing low, medium, or high UGDH levels (CAKI1/ASPC1/A549) and found corresponding increasing degrees of UDPGA accumulation following UXS1 KO, which correlated with increasing toxicity (Extended Data Fig.3c, Fig.1e). Glucose is an upstream input for UDPGA biosynthesis, and we find that glucose levels directly modulate sensitivity to UXS1 KO, further supporting UDPGA accumulation as the culprit for toxicity (Extended Data Fig.3d). Directly treating UDPGA can also induce toxicity but at high concentrations, likely due to its low cell permeability (Extended Data Fig.3e). Finally, we are able to sensitize otherwise insensitive, low UGDH expressing cells to UXS1 loss toxicity by overexpressing UGDH (Fig.2i, j, Extended Data Fig.3f, g). Taken together, along with the ‘kitchen sink’ rescue, we provide multiple lines of evidence that cells expressing high UGDH depend on UXS1 expressly to prevent the toxic overaccumulation of UDPGA.
Figure 2. UXS1 is required to detoxify the UDP-glucuronic acid produced by UGDH.
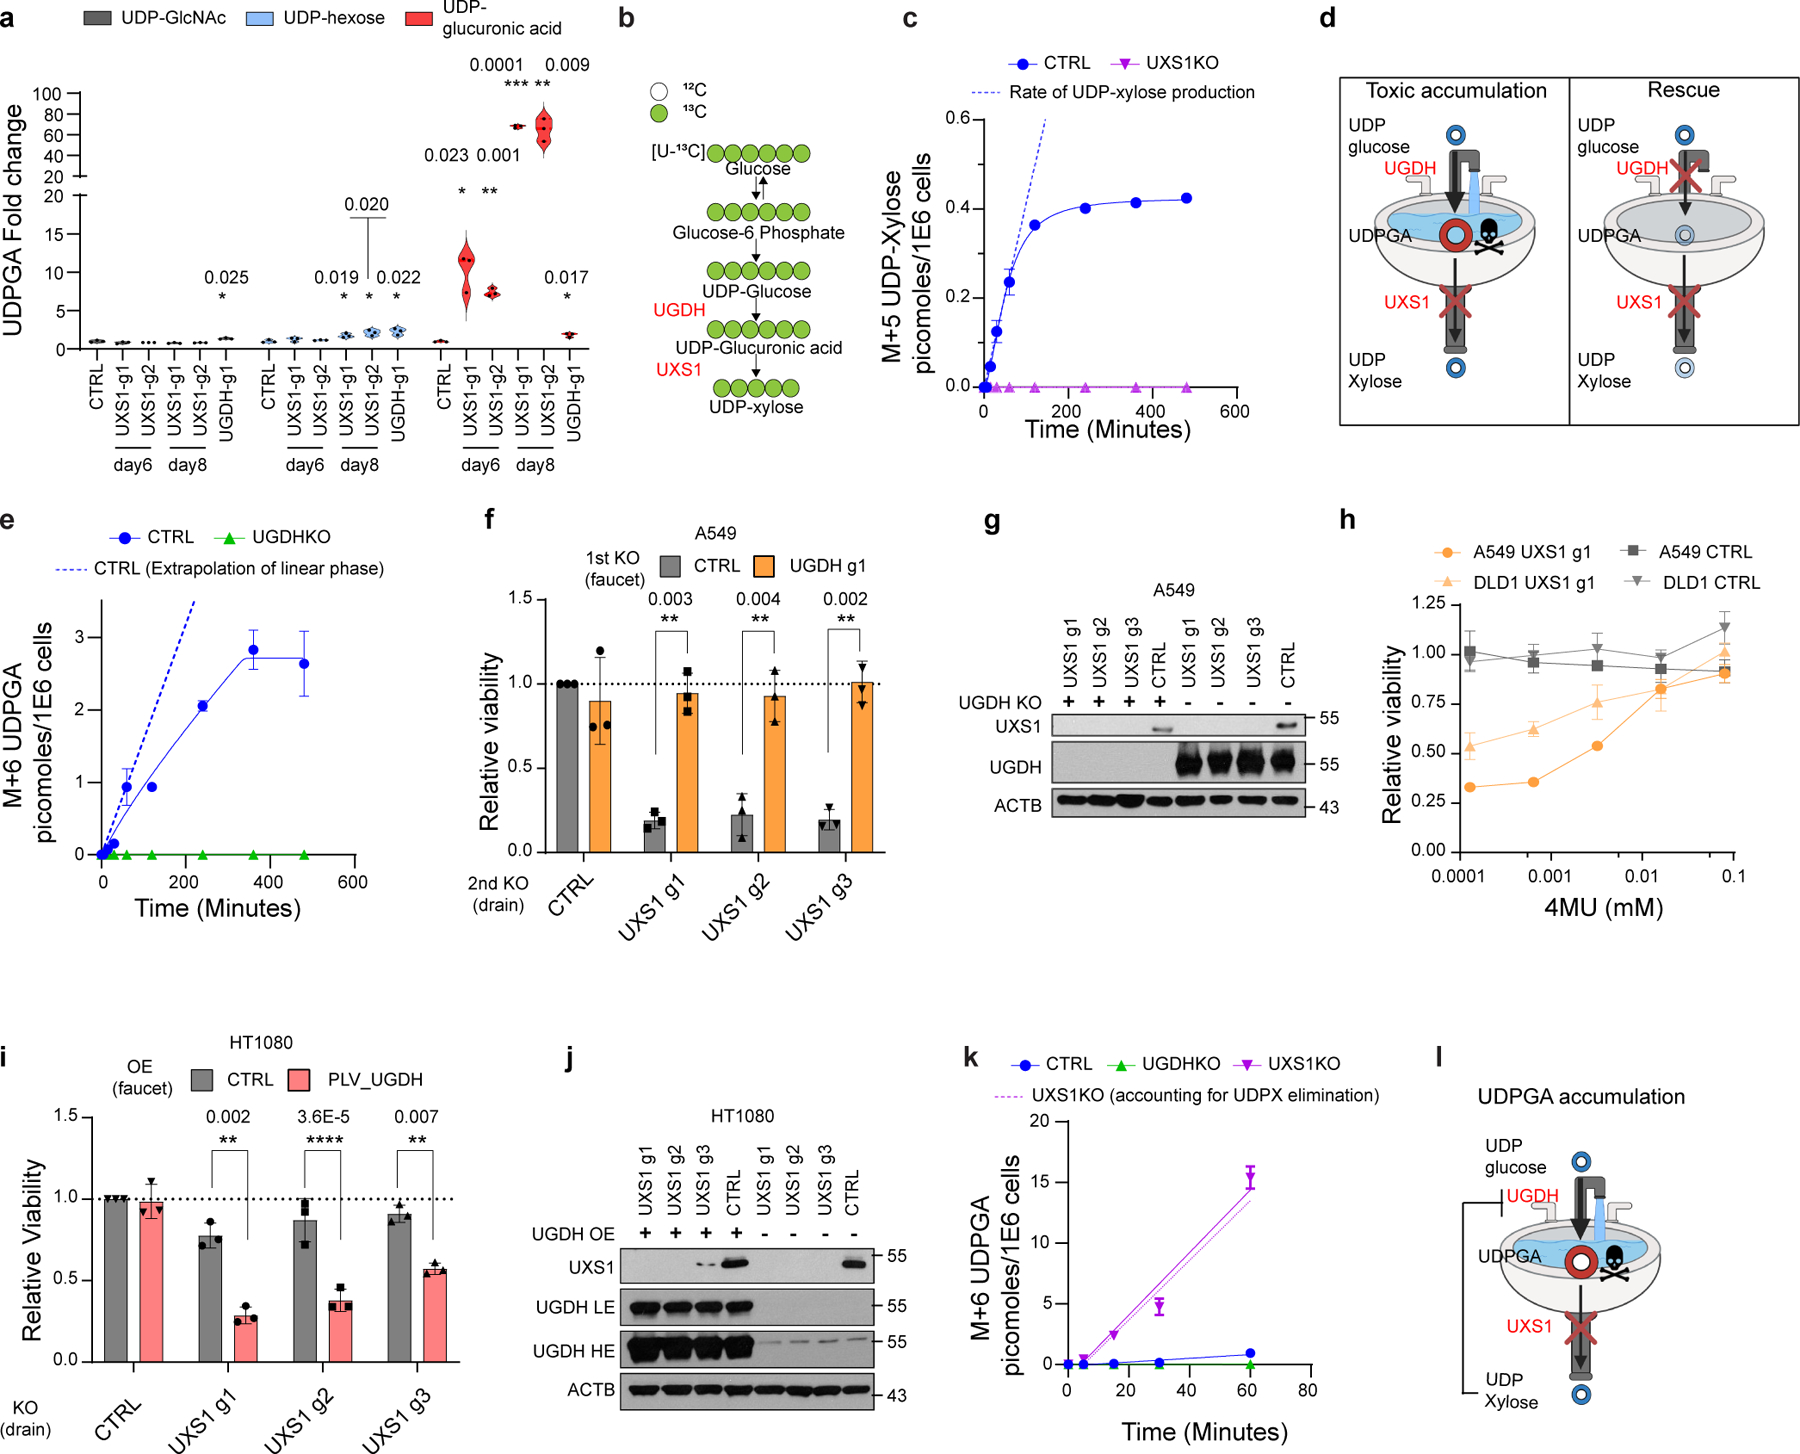
(a) LC-MS quantification of UDP sugars in A549 cells subjected to CTRL or UXS1 KO at 6 and 8 days of transduction (n=3 per group). UDP-hexose includes UDP-glucose/mannose/galactose, which cannot be resolved due to similar MS2 spectra. (b) Schematic of U-13C glucose labeling to trace UDPGA and UDP-xylose labeling. (c) M+5 UDP-xylose production in A549 cells (n=3 per group). (d) Toxic-metabolite accumulation model: cancer cells expressing high UGDH have toxic accumulation of UDPGA when UXS1 (drain) is removed. Preemptive UGDH KO should prevent UDPGA accumulation and UXS1 KO toxicity. (e) M+6 UDPGA production in A549 cells. (f) Viability following preemptive CTRL (gray) or UGDH (faucet; orange) KO, followed by CTRL or UXS1 (drain) KO, relative to cells subjected to CTRL KO then CTRL KO (=1.0) (n=3 per group). (g) Immunoblots from the KO combinations shown in c. (h) Viability of A549 and DLD1 cells with CTRL KO (gray) and UXS1 KO (orange), treated with 4MU (48 hours), relative to vehicle treated CTRL KO cells (=1.0) (n=3 per group). (i) Viability of HT1080 cells overexpressing blank vector (gray) or UGDH (red) then subjected to CTRL or UXS1 KO, relative to blank vector overexpressing, CTRL KO cells (=1.0) (n=3 per group). (j) Immunoblots from the OE/KO combinations shown in g; LE: low exposure, HE: high exposure. (k) M+6 UDPGA production in A549 cells (n=3 per group). Dotted purple line indicates UDPGA labeling in UXS1 KO cells, minus normal UDP-xylose production rate calculated from panel c, representing UDPGA production not accounted for by loss of clearance via UXS1. (l) Refined model depicting the negative feedback loop between UDP-xylose and UGDH. Data from c, e, and k are from the same experimental sets. Data are mean ± s.d. Two-tailed unpaired Student’s t-test (a, f, h, i). b was created using Biorender (https://biorender.com/).
To further investigate the potential impacts of losing UDP-xylose production upon UXS1 KO, we examined sulfated glycosaminoglycans, glycosylation moieties on proteoglycans which require xylose as well as glucuronic acid residues for their production15. UXS1 KO cells had decreased levels of total sulfated GAGs, indicating a consequence of loss of UDP-xylose production (Extended Data Fig.4a, b). Also as expected, UGDH KO or UGDH/UXS1 double KO also resulted in a similar degree of loss of sulfated GAGs. As the latter two conditions are nontoxic, this supported that loss of sulfated GAGs are not responsible for the toxicity of UXS1 KO. We additionally examined hyaluronic acids, the predominant non-sulfated proteoglycans, which require glucuronic acid but not xylose residues in their production15. UGDH KO or UGDH/UXS1 double KO, the two conditions that preclude UDPGA production, resulted in loss of HAs, whereas UXS1 KO, which loses UDP-xylose but gains UDPGA, did not result in significant changes (Extended Data Fig.4c, d). This argued against changes in HAs mediating the toxicity of UXS1 loss. However, we cannot rule out that changes to proteoglycans caused by UXS1 loss could impact other aspects of tumor biology, which future efforts should explore (Supplemental Discussion). Proteoglycans are key components of the extracellular matrix that interact with cell surface proteins and their dysregulation may impact various aspects such as cell adhesion and migration, and cancer cell stemness16,17.
Intriguingly, in UXS1 KO cells, along with a loss of UDP-xylose production, the rate of production of UDPGA was dramatically increased, implying increased activity of UGDH (Fig.2k, Extended Data Fig.3h–l). This is in line with previous reports that indicate that UDP-xylose can allosterically inhibit UGDH as a negative feedback loop18–20 . Thus, these results support the model that the observed accumulation of UDPGA in UXS1 KO cells is the combination of lost clearance of UDPGA by UXS1 and higher activity of UGDH (Fig.2l). This explains why loss of UXS1, which turns over UDPGA at a relatively low rate (Fig.2c), results in such a massive increase in UDPGA (Fig.2a).
Excess UDPGA disrupts Golgi function
To try to understand why UDPGA accumulation upon UXS1 loss may be toxic to cells, we performed next-generation sequencing of mRNA from cancer cells subjected to UXS1 KO. Gene set enrichment analysis indicated an induction of various Golgi function-related genes, and a depletion of cell cycle and DNA repair/damage response genes following UXS1 KO in cancer cells (Fig.3a, Extended Data Fig.5i, j). Looking closely at the Golgi-related genes, we observed induction of various Golgi posttranslational modification genes such as N-linked glycosyltransferases and Golgi trafficking genes such as COP-I vesicular transport genes. Included in the signature was ARF4, a known Golgi stress response gene21,22, and we verified that ARF4 protein levels are induced upon UXS1 KO (Extended Data Fig.5a).
Figure 3. UDPGA accumulation causes golgi dysfunction that leads to EGFR inactivation.
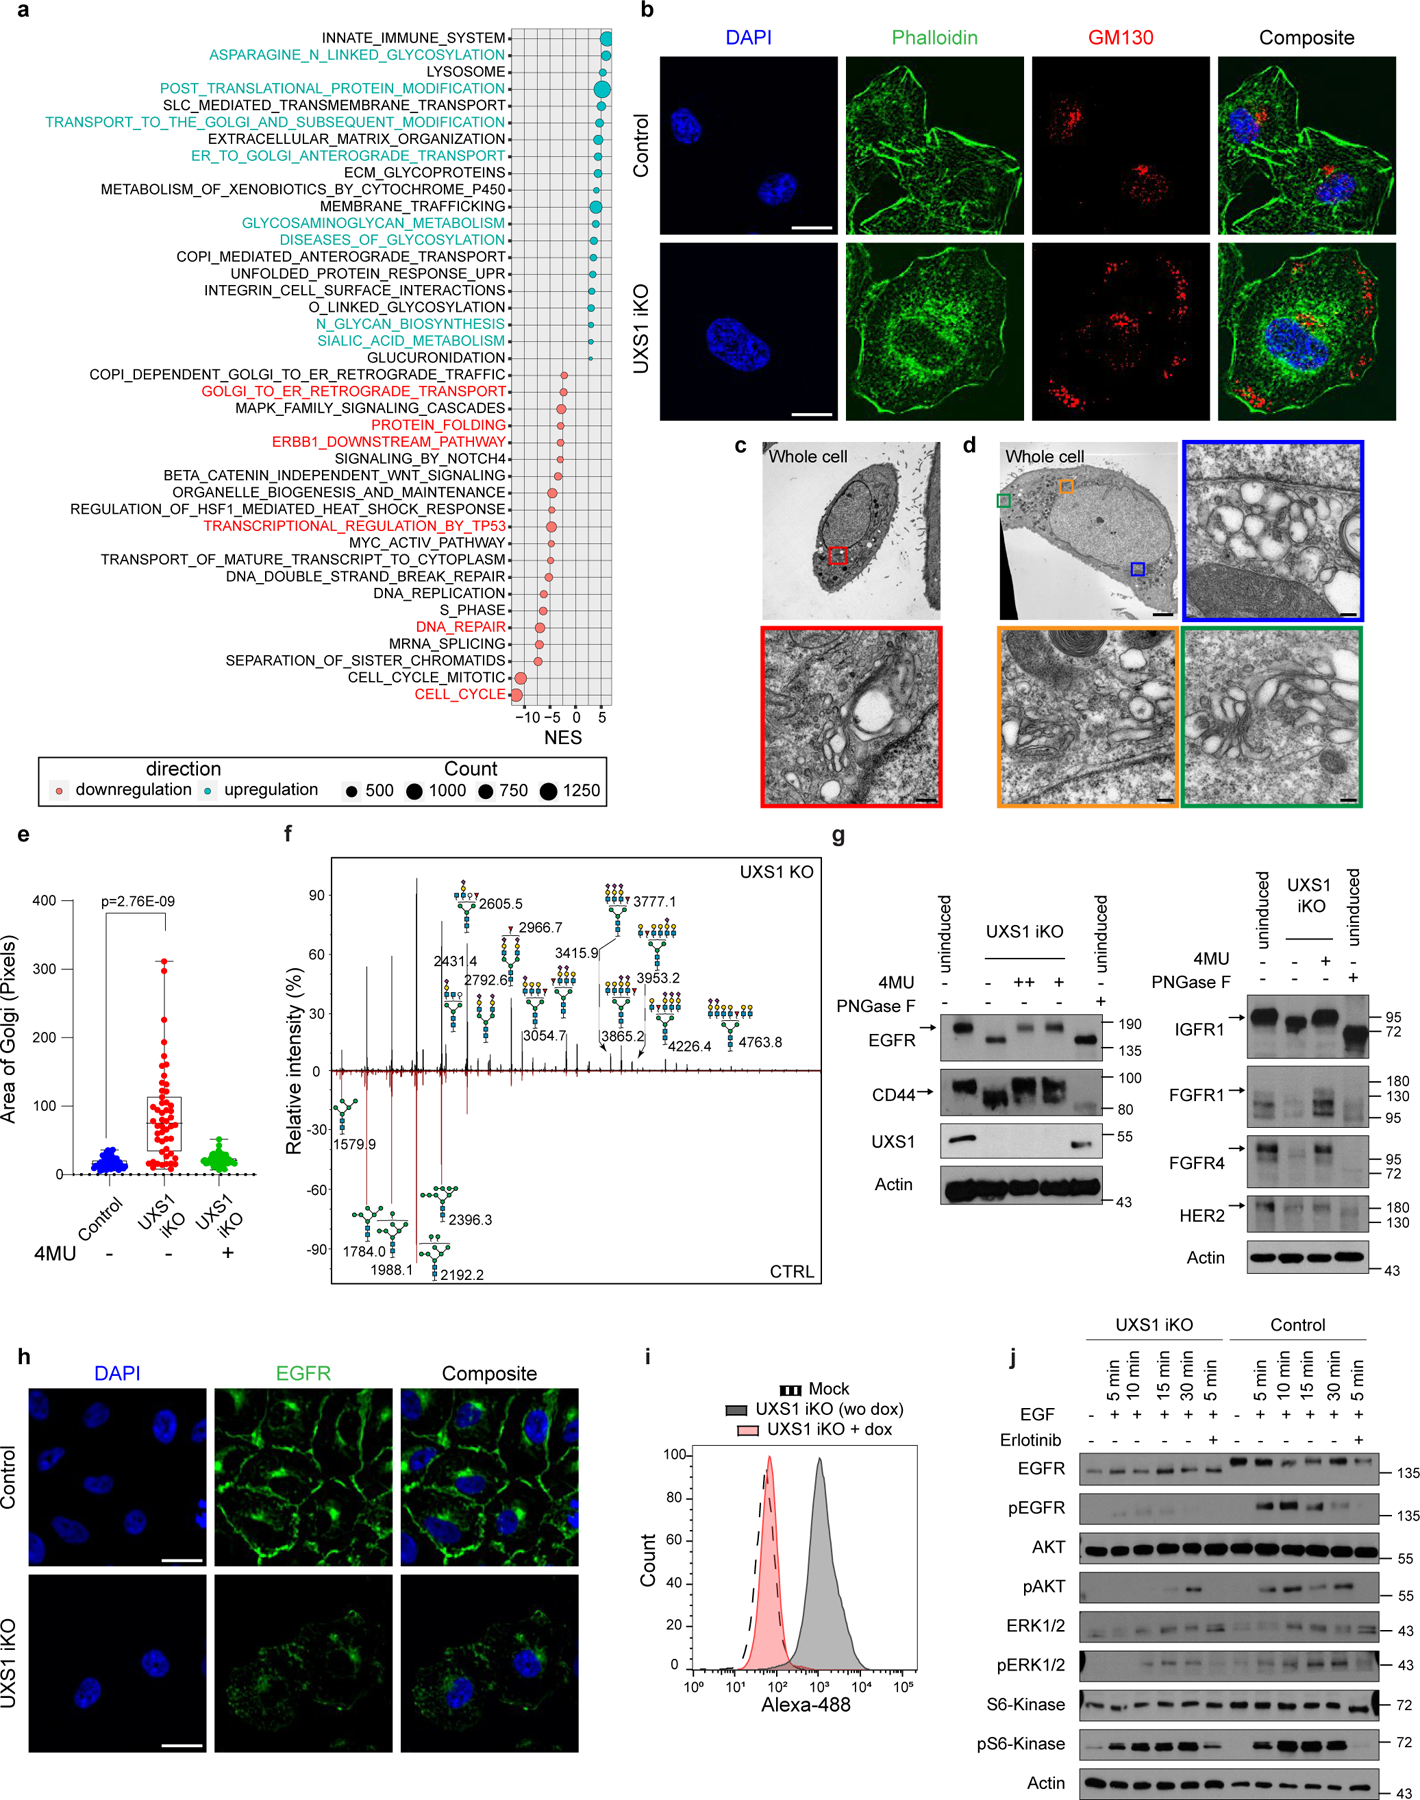
(a) Bubble plot showing differentially expressed pathways between CTRL vs UXS1 KO A549 cells, identified by GSEA pathway analysis of RNAseq data. (b) Immunofluorescent images of UXS1 iKO or control iKO A549 cells, 7 days post-induction, stained for Phalloidin (actin, green), GM130 (Golgi, red), and DAPI (nucleus, blue); scale bar=20µm. (c) Representative transmission electron microscope images of A549 control and (d) UXS1 KO cells. The colored boxes in the whole cell images indicate where golgi structures are found, with accompanying zoomed images (corresponding colored outline). Scale bar: Whole cell images=5µm, zoomed images=0.2µm. (e) Dot plot of total Golgi area per cell, labeled using GM130, from control, induced, and induced + 4MU (15 µM) UXS1 iKO cells, 7 days post-induction, n=50 cells per condition. Box plot indicates median (centre line) with interquartile range of 25% to 75%. ****p=2.76E-9 (unpaired Student’s t-test). (f) Representative mass spectrometry N-glycan profiles of A549 cells subjected to CTRL or UXS1 KO, at 7 post-transduction, with annotated mass peaks. Values are relative to the total N glycans detected. (g) Immunoblots for various surface glycoproteins in uninduced, induced, or induced plus 4MU UXS1 iKO cells. + indicates 15µM and ++ indicates 80µM 4MU. (h) Immunofluorescent images of uninduced or induced UXS1 iKO cells, stained for EGFR (green) and DAPI (blue). Scale bar = 40µm. (i) FACS-based fluorescence histogram of induced and non-induced UXS1 iKO cells labeled with FITC conjugated EGFR antibody. (j) Immunobloting of EGFR and downstream signaling components from induced UXS1 iKO cells or induced CTRL iKO cells, following serum starvation then EGF stimulation. pAkt = phospho (S473) Akt; pERK1/2 = phospho ERK1/2(T202/Y204); pS6-kinase = phospho-S6 kinase(T389) phosphoantibodies. EGFR blotting was run on 4–15% gradient gel to show maximal shift of the protein.
Overall, this transcriptional response suggested that the toxicity of UXS1 loss/UDPGA accumulation specifically involves the Golgi, which was congruent with UDPGA being a glycosylation precursor and UXS1 being a Golgi resident enzyme. Surprisingly, the loss of UXS1 dramatically altered the morphology of the Golgi apparatus. Instead of being confined to a single region, loss of UXS1 resulted in an aberrant dispersal of the cis-, trans-, and medial components of the Golgi apparatus to multiple regions throughout the cell body, as indicated by immunolabeling and verified by electron microscopy (Fig.3b–d, Extended Data Fig.6a–d). Meanwhile, the endoplasmic reticulum (ER) appeared intact, and cells did not show signs of ER stress (Extended Data Fig.6e–g). Importantly, the UDPGA-depleting 4MU or preemptive UGDH KO rescued the normal Golgi morphology in UXS1 KO cells, demonstrating that the Golgi transformation occurred due to UDPGA accumulation (Fig.3e, Extended Data Fig.6h). To determine whether UXS1 KO alters Golgi glycosylation processes, we analyzed the N-linked (Fig. 3f) and O-linked (Extended Data Fig.5f) glycosylation profiles of A549 cells upon UXS1 loss. While these analyses show relative abundances of each species and thus do not inform of gross intracellular glycosylation level of each condition, they demonstrate that there are overall changes in glycosylation patterns upon UXS1 loss. While the relative abundance of oligomannose and paucimannose glycans decreased, sialylated and rare complex glycans with poly lac-nac extensions increased upon UXS1 loss (Extended Data Fig.5b–e). These results indicate that the accumulation of UDPGA following the loss of UXS1 alters both the structure and function of the Golgi apparatus. Interestingly, the majority of UDPGA accumulation occurs in the cytosol (Extended Data Fig.7c, d), and overexpression the Golgi UDPGA transporter SLC35D123 does not impact UXS1 KO toxicity (Extended Data Fig.7a, b), suggesting that excess UDPGA impacts the Golgi from the cytosolic side.
The Golgi apparatus is the gateway for the terminal glycomodifications and trafficking for cell surface proteins such as growth factor receptors and other surface markers that play essential roles in cancer biology24,25. Therefore, we examined whether cell surface proteins have changes in mobility which are commonly associated with glycosylation defects26–28. We examined various cell surface receptors (EGFR, CD44, FGFR1, FGFR4, IGF1R) which are key upstream components of signaling cascades29–32. We found that loss of UXS1 caused increased gel migration in all of these receptors, suggesting their defective glycosylation26–28, as is seen by treating cells with the glycosidase PNGase26 (Fig.3g). In most cases protein levels were also significantly decreased, which may be due to degradation, misfolding and/or decreased stability known to occur for mis-glycosylated proteins33–35. These results suggested that the Golgi dysfunction caused by UXS1 loss has a far-reaching consequence of preventing the proper maturation of essential cell surface glycoproteins.
Among these, EGFR is an upstream oncogenic signaling component that is required for the proliferation and survival of cancers such as Non-Small Cell Lung Carcinoma (NSCLC) and glioblastoma32, and our RNA sequencing of UXS1 KO cells suggested a profile of impaired EGFR signaling (Extended Data Fig.5i, j). Therefore, we looked more closely at EGFR as an example surface protein that is impaired due to UDPGA-induced Golgi dysfunction. Immunolabeling of EGFR strikingly showed that it is absent at the plasma membrane following KO of UXS1, with decreased overall levels (Fig.3h, i, Extended Data Fig.6i–k). We next examined the ability of UXS1 iKO cells to respond to EGF mitogen. Cells lacking UXS1 could not properly respond to EGF, not undergoing autophosphorylation of EGF, which is the canonical initial step in the EGFR signaling cascade (Fig.3j). Furthermore, the cells lacked the characteristic phosphorylation of Akt and ERK, which is a standard downstream manifestation of EGFR activation. While these results demonstrate effects on EGFR and its downstream signaling, the general effects of UXS1 KO across cell various surface receptors (Fig.3g) suggest that cancer cells have in effect been ‘silenced’ in their ability to respond to various extracellular cues. Thus, while EGFR loss is likely to be highly detrimental to the cancer cells, it is unlikely to be the sole culprit, and we propose that death may occur from a global deregulation of cell surface proteins.
We also considered the downregulation of cell cycle genes that were observed in the RNA-SEQ. Golgi fragmentation occurs during mitosis, thus a mitotic block could indirectly account for the golgi-related pathologies that we observed. However, propidium iodide based fluorescence-activated cell sorting (FACS) cell cycle analyses of UXS1 iKO cells indicate that the S phase population is increased while G2 population (which includes M phase cells) is decreased (Extended Fig.2b, c). We did not observe any accumulation of M phase as marked by phospho-Histone-H3 (Extended Data Fig.5g). We find that serum starvation- induced block of cell cycle progression block does not enhance and instead slightly decreases Golgi dispersion upon UXS1 iKO (Extended Data Fig.5h). Overall, it is unlikely that UXS1 KO causes the Golgi dispersion phenotype via cell cycle defects. Rather, the downregulation of various cell cycle genes may be a consequence of the ‘silencing’ of mitogenic surface receptors such as EGFR, which can drive cell cycle progression32.
UXS1 as a cancer-selective target
We next set out to examine the consequences of UXS1 loss in the in vivo context of a tumor. To examine effects of disruption of UXS1 in an already formed tumor, we utilized dox-inducible UXS1 KO in three subcutaneous xenograft models (A549 and H460, both UGDH-high, non-small cell lung cancer lines; and HT1080, a UGDH-low fibrosarcoma line), where dox was administered on timepoints where average tumor sizes were at least 200mm3 (Extended Data Fig.8a–c). For both UGDH-high lines, induction of UXS1 loss resulted in a significant stunting of tumor growth (and regression in H460), and extended median survival by 27 days for A549, and 50 days for H460 (Fig. 4a, b, d and, e, Extended Data Fig.8e, f). We observed ~40-fold accumulation of UDPGA (Extended Data Fig.8h) and induction of ARF4, a Golgi stress marker (Extended Data Fig.8i) in A549 iKO tumors. On the other hand, despite efficient induced KO (Extended Data Fig.8d, g), UXS1 loss in the UGDH-low HT1080 tumors had no effect on tumor growth and overall survival (Fig.4c, f). Collectively, these experiments demonstrate a therapeutic potential for targeting UXS1 that depends on the high-UGDH status of the tumor.
Figure 4. UXS1 is a cancer-selective therapeutic target due to elevated UGDH expression in cancer subsets and chemo-resistant cancer cells.
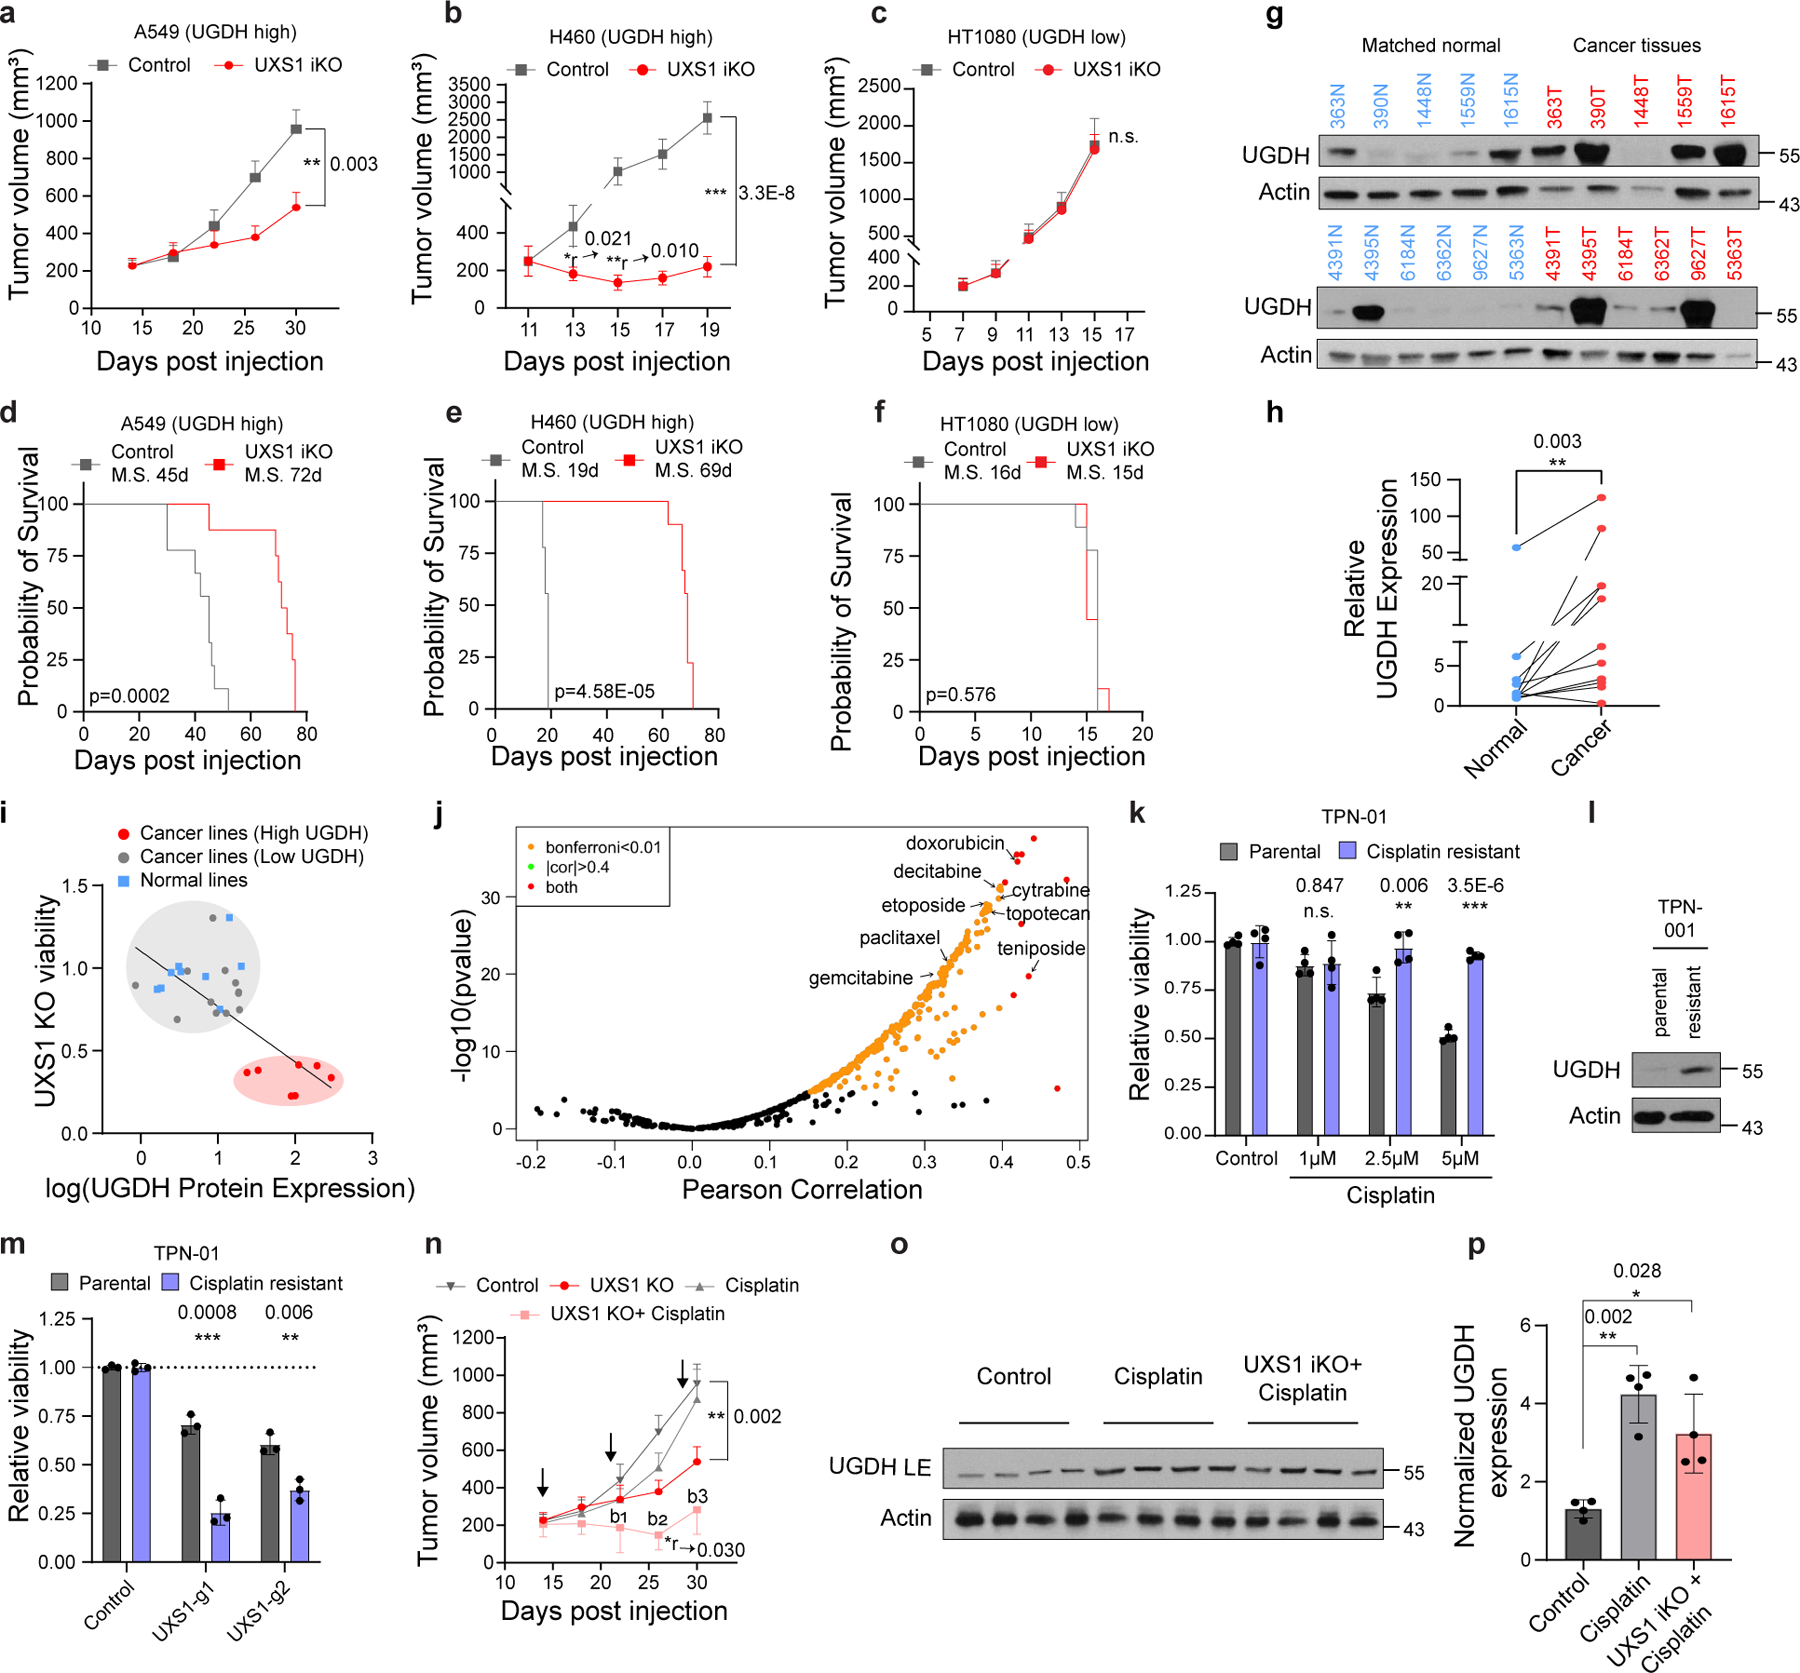
(a) Mean volumes (±s.e.m.) of A549, (b) H460, and (c) HT1080 subcutaneous xenograft tumors, UXS1 iKO induced when mean tumor volume reached 200–250mm3 (red, n=12 per line except n=11 for A549) or left uninduced (gray, n=12 per line) (Methods). (d-f) Kaplan-Meier survival analysis for the groups shown in a-c (M.S. = median survival). (g) Immunoblots from patient lung cancer tissues (n=11, red) and patient-matched normal lung tissues (n=11, blue). (h) Actin normalized quantification of UGDH from g (n=11 per group). (i) Scatter plot of viability following UXS1 KO against UGDH protein expression level for 19 cancer and 9 normal cell lines (Supplementary file). UGDH immunoblots are shown in Extended data Fig. 6c. Linear regression line is shown for all cancer lines. (j) Volcano plot showing spearman correlation between UGDH expression and drug sensitivity AUC (546 drugs), mined from CCLE gene expression database7 and PRISM database48. (k) Viability of parental (n=3) and cisplatin-resistant version (Methods) (n=3) of PDO line TPN-01 following cisplatin treatment (4 weeks), relative to untreated (=1.0). (l) Immunoblots from parental and chemo-resistant TPN-01. (m) Viability of parental (n=3) and cisplatin-resistant (n=3) TPN-01 subjected to UXS1 KO (7 days), relative to parental CTRL-KO (=1.0). (n) Mean volumes (±s.e.m.) from experiment a, showing additional cisplatin treated (3x, black arrows; Methods) arms. Bliss independence scores (Methods; <1 indicates synergism) for UXS1+cisplatin arm; b1=0.66, b2=0.47, b3=0.57. (o) Immunoblot from four randomly selected tumors from each indicated A549 group. (p) Actin normalized quantification of UGDH (n=4 per group) from o showing mean (±s.d.). a-c, k, m, n, p, Two-tailed unpaired Student’s t-test. *r and **r denotes significant regression compared to starting tumor volume. h, Wilcoxon matched-pairs signed rank test. d-f, Mantel–Cox test for survival.
For UXS1 to be an ideal cancer target, it should demonstrate cancer cell-selective toxicity. Recently, UGDH itself was examined in cancer contexts: it was elevated in some subtypes of lung and breast cancers which correlated with poor prognosis36–38, suggesting UGDH as a cancer target39,40. In our kitchen sink model (Fig.2), UGDH is not a cancer target per se but a biomarker and functional determinant for which cells will require UDPGA detoxification via UXS1. Importantly, comparing tumors and adjacent normal tissues, we observed that UGDH is elevated in lung and breast cancers compared to normal tissues, suggesting that UXS1 targeting would hurt cancer cells but not normal cells (Fig.4g, h, Extended Data Fig.9a, b). RNA-SEQ database comparison of UGDH transcript abundance across tumor types and normal organs also indicates that UGDH may be elevated in multiple tumors relative to normal tissues (Extended Data Fig.9c). The variability of UGDH expression across the solid tumor lines (Fig.1c) and tumors (Extended Data Fig.9c) suggest that the applicability of targeting UXS1 may depend both on the cancer type and on a patient-by-patient basis (Supplemental Discussion). We confirmed overall low protein levels of UGDH expression across various patient normal liver, kidney, and colon tissues, suggesting that targeting UXS1 would not cause toxic UDPGA accumulation in organs (Extended Data Fig.9f). Finally, we compared UGDH expression and UXS1 essentiality across a panel of noncancer (primary or immortalized) cells. Normal cells express lower levels of the ‘faucet’ UGDH than the UXS1 KO sensitive cancer cells, and they are also insensitive to the KO of UXS1 as predicted (Fig.4i, Extended Data Fig.9d, e and 1j). Collectively, these findings suggest a therapeutic window for UXS1 targeting, and we note that partial loss of UXS1 via RNAi is still effective (Extended Data Fig.10j–l). Nonetheless, UXS1 KO mice are embryonic lethal41, which may indicate importance for UXS1 detoxification or downstream proteoglycan function (UDP-xylose) in a developmental and/or organismal context (Supplemental Discussion). Thus, as some important normal cells may depend on UXS1, examination of patient toxicity will be an important concern in future therapies targeting UXS1.
We wondered why UGDH, which imposes a detoxification burden, might be upregulated in cancer cells in the first place. Higher levels of UGDH were correlated with a worse prognosis in triple-negative breast cancer patients that received chemotherapy42. Proteomic studies also found that UGDH was elevated in chemo-resistant cells as compared to chemo-naïve or untreated cells in the context of lung and ovarian cancer43,44. This suggested one rationale for why UGDH may be elevated in cancer: its upregulation could provide an advantage in chemoresistance, which would be in line with the known function of its product UDPGA, as a substrate for the xenobiotic clearance mechanism of glucuronidation. Indeed, examining how UGDH expression correlates with drug resistance across cancer cell lines, we found that an elevated expression of UGDH correlated with increased resistance to many drugs, including staple chemotherapeutics such as doxorubicin, paclitaxel, and gemcitabine (Fig.4j). We also examined whether exposure to and/or selection in chemotherapeutics itself results in induction of UGDH. We formed persister populations of lung cancer line (H2170), triple negative breast cancer line (MDAMB231), and patient derived organoids (TPN1 and TPN2) through cisplatin exposure; these displayed both robust induction of UGDH and sensitization to UXS1 KO (Fig.4k–m, Extended Data Fig.10a–i) compared to their parental counterparts. Chemotherapy in the A549 inducible xenograft model induces UGDH in tumors (Fig. 4o, p) and synergizes with UXS1 iKO to regress tumor growth (Fig.4n), although we did not examine effects on overall survival. The same chemotherapy regimen does not induce UGDH in normal mouse tissues (Extended Data Fig.8j, k), suggesting a method to increase the therapeutic window for targeting cancer cells via UXS1. These findings suggest that UXS1 targeting may be particularly damaging to chemoresistant subpopulations of cancer cells, or to cancer cells being treated with chemotherapeutics, due to their induction of UGDH.
Discussion
The sugar nucleotide UDPGA is a multifunctional metabolite that is a currency for glycosylation and a substrate that cells conjugate to various xenobiotics to aid in their expulsion from cells45–47. Here, we find that UDPGA clearance by UXS1 is critically required for Golgi homeostasis in some cells. Importantly, this is a conditional requirement: only cells that express elevated levels of the enzyme UGDH, which produces UDPGA, have this detoxification requirement.
We demonstrate that this has a vital cancer therapy implication, as many types of cancers have elevated UGDH relative to normal cells. Only in these types of cancer cells, UXS1 disruption can result in aberrant Golgi morphology and glycosylation defects leading to death. The upregulation of UGDH in cancer cells may occur in some cancers from the selective advantage in drug clearance, as we show that the development of resistant subpopulations of cancer cells to xenobiotic, cancer cell-killing compounds is accompanied by elevated UGDH expression. This introduces a targetable liability in the form of a requirement for UDPGA detoxification via UXS1.
Our findings also reveal an unexpected link between a sugar nucleotide metabolic pathway and the modulation of signal transduction processes. We show that impairment of UXS1 and accumulation of UDPGA, by impairing the Golgi maturation of cell-surface proteins such as growth factor receptors, acts to ‘silence’ a cancer cell so it cannot respond to extracellular cues. Thus, in addition to killing cancer cells outright via toxic UDPGA levels, we envision nuanced cancer therapy strategies using such mechanisms to ‘silence’ cancer cell activities such as hyperproliferation and metastasis. That deregulation of sugar nucleotide metabolism can subdue the sensitivity of cells to extracellular cues is a concept that may be broadly relevant to cell biology and in multiple health contexts beyond cancer therapy.
Materials and Methods
Materials
Details of all the chemicals, DNA constructs, guide sequences, antibodies, and other materials are provided in Supplementary Table S1. All requests for information, reagents, and resources should be directed to the Corresponding Author, Dohoon Kim (dohoon.kim@umassmed.edu)
Cell lines and cell culture
All cell lines were cultured at 37°C under 5% CO2 and 20% O2. The cell lines used in this paper are listed in Supplementary Table S2, along with information about their media, supplements, and sources. Most cancer lines used (except otherwise mentioned in Supplementary Table S2) were cultured in Dulbecco’s Modified Eagle Medium (DMEM, Gibco #11995073) supplemented with 10% fetal bovine serum (Sigma #F2442), 100 units/ml Penicillin-Streptomycin (Gibco #15140122), and 2mM L-glutamine (Gibco #25030081).
Datamining analysis
A list of genes encoding metabolic enzymes and transporters (which we refer to as MetGene) was curated from the Kyoto Encyclopedia of Genes and Genomes (KEGG). First, we tried to identify which of the genes in MetGenes have differential essentiality, i.e., their CRISPR/Cas9 KO of that gene is lethal to some of the cancer cell lines but not to others. These genes were identified by mining a pan-cancer dependency dataset7 (Post-Chronos_ Combined Achilles and Sanger SCORE Chronos data using Harmonia) from Broad Institute. The standard deviation (formula: √{Σ(x-x̄)2/(n-1); where x: mean of essentiality of a gene across cell lines, n: the number of total cell lines) of the essentiality of each MetGene across the different cell lines from all solid cancer cell lines (572) from 25 different lineages were determined, high standard deviation values indicating high differential essentiality.
For each MetGene hit, we next set to identify genes whose mRNA expression level (transcript per million) predicts how essential the MetGene was in a given cell line. To this end, we determined Pearson Correlation values for all genes (17386) with a given MetGene across all 572 cells, cross-referencing gene essentiality values with RNAseq values from the CCLE7 RNA sequence dataset. Figure 1c shows the Pearson correlation between the dependency of UXS1 and the expression of all the genes in solid cancer lines.
CRISPR/Cas9-mediated genome editing
Guide RNA sequences were obtained from a published guide sequence library51 and cloned into the lentiCRISPR v2 (pLCv2) construct52. Lentivirus was produced in HEK293T cells by co-transfecting plasmid pLentiCRISPR v2 containing guide sequence of interest with the Delta-Vpr packaging plasmids and VSV-G envelope plasmid using X-tremeGENE 9 transfection reagent (Roche). Lentivirus containing media was harvested 48 hours after transfection, and virus titer was determined. Target cells were infected with lentivirus in the presence of 10 ug/ml polybrene with a multiplicity of infection (MOI) less than 1 to avoid the non-specific toxicity of Cas9. Infected cells were selected with media containing puromycin (1–2 ug/ml) for 4–5 days to ensure a full selection of cells.
Cell viability assay
Cell viability was measured using CellTiter-Glo 2.0 (Promega) reagent according to manufacturer instructions for 96 well plates. The plates were read using the Synergy HT Multi-Detection Microplate Reader.
Relative viability measurements post CRISPR-Cas9 mediated gene KO
Cells were plated to 6-well plate and infected with lentiviruses containing CTRL (non-targeting guide) or guides containing the gene of interest. Infected cells were selected with media containing puromycin (1–2 ug/ml) for 4 days. At 5 days post infection, fully selected cells were counted and plated to 96-well plates (each condition with 3–6 technical replicates). CTRL and KO cells (typically 500–1000 cells/well; depending on the growth rate of cell-line) were plated at equal seeding density to 96-well plates with media containing puromycin (0.5–1 ug/ml; to ensure selection pressure) for comparable baseline CTG values across conditions. To determine relative viability, CTG measurements were taken at two-time points. The baseline (first) time point was measured the day after cells were plated in 96 well plates, and the second time point was typically taken five days after baseline measurement. The fold changes in viable cells were calculated for each condition (day 5 CTG/ baseline CTG). These fold changes were then normalized to that of the same cells with non-targeting control guide (CTRL) to obtain relative viability following KO of our gene of interest (UXS1).
For double knock-out (DKO) experiments, cells were plated to 6-well plates and infected with lentiviruses containing pLCv2 CTRL or guides targeting either UGDH/SLC35D1 and selected with puromycin (1–2 ug/ml). Upon complete selection (5–6 days) the cells were infected with pMD154 lentivirus containing CTRL guides or guides targeting UXS1 to induce UXS1 KO. Cells were selected with hygromycin (500 ug/ml) for 5 days and double KO cells were plated to 96-well plates with media containing hygromycin (typically 500–1000 cells/well; depending on the growth rate of cell-line) in 6 technical replicates. To determine relative viability, CTG measurements were taken at two-time points. The baseline (first) time point was measured the day after cells were plated in 96 well plates, and the second time point was typically taken five days after baseline measurement. The fold changes in viable cells were calculated for each condition (day 5 CTG/ baseline CTG). These fold changes were then normalized to that of the same cells with non-targeting control guide (CTRL).
CRISPR resistant UXS1 molecular cloning and rescue experiment
A CRISPR-resistant version of UXS1-g1 (CR UXS1) was designed by introducing three silent mutations: 1 mutation in the Protospacer Adjacent Motif (PAM) sequence and two mutations in the seed sequence (GCTCCTGGCCTCCACGTCTGAAG). It was synthesized by GenScript with the addition of Notl and HPAl restriction sites. CR UXS1 was digested with Notl and HPAl and ligated into the expression vector pLV-EF1a-IRES-Blast. Lentiviruses were produced as described above, containing blank pLV vector or pLV-CR UXS1.
To confirm whether preventing targeting of UXS1 with UXS1-g1 rescues the toxic effect of UXS1 g1, we assessed the effect of UXS1 KO in cells expressing pLV-Blank or pLV-CR UXS1. We first transduced cells with lentivirus containing pLV-Blank or pLV-CR UXS1 and selected cells with blasticidin for six days. At seven days post first infection, we infected pLV-Blank and pLV-CR UXS1 cells with lentivirus containing pLCV2 CTRL (or UXS1-g1 or UXS1-g2) and selected cells with puromycin for five days. 6 days post-second infection, cells were counted and plated to 96 well plates at identical cell density (500 cells/well). We measured baseline seeding density by performing a CTG measurement at day seven post-second infection. Subsequently, we measured viability 12 days post the second infection to determine relative cell growth over five days.
Cell cycle analysis
Cells were grown to sub-confluency. Cells were trypsinized, fixed in pre-chilled 70% ethanol in PBS, and stored at −20°C overnight. The following day cells were centrifuged and incubated with 50ug/ml of propidium iodide with 0.1 mg/ml RNAse A in PBS containing 0.05% TritonX-100 for 45 minutes. Cells were then centrifuged and resuspended in PBS and were analyzed on a Biorad ZE5 cell analyzer where at least 10,000 events were assessed. Data was collected with Everest software (version 2.0) and were analyzed for cell cycle distribution using a univariate model (Watson pragmatic) in FlowJo (v10.8.1).
Immunoblots
Cell lysates were harvested using RIPA buffer (Boston Bioproducts) with protease inhibitors (cOmplete, Roche) and phosphatase inhibitors (Cell signaling technology). Harvested proteins were denatured in 6x Laemmli buffer (Boston Bioproducts) and boiled at 90°C for 5 minutes. Samples were loaded at equal concentrations and analyzed by standard SDS-PAGE western blotting techniques. Protein levels were detected using HRP-conjugated secondary antibodies and chemiluminescent substrates (Pierce ECL or Pico PLUS), and exposed via traditional film or Biorad ChemiDoc imaging system. We found that not boiling the samples before gel electrophoresis was necessary to detect UXS1 protein.
Cell death rescue experiments
Cells were infected with lentiviruses containing CTRL (non-targeting guide) or UXS1-g1 in 6 well format. Infected cells were selected with puromycin (2µg/ml) for three days. Four days post-infection, the selected cells were plated to two separate 96 well plates in 3 technical replicate wells at seeding density ~500 cells/well. Alternately, UXS1 iKO cells were induced with doxycycline treatment for 48 hours and 5 days after induction, cells were plated to two separate 96 well plates in 3 technical replicate wells at seeding density ~500 cells/well. Baseline CTG measurements were taken at 24 hours after seeding from one set of 96 well plates. Cells in other plates were either untreated or treated with Z-VAD-FMK or Necrostatin orFerrostatin-1 at indicated concentrations. Cell viability was then measured five days after drug treatment (day 9 post-infection/induction). Relative viability was then determined by calculating fold change in viability (day9/baseline CTG) for UXS1-g1 and CTRL.
Sulfated Glycosaminoglycan (sGAG) and Hyaluronic acid (HA) quantification
A549 cells were infected with lentiviruses (pLentiCRISPR V2-based) containing CTRL (non-targeting guide) or UGDH-g1 and selected using puromycin (2µg/ml). 6 days after selection these cells were infected with lentiviruses (pMD154 based) which express only the guides (CTRL, UXS1-g1, or UXS1-g2) two induce double knock-out (as mentioned in methods above). These cells were selected with Hygromycin (500µg/ml) for 5 days. On day 6 0.5X10⁶ cells were plated in 6 well plate for each condition in media without phenol red. Conditioned media (CM) were collected 48 hours after seeding the cells and cells plated in technical replicate plates were counted for each condition for normalization. CM samples were centrifuged at 1000xg to remove any cell debris.
For HA quantification, Supernatants were used for quantification using a Competitive-ELISA detection method (Biomatik, catalog# EKF57990) in which HAs in our sample competes for sites on the biotinylated detection antibody, along with the use of a standard to verify the results. Manufacturer protocols were followed.
For sGAG quantification, Cells were digested with papain using tissue digestion kit (AMSbio; catalog# 280560-TDK) to remove protein portion of the proteoglycans per manufacturer protocol. The digested samples were assayed for sGAGs using sulfated Glycosaminoglycan quantification kit (AMSbio; catalog# 280560-N), that uses 1, 9-dimethylmethylene blue (DMMB) dye that binds to sulfated glycosaminoglycans and the shift in absorption spectrum due to this binding can be measured at 520nm. Manufacturer protocol was followed. Chondroitin Sulfate (Bovine Trachea) was used as a standard.
Metabolomics: UDPGA quantification by LC-MS/MS
A549 cells were infected with lentiviruses containing either CTRL or UGDH-g1 or UXS1 g1in biological triplicates. Cells were selected with Puromycin for five days. Cells at indicated time-points were washed thrice with ice-cold PBS and extracted on dry ice on 1ml 80% methanol containing 500nM internal standards (Metabolomics Amino Acid Mix Standard; Cambridge Isotope Laboratories). Cell extracts were collected using a cell scraper and transferred to a microcentrifuge tube. Samples were vortexed for 15 minutes at 4°C and centrifuged at 18000 x g for 10 minutes at 4°C. Supernatants were transferred to a new microcentrifuge tube and stored at −80°C until analysis. These samples were then dry evaporated using vacuum centrifugation. Polar metabolite profiling was performed on dried polar extracts at the Whitehead metabolite profiling core facility. It was performed on a QExactive orbitrap mass spectrometer equipped with an ion Max source and a HESI II probe coupled with a Dionex Ultimate 3000 HPLC system containing SeQuant® ZIC®- pHILIC analytical column. Relative quantitation of polar metabolites, including UDPGA, was performed with XCalibur QuanBrowser 2.2 and TraceFinder 4.1 (both Thermo Fischer Scientific) using a 5ppm mass tolerance and referencing an in-house library of chemical standards.
Transcriptomic analysis
A549 cells were infected in 6 well plates in biological triplicate (n=3) with lentivirus containing pLCV2 CTRL or UXS1-g1. Cells were selected for five days, and cell pellets were harvested seven days post-infection (timepoint was chosen such that UXS1 KO cells do not start undergoing a significant level of cell death). Total RNA was isolated using the Qiagen RNAeasy kit per manufacturer extraction protocol. BGI Americas Corporation performed sample quality control, cDNA library preparation, and sequencing. The pair end sequencing was performed on the DNBseq platform (BGI Americas Corporation) with ~20 million reads per sample. The reads were aligned and mapped to the human genome and were normalized to the transcripts per million (TPM) for each sample.
The differentially expressed transcripts obtained through RNA-seq between control and UXS1 KO conditions were compared to curated gene sets from online pathway databases, publications in PubMed, and knowledge of domain experts using the GSEA tool. The results from GSEA are evaluated based on the Normalized enrichment score (NES). Since GSEA accounts for differences in gene set size and in correlations between gene sets and the expression dataset, the NES can be used to compare analysis results across gene sets.
Generation of doxycycline Inducible UXS1 KO system
To generate a doxycycline-inducible CRISPR/Cas9 mediated UXS1 knockout system, we cloned UXS1-g2 into TLCv2 plasmid49 to prepare an all-in-one inducible system. U6 promoter in this plasmid drives constitutive expression of UXS1-g2, and the addition of doxycycline induces Cas9-2A-eGFP. A549 cells were infected with lentiviruses containing the plasmid mentioned above, and the cells were selected with Puromycin (2 ug/ml) for five days. The selected cells were then diluted to 0.3 cells per 150µl for single-cell sorting and plated in 96 well plates (150µl/well). Total twelve clones were screened for eGFP expression and loss of UXS1 by immunoblotting, and TLCv2 “Clone 6” (referred to as UXS1 iKO) displayed homogeneous eGFP expression along with UXS1 loss upon doxycycline induction and was hence selected for future experiments. Similarly, H460 and HT1080 cells were infected with the lentiviruses containing the plasmid mentioned above, and single cell clones were isolated that displayed homogeneous eGFP expression along with UXS1 loss upon doxycycline induction. These are referred as ‘H460 UXS1 iKO’ and ‘HT1080 UXS1 iKO’ respectively.
Doxycycline treatment
Doxycycline was prepared as a 100mg/ml stock solution, and aliquots were stored at −80°C. Cells were treated with 100ng/ml doxycycline in DMEM with 10% FBS (regular growth media) for 48 hours. Cells were changed into fresh media after 48 hours of doxycycline induction.
[U-13C]-glucose labeling experiments
A549 cells were transduced with lentivirus containing pLCv2 UGDH-g1. Cells were completely selected with Puromycin for 5 days, were changed into fresh media and seeded for the experiment in 10cm dishes at 70% confluency. UXS1 iKO and control iKO cells were induced with doxycycline (100ng/ml) in separate 10cm dishes. Cells were changed into fresh media after 48 hours. 5 days post induction, cells were seeded for the experiment in 10cm dishes at 70% confluency. For regular media 4.5g/ L glucose (C# G8270, Sigma) was added in glucose-free DMEM (C# 11966025, ThermoFisher) supplemented with 10% FBS, 1% P/S, 1mM Pyruvate. Labeling media was identical except using [U-13C] Glucose (CLM-1396, Cambridge Isotope Laboratories) in place of glucose. 1 day after seeding, the cells were changed into fresh regular media. 2 hours after the regular media change, the cells were changed into labeling media containing [U-13C] Glucose and the metabolites were isolated from the cells at indicated timepoints.
To isolate metabolites, medium was removed, cells were washed 2 times with ice cold 1X PBS, and plates were covered in a total of 3ml of LC-MS grade 80:20 methanol:Water. Plates were scraped on dry ice and lysates were collected into 15ml conical tubes. Lysates were vortexed for 10 minutes at 4°C and centrifuged at 16,000 x g for 10 minutes at 4°C. Supernatants were dried down in a benchtop Vacuum Concentrator. Dried pellets were stored at −80°C until they were run on LC-MS.
A QExactive Plus quadrupole orbitrap mass spectrometer (Thermo Fisher Scientific) equipped with an Ion Max source and a HESI II probe coupled to a Vanquish Horizon UHPLC System (Thermo Fisher Scientific) was used to perform LC-MS experiments. Prior to operation, the instrument underwent mass calibration for positive and negative ion mode using Calmix (Thermo Fisher Scientific) every 7 days. Dried samples were re-suspended in 200 uL of HPLC water and 2 uL of re-suspended polar metabolite samples were injected into a SeQuant ZIC-pHILIC 5μm 150 x 2.1 mm analytical column equipped with a 2.1 x 20 mm guard column (MilliporeSigma). The column oven was held at 25°C and the autosampler tray was held at 4°C. Buffer A was comprised of 20 mM ammonium carbonate, 0.1% ammonium hydroxide. Buffer B was comprised of 100% acetonitrile. The chromatographic gradient was run at a flow rate of 0.150 mL/min as follows: 0–20 min: linear gradient from 80–20% B; 20–20.5 min: linear gradient from 20–80% B; 20.5– 28 min: hold at 80% B. The mass spectrometer was operated in full-scan, polarity switching mode, and targeted selected ion monitoring (tSIM), negative mode, for UDP-xylose (m/z: 535.0371) and 13C5-UDP-xylose (m/z: 540.0539). The spray voltage set to 4.0 kV, the heated capillary at 350°C, and the HESI probe at 350°C. The sheath gas flow was 10 units, the auxiliary gas flow was 2 units, and the sweep gas flow was 1 unit. MS data was collected in a range of m/z = 55–825. The resolution was set at 70,000, the AGC target at 1x10⁶, and the maximum injection time at 20 msec. Rate of production of UDPGA and UDP-xylose (Fig.2 c, e and k) is quantified based on respective standard curves and depicted in picomoles per million cells.
Immunocytochemistry
Cells were plated on poly-D-lysine (PDL) coated coverslips kept in 12-well tissue culture plates. On day seven post lentiviral infection, the coverslips were rinsed once with PBS and fixed with 4% paraformaldehyde in PBS for 15 minutes at room temperature. The coverslips were then rinsed three times with PBS, and the cells were permeabilized with 0.2% TritonX-100 v/v in PBS for 15 mins at room temperature. Coverslips were washed three times and blocked in 4% horse serum for 1 hour at room temperature. The coverslips were incubated in the primary antibody at 4°C overnight, rinsed three times with PBS, and then incubated with secondary antibody for 45 minutes at room temperature in the dark along with Phalloidin-iFluor488 (Abcam). Coverslips were then washed three times with PBS and mounted on the slides using ProLong Gold Antifade mountant containing DAPI. Images were acquired on the Nikon Eclipse Ti2 confocal microscope. Raw images were opened in ImageJ and processed similarly for all experimental conditions. Golgi area measurement was carried out using ImageJ (1.53q). Identical thresholding was performed on the golgi-stained images. Stained Golgi pixel area per cell was calculated using ‘measure’ function in imageJ.
Transmission Electron Microscopy (TEM)
Cell cultures of A549 control and UXS1 KO (day7 post infection) in plates were processed and analyzed at the University of Massachusetts Medical School Electron Microscopy core facility according to standard procedures. Samples were fixed by adding equal volume 2.5% glutaraldehyde/1.6% paraformaldehyde in 0.1 M Sodium Cacodylate buffer pH 7. to the culture plates after half the media was removed. The cell cultures were allowed to stabilize in this solution for 10 min, then all the media/glutaraldehyde was removed and fresh 2.5% glutaraldehyde/1.6% paraformaldehyde in the same buffer was added and the cells were allowed to fix for 60 min. at room temperature. After this primary fixation, the cells were rinsed three times in fresh fixation buffer for 10 min. each time and were secondarily fix with 1.0% osmium tetroxide in ddH2O for 1hr at room temperature. The cell cultures were then washed again three times in ddH2O and then scraped into pellets. The cells were dehydrated through a graded series of ethanol (10% to 100%; 3 changes). Samples were then infiltrated first with two changes of 100% Propylene Oxide and then with a 50%/50% propylene oxide / SPI-Pon 812 resin mixture. The following day five changes of fresh 100% SPI-Pon 812 resin were performed before the samples were polymerized at 68°C in embedding molds. The samples were then trimmed for TEM. 70nm thin sections were placed on gold support grids and contrasted with Lead citrate and Uranyl acetate. Sections were examined using the CM10 with 80Kv accelerating voltage and images were captured using a Gatan TEM CCD camera.
Subcellular Fractionation
Cells cultured in 10 cm plates were harvested at 80% confluency. Cells were trypsinized and washed with ice cold PBS twice. 2x10⁶ cells were resuspended in 400µl of ice cold digitonin buffer (150mM NaCl, 50mM HEPES pH 7.4, 50µg/ml digitonin (Sigma)) containing protease inhibitors at room temperature for 10 mins. This has been shown to disrupt plasma membrane via cholesterol interaction, while preserving organellar membrane integrity, allowing organellar metabolite measurements53,54. The cells were then centrifuged at 2000xg to pellet the cells. The supernatant was collected as the ‘cytosolic’ fraction. 400µl of RIPA buffer containing protease inhibitors were added to the cell pellet and was incubated at 4°C for 10 mins to disrupt organellar membranes. This was then subjected to centrifugation at 7000xg for 10 mins and the supernatant was collected as the ‘organellar’ fraction. 200µl of each of the ‘cytosolic’ and ‘organellar’ fraction was saved for running immunoblots and 800µl of methanol (Millipore Sigma) was added to the rest of 200µl fractions to extract the metabolites. Metabolite samples were stored at −80°C until analysis.
Quantification of UDPGA using GC-MS
600 µl of cell extracts were dried in a vacuum evaporator (Thermo SPD111V). Dry residues were derivatized using 50 µl of N-methyl-N-(trimethylsilyl) trifluoroacetamide (MilliporeSigma) and 20 µl of pyridine (MilliporeSigma) for 3 hours at 37°C and allowed to complete at room temperature for another 5 hours. Split mode with 1:5 ratio was used to inject 1 µl of the sample into the Agilent 5977B gas-chromatograph interfaced with an Agilent 7890B mass selective detector. The capillary column was Agilent HP-5MS UI (30 m × 0.25 mm internal diameter × 0.25 µm film thickness). Helium was supplied as a carrier gas at a constant flow of 1 ml/min. The oven temperature conditions were as follows: started at 80 °C, held for 1 min, increased at 7 °C/min to 285 °C. The inlet, ion source and transfer line were heated to 230, 280 and 250 °C, respectively. The mass detector performed 3 scans per second in the range from 30 to 500 m/z, electron impact ionization energy 70 eV. UDPGA was detected as three fragments matching the spectra and retention time of the reference compound. Corresponding peaks eluted at 17, 24.5 and 25.8 minutes and were quantified using ions m/z 217, 217 and 299, respectively. The most abundant among the three correlated ions/fragments (m/z 299 at minutes 25.8) was used for quantification. Peak integration and quantification of peak areas were done using MassHunter software (Agilent v.10.1).
N-glycan and O-glycan profiling and composition analysis
For glycan profiling and composition analyses, protein extracts (120 μg) were lyophilized, reduced in a 25 mM dithiothreitol solution (Sigma-Aldrich, St. Louis, MO) at 50 °C for 90 min, and then alkylated with a 65 mM iodoacetamide solution for 90 min at room temperature in the dark. Samples were dialyzed against 50 mM ammonium bicarbonate for 24 hours at 4°C, lyophilized, and incubated with 1 mL of 50 μg/mL TPCK-treated trypsin (Sigma-Aldrich) at 37°C overnight. The digested peptides were then purified using a Sep-Pak C18 (200-mg) cartridge (Waters Corp., Milford, MA), lyophilized, and incubated with 2 μL (500 units/μL) of PNGase-F (New England Biolabs, Ipswich, MA) in 200 μL of 50 mM ammonium bicarbonate at 37°C for 4 hours. The mixture was further incubated with 3 μL of PNGase-F at 37°C overnight. O-glycans were released from O-glycopeptides by reductive β-elimination, 1 M NaOH with 50 mM NaBH4 held at 50°C for 18 hours. The released N-glycans and O-glycans were purified over a Sep-Pak C18 (200-mg) cartridge. The flow-through and wash fraction containing the released glycans were collected, pooled, and lyophilized.
Purified glycans were then permethylated by incubation with 1 mL of a NaOH: dimethyl sulfoxide slurry solution and 500 μL of methyl iodide (Sigma-Aldrich) for 30 min with vigorous shaking. One mL of chloroform and 3 mL of Milli-Q water were then added, and the mixture was briefly vortexed to wash the chloroform fraction. The wash step was repeated three times. The chloroform fraction was dried, dissolved in 200 mL of 50% methanol, and loaded into a Sep-Pak C18 (200-mg) cartridge. The eluted fraction was lyophilized and dissolved in 10 μL of 75% methanol from which 1 μL was mixed with 1 μL 2,5-dihydroxybenzoic acid (Sigma-Aldrich; 5 mg/mL in 50% acetonitrile with 0.1% trifluoroacetic acid) and spotted on a matrix-assisted laser desorption/ionization polished steel target plate (Bruker Daltonics, Bremen, Germany).
Mass spectrometry data were acquired on an UltraFlextreme matrix-assisted laser desorption/ionization–time-of-flight mass spectrometer (Bruker Daltonics). Reflective, positive mode was used, and data was recorded between m/z 500 and 6000. The mass spectrometry glycan profiles were acquired by aggregating at least 10,000 laser shots. Mass peaks were manually annotated and assigned to a particular N and O-glycan composition when a match was found.
EGF stimulation of UXS1 iKO cells
UXS1 iKO and control iKO cells were induced with doxycycline (100ng/ml) in separate wells of 6 well plates. Cells were changed into fresh media after 48 hours. 6 days post induction, cells were serum starved overnight using DMEM media without serum. The next day cells were stimulated with 100ng/ml of EGF, and protein lysates were harvested 5min, 10min, 15 min, and 30min after EGF stimulation. As a negative control, UXS1 and control iKO cells were also pre-treated with 5µM Erlotinib for 30 mins and harvested 5 mins after EGF stimulation. Harvested proteins were denatured in 6x Laemmli buffer (Boston Bioproducts) and boiled at 90°C for 5 minutes. Samples were loaded at equal concentrations and analyzed by standard SDS-PAGE western blotting techniques as described before in this section.
EGFR surface quantitation
The evaluation of EGFR surface expression on UXS1 iKO cells was performed by flow cytometry. Cells were washed with ice cold FACS buffer (10% FBS, 0.1% NaN3 in PBS). 1x10⁶ cells were incubated with 10µl of Human EGFR Fluorescein-conjugated Antibody (R&D systems) in dark for 30 minutes at room temperature. Cells were then centrifuged (300xg) and washed three times with ice-cold FACS buffer to remove any unbound antibody. Cells were resuspended in 400ul of FACS buffer and immediately analyzed on a Biorad ZE5 cell analyzer where at least 10,000 events were assessed and plotted using FlowJo (v10.8.1).
Inducible UXS1 KO Xenograft models
The research project has been reviewed by the institutional Animal Care and Use Committee (IACUC) at the University of Massachusetts Medical School and complied with all ethical regulations. To establish inducible UXS1 KO xenograft models, 2.5 X 10⁶ A549 UXS1 iKO or H460 UXS1 iKO or HT1080 UXS1 iKO cells were injected subcutaneously into the right flank of female athymic nude mice in a total of 100ul of PBS at six weeks of age. In each of the three experiments, tumors were allowed to grow until the mean tumor volume of each group was 200–250mm3(A549: 14 days, H460: 11 days, HT1080: 7 days), upon which point mice were divided into two groups in a manner that each group had comparable average tumor volumes, and dox induction started in one of the groups via doxycycline chow (TD.01306) to induce Cas9 expression for UXS1 KO. There were 12 animals for every condition except one animal was excluded from the study due to no visible tumor in A549 xenograft experiment.
The A549 xenograft experiment had total four arms. 1. Control 2. Cisplatin 3. UXS1 KO 4. UXS1 KO+ Cisplatin. The UXS1 KO arms (3 and 4) were put on Doxycycline containing diet as described and the first two arms were continued on regular control diet (Prolab® 5P76) upon randomization. The cisplatin arms (2 and 4) were administered 4 mg/kg cisplatin via intravenous (i.v.) tail vein injections once a week for a total of three weeks, first injection being on same day as the dox induction (14 days). H460 and HT1080 xenograft experiments had two arms each. Similarly, UXS1 KO arm were put on Doxycycline containing diet (TD.01306) and the control arm were continued on regular control diet (Prolab® 5P76).
Tumors were measured every 2–3 days using a vernier caliper and the tumor volume was calculated using the formula 4/3π X (length x width x depth)/2. Mice were monitored regularly for appearance and body weight throughout the experiment. The endpoint for survival data calculation was set to the tumor size of 2000mm3 and mice were euthanized as soon as possible upon reaching the limits as defined in our IACUC protocol. Upon reaching the endpoint, animals were euthanized, and the tumors were isolated, and snap-frozen for further analysis.
Processing of human breast and lung tissues for UGDH protein quantification
All human breast and lung normal and cancer tissues were obtained from de-identified patients with informed consent from the University of Massachusetts Medical School Biorepository and Tissue bank using procedures conducted under an Institutional Review Board (IRB) approved protocol. All tissue samples were snap-frozen in liquid nitrogen immediately after surgical removal and stored at −80°C. The frozen tissues were homogenized in RIPA buffer (Boston Bioproducts) containing protease inhibitors (cOmplete, Roche) and phosphatase inhibitors (Cell signaling technology). Supernatants containing proteins were collected after centrifugation at 13000 x g at 4°C for 10 minutes. Protein samples were normalized using the Pierce BCA assay kit (Thermofisher Scientific). Samples were analyzed by standard SDS-PAGE western blotting techniques. Protein levels were detected using HRP-conjugated secondary antibodies and chemiluminescent substrates (Pierce ECL or Pico PLUS).
Induction of chemo-resistance in H2170 and MDAMB231 cells
Resistant versions of the H2170 and MDAMB231 cell lines were derived from parental cells by continuous exposure to increasing concentrations of the chemo-drugs. H2170 cells were exposed to (Gemcitabine, starting dose: 4nM end dose: 12µM; SN38, start dose: 5nM end dose: 10nM; Paclitaxel, starting dose: 0.004nM end dose: 0.012nM; Mitomycin C, starting dose: 30nM end dose: 60nM; Cisplatin starting dose: 360nM end dose 600nM) and MDAMB231 cells were exposed to (Cisplatin, starting dose: 1.5µM end dose: 3µM ;Paclitaxel, starting dose: 0.1nM end dose: 0.4nM). Dose-response studies of chemotherapeutics were carried out over 72 hours to assess IC50 values. H2170 and MDAMB231 cells were grown in chemo-drugs for 2 and 3 months respectively. IC50 concentrations were reassessed in each cell line. CRISPR/Cas9 KO experiments using these lines were performed in the absence of chemotherapeutics.
Patient derived Organoids
Deidentified tumor tissues of freshly resected biopsies from patients with TNBC were obtained from UMass Cancer Center Tumor Bank. These tumors were digested using gentleMACS Dissociator and tumor dissociation kit (Miltenyi Biotech). The digested tumors were washed using 1x phosphate-buffered saline, and partially digested tumor pieces were embedded into reduced growth factor basement membrane extract (BME) (R&D systems). For passaging, the organoids were dissociated using TrypLE™ Express Enzyme (Gibco) and cultured in organoid media. The organoid media is described here55. The drug-resistant organoids were derived from parental organoids by culturing them in cisplatin (starting dose 10nM, final dose 1uM) for 4 weeks.
Lentiviral infection in Organoids
The organoids were dissociated from the plate by adding TrypLE™ Express and disrupting the BME droplets with P1000 pipette. They were incubated in TrypLE™ Express at 37°C for 15 mins. After dissociation cells were centrifuged at 350xg at room temperature for 5 mins and resuspended in 1ml of organoid media. After counting, equal numbers of cells were distributed in separate eppendorf tubes and centrifuged at 300xg to collect cell pellets. 250ul of pre-titered lentiviral supernatants were added to each condition to ensure equal transduced units/ml along with 1µl of polybrene (2.5µg/ml). These cell/lentivirus mixes were transferred to separate wells of ultra-low attachment 48 well plates (Sciencell). The cells were spin-infected by centrifuging at 600xg at room temperature for 60 mins. The cells were then incubated for 6 hours in cell culture incubator at 37°C. They were transferred to eppendorf tubes and centrifuged (350xg) at room temperature for 5 mins. Supernatants were discarded and the cells were re-suspended in BME (R&D systems). Infected organoid cells were then seeded in BME droplets in 48 well plates. Infected cells were selected with Puromycin (0.5µg/ml) 24 hours after seeding into BME droplets. Cell viability was measured seven days post infection using CellTiter-Glo® 3D (Promega) reagent according to manufacturer instructions.
RNA interference mediated knock-down (KD) of UXS1
We obtained TRC lentiviruses for UXS1 shRNAs from Umass Chan Medical school RNAi core. A549 cells were transduced in 6-well plates with the TRC lentiviruses for either shGFP, shEmpty_vector or shUXS1 in the presence of 10 ug/ml polybrene with a multiplicity of infection (MOI) less than 1. Infected cells were selected with media containing puromycin (2 ug/ml) for 4 days. Upon complete selection, the cells were plated to 96-well plates. To determine relative viability, CTG measurements were taken at two time points. The baseline (first) time point was measured the day after cells were plated in 96 well plates, and the second time point was taken five days after baseline measurement. The fold changes in viable cells were calculated for each condition (day 5 CTG/ baseline CTG). These fold changes were then normalized to that of the same cells with shGFP to obtain relative viability following KD of our gene of interest (UXS1).
Statistics and Reproducibility
For all experiments showing relative viability; each condition was measured in at least three technical replicates within each experiment, and each datapoints shown (each n) is from an independent experiment (e.g. n=3 indicates 3 independent experiments). Unless otherwise indicated, each experiment was repeated at least three times (represented by individual points in graphs). LC-MS metabolites quantitation, labeling experiments, transcriptomic analysis, FACS analysis were performed in biological triplicates, and n=3 would indicate 3 biological replicates. Technical replicates are never represented as n’s. Data are presented as mean ± standard deviation. Statistics were calculated using a two-tailed Student’s t-test. P<0.05 was considered statically significant, and data marked with statical significance as follows: *p<0.05, **p<0.01, ***p<0.001, ****p<0.0001, NS: not significant (unless otherwise mentioned). Statistics and graphs were prepared using Microsoft Excel and Graphpad Prism.
Data are representative of at least three independent experiments in : 1f-I; 2a, f-j; 3a-e, g-j; 4g, h, k-m, o, p; Extended Data Fig. 1c, e–g, I, j; Extended Data Fig. 2b–d; Extended Data Fig. 3a–l; Extended Data Fig.4a–d; Extended Data Fig.5a, g–j; Extended Data Fig.6a–I, k; Extended Data Fig.7a–d; Extended Data Fig.8b–d, i–k; Extended Data Fig.9a, b, e, f; Extended Data Fig.10a–c, e, f, h–j, l. Data are representative of two independent experiments in: 1e; 2c, e, k; 4i; Extended Data Fig.5 b–f; Extended Data Fig.9d; Extended Data Fig.10d, g, k. Data are representative of one independent experiment in: 3f; 4a–f, n; Extended Data Fig.8e–h.
Bliss independence values (Fig 4n) were calculated using standard formula of Ec = Ea + Eb − Ea × Eb. A bliss independence score that equals 1.0 indicates additive effect, greater than 1.0 indicates antagonistic effect, and less than 1.0 indicates a synergistic effect.
Extended Data
Extended data Figure 1. UXS1 is required in a subset of cancer cells, and validation of CRISPR/cas9 reagents for UXS1.
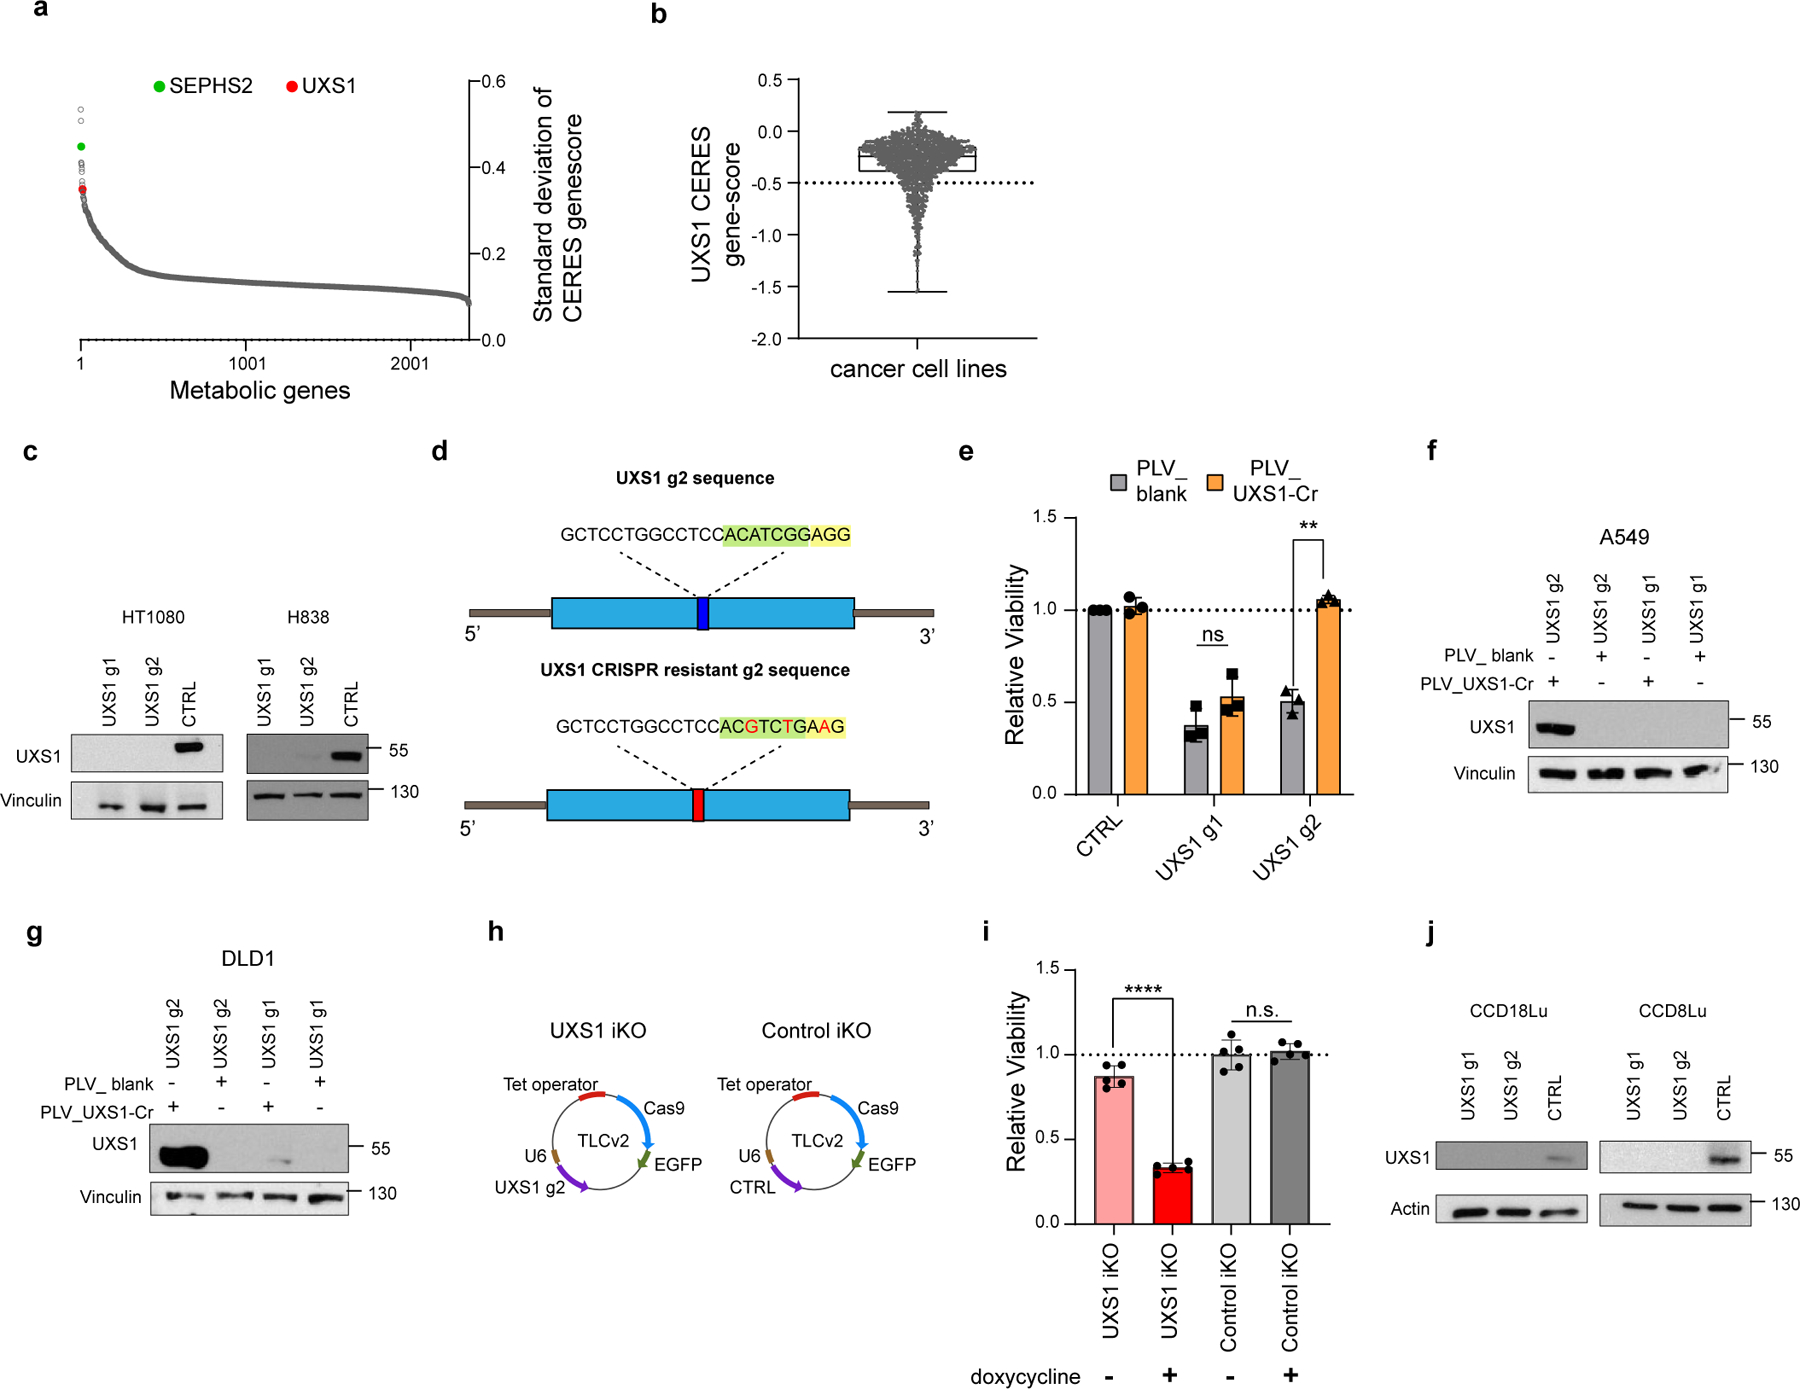
(a) Ranked list of the standard deviation of CERES gene-scores of all metabolic genes across 572 solid cancer cell lines, identifying UXS1 as one of the top enzymes having variable dependency. (b) UXS1 gene-score across cancer cell lines using pan-cancer dependency dataset6 showing that only a subset of cancer cell lines (gene-scores below −0.5) is dependent on UXS1 for survival. A lower gene score means that a gene is more likely to be essential in a given cell line. A score of 0 is equivalent to a non-essential gene, whereas a score of −1 corresponds to the median of all common essential genes. (c) UXS1 immunoblots showing KO of UXS1 in HT1080 and H838 cell lines 9 days post transduction. (d) Schematic of UXS1 g2 and UXS1 CRISPR resistant g2 sequence, demonstrating the strategy of using 1 silent mutation in the PAM sequence (yellow highlight) and 2 silent mutations in the seed sequence (green highlight) to prevent CRISPR/cas9 targeting. (e) Relative viability of DLD1 cells either overexpressing blank vector or g2-resistant UXS1 then subjected to UXS1 KO with g1 or g2, demonstrating that UXS1 KO toxicity is on target (CTRL = 1.0) (n=3 per group). (f) Immunoblot of UXS1 levels in A549 and (g) DLD1 cells overexpressing blank or UXS1-g2 resistant vectors when subjected to CRISPR/Cas9 mediated KO of UXS1 (h) TLCv2 system49; LentiCRISPR v2 was modified into an all-in-one dox inducible system. The addition of doxycycline induces Cas9-2A-eGFP. The U6 promoter drives constitutive sgRNA expression. UXS1 iKO and control iKO was prepared by cloning UXS1-g2 and CTRL (non-targeting guide) into the TLCv2 system, respectively. (i) Relative viability of UXS1 iKO and control iKO cells with and without doxycycline induction (control iKO without doxycycline = 1.0) (n=3 per group). Induction consisted of 100ng/ml doxycycline treatment for 48 hours; cells were cultured for 4 more days before measuring viability. (j) UXS1 immunoblots showing KO of UXS1 in CCD18Lu and CCD8Lu cells, 9 days post-transduction. Data are shown as mean ± s.d. except in b where box plot shows median (centre) with interquartile range of 25% to 75%, minima and maxima. e, i, Two-tailed unpaired Student’s t-test. P values from left to right in e: p=0.12, p=0.002, i: p=0.663, p=5.4E-06 (n.s.: not significant, **p<0.01, ****p<0.0001). d and h was created using Biorender (https://biorender.com/).
Extended Figure 2. Additional data for UXS1 loss led cell cycle defects and cell death rescue.
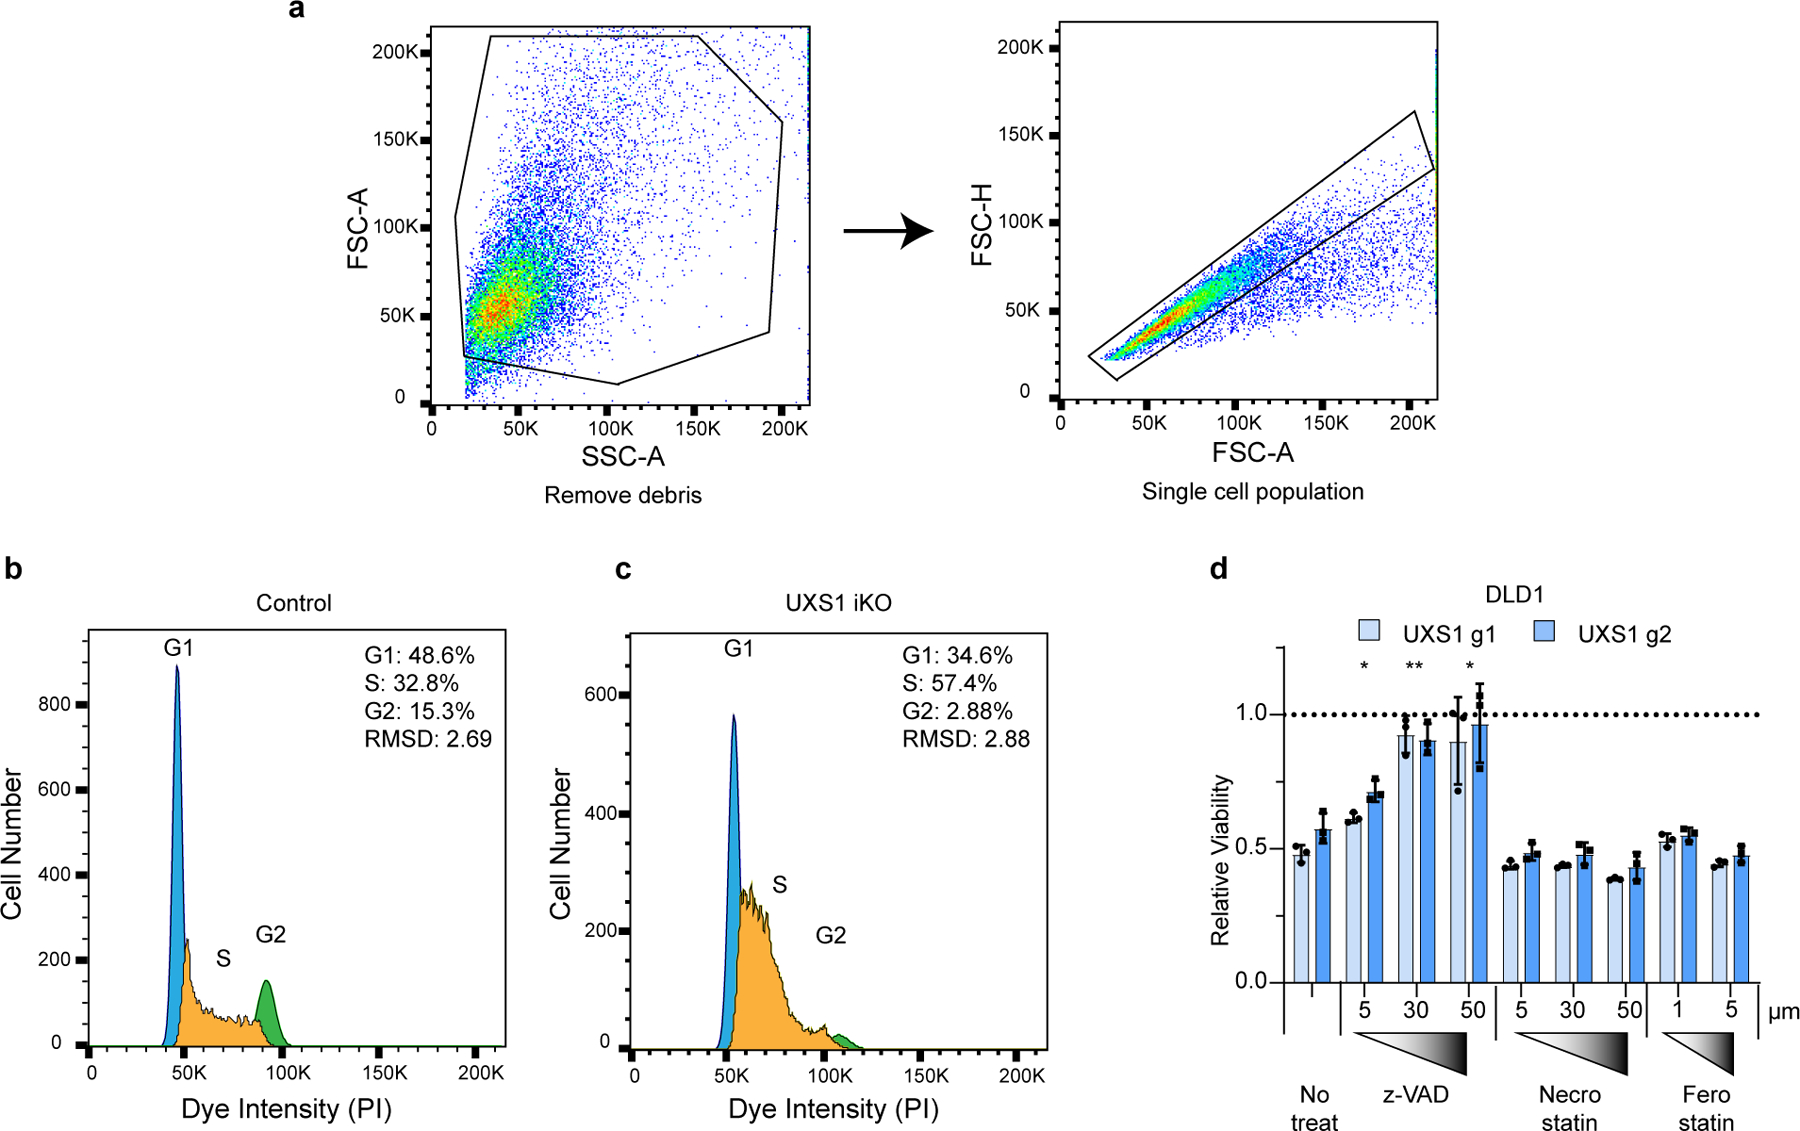
(a) Gating strategy for cell cycle analysis. Cells were first gated by forward (FSC-A) and side scatters (SSC-A) to remove cell debris, then by forward scatter area (FSC-A) and height (FSC-H) to select for single cells before plotting histograms for cell cycle profiles. This example gating strategy is shown in control iKO cells. (b) Representative cell cycle profiles for control iKO cells and (c) UXS1 iKO cells 5 days after doxycycline induction. The cell cycle phases were determined by fitting a univariate cell cycle model using the Watson pragmatic algorithm (d) Relative viability of DLD1 cells subjected to UXS1 KO then treated with z-vad, Necrostain, or Ferrostatin at the indicated concentrations (Untreated = 1.0) (n=3 per group). Data are mean shown as ± s.d. d, Two-tailed unpaired Student’s t-test. P values from left to right in d: p=0.03, p=0.002, p=0.032 (*p<0.05, **p<0.01, ***p<0.001).
Extended data Figure 3. Supporting data that UDPGA is toxic.
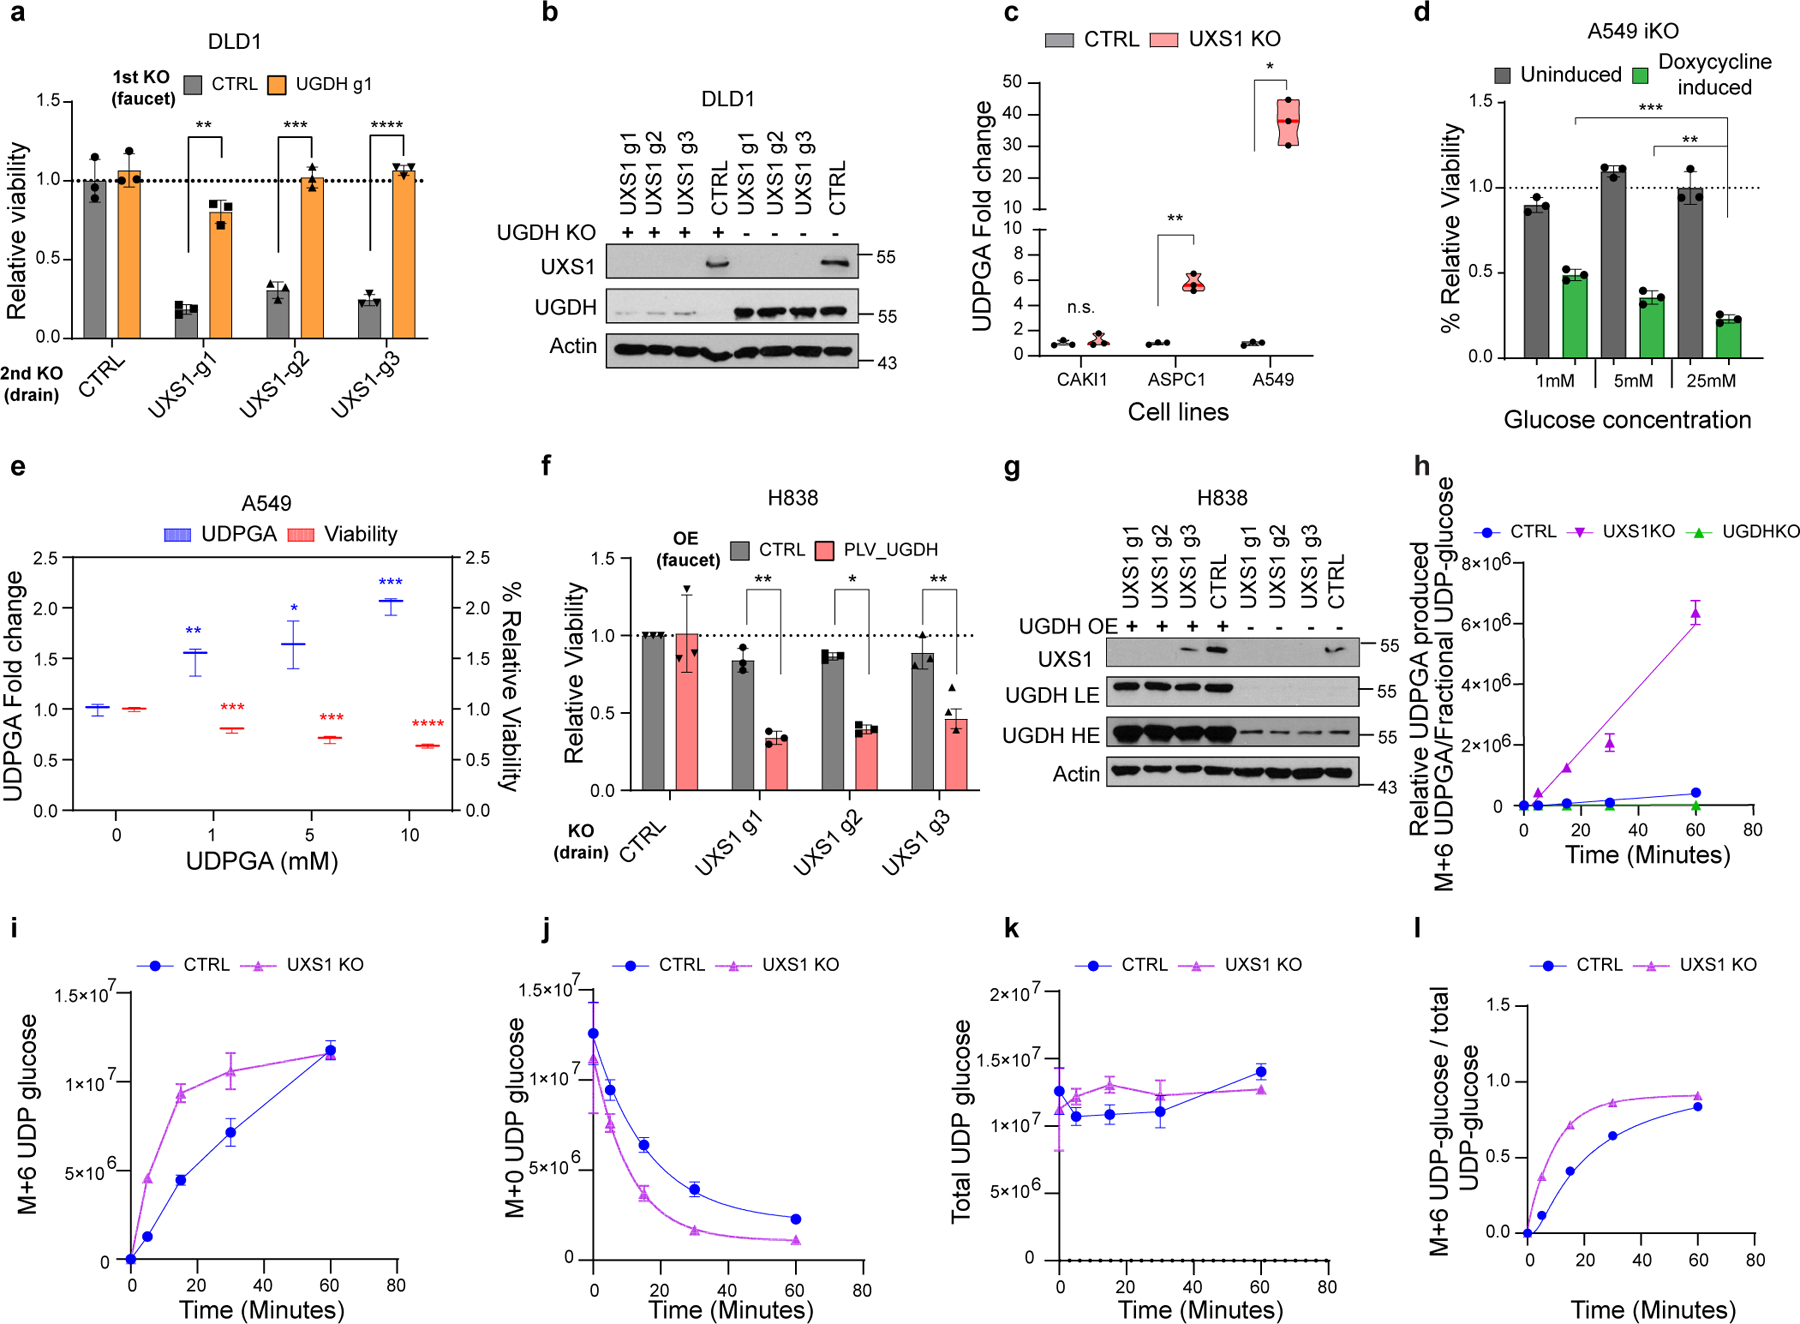
(a) Relative viability of DLD1 cells subjected to preemptive CTRL (gray) or UGDH (faucet; orange) KO, followed by CTRL or UXS1 (drain) KO. Values are relative to cells subjected to CTRL KO then CTRL KO (=1.0) (n=3 per group). (b) Immunoblot of UXS1 and UGDH protein levels under the KO combinations shown in a. (c) GC-MS quantification of UDPGA in cell-lines subjected to CTRL (gray) or UXS1 KO (pink) at 8 days of transduction (n=3 per group). (d) Relative viability of A549 UXS1 iKO cells grown in media containing increasing glucose concentrations. Values are relative to uninduced cells grown in media containing 25 mM glucose (=1.0) (n=3 per condition). (e) GC-MS quantification of UDPGA (blue; left Y axis) and relative viability (red; right Y axis) of A549 cells treated with increasing concentrations of UDPGA, showing dose-dependent increase in UDPGA and accompanying decrease in viability (n=3 per group). (f) Viability of H838 cells overexpressing either blank vector (gray) or UGDH (red) then subjected to CTRL or UXS1 KO. Values are relative to blank vector overexpressing, CTRL KO cells (=1.0) (n=3 per group). (g) Immunoblot of UXS1 and UGDH protein levels under the OE/KO combinations shown in c; LE indicates low exposure, HE indicates high exposure. (h) Relative UDPGA produced [M+6 UDPGA / (M+6 UDP-glucose/ total UDP-glucose)] in control, UGDH KO, and UXS1 KO A549 cells (n=3 per group). (i) Labelled UDP-glucose (M+6) in control and UXS1 KO A549 cells (<1h) (n=3 per group). (j) Unlabelled UDP-glucose (M+0) in control and UXS1 KO A549 cells (<1h) (n=3 per group). (k) Total UDP-glucose (M+6 + M+0) in control and UXS1 KO A549 cells (<1h) (n=3 per group). (l) Fractional labeling of UDP-glucose [M+6 UDP-glucose/ total UDP-glucose] of control and UXS1 KO cells (<1h) (n=3 per group). Data are shown as mean ± s.d. a, c-f, i, Two-tailed unpaired Student’s t-test. P values from left to right in a: p=0.002, p=0.0001. p=7.9E-06, c: p=0.52, p=0.006, p=0.013, d: p=0.0006, p=0.015, e: (UDPGA) p=0.016, p=0.035, p=0.0001, (viability) p=0.0007, p=0.0008, p=3.14E-05 f: p=0.001, p=0.011, p=0.001 (n.s.: not significant, *p<0.05, **p<0.01, ***p<0.001, ****p<0.0001).
Extended data Figure 4. Downstream proteoglycan impact of UGDH and UXS1 KO.

(a) Sulfated glycosaminoglycans (sGAG) levels quantified using DMMB assay (Methods) from UGDH KO, UXS1 KO, and UGDH-UXS1 DKO A549 cells and in (b) DLD1 cells (n=3 per group). (c) Hyaluronic acid levels quantified via competitive ELISA (Methods) from the conditioned media obtained from UGDH KO, UXS1 KO, and UGDH-UXS1 DKO A549 cells and in (d) DLD1 cells (n=3 per group). Data are shown as mean ± s.d. a-d, Two-tailed unpaired Student’s t-test. P values from left to right in a: p=0.024, p=0.019, p=0.028, p=0.012, p=0.031, b: p=0.337, p=0.145, p=0.117, p=0.098, p=0.137, c: p=0.479, p=0.19, p=0.015, p=0.018, p=0.027, d: p=0.492, p=0.71, p=0.004, p=0.002, p=0.004 (n.s.: not significant ,*p<0.05, **p<0.01).
Extended data Figure 5. Additional details of Golgi stress, altered glycosylation, and signaling/cell cycle changes following UXS1 ablation.
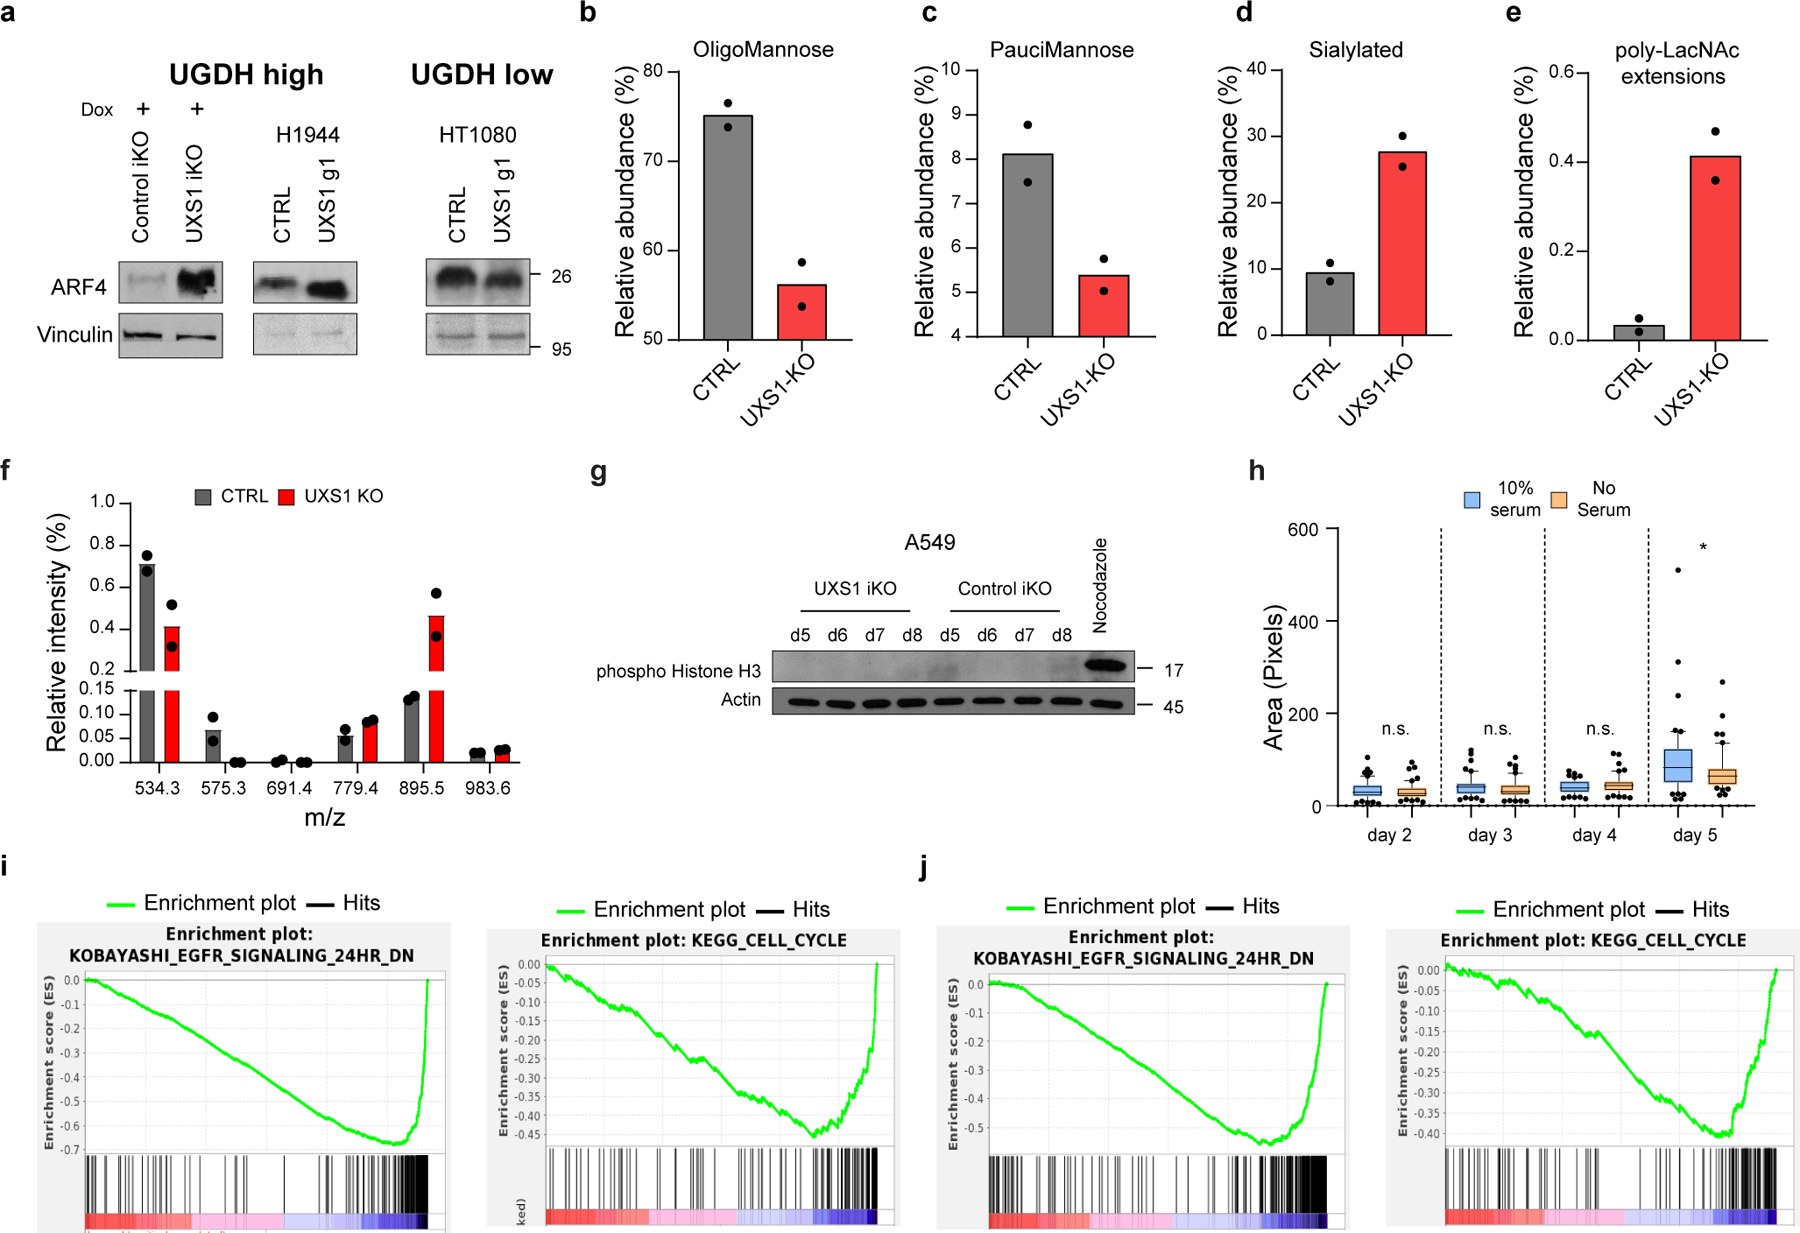
(a) ARF4 immunoblots in UGDH high (UXS1 (A549) iKO and H1944) and low (HT1080) cells, 7 days post UXS1 KO, showing that ARF4 is only induced only in UGDH high cells following UXS1 ablation. (b) Changes in Oligomannose glycans (c) Paucimannose glycans (d) Sialylated glycans and (e) glycans with poly-LacNac extensions in A549 cells subjected to CTRL or UXS1 KO (n=2 per group). (f) O-glycan profiling analysis performed on A549 cells subjected to CTRL or UXS1 KO at 7d post-transduction (n=2 per group). (g) Immunoblots of phospho-histone H3 and actin from A549 UXS1 iKO and control iKO cells at indicated timepoints post doxycycline induction. Nocodazole-treated cells are used as a positive control for enrichment for cells in M phase. (h) Dot plot of total Golgi area per cell, from A549 UXS1 iKO cells induced via doxycycline, then labeled using GM130 at indicated days post-induction. No serum (orange) cells were serum starved for 12 hours before labeling, which results in G0 cell cycle arrest and synchronization. p values from left to right are p=0.48, p=0.21, p=0.15, p=0.044. (i) GSEA enrichment plot showing that EGFR signaling and Cell Cycle genesets are highly depleted in UXS1 KO A549 cells compared to CTRL KO (n=50 cells per group). (j) Same findings in another UXS1 sensitive cell line (H460). Cell Cycle genes are the most depleted geneset for ‘C2; canonical pathways’ (as shown in Figure 3A), while EGFR Signaling genes are the most depleted geneset for the ‘C2; chemical and genetic perturbations’ ontology scheme. Data are shown as mean ± s.d. except in h where box plot shows median (centre) with interquartile range of 25% to 75%, minima and maxima. h, Two-tailed unpaired Student’s t-test. (n.s.: not significant, *p<0.05).
Extended Data Figure 6. Additional details of golgi and ER morphology, and EGFR localization after UXS1 ablation.
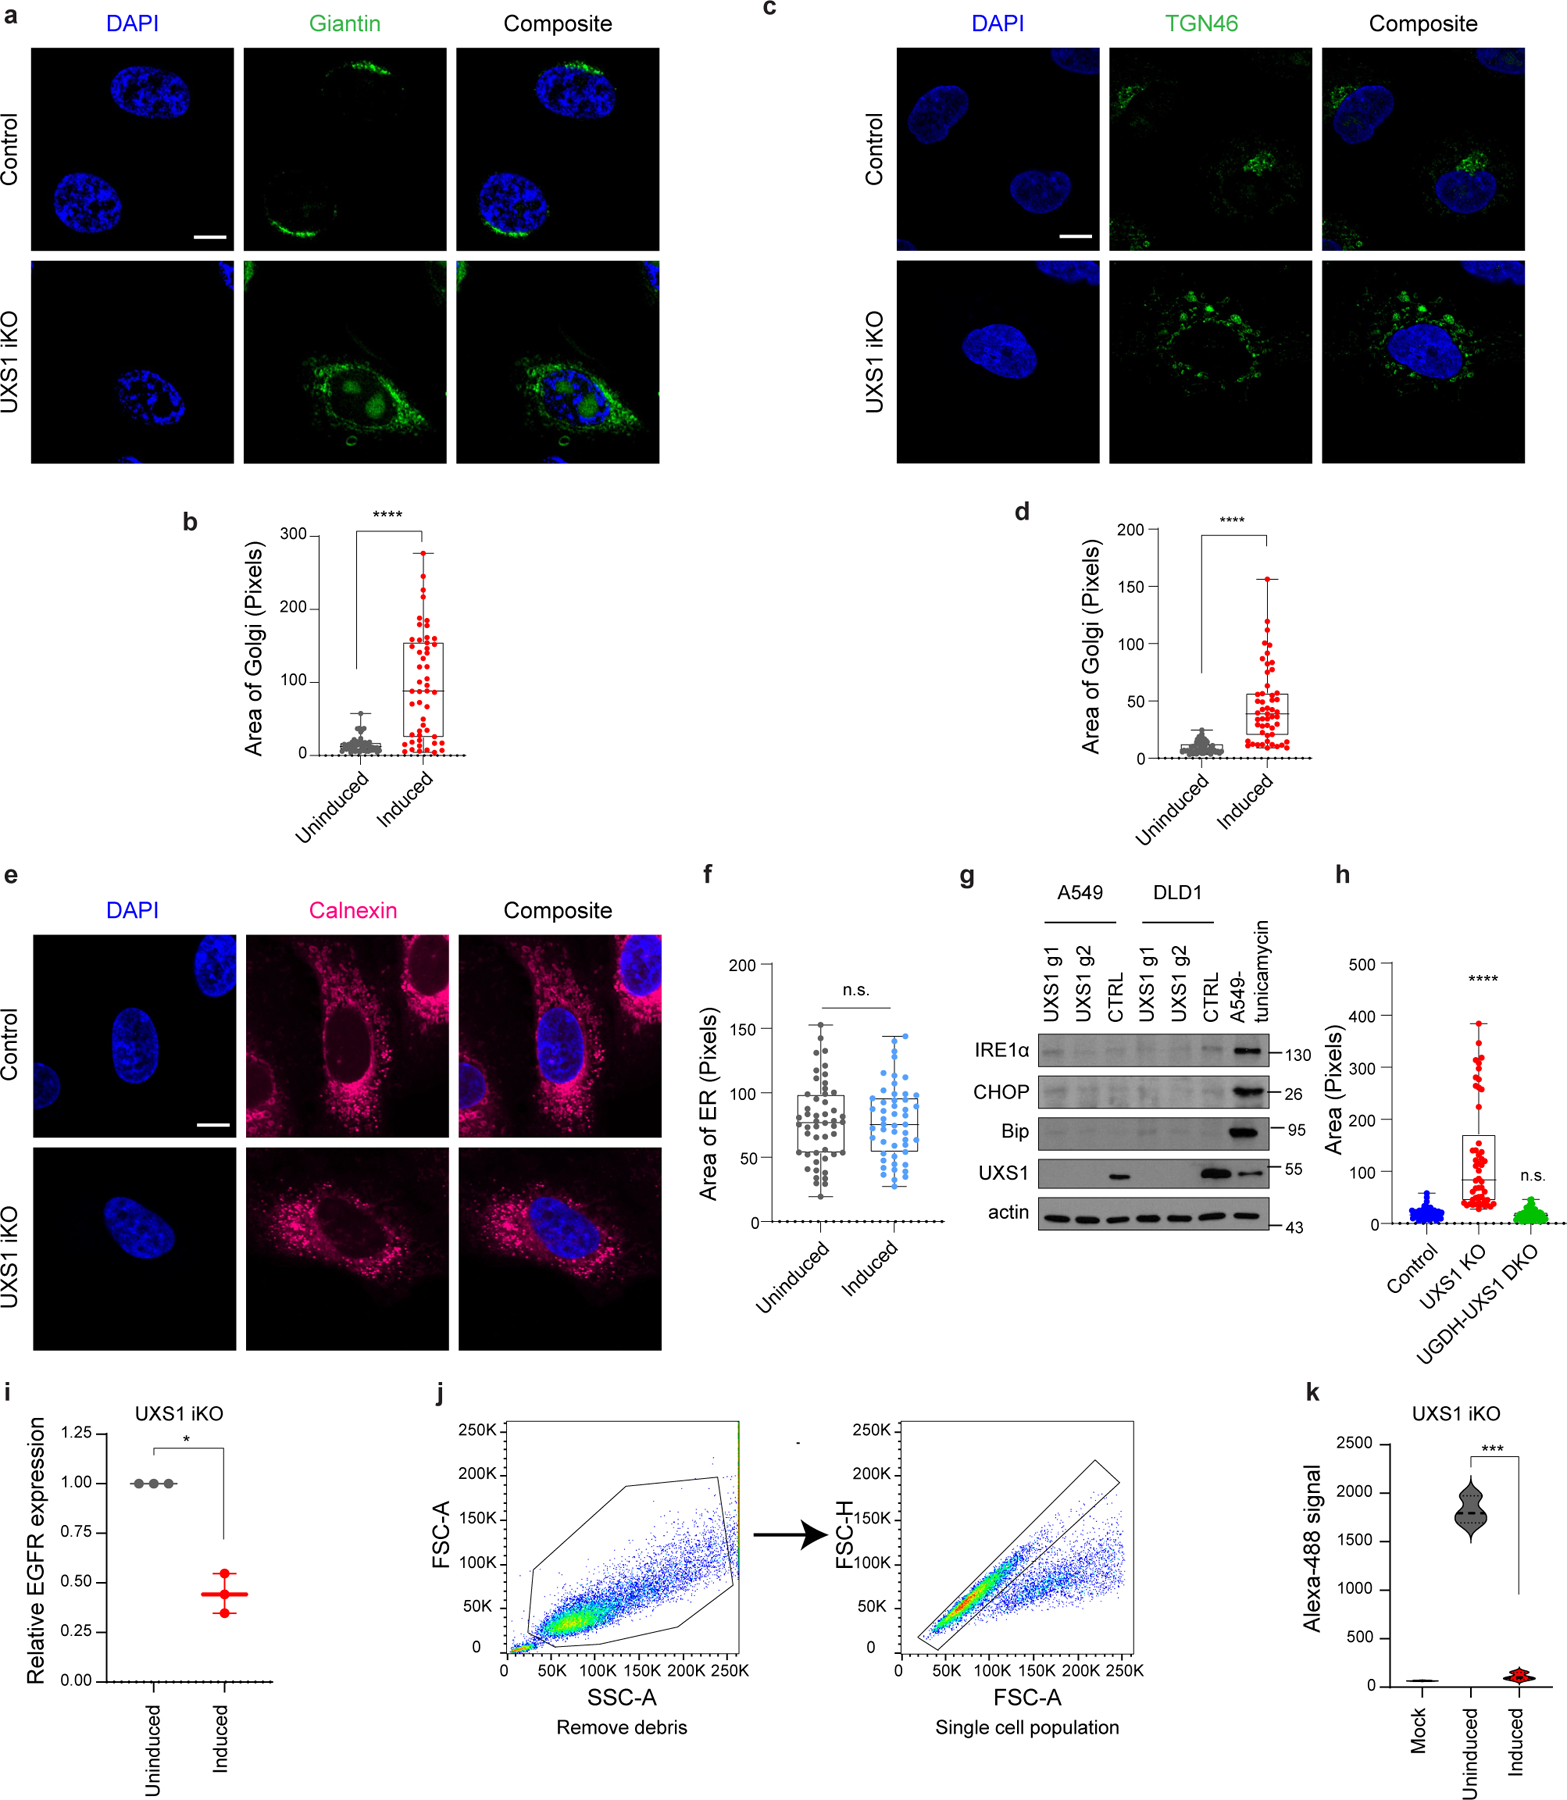
(a) Immunofluorescent images of UXS1 iKO or control iKO cells, 7 days post doxycycline induction, immunostained with Giantin (medial-golgi, green), (c) TGN46 (trans-golgi, green), or (e) Calnexin (ER, red); scale bar=20 µm. (b) Dot plot of total golgi area per cell from uninduced and induced UXS1 iKO cells at 7 days postinduction, as labeled with Giantin, (d) TGN-46, or (f) Calnexin (n=50 cells for each group). (g) Immunoblot for ER stress markers IRE1α, CHOP, and BiP in A549 and DLD1 UXS1 KO cells 7 days post transduction. Tunicamycin treated cells are positive control for ER stress. (h) Dot plot of total golgi area per cell, labeled using GM130, from control, UXS1 KO, and UGDH-UXS1 DKO (A549) cells, 7 days post UXS1 transduction; n=50 cells per group. (i) Quantification of relative actin-normalized EGFR expression (immunoblots from 3 independent experiments) in induced compared to uninduced UXS1 iKO A549 cells, 5d postinduction. In each experiment, the uninduced EGFR = 1.0. (j) Gating strategy for EGFR cell surface quantitation analysis. Cells were first gated by forward (FSC-A) and side scatters (SSC-A) to remove cell debris, then by forward scatter area (FSC-A) and height (FSC-H) to select for single cells before plotting histograms for FITC channel. Example gating strategy is shown for UXS1 iKO cells. (k) Quantitation of cell surface EGFR labeling via 3 independent flow cytometry experiments. Data are shown as mean ± s.d. except in b, d, f, h where box plot shows median (centre) with interquartile range of 25% to 75%, minima and maxima. b, d, f, h, i, k, Two-tailed unpaired Student’s t-test. P values from left to right in b: p=3.59E-10 in d: p=2.94E-10 in f: p=0.95 in h: p= 1.96E-09, p=0.285 in i: p=0.011 in k: p=0.001 (n.s.: not significant, *p<0.05, ***p<0.001, ****p<0.0001).
Extended Data Figure 7. UDPGA accumulation occurs in cytosol and overexpression of SLC35D1 does not impact toxicity of UXS1 KO.
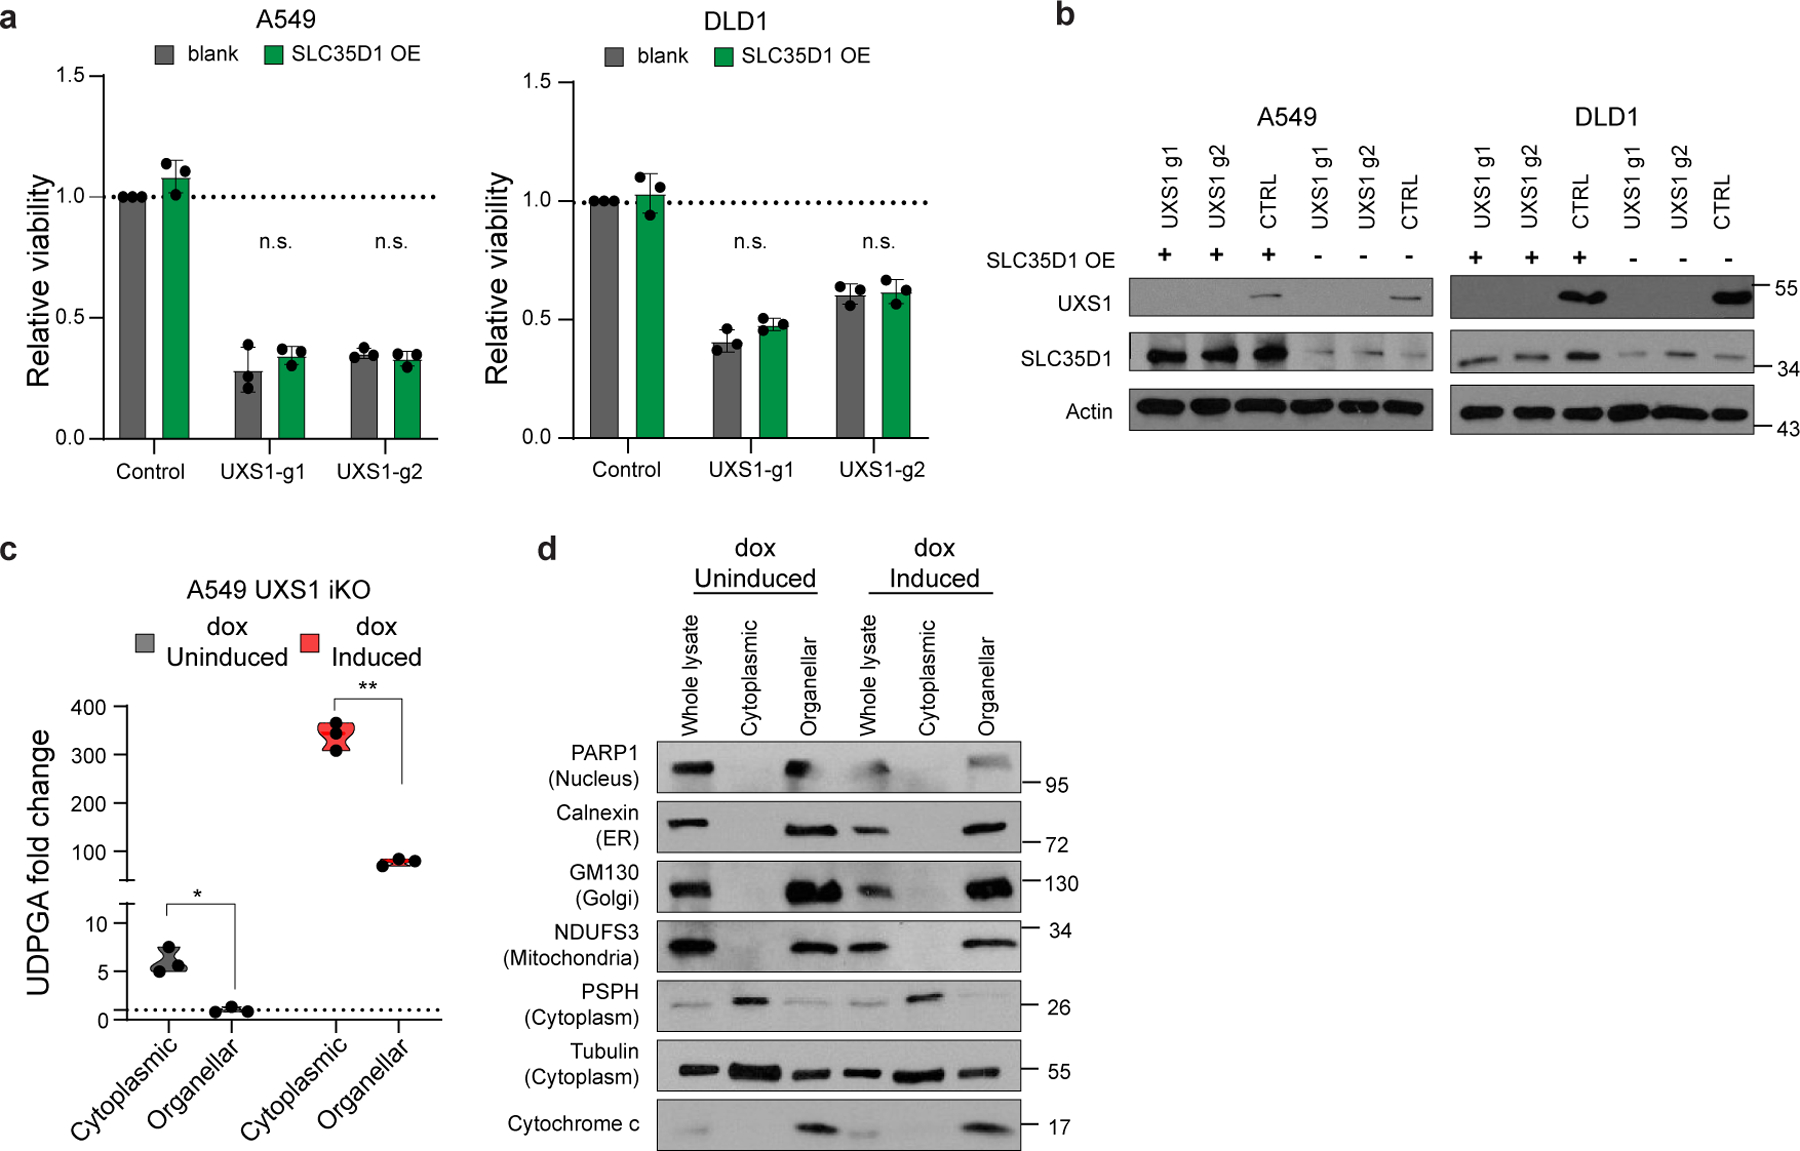
(a) Viability of A549 and DLD1 cells overexpressing either blank vector (gray) or SLC35D1 (dark green) then subjected to CTRL or UXS1 KO. Values are relative to blank vector overexpressing, CTRL KO cells (=1.0) (n=3 per group). (b) Immunoblot of UXS1 and SLC35D1 protein levels under the OE/KO combinations shown in a. (c) GC-MS UDPGA quantitation of cytoplasmic and organellar fractions of either induced or uninduced A549 UXS1 iKO cells (n=3 per group). (d) Immunoblots of proteins located in nucleus (PARP1), ER (Calnexin), Golgi (GM130), mitochondria (NDUFS3), and cytoplasm (PSPH and tubulin) in cytosolic and organellar fractions. Cytochrome c is used as a control for intact organelles (mitochondria). Data are shown as mean ± s.d. a, c, Two-tailed unpaired Student’s t-test. P values: from left to right in a: p=0.391, p=0.379, p=0.792, p=0.106 in c: p=0.018, p=0.002 (n.s.: not significant, *p<0.05, **p<0.01).
Extended Data Figure 8. Additional in-vivo data.
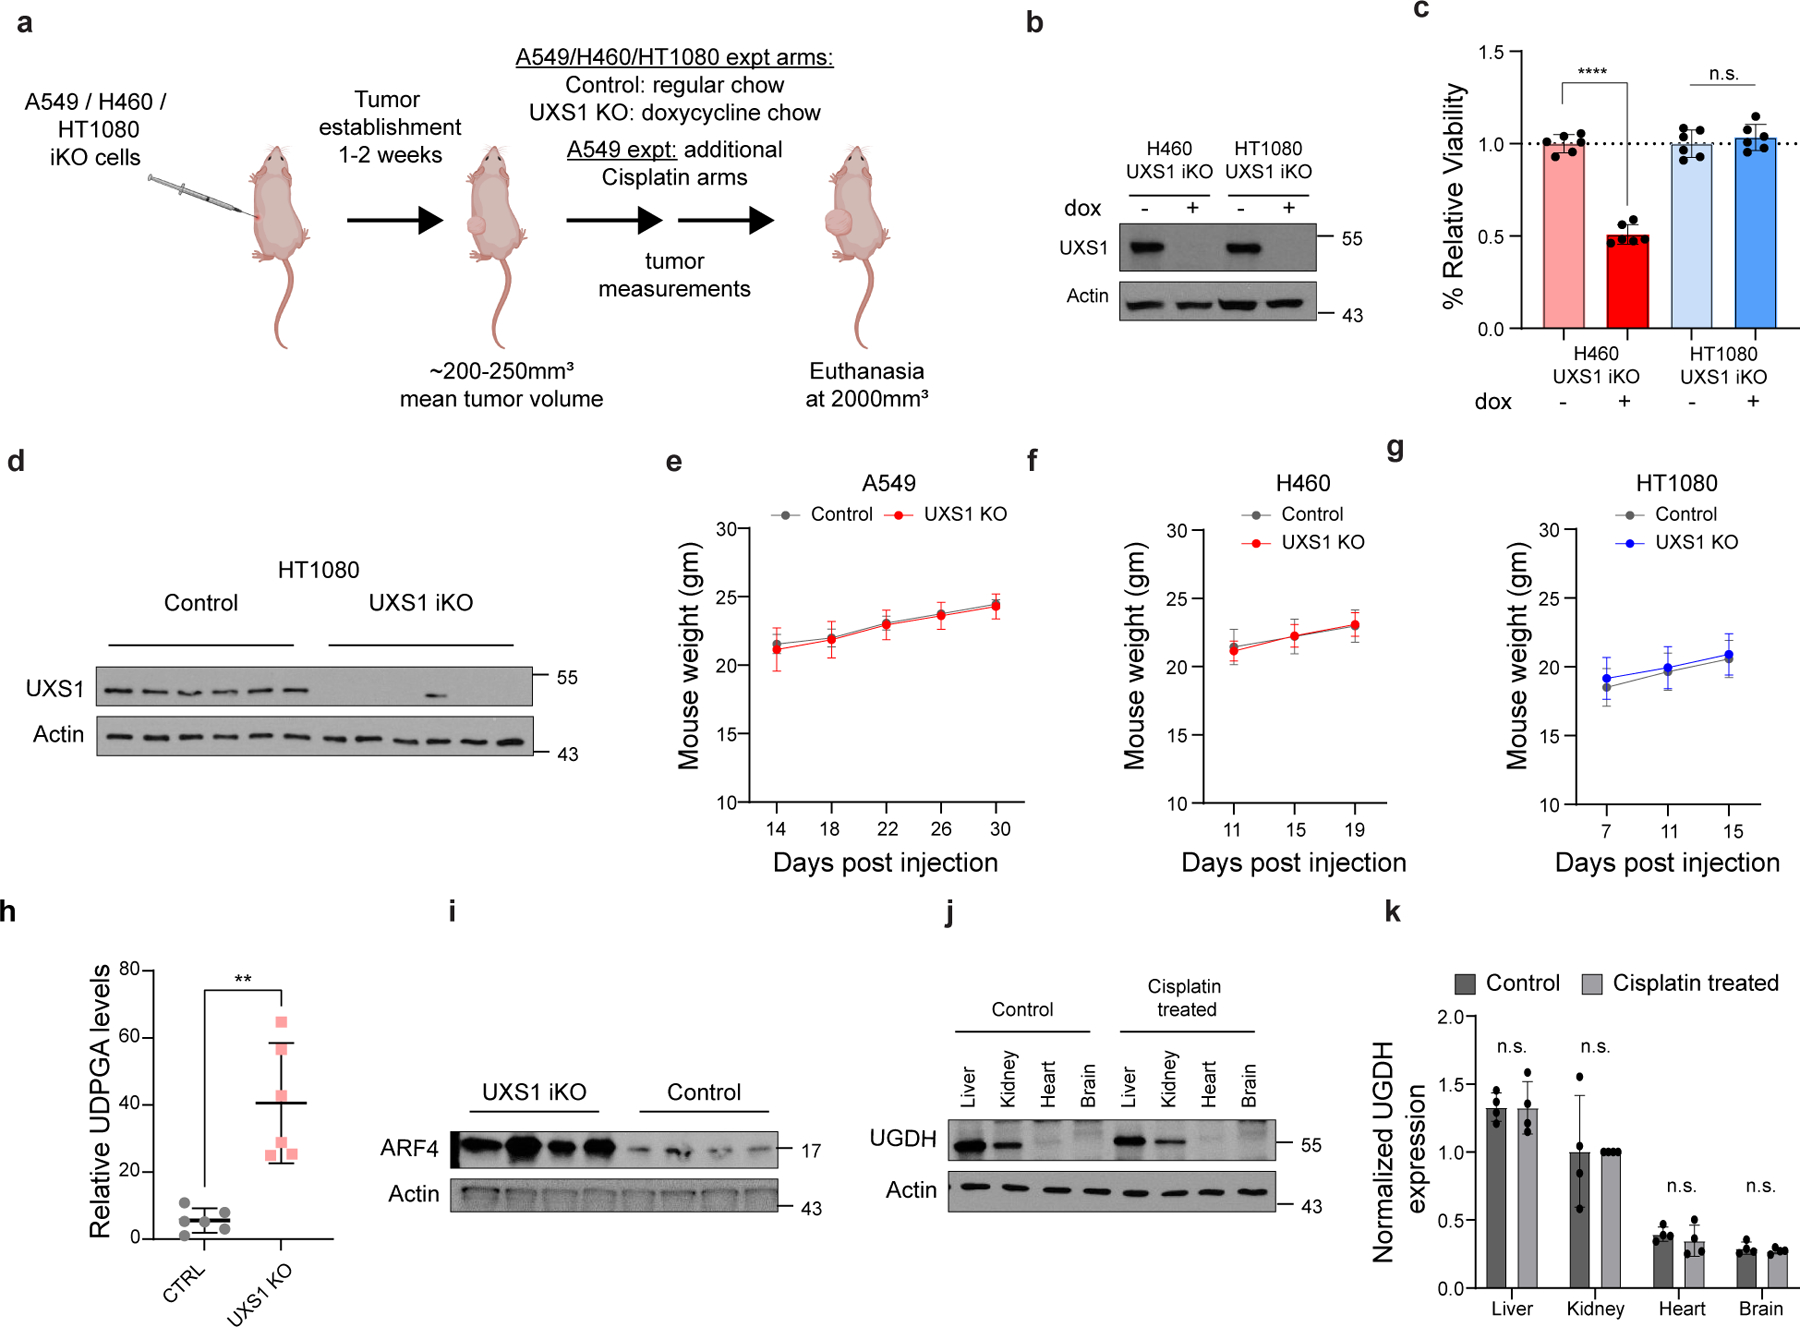
(a) Schematic of in-vivo xenograft experiments shown in Figs.4 a–f, p. A549/H460/HT1080 UXS1 iKO cells were injected subcutaneously into 6 weeks old nude female mice and allowed for tumors to establish. Once the mean tumor was 200–250mm3, the mice were divided into groups for control (uninduced) and dox chow induction of UXS1 KO. A549 xenograft experiment had additional cisplatin arms. The animals were euthanized when tumor volume reached 2000mm3. (b) Immunoblots for UXS1 and actin of H460 and HT1080 UXS1 iKO cells in culture with and without doxycycline induction. (c) Relative viability of H460 UXS1 iKO and HT1080 UXS1 iKO cells with and without doxycycline induction (without doxycycline = 1.0). Induction consisted of 100ng/ml doxycycline treatment for 48 hours; cells were cultured for 4 more days before measuring viability. (d) Immunoblot for UXS1 and actin in six individual tumors each from the control and UXS1 iKO group of HT1080 UXS1 iKO xenograft experiment. (e) Weight of mice in grams from xenograft experiments of A549, (f) H460, and (g) HT1080 from control and UXS1 iKO arms of the experiment. (h) LC-MS Quantification of UDPGA from endpoint tumors from another A549 iKO cohort where tumors were allowed to form for 17 days, induced for KO, then euthanized at 19 days postinduction (p=0.003). (i) Immunoblot for ARF4 and actin from four individual tumors in panel h. (j) Immunoblot for UGDH and actin from organs harvested from control and cisplatin-treated mice (representative pair shown) treated with the same regimen of cisplatin as in Figure 4n (4mg/kg iv 1x weekly, 3 weeks). (k) Quantitation of relative, actin normalized UGDH band intensities from control and cisplatin-treated mice (n=4 each) with the same regimen. Values are relative to cisplatin-treated kidney in each mouse set at 1.0. Data are shown as mean ± s.d. c, h, k, Two-tailed unpaired Student’s t-test. P values from left to right in c: p=1.34E-08, p=0.44 h: p=0.003 in k: p=0.966, p=0.978, p=0.478, p=0.471. (n.s.: not significant, **p<0.01, ****p<0.0001). a was created using Biorender (https://biorender.com/).
Extended data Figure 9. UGDH is elevated in cancer subsets.
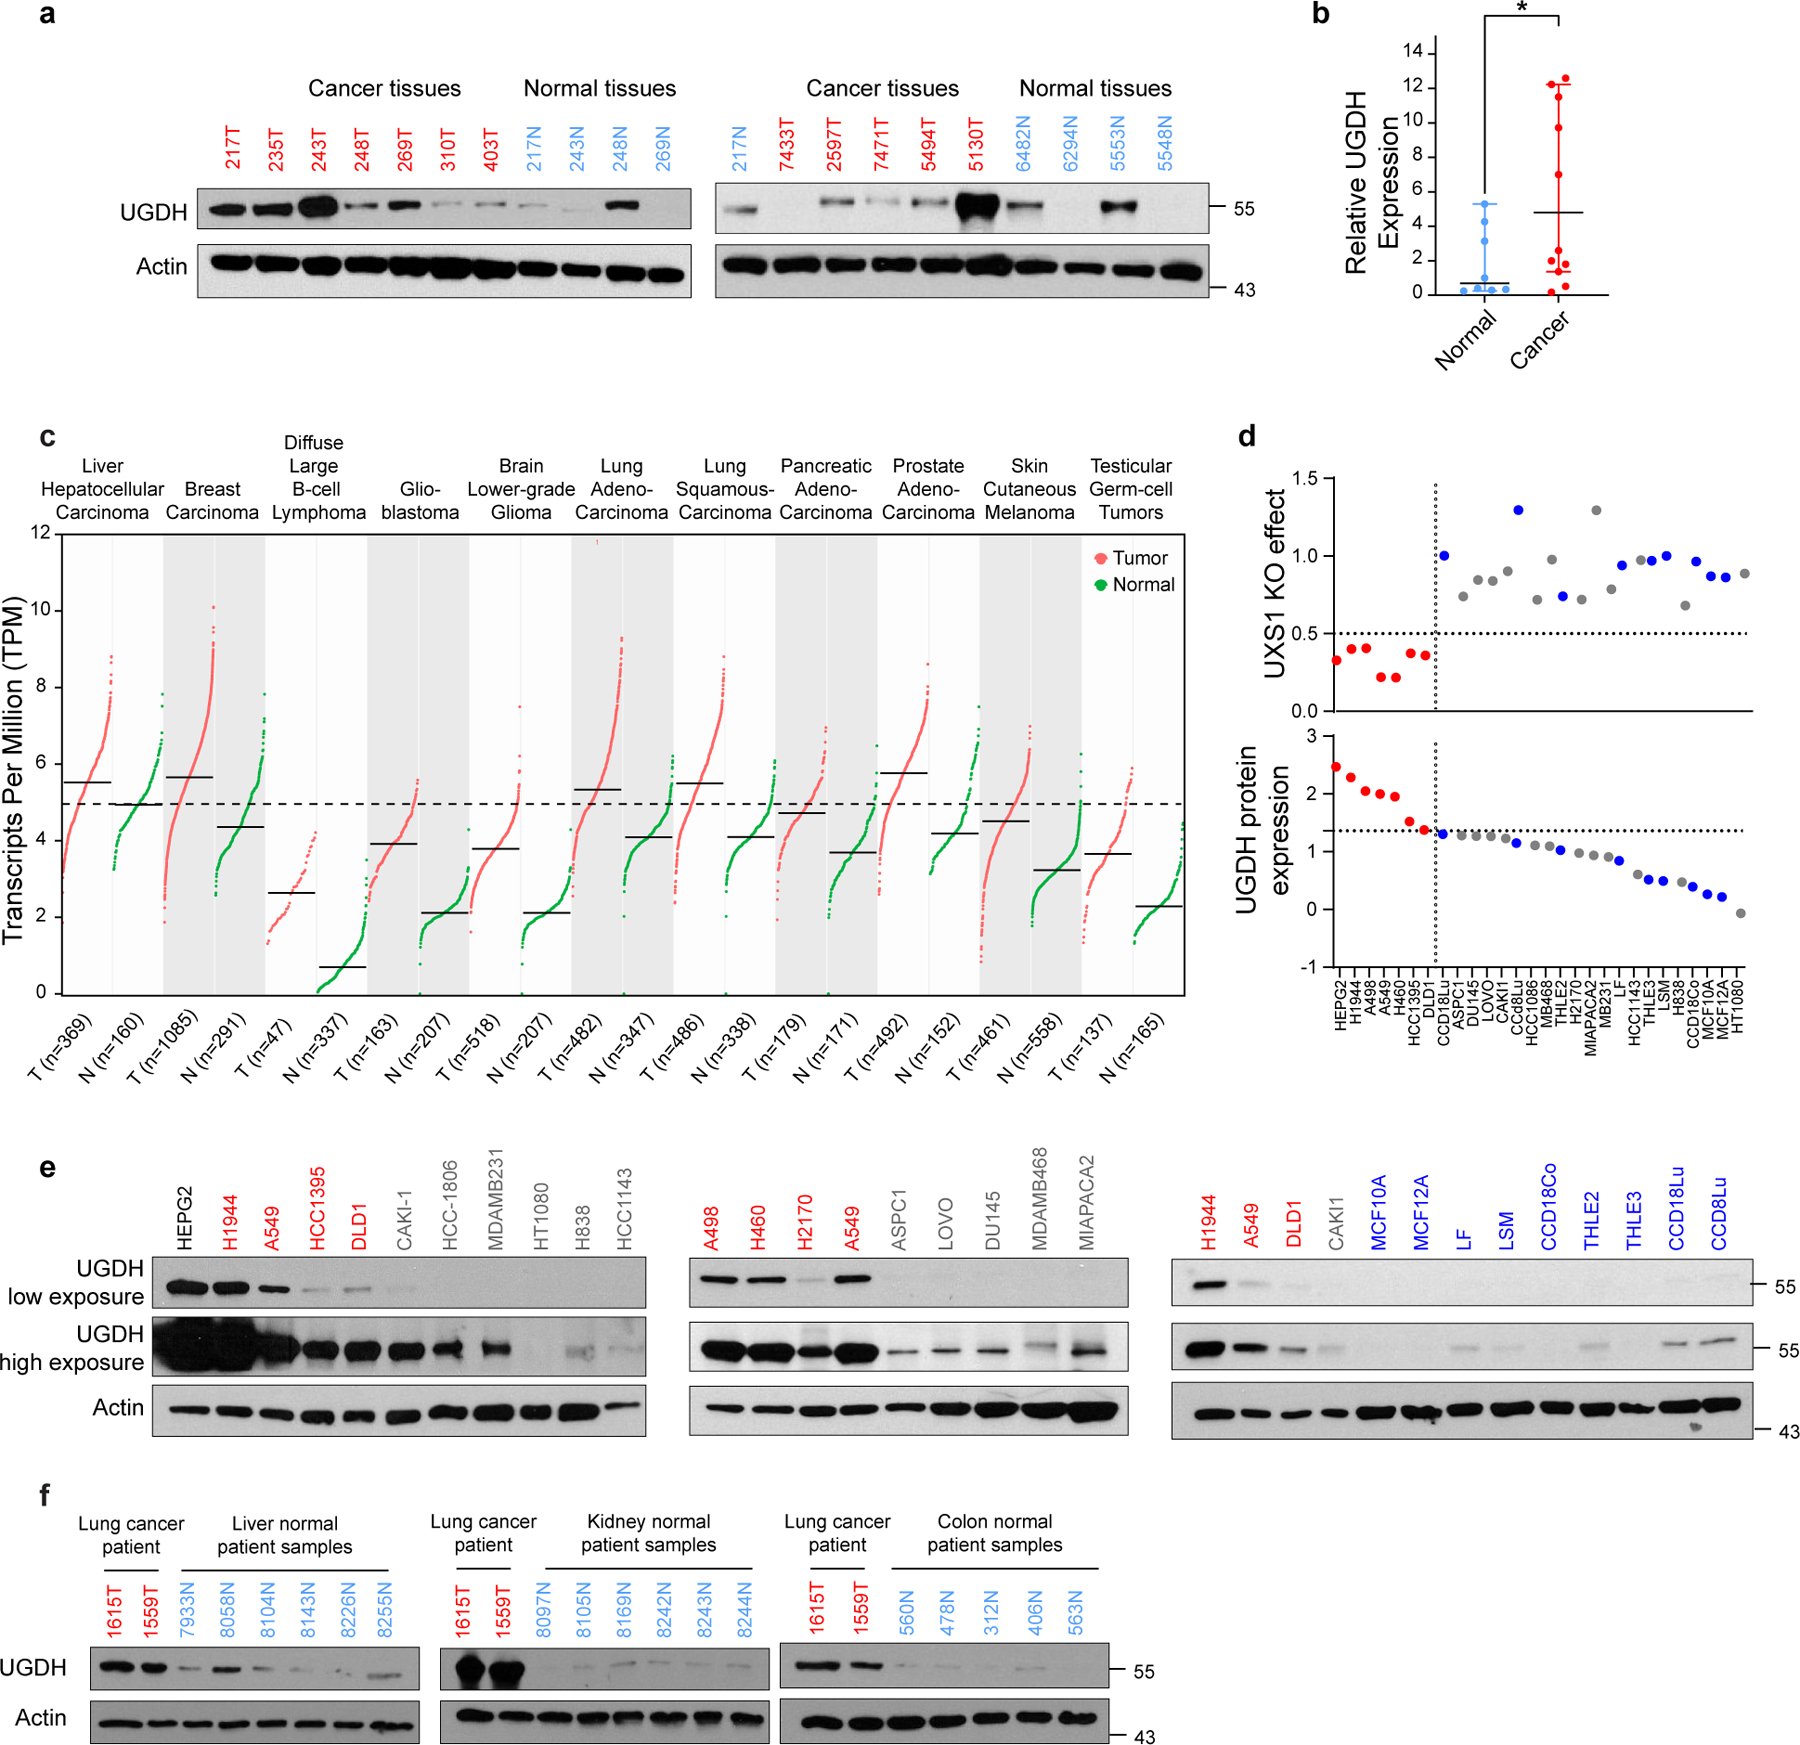
(a) Immunoblots for UGDH and actin from 11 breast cancer patient tissue samples and 8 normal breast tissues; cancer tissues are labeled in red and normal tissues are labeled in blue. Numbers indicate deidentified patient code, and tumors and normals sharing the same number are adjacent samples from the same patient. (b) Quantification of relative, actin normalized UGDH band intensities from panel a (p=0.023). (c) Expression profiles of UGDH in 10 types of normal and tumor tissues. The plot is obtained from GEPIA250, a web gene expression profiling tool that plots normalized mRNA-seq data from patient tumor tissues and normal tissues obtained from TCGA and GTEx. All tumor types shown have over 2-fold UGDH expression in tumors than normal tissues (q value <0.01). q values have been determined by two-way ANOVA and adjusted for false discovery rate. The dotted line indicates mean UGDH TPM of liver normal samples, highest among other normal organs. (d) Top dot plot showing viability following UXS1 KO (y axis) and bottom dot plot showing corresponding UGDH protein expression level (y axis) for 19 cancer and 9 normal cell lines of varying lineage (x axis). Cancer lines are divided between High (red) and Low(gray) UGDH expressing lines based on arbitrary cut-off 1.25 units; normal lines are labeled as blue dots. (e) Immunoblots of UGDH and actin for cancer cell lines and normal cells (non-transformed primary or immortalized cells) shown in Figure 4h and panel d; UXS1 KO sensitive cell lines are labeled in red and insensitive lines are labeled in gray and normal lines are labeled in blue. (f) Immunoblots for UGDH and actin from 6 normal liver, 6 normal kidney and, 5 normal colon patient tissue samples compared with 2 representative (UGDH high) lung cancer patient samples; cancer tissues are labeled in red and normal tissues are labeled in blue. Data shown in b is shown as mean ± s.d. b, Two-tailed unpaired Student’s t-test.
Extended Data Figure 10. Additional chemo-resistance data and RNA interference data for UXS1.
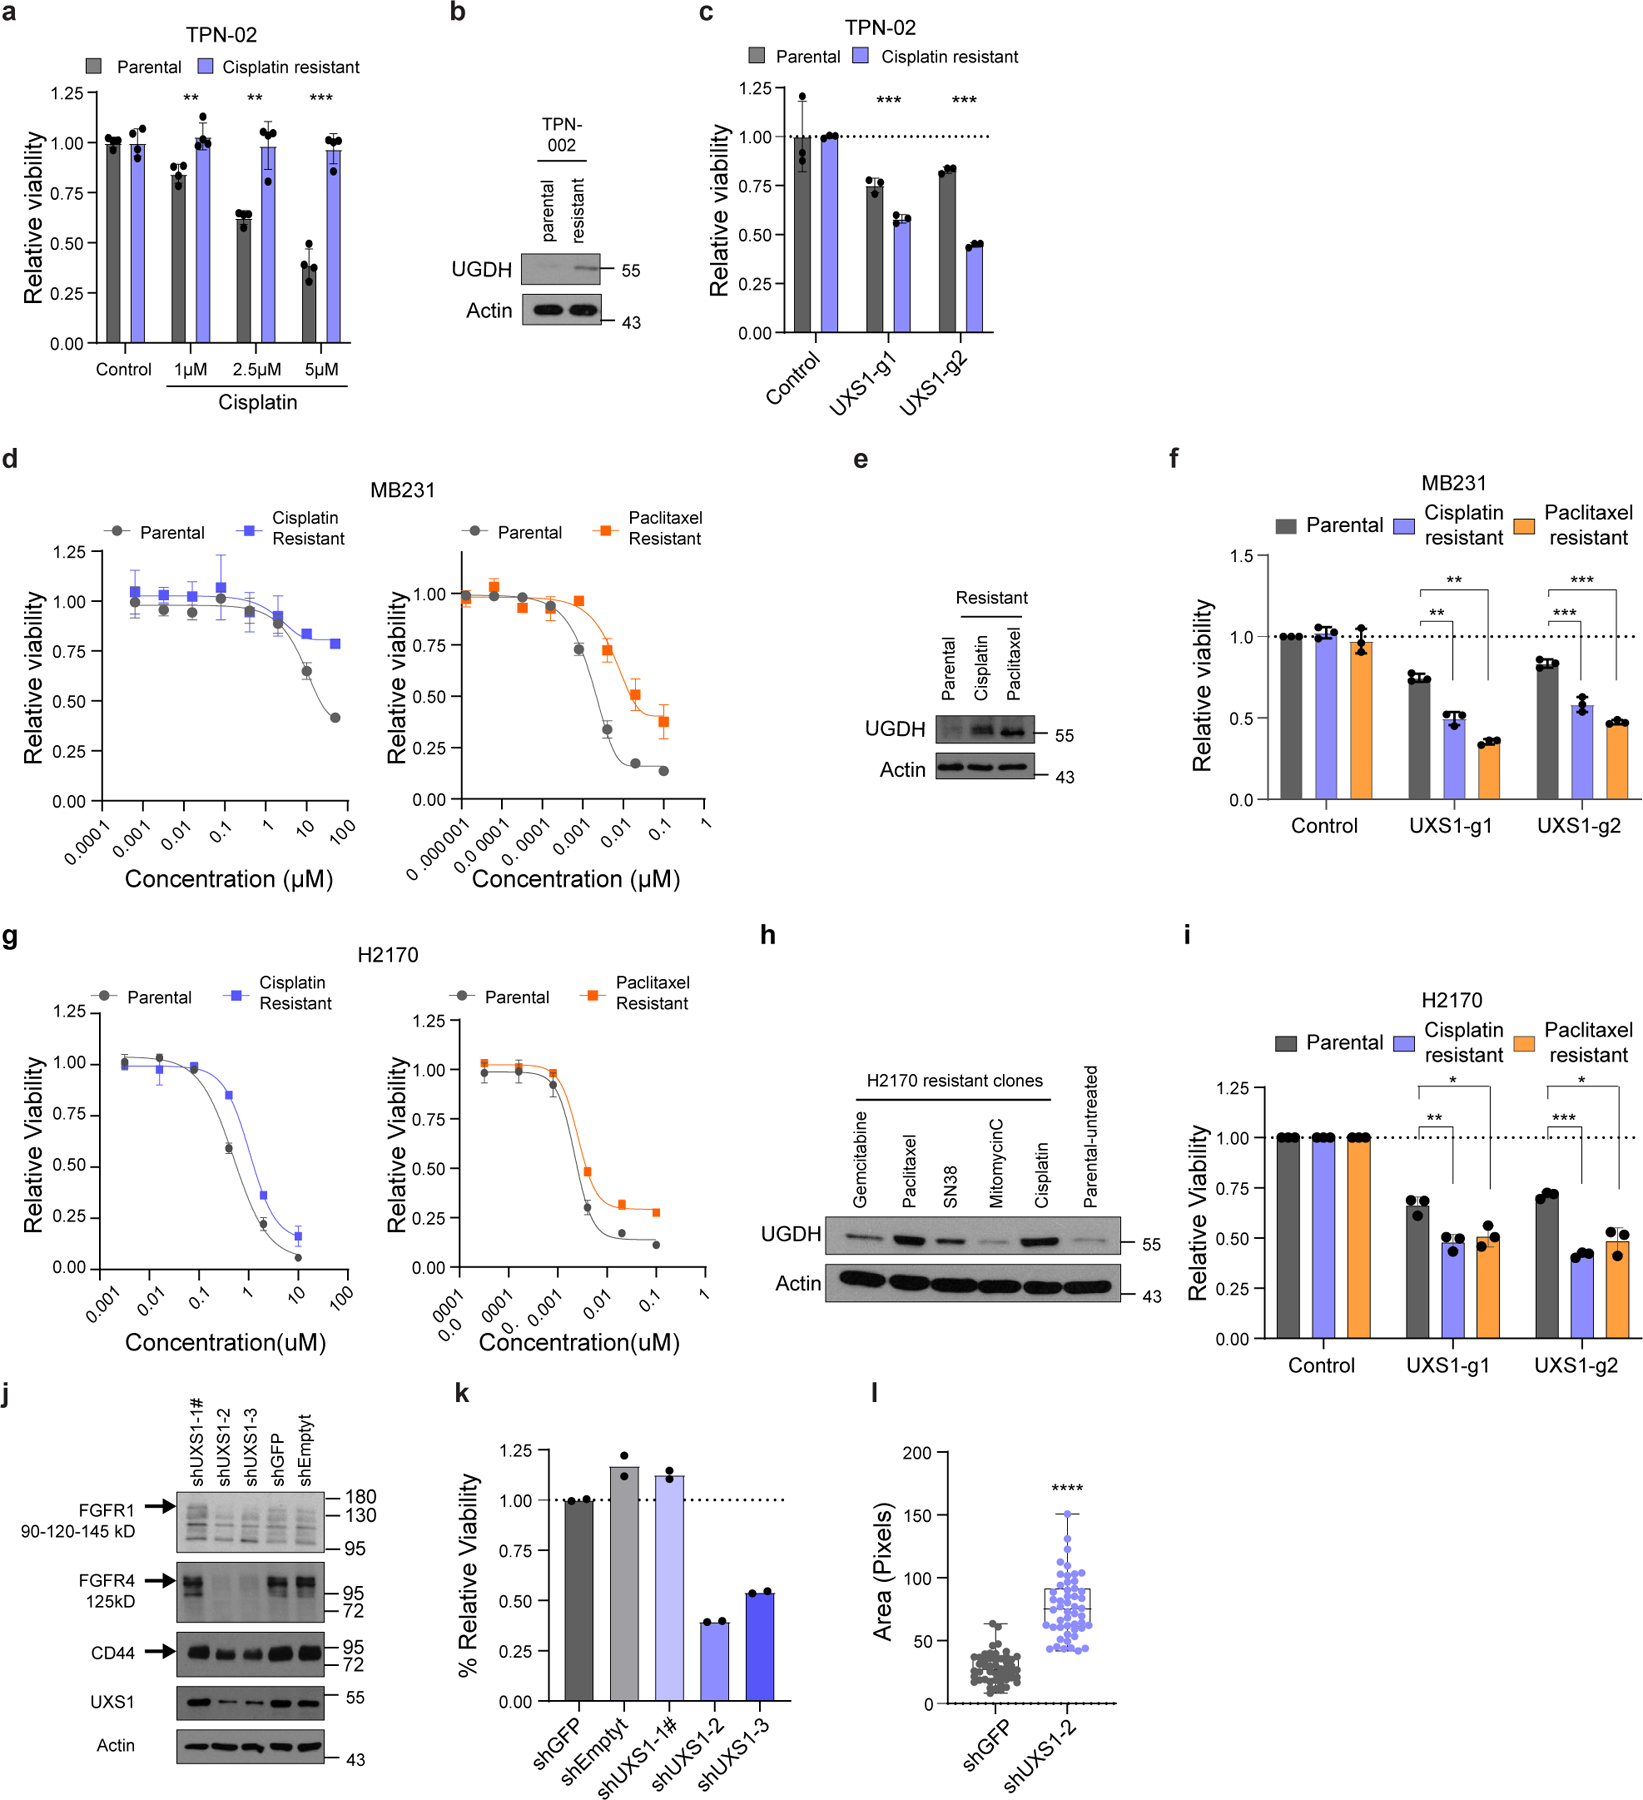
(a) Viability of parental (chemo-sensitive) and chemo-resistant Patient-derived organoid (PDO) TPN-02 subjected to varying doses of cisplatin. (n=3 per group). (b) Immunoblot for UGDH and actin from parental and chemo-resistant PDO TPN-02. (c) Relative viabilities of parental and cisplatin-resistant TPN-02 subjected to UXS1 KO, indicating that cisplatin-resistant organoids are more sensitive to UXS1 loss. Values are relative to parental cells CTRL-KO (=1.0) (n=3 per group). (d) Sigmoidal drug response curves for MDAMB231 parental (gray) and cisplatin-resistant (violet) cells in response to cisplatin treatment and MDAMB231 parental (gray) and paclitaxel-resistant (orange) counterparts in response to paclitaxel (n=3 per group). (e) Immunoblot for UGDH and actin from MDAMB231 parental and drug-resistant counterparts. (f) Relative viabilities of MDAMB231 cisplatin (violet) and paclitaxel (orange) resistant clones subjected to UXS1 KO, indicating that MDAMB231 resistant clones are more sensitive to UXS1 loss. Values are relative to CTRL-KO for each clone (=1.0) (n=3 per group). (g) Sigmoidal drug response curves for H2170 parental (gray) and cisplatin-resistant (violet) cells in response to Cisplatin treatment and H2170 parental (gray) and paclitaxel-resistant (orange) cells in response to paclitaxel (n=3 per group). (h) Immunoblot for UGDH and actin from H2170 parental and drug-resistant clones. (i) Relative viabilities of H2170 cisplatin (violet) and paclitaxel (orange) resistant clones subjected to UXS1 KO, indicating that H2170 resistant clones are more sensitive to UXS1 loss. Values are relative to CTRL-KO for each clone (=1.0) (n=3 per group). (j) Immunoblots for glycoproteins FGFR1, FGFR4, CD44 and UXS1 in A549 cells subjected to RNAi. UXS1 blots indicate that shUXS1-2 and shUXS1-3, but not shUXS1-1, result in effective knockdown of UXS1, # denotes that shUXS1-1 is a poor performing shRNA. (k) Relative viabilities of A549 cells subjected to RNA interference (RNAi) mediated knock-down of UXS1, showing that the two guides which effectively knock down UXS1 result in toxicity (n=2 per group). (l) Dot plot of total golgi area per cell, labeled using GM130, from A549 cells subjected to shGFP or shUXS1-2, 7 days post-transduction; n=50 cells per group. Data are shown as mean ± s.d. except in l where box plot shows median (centre) with interquartile range of 25% to 75%, minima and maxima. a, c, f, i, l, Two-tailed unpaired Student’s t-test. P values from left to right in a p=0.005, p=0.007, p=4.12E-05 in c p=0.006, p=1.13E-05 f p=0.002, p=6.07E-05, p=2.47E-05, p=0.021 in i p=0.006, p=0.019, p=2.4E-5, p=0.021 in l p=4.8E-20. (*p<0.05, **p<0.01, ***p<0.001, ****p<0.0001).
Supplementary Material
Acknowledgments
We would like to thank Melanie Walker, Richard Cummings, Chao Gao, Keith Reddig, and Michael Pacold for expert advice, helpful discussion, and other assistance. We thank David Sabatini, Scot Wolfe, Wen Xue, Michael Green, and Michael Lee for materials, including vectors and cell lines. This work was supported by the Suh Kyungbae Foundation (SUHF) Young Investigator Award and National Institutes of Health (NIH) grant R01CA269711 to D.K.; Mogam Fellowship to N.L. The electron microscopy work was supported by Award Numbers S10OD025113-01, and S10OD021580, from the National Center For Research Resources. O.P. and A.J.M.W. were supported by the NIH grants GM122502 and DK068429. C.J. was funded by Edward Mallinckrodt, Jr. Foundation Award and NIH grant R01AA029124. H.L.G. was supported by NIH grant R50CA221780 and A.M.M. by National Institutes of Health grant R01CA218805. J.B.S. was funded by the Worcester Foundation Grant and the Smith Family Foundation Grant.
Footnotes
Competing interests
M.B.D. and D.K. are listed as authors on a patent application filed by University of Massachusetts Chan Medical School on targeting UXS1 in cancer therapy. All other authors declare no competing interests.
Data Availability Statement
The transcriptomic data included in this study has been deposited to GEO (accession number: GSE240344; https://www.ncbi.nlm.nih.gov/geo/query/acc.cgi?acc=GSE240344). Source data for all figures are provided in the online version of the manuscript. Uncropped westerns are provided in the Supplementary section. Additional raw data and materials that support the findings of the study are available from the corresponding author upon request.
References
- 1.Hanahan D & Weinberg RA Hallmarks of cancer: the next generation. Cell 144, 646–674, doi: 10.1016/j.cell.2011.02.013 (2011). [DOI] [PubMed] [Google Scholar]
- 2.Kim D et al. SHMT2 drives glioma cell survival in ischaemia but imposes a dependence on glycine clearance. Nature 520, 363–367, doi: 10.1038/nature14363 (2015). [DOI] [PMC free article] [PubMed] [Google Scholar]
- 3.Carlisle AE et al. Selenium detoxification is required for cancer-cell survival. Nat Metab 2, 603–611, doi: 10.1038/s42255-020-0224-7 (2020). [DOI] [PMC free article] [PubMed] [Google Scholar]
- 4.Spears ME et al. De novo sphingolipid biosynthesis necessitates detoxification in cancer cells. Cell Rep 40, 111415, doi: 10.1016/j.celrep.2022.111415 (2022). [DOI] [PMC free article] [PubMed] [Google Scholar]
- 5.Lee N, Spears ME, Carlisle AE & Kim D Endogenous toxic metabolites and implications in cancer therapy. Oncogene 39, 5709–5720, doi: 10.1038/s41388-020-01395-9 (2020). [DOI] [PMC free article] [PubMed] [Google Scholar]
- 6.Meyers RM et al. Computational correction of copy number effect improves specificity of CRISPR-Cas9 essentiality screens in cancer cells. Nat Genet 49, 1779–1784, doi: 10.1038/ng.3984 (2017). [DOI] [PMC free article] [PubMed] [Google Scholar]
- 7.Barretina J et al. The Cancer Cell Line Encyclopedia enables predictive modelling of anticancer drug sensitivity. Nature 483, 603–607, doi: 10.1038/nature11003 (2012). [DOI] [PMC free article] [PubMed] [Google Scholar]
- 8.Axelrod J, Kalckar HM, Maxwell ES & Strominger JL Enzymatic formation of uridine diphosphoglucuronic acid. J Biol Chem 224, 79–90 (1957). [PubMed] [Google Scholar]
- 9.Prydz K & Dalen KT Synthesis and sorting of proteoglycans. Journal of cell science 113, 193–205 (2000). [DOI] [PubMed] [Google Scholar]
- 10.Mulder GJ Glucuronidation and its role in regulation of biological activity of drugs. Annu Rev Pharmacol Toxicol 32, 25–49, doi: 10.1146/annurev.pa.32.040192.000325 (1992). [DOI] [PubMed] [Google Scholar]
- 11.Moriarity JL et al. UDP-glucuronate decarboxylase, a key enzyme in proteoglycan synthesis: cloning, characterization, and localization. J Biol Chem 277, 16968–16975, doi: 10.1074/jbc.M109316200 (2002). [DOI] [PubMed] [Google Scholar]
- 12.Kakizaki I et al. A novel mechanism for the inhibition of hyaluronan biosynthesis by 4-methylumbelliferone. J Biol Chem 279, 33281–33289, doi: 10.1074/jbc.M405918200 (2004). [DOI] [PubMed] [Google Scholar]
- 13.Kultti A et al. 4-Methylumbelliferone inhibits hyaluronan synthesis by depletion of cellular UDP-glucuronic acid and downregulation of hyaluronan synthase 2 and 3. Exp Cell Res 315, 1914–1923, doi: 10.1016/j.yexcr.2009.03.002 (2009). [DOI] [PubMed] [Google Scholar]
- 14.Clarkin CE, Allen S, Wheeler-Jones CP, Bastow ER & Pitsillides AA Reduced chondrogenic matrix accumulation by 4-methylumbelliferone reveals the potential for selective targeting of UDP-glucose dehydrogenase. Matrix Biol 30, 163–168, doi: 10.1016/j.matbio.2011.01.002 (2011). [DOI] [PMC free article] [PubMed] [Google Scholar]
- 15.Kjellen L & Lindahl U Proteoglycans: structures and interactions. Annu Rev Biochem 60, 443–475, doi: 10.1146/annurev.bi.60.070191.002303 (1991). [DOI] [PubMed] [Google Scholar]
- 16.Winkler J, Abisoye-Ogunniyan A, Metcalf KJ & Werb Z Concepts of extracellular matrix remodelling in tumour progression and metastasis. Nat Commun 11, 5120, doi: 10.1038/s41467-020-18794-x (2020). [DOI] [PMC free article] [PubMed] [Google Scholar]
- 17.Vitale D et al. Proteoglycans and glycosaminoglycans as regulators of cancer stem cell function and therapeutic resistance. FEBS J 286, 2870–2882, doi: 10.1111/febs.14967 (2019). [DOI] [PubMed] [Google Scholar]
- 18.Neufeld EF & Hall CW Inhibition of Udp-D-Glucose Dehydrogenase by Udp-D-Xylose: A Possible Regulatory Mechanism. Biochem Biophys Res Commun 19, 456–461, doi: 10.1016/0006-291x(65)90146-4 (1965). [DOI] [PubMed] [Google Scholar]
- 19.Gainey PA & Phelps CF Interactions of urdine diphosphate glucose dehydrogenase with the inhibitor urdine diphosphate xylose. Biochem J 145, 129–134, doi: 10.1042/bj1450129 (1975). [DOI] [PMC free article] [PubMed] [Google Scholar]
- 20.Beattie NR, Keul ND, Sidlo AM & Wood ZA Allostery and Hysteresis Are Coupled in Human UDP-Glucose Dehydrogenase. Biochemistry 56, 202–211, doi: 10.1021/acs.biochem.6b01044 (2017). [DOI] [PMC free article] [PubMed] [Google Scholar]
- 21.Reiling JH et al. A CREB3-ARF4 signalling pathway mediates the response to Golgi stress and susceptibility to pathogens. Nat Cell Biol 15, 1473–1485, doi: 10.1038/ncb2865 (2013). [DOI] [PMC free article] [PubMed] [Google Scholar]
- 22.Ignashkova TI et al. Cell survival and protein secretion associated with Golgi integrity in response to Golgi stress-inducing agents. Traffic 18, 530–544, doi: 10.1111/tra.12493 (2017). [DOI] [PubMed] [Google Scholar]
- 23.Hiraoka S et al. Nucleotide-sugar transporter SLC35D1 is critical to chondroitin sulfate synthesis in cartilage and skeletal development in mouse and human. Nat Med 13, 1363–1367, doi: 10.1038/nm1655 (2007). [DOI] [PubMed] [Google Scholar]
- 24.Stanley P Golgi glycosylation. Cold Spring Harb Perspect Biol 3, doi: 10.1101/cshperspect.a005199 (2011). [DOI] [PMC free article] [PubMed] [Google Scholar]
- 25.Varki A Factors controlling the glycosylation potential of the Golgi apparatus. Trends Cell Biol 8, 34–40, doi: 10.1016/s0962-8924(97)01198-7 (1998). [DOI] [PubMed] [Google Scholar]
- 26.Tarentino AL, Gomez CM & Plummer TH Jr. Deglycosylation of asparagine-linked glycans by peptide:N-glycosidase F. Biochemistry 24, 4665–4671, doi: 10.1021/bi00338a028 (1985). [DOI] [PubMed] [Google Scholar]
- 27.Unal ES, Zhao R, Qiu A & Goldman ID N-linked glycosylation and its impact on the electrophoretic mobility and function of the human proton-coupled folate transporter (HsPCFT). Biochim Biophys Acta 1778, 1407–1414, doi: 10.1016/j.bbamem.2008.03.009 (2008). [DOI] [PMC free article] [PubMed] [Google Scholar]
- 28.Contessa JN, Bhojani MS, Freeze HH, Rehemtulla A & Lawrence TS Inhibition of N-linked glycosylation disrupts receptor tyrosine kinase signaling in tumor cells. Cancer Res 68, 3803–3809, doi: 10.1158/0008-5472.CAN-07-6389 (2008). [DOI] [PMC free article] [PubMed] [Google Scholar]
- 29.Ornitz DM & Itoh N The Fibroblast Growth Factor signaling pathway. Wiley Interdiscip Rev Dev Biol 4, 215–266, doi: 10.1002/wdev.176 (2015). [DOI] [PMC free article] [PubMed] [Google Scholar]
- 30.Hakuno F & Takahashi SI IGF1 receptor signaling pathways. J Mol Endocrinol 61, T69–T86, doi: 10.1530/JME-17-0311 (2018). [DOI] [PubMed] [Google Scholar]
- 31.Ouhtit A, Rizeq B, Saleh HA, Rahman MM & Zayed H Novel CD44-downstream signaling pathways mediating breast tumor invasion. Int J Biol Sci 14, 1782–1790, doi: 10.7150/ijbs.23586 (2018). [DOI] [PMC free article] [PubMed] [Google Scholar]
- 32.Normanno N et al. Epidermal growth factor receptor (EGFR) signaling in cancer. Gene 366, 2–16, doi: 10.1016/j.gene.2005.10.018 (2006). [DOI] [PubMed] [Google Scholar]
- 33.Jayaprakash NG & Surolia A Role of glycosylation in nucleating protein folding and stability. Biochem J 474, 2333–2347, doi: 10.1042/BCJ20170111 (2017). [DOI] [PubMed] [Google Scholar]
- 34.Lis H & Sharon N Protein glycosylation. Structural and functional aspects. Eur J Biochem 218, 1–27, doi: 10.1111/j.1432-1033.1993.tb18347.x (1993). [DOI] [PubMed] [Google Scholar]
- 35.Taylor ES, Pol-Fachin L, Lins RD & Lower SK Conformational stability of the epidermal growth factor (EGF) receptor as influenced by glycosylation, dimerization and EGF hormone binding. Proteins 85, 561–570, doi: 10.1002/prot.25220 (2017). [DOI] [PMC free article] [PubMed] [Google Scholar]
- 36.Saha S et al. UDP-glucose 6-dehydrogenase expression as a predictor of survival in patients with pulmonary adenocarcinoma. IJS Oncology 5, e85 (2020). [Google Scholar]
- 37.Hagiuda D et al. Clinicopathological and prognostic significance of nuclear UGDH localization in lung adenocarcinoma. Biomed Res 40, 17–27, doi: 10.2220/biomedres.40.17 (2019). [DOI] [PubMed] [Google Scholar]
- 38.Arnold JM et al. UDP-glucose 6-dehydrogenase regulates hyaluronic acid production and promotes breast cancer progression. Oncogene 39, 3089–3101, doi: 10.1038/s41388-019-0885-4 (2020). [DOI] [PMC free article] [PubMed] [Google Scholar]
- 39.Teoh ST, Ogrodzinski MP & Lunt SY UDP-glucose 6-dehydrogenase knockout impairs migration and decreases in vivo metastatic ability of breast cancer cells. Cancer Lett 492, 21–30, doi: 10.1016/j.canlet.2020.07.031 (2020). [DOI] [PubMed] [Google Scholar]
- 40.Lin LH et al. Targeting UDP-glucose dehydrogenase inhibits ovarian cancer growth and metastasis. J Cell Mol Med 24, 11883–11902, doi: 10.1111/jcmm.15808 (2020). [DOI] [PMC free article] [PubMed] [Google Scholar]
- 41.Tang T et al. A mouse knockout library for secreted and transmembrane proteins. Nat Biotechnol 28, 749–755, doi: 10.1038/nbt.1644 (2010). [DOI] [PubMed] [Google Scholar]
- 42.Vitale DL et al. Initial Identification of UDP-Glucose Dehydrogenase as a Prognostic Marker in Breast Cancer Patients, Which Facilitates Epirubicin Resistance and Regulates Hyaluronan Synthesis in MDA-MB-231 Cells. Biomolecules 11, doi: 10.3390/biom11020246 (2021). [DOI] [PMC free article] [PubMed] [Google Scholar]
- 43.Ahmed N et al. Unique proteome signature of post-chemotherapy ovarian cancer ascites-derived tumor cells. Sci Rep 6, 30061, doi: 10.1038/srep30061 (2016). [DOI] [PMC free article] [PubMed] [Google Scholar]
- 44.Paul D et al. Global proteomic profiling identifies etoposide chemoresistance markers in non-small cell lung carcinoma. J Proteomics 138, 95–105, doi: 10.1016/j.jprot.2016.02.008 (2016). [DOI] [PubMed] [Google Scholar]
- 45.Radominska-Pandya A, Bratton SM, Redinbo MR & Miley MJ The crystal structure of human UDP-glucuronosyltransferase 2B7 C-terminal end is the first mammalian UGT target to be revealed: the significance for human UGTs from both the 1A and 2B families. Drug Metab Rev 42, 133–144, doi: 10.3109/03602530903209049 (2010). [DOI] [PMC free article] [PubMed] [Google Scholar]
- 46.Mackenzie PI et al. Regulation of UDP glucuronosyltransferase genes. Curr Drug Metab 4, 249–257, doi: 10.2174/1389200033489442 (2003). [DOI] [PubMed] [Google Scholar]
- 47.Nagar S & Blanchard RL Pharmacogenetics of uridine diphosphoglucuronosyltransferase (UGT) 1A family members and its role in patient response to irinotecan. Drug Metab Rev 38, 393–409, doi: 10.1080/03602530600739835 (2006). [DOI] [PubMed] [Google Scholar]
- 48.Corsello SM et al. Discovering the anti-cancer potential of non-oncology drugs by systematic viability profiling. Nat Cancer 1, 235–248, doi: 10.1038/s43018-019-0018-6 (2020). [DOI] [PMC free article] [PubMed] [Google Scholar]
- 49.Barger CJ, Branick C, Chee L & Karpf AR Pan-Cancer Analyses Reveal Genomic Features of FOXM1 Overexpression in Cancer. Cancers (Basel) 11, doi: 10.3390/cancers11020251 (2019). [DOI] [PMC free article] [PubMed] [Google Scholar]
- 50.Tang Z et al. GEPIA: a web server for cancer and normal gene expression profiling and interactive analyses. Nucleic Acids Res 45, W98–W102, doi: 10.1093/nar/gkx247 (2017). [DOI] [PMC free article] [PubMed] [Google Scholar]
- 51.Wang T, Wei JJ, Sabatini DM & Lander ES Genetic screens in human cells using the CRISPR-Cas9 system. Science 343, 80–84, doi: 10.1126/science.1246981 (2014). [DOI] [PMC free article] [PubMed] [Google Scholar]
- 52.Sanjana NE, Shalem O & Zhang F Improved vectors and genome-wide libraries for CRISPR screening. Nat Methods 11, 783–784, doi: 10.1038/nmeth.3047 (2014). [DOI] [PMC free article] [PubMed] [Google Scholar]
- 53.Nonnenmacher Y et al. Analysis of mitochondrial metabolism in situ: Combining stable isotope labeling with selective permeabilization. Metab Eng 43, 147–155, doi: 10.1016/j.ymben.2016.12.005 (2017). [DOI] [PubMed] [Google Scholar]
- 54.Vercesi AE, Bernardes CF, Hoffmann ME, Gadelha FR & Docampo R Digitonin permeabilization does not affect mitochondrial function and allows the determination of the mitochondrial membrane potential of Trypanosoma cruzi in situ. J Biol Chem 266, 14431–14434 (1991). [PubMed] [Google Scholar]
- 55.Sachs N et al. A Living Biobank of Breast Cancer Organoids Captures Disease Heterogeneity. Cell 172, 373–386 e310, doi: 10.1016/j.cell.2017.11.010 (2018). [DOI] [PubMed] [Google Scholar]
Associated Data
This section collects any data citations, data availability statements, or supplementary materials included in this article.
Supplementary Materials
Data Availability Statement
The transcriptomic data included in this study has been deposited to GEO (accession number: GSE240344; https://www.ncbi.nlm.nih.gov/geo/query/acc.cgi?acc=GSE240344). Source data for all figures are provided in the online version of the manuscript. Uncropped westerns are provided in the Supplementary section. Additional raw data and materials that support the findings of the study are available from the corresponding author upon request.