

Abstract
Understanding the chemical bonding in the catalytic cofactor of the Mo nitrogenase (FeMo-co) is foundational for building a mechanistic picture of biological nitrogen fixation. A persistent obstacle toward this goal has been that the 57Fe-based spectroscopic data—although rich with information—combines responses from all seven Fe sites, and it has therefore not been possible to map individual spectroscopic responses to specific sites in the 3-D structure. We herein overcome this challenge by incorporating 57Fe into a single site of FeMo-co. Spectroscopic analysis of the resting state informs on the local electronic structure of the terminal (Fe1) site, including its oxidation state and spin orientation, and provides additional insights into the spin-coupling scheme for the entire cluster. The oxidized resting state and the first intermediate in nitrogen fixation, E1, were also characterized, and comparisons with the resting state provide molecular-level insights into redox chemistry at FeMo-co.
Introduction
Nitrogenases catalyze the reduction of N2 to NH3 (Fig. 1A), and, along with the Haber–Bosch process, are responsible for producing the vast majority of the fixed nitrogen that supports life on Earth.1–3 Although the multi-electron, multi-proton generation of NH3 from N2 is thermodynamically feasible under ambient conditions, it is kinetically very challenging because the first step, cleavage of the N≡N triple bond, is so unfavorable. As such, the mechanism of biological N2 fixation—particularly the chemistry that occurs at FeMo-co, the catalytic cofactor of the Mo-nitrogenase isozyme—has been intensively studied for decades.3–8 Foundational to this inquiry is an understanding of FeMo-co’s electronic structure: the distribution and coupling of the valence electrons in the resting state, and how the electronic structure changes throughout the catalytic cycle. However, the sheer number of open-shell metal ions in FeMo-co (seven structurally unique Fe sites and one Mo center9) pushes the limits of computational analysis10–16 and, as described below, presents a number of challenges in its experimental characterization.
Figure 1.
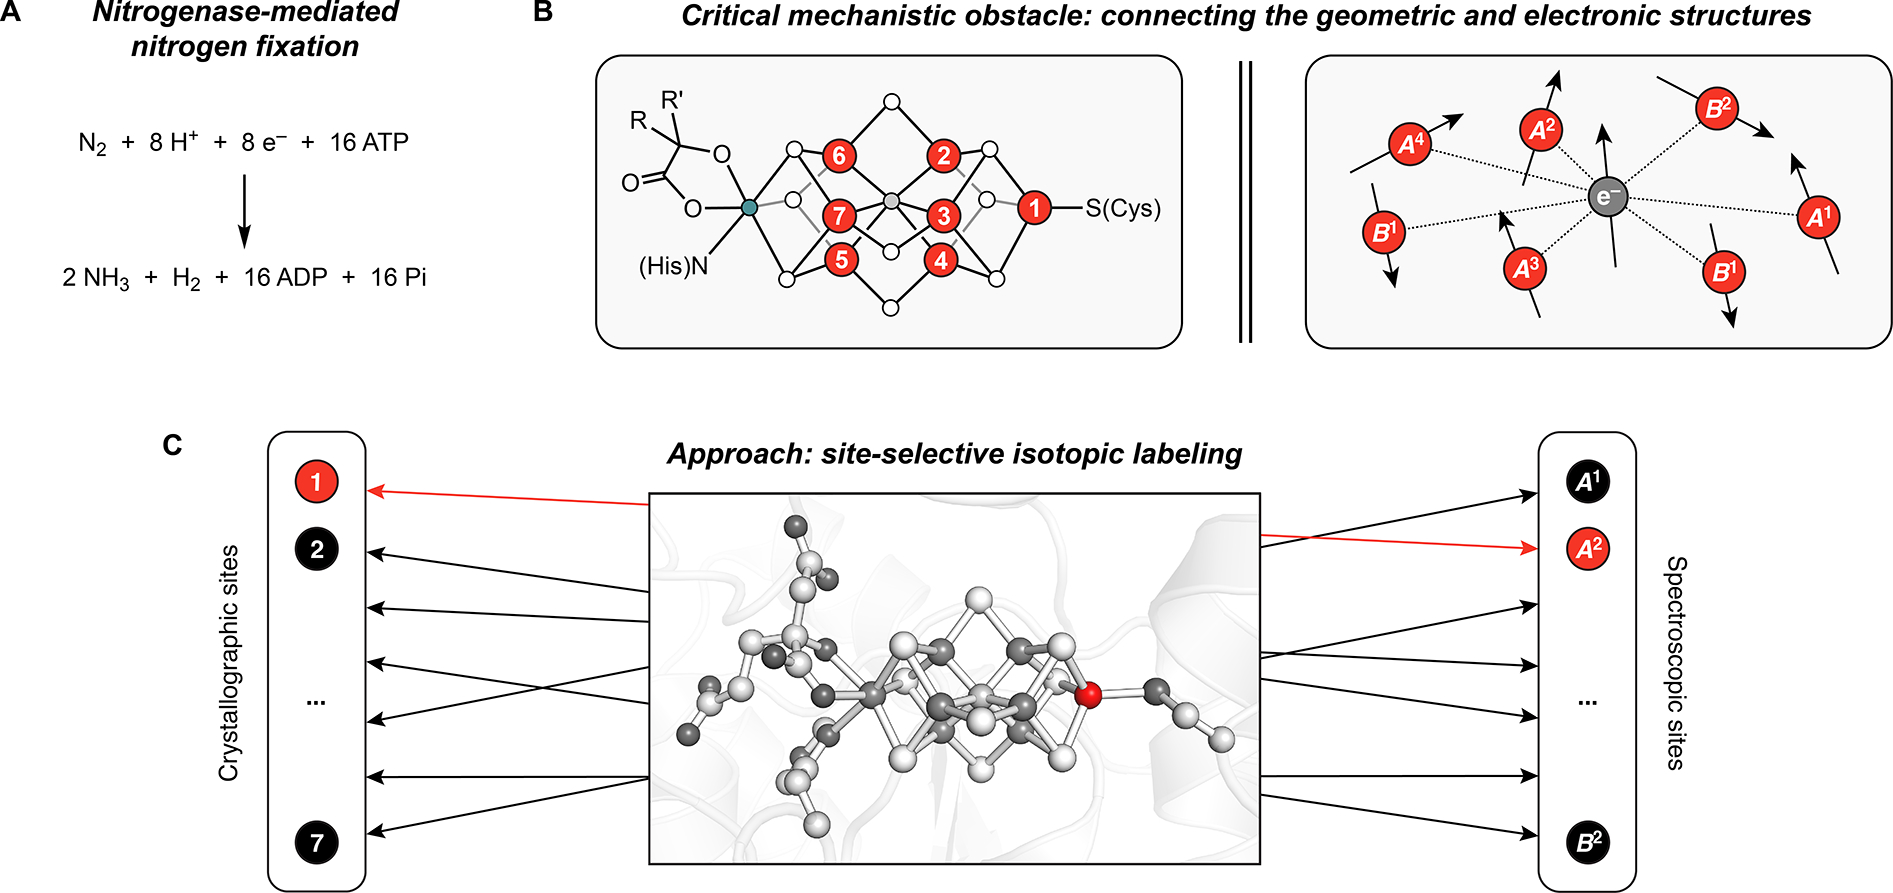
Employing site-selective isotopic labeling to understand the mechanism of biological nitrogen fixation. A) Overall reaction. B) A major challenge in mechanistic studies of nitrogenases is the inability to correlate the spectroscopic data to the geometric structure. Numbers correspond to the crystallographically defined Fe sites (Fe1-Fe7; red circles). Teal, white, and gray circles are Mo, S, and C atoms, respectively. R = −CH2CO2−; R′ = −(CH2)2CO2−; C) Site-selective labeling as a strategy to connect the geometric and electronic structures of FeMo-co. PDB accession code: 3U7Q9
Whereas the Mo center in FeMo-co can be selectively probed using Mo-specific spectroscopic techniques,17–23 the study of the individual Fe centers is more difficult. In particular, the wealth of information contained in the 57Fe Mössbauer and ENDOR spectra—including the Fe oxidation states, the covalency of Fe–S/C and Fe–Fe/Mo interactions, the local spin states, and the orientations of the local spins with respect to the total spin—has been challenging to extract because the 57Fe spectroscopic data cannot be mapped onto the geometric structure (Fig. 1B). Even for the most well-characterized state, the resting state (‘E0,’ with FeMo-co in the ‘MN’ state), it has not been possible to experimentally correlate the crystallographically observed Fe sites (Fe1–Fe7; Fig. 1B/C)9 to the spectroscopically observed 57Fe sites (A1-A4, B1-B2, where the A and B sites have negative and positive aiso, respectively, and the B1 site represents two equivalent Fe centers; Fig. 1B/C).20, 24–26 For 57Fe Mössbauer spectroscopy in particular, these challenges are compounded by poor resolution of the complex set of overlapping signals arising from the seven Fe sites; indeed, at zero-field, the Mössbauer spectrum of the MN state appears as a single, broad quadrupole doublet at temperatures above 20 K.25, 27
Building on prior ENDOR and Mössbauer studies, Yoo and coworkers undertook what still remains the most comprehensive Mössbauer spectroscopic analysis of FeMo-co;25 although this work yielded a working set of Mössbauer parameters that have been widely employed in computational analysis, the authors acknowledge both the difficulties in simulating the Mössbauer data due to the poor resolution and the limitations of their interpretation owing to the inability to assign the spectroscopic features to specific sites in the structure. More broadly, few experimental methods allow for the mapping of the electronic structure of FeMo-co onto its geometric structure,28 and this has been a persistent obstacle in efforts to understand the mechanism of biological nitrogen fixation.
Our strategy for overcoming these challenges is to selectively enrich individual Fe sites of FeMo-co with 57Fe (Fig. 1C). Analysis of such samples would simultaneously overcome issues of poor spectroscopic resolution and provide site-specific information on the chemical bonding at individual Fe centers. We recently reported29 the initial development of this methodology using the L-cluster, an [Fe8S9C] cluster that is a structural analogue and biosynthetic precursor to FeMo-co.30–31 In the present work, we adapt this 57Fe labeling procedure to FeMo-co and show that the terminal site of FeMo-co (Fe1) can be selectively enriched with 57Fe. Characterization of this sample enables determination of the salient 57Fe spectroscopic parameters for a particular Fe site in FeMo-co—the 57Fe Mössbauer isomer shift (δ), the 57Fe Mössbauer quadrupole splitting (ΔEQ), and the 57Fe electron-nuclear hyperfine coupling tensor (A(57Fe)). These findings reveal the Fe1 spin orientation and oxidation state in the MN state, experimentally rule out a large number of potential FeMo-co electronic structures, and test predictions made in prior computational studies. Similar analyses of the oxidized resting state (‘MOX’) and the first intermediate in nitrogen fixation (‘E1’) are performed and discussed in the context of redox chemistry at FeMo-co.
Results and Discussion
Site-selective 57Fe labeling of FeMo-co
Our approach to incorporating 57Fe into the Fe1 site of FeMo-co entailed (1) using reported protocols32 for extracting FeMo-co from the MoFe protein of the Mo nitrogenase (NifDK) into N-methylformamide (NMF); (2) removing the Fe1 site using a chelator; (3) reconstituting the Fe1 site with 57Fe; and (4) reinserting the labeled cofactor into apo-NifDK, a precursor to NifDK that contains the P-cluster but not FeMo-co (see Methods for details). We first studied steps (2) and (3) using EPR spectroscopy (Fig. 2). When poised in the MN state (obtained by incubation with sodium dithionite (DTH)), isolated FeMo-co exhibits a broadened S = 3/2 signal that sharpens in the presence of thiophenol (Fig 2B, Top).33 Previous work demonstrated that treating isolated FeMo-co with ethylenediaminetetraacetate (EDTA) or o-phenanthroline eliminates this signal, a process that can be reversed upon addition of Zn2+ or Fe2+, respectively;34 similarly, we found that adding excess 57Fe2+ (35 equiv) to EDTA-treated FeMo-co (30 equiv of EDTA) recovers the EPR signal (Fig 2B, Bottom), and based on our findings with the L-cluster,29 we hypothesized that this protocol resulted in site-selective 57Fe incorporation into the Fe1 site.
Figure 2.
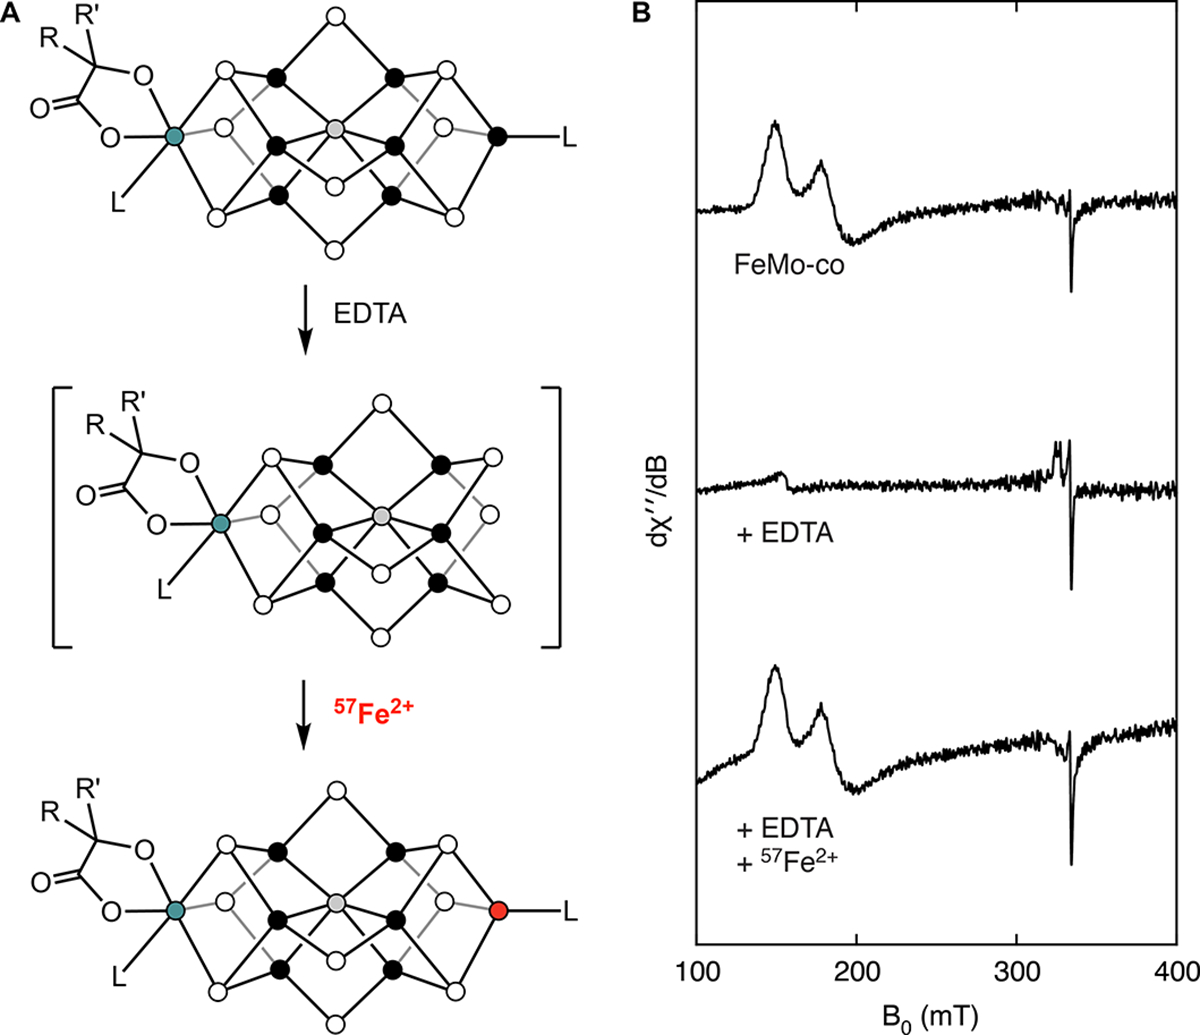
Postbiosynthetic incorporation of 57Fe into FeMo-co. A) The chemical interconversions of isolated FeMo-co. B) Corresponding EPR spectra recorded at 9.37 GHz, 5 K, and 1 mW. All EPR samples have been incubated with DTH (2 mM) and PhSH (2 mM).
Encouraged by these results, we prepared NifDK samples with 57Fe in either the Fe1 site or the six belt sites (Fe2-Fe7), as well as the control sample with 57Fe in all seven sites (Fe1-Fe7) (see Methods and the SI for details). The control sample was generated by isolating FeMo-co (M(57Fe7)) from fully 57Fe-labeled NifDK, incubating the cofactor with the crude lysate from DJ1143 cells (an Azotobacter vinelandii strain that produces His-tagged apo-NifDK), and purifying the resulting holo-NifDK–M(57Fe7). The 80 K Mössbauer spectrum of NifDK–M(57Fe7) in the MN state is consistent with previous reports23, 25, 27, 33 and appears as a quadrupole doublet with an average isomer shift (δavg) of 0.39 mm s−1, reflecting the overlapping signals from the seven Fe sites (vide infra).
We subsequently generated the site-selectively labeled samples: NifDK–M(57Fe6), from treating fully 57Fe-labeled FeMo-co with EDTA followed by natural-abundance Fe2+, and NifDK–M(57Fe1), from treating natural-abundance FeMo-co with EDTA followed by 57Fe2+ (Fig. 3A). These samples, as well as NifDK–M(57Fe7), show full C2H2 reduction activity (SI Table 20) and cleanly exhibit the S = 3/2 EPR signal of native Mo-nitrogenase resting state (Fig. 3B), demonstrating that our postbiosynthetic EDTA/Fe2+ treatment affects neither FeMo-co’s structure, composition, nor competency for reinsertion into apo-NifDK to generate active, holo-NifDK. ICP-MS analysis of the 56/57Fe content of the NifDK–M(57Fe1) sample indicates nearly quantitative labeling efficiency (~90% assuming complete site-selectivity for the Fe1 site; see SI Fig. 2 and SI page 5 for further discussion). As discussed next, the essentially quantitative site-selectivity of 57Fe labeling is evident in both the Mössbauer and ENDOR spectra of these samples when poised in the MN state (Fig. 3C and 3D).
Figure 3.
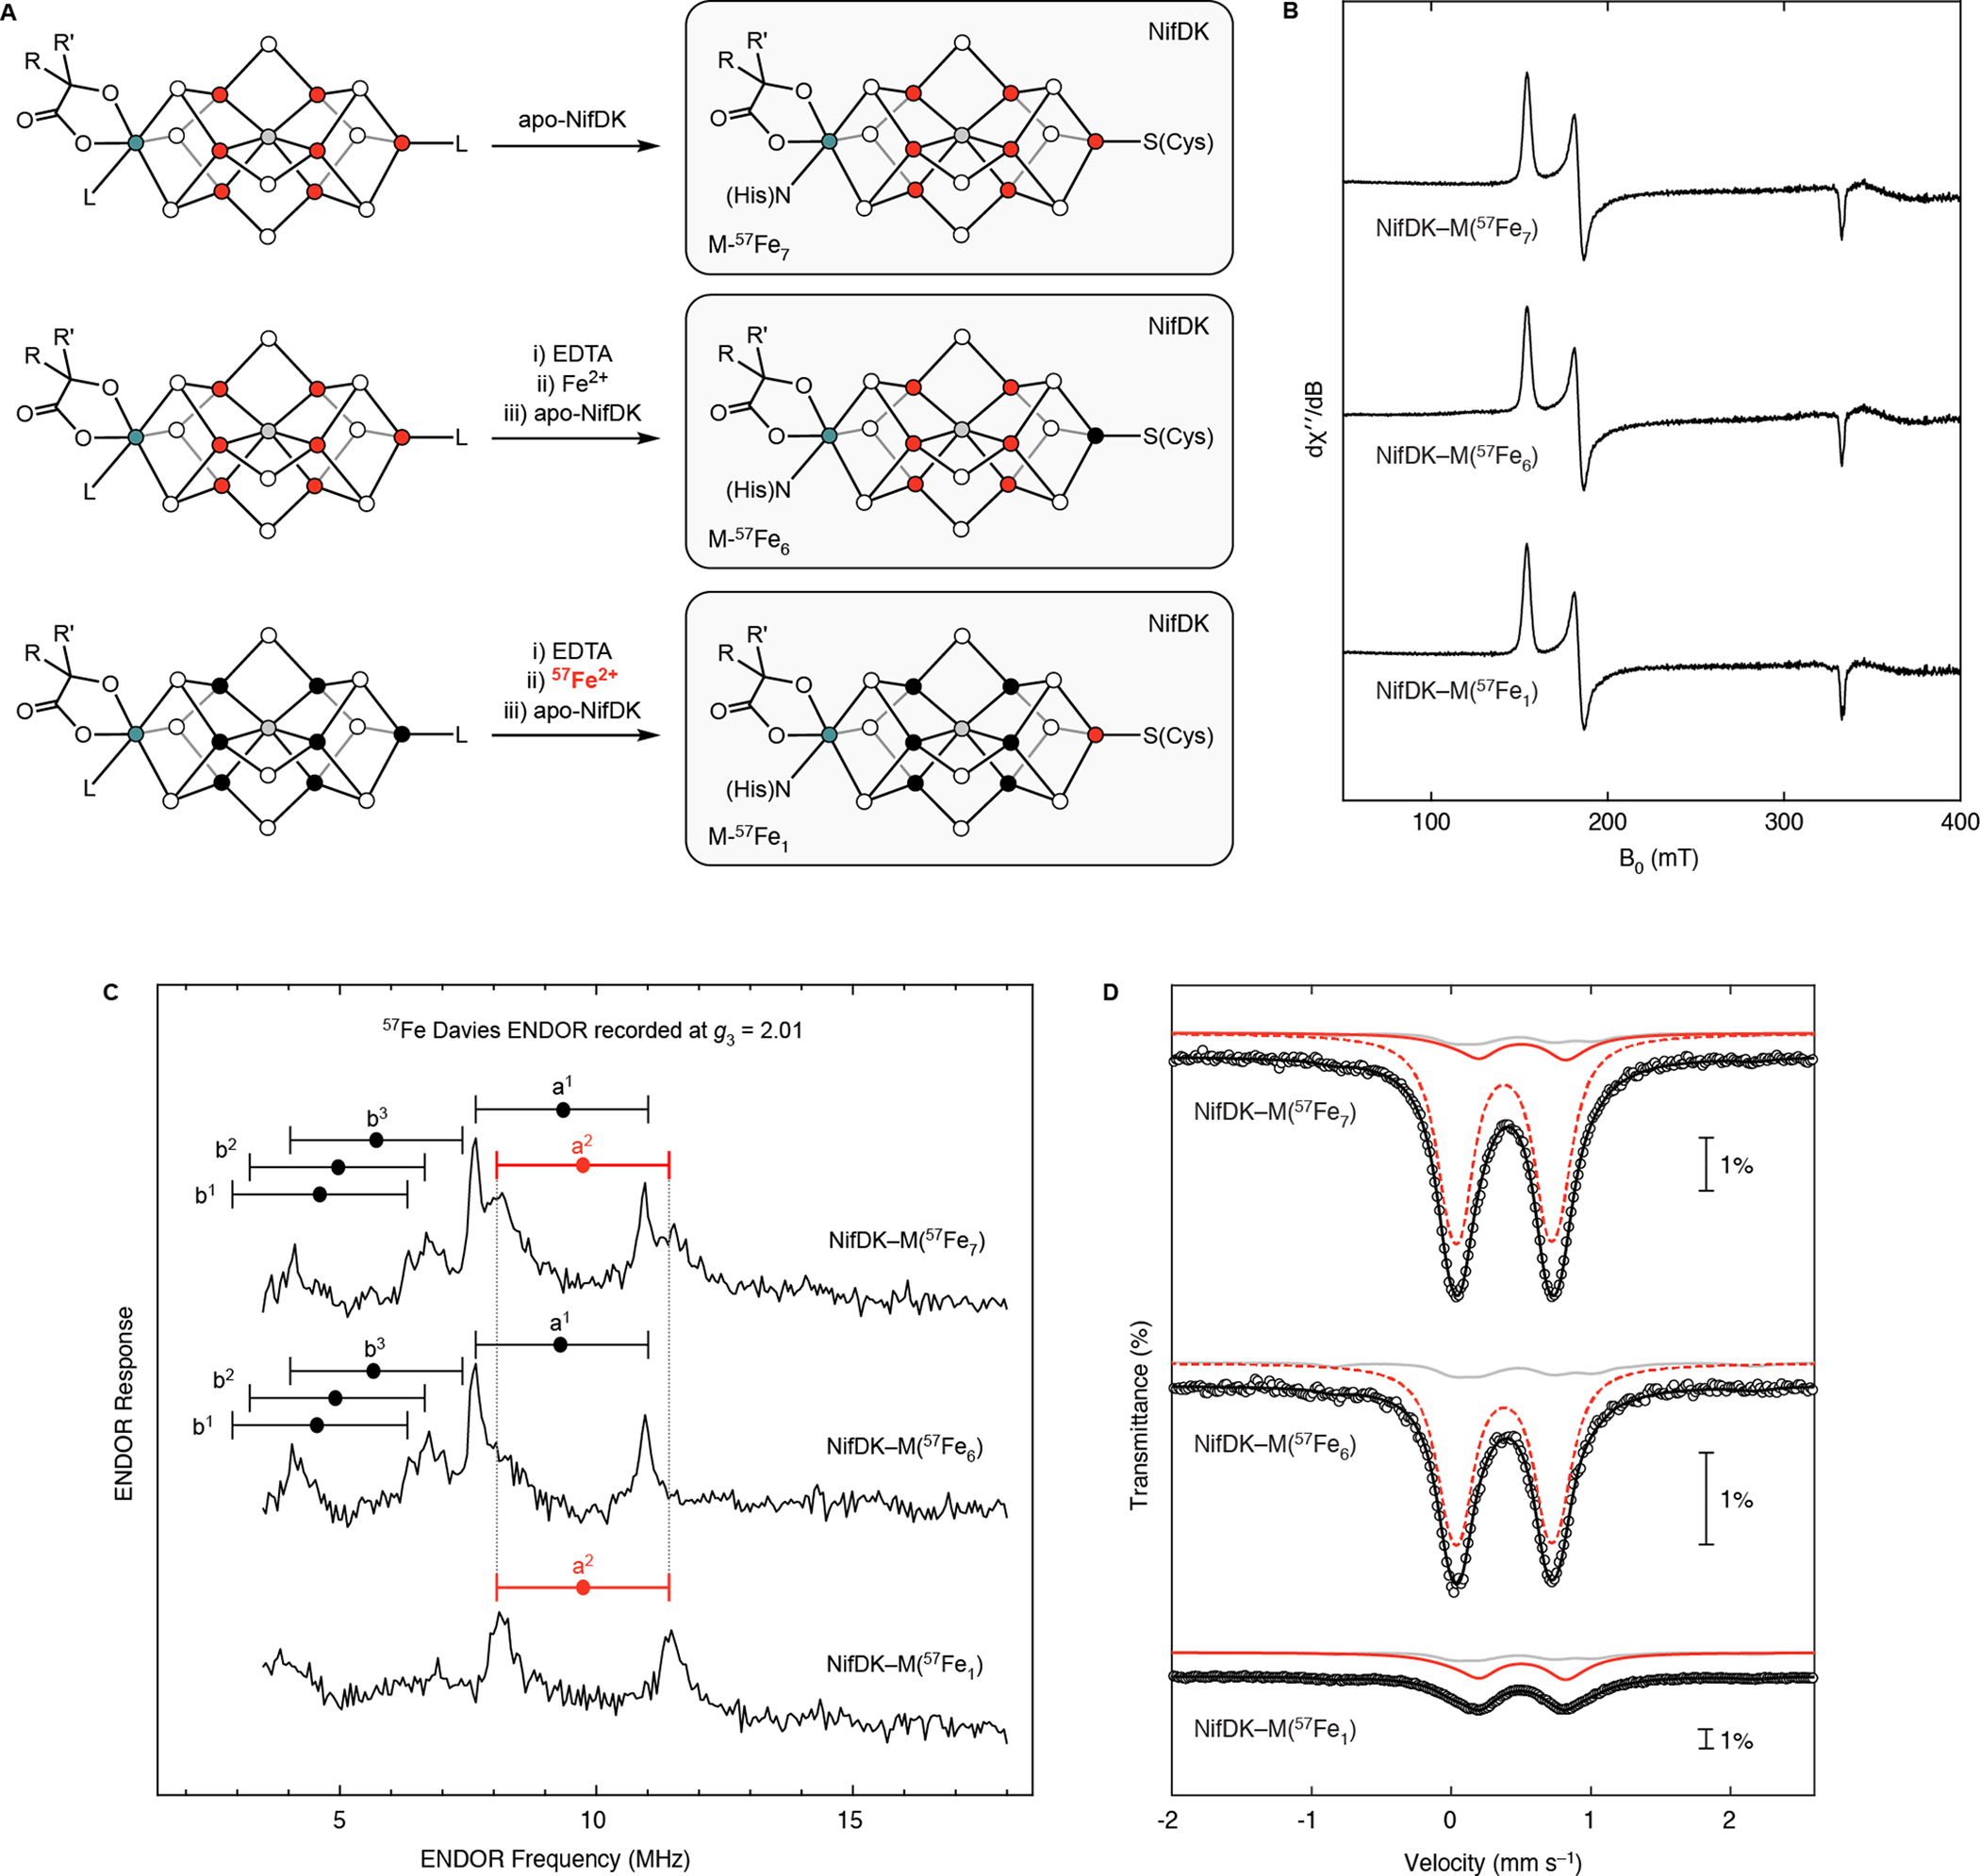
Preparation and characterization of site-selectively labeled holo-NifDK samples. A) Preparation of samples. B) EPR spectra recorded at 9.37 GHz, 5 K, and 1 mW. C) 57Fe Davies ENDOR spectra recorded at g3 = 2.01 (1235 mT), 34.745 GHz, and 2 K, with t(π/2) = 40 ns, τ = 600 ns, TRF = 40 μs, and repetition time = 15 ms. ‘Goalposts’ link the [ν−, ν+] doublets from individual 57Fe sites, as predicted from hyperfine tensors previously reported25 (see text). D) 80 K Mössbauer spectra. Circles are the experimental data; black traces are the total simulations; solid red traces are simulations of the Fe1 site when labeled with 57Fe; dashed red traces are simulations of the belt Fe sites when labeled with 57Fe; gray traces are the spectra of the NifDK–P(57Fe8)–M(57Fe7) sample, appropriately scaled to account for contributions from natural-abundance 57Fe; see the SI for details on data workup and simulation. Note that a minor high-spin Fe2+ signal has been subtracted from the NifDK–M(57Fe1) spectrum.
ENDOR spectroscopic analysis of MN
The Q-band 57Fe ENDOR spectra of the three nitrogenase isotopologues in the MN state recorded at g3 are shown in Fig. 3C. The spectrum of NifDK–M(57Fe7) (Fig. 3C, top) displays partially resolved signals that, as shown, are consistent with the predicted appearance of [ν−, ν+] doublets from five 57Fe sites, each centered at half the hyperfine coupling (A/2) determined from the previous analysis of X-band ENDOR spectra, and each split by twice the 57Fe Larmor frequency (3.4 MHz at 1235 mT).20, 24 (Note that although resting-state FeMo-co has S = 3/2, its EPR spectrum is discussed in terms of a ‘fictitious spin,’ S = 1/2, with g-values, g = [g1, g2, g3] = [4.32, 3.62, 2.01]).24, 27 The corresponding spectrum of the NifDK–M(57Fe6) sample in which only the Fe2-Fe7 sites are enriched with 57Fe (Fig. 3C, middle) retains four of those doublets, and lacks the doublet denoted a2 (observed in Fig. 3C, top), indicating that this doublet must arise from the Fe1 site. The assignment of this signal to Fe1 is confirmed by the spectrum of the NifDK–M(57Fe1) sample, which shows only the a2 doublet centered at the expected frequency, A/2 = 9.8 MHz. The complete elimination of the ν+ peak of the a2 doublet signal in the spectrum of NifDK–M(57Fe6) (Fig. 3C, middle) indicates the high efficiency of labeling the Fe1 site, while the observation of only the a2 doublet in the NifDK–M(57Fe1) spectrum (Fig. 3C, lower), and in particular the absence of any intensity from either peak of the sharp and intense a1 doublet, establishes the high selectivity of our protocol.
In the original X-band study, the 57Fe ENDOR spectra were well-resolved at the low fields between g1 = 4.32 and g2 = 3.62 and at the high-field edge of the EPR spectrum, g3 = 2.01, but poor resolution between g2 and g3 prevented direct experimental correlation between the responses from individual sites at the two ‘ends’ of the EPR spectrum. This ‘gap’ was addressed with ENDOR simulations, which indicated that the low-field A2 signal evolved into the high-field a2 doublet.24 The present work confirms this correspondence between the A2 and a2 signals as well as the hyperfine tensor derived from the analysis of the field-dependence of the X-band ENDOR signals. The Q-band ENDOR spectra of the selectively labeled NifDK–M(57Fe1) sample recorded at g3 = 2.01 and g1 = 4.30 display features centered at ~10 and ~16 MHz, respectively (Fig. 4A), which are reproduced using the hyperfine tensor and associated Euler angles for a single 57Fe site derived from the prior ENDOR simulations: hyperfine tensor principal components written in terms of the true S = 3/2 spin, TA = [TA1, TA2, TA3] = [−14.0, −18.3, −19.5] MHz (TA3 increased by 3%) and the reported Euler angles α = 10, β = 15, γ = 0 defining the orientation of the hyperfine-tensor frame relative to the g-tensor frame (see SI for further discussion).24 Notably, the finding that the observed Larmor splitting of the 57Fe1 doublet at g1 is ‘nulled,’ such that a single peak is observed rather than a well-resolved doublet as seen at g3 (Fig. 4A), directly reveals the Fe1 hyperfine coupling sign to be negative. The negative sign and the magnitude of the isotropic coupling for TA of the Fe1 site, Taiso = −17.3 MHz, together correspond to a vector-coupling coefficient for the spin of Fe1, K1 ~ 0.87, where K1 = 1 implies that the Fe1 spin is precisely parallel to the cluster spin and K1 = 0 implies that it is orthogonal.35 Thus, the spin of Fe1 is essentially colinear with the overall electron spin of the cluster. This determination of the A(57Fe) hyperfine tensor corresponding to the Fe1 site, and thus the value for K1, is critical for limiting the simulation space for magnetic Mössbauer experiments, delineating between the myriad broken-symmetry configurations for FeMo-co in the MN state, and interpreting other properties of FeMo-co, as discussed below.
Figure 4.
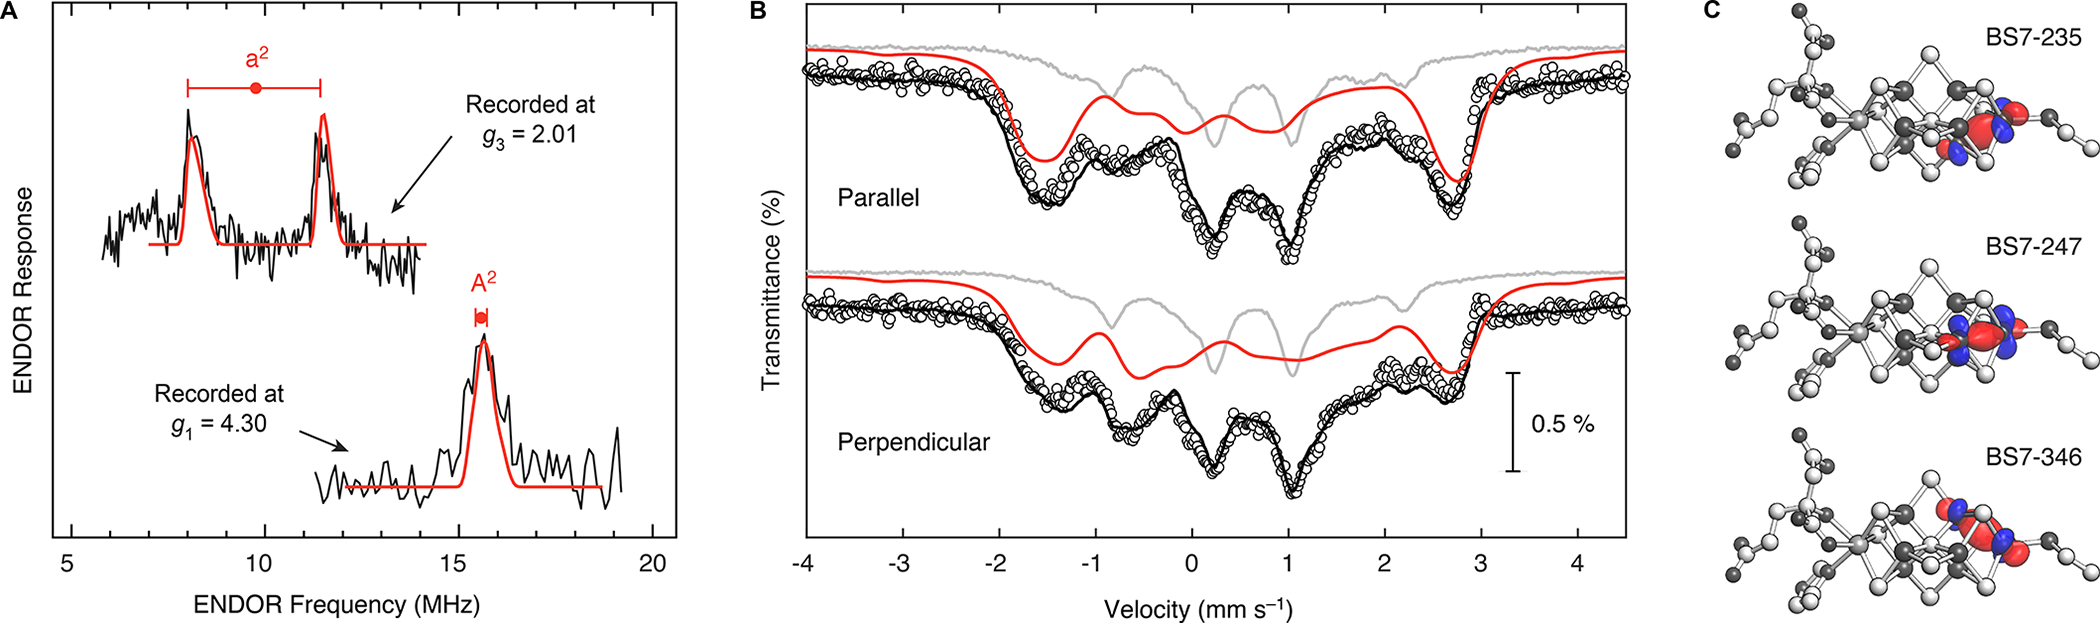
Characterization of the NifDK–M(57Fe1) sample. A) 57Fe Davies ENDOR spectra recorded at g3 = 2.01 (1253 mT; top) and g1 = 4.30 (577 mT; bottom). Center of each ‘goalpost’ equals the observed A/2 at that single-crystal-like g-value; breadth of each goalpost equals twice the effective nuclear Larmor frequency. At g1 the hyperfine coupling is strongly modified by the influence of the zero-field splitting of the true-spin S = 3/2 resting-state FeMo-cofactor (see SI), while the observed Larmor splitting of the doublet at g1 is essentially ‘nulled,’ leaving a single peak, rather than exhibiting the doublet predicted for an isolated 57Fe site (as seen at g1; Fig. 3C). This nulling determines the sign of the 57Fe1 hyperfine coupling, as it occurs through the combined effects of zero-field splitting and a large, negative hyperfine coupling, as discussed in the text. Simulations (red) carried out as before25 employ parameters given in the text; experimental parameters are the same as in Fig. 3B) 4.7 K Mössbauer spectra recorded in the presence of a 77 mT external field oriented parallel (top) or perpendicular (bottom) to the incident radiation. Circles are the experimental data; black traces are the total simulations; red traces are the simulations for the Fe1 site (Table 1); gray traces are the spectra of the NifDK–P(57Fe8)–M(57Fe7) sample, appropriately scaled to account for contributions from natural-abundance 57Fe. Shown here are simulations employing positive ΔEQ; see SI for simulation details. C) Isosurface plots (0.05 au) of the localized orbital qualitatively depicting the double exchange interaction between the Fe1 site and the three indicated spin isomers. Plots generated in the manner of Benediktsson et al. (see SI for details).
Mossbauer spectroscopic analysis of MN
The 80 K Mössbauer spectra of the three NifDK isotopologues (Fig. 3A) are shown in Fig. 3D (see Methods and the SI for details on Mössbauer data collection and analysis). As expected, the NifDK–M(57Fe7) and NifDK–M(57Fe6) spectra are very similar, each appearing as a single quadrupole doublet centered at δavg = 0.39 and 0.38 mm s−1, respectively, corresponding to the overlapping quadrupole doublets of all seven sites and the six belt sites, respectively. In contrast, the 80 K Mössbauer spectrum of NifDK–M(57Fe1) features a quadrupole doublet centered at a considerably higher isomer shift of 0.49 mm s−1. That the spectra for the NifDK–M(57Fe1) and NifDK–M(57Fe7) samples are markedly different further supports the site-selectivity of the labeling protocol described above. Simulations of the NifDK–M(57Fe7), –M(57Fe6), and –M(57Fe1) spectra provide the 80 K Mössbauer parameters in SI Table 5 and Table 6 (see SI for details on the fitting procedure). Notably, the signal arising from the Fe1 site in NifDK–M(57Fe1) is relatively broad even at high temperatures, and its lineshape exhibits an unusual temperature dependence (SI Fig. 3). As discussed in the SI (page 10), such behavior could be ascribed to the thermal population and interconversion of low-lying excited states, though further analysis would be required to test this and alternative hypotheses.
The ENDOR data provide A(57Fe) for the Fe1 site and unequivocally prove that the Fe1 site corresponds to the spectroscopic A2 site, however the Mössbauer hyperfine parameters for the A2 site gleaned from analysis of low-temperature (4.2 K) studies on fully labeled samples25 cannot be directly compared to our 80 K Mössbauer studies (vide supra). We therefore acquired and analyzed Mössbauer spectra at low temperature (4.7 K) in the presence of a weak magnetic field (Fig. 4B). Using the A(57Fe1) hyperfine coupling tensor determined by 57Fe ENDOR spectroscopy and taking into account the background signals from natural-abundance 57Fe (gray traces, Fig. 4B; see SI for further discussion), we simulated the signal arising from the Fe1 site, and thereby obtained its low-temperature Mössbauer hyperfine parameters: δ = 0.54 mm s−1 and |ΔEQ| = 1.32 mm s−1 (Table 1). Notably, the value of δ and the magnitude of ΔEQ for the Fe1 site obtained from the site-selectively labeled NifDK–M(57Fe1) sample are higher than those proposed by Yoo et al. for any Fe site, including the A2 site (respectively 0.48 and –0.94 mm s−1 at 4.2 K), based on simulations of NifDK–M(57Fe7).25 This suggests that the Fe1 site has somewhat more electron density—and, correspondingly, that the six belt Fe sites have somewhat less—than indicated by previous Mössbauer analyses. The implications of this observation are discussed next.
Table 1.
Low-temperature Mössbauer spectroscopic parameters for the Fe1 site in FeMo-co.a
| FeMo-co state | MN (E0) | MOX | MR (E1) |
|---|---|---|---|
| δ (mm s−1) | 0.54 | 0.36 | 0.53 |
| |ΔEQ| (mm s−1) | 1.32 | 0.77 | 1.54 |
| Γ (mm s−1) | 0.39 | 0.26 | 0.36 |
See text and the SI for simulation details. MN and MOX data recorded at 4.7 K; MR data recorded at 5.0 K.
Implications for the electronic structure of MN
Fe–S clusters have been extensively characterized by Mössbauer spectroscopy,36 and thiolate-ligated [Fe4S4] clusters are particularly useful reference compounds for this study because they have an identical primary coordination sphere to that of the Fe1 site of FeMo-co: three μ3-sulfides and one Cys-thiolate. For [Fe4S4] clusters, FeMo-co, and other high-nuclearity Fe–S clusters, the Fe oxidation states are typically assigned as Fe2+, Fe3+, and/or Fe2.5+; the latter corresponds to an Fe in a mixed-valent Fe2+–Fe3+ pair in which the excess electron is delocalized via the double-exchange mechanism.37–38 Based on comparisons to [Fe4S4] clusters,36 the δ and |ΔEQ| at 4.7 K for the Fe1 site are both too low for an Fe2+ site and too high for an Fe3+ site (see SI Table 21). Indeed, they compare favorably to typical values for the Fe2.5+ sites in [Fe4S4]+ clusters (~0.5 and ~1.3 mm s−1, respectively).36 Furthermore, using an empirical relationship39 that relates the formal oxidation state and the Mössbauer isomer shifts of tetrahedral Fe sites in synthetic FeSn(SR)4-n compounds, we arrive at an oxidation state of Fe2.4+ for the Fe1 site in MN. The assignment of an Fe~2.5+ valence is further supported by comparison to the MOX state (vide infra), and is broadly consistent with spatially resolved anomalous dispersion (SpReAD)28 and computational13–14 analyses that indicate the Fe1 site is relatively reduced.
The identification of an Fe2.5+ oxidation state for the Fe1 site necessitates that one of its neighbors—Fe2, Fe3, or Fe4 (Figs. 1B and 4C)—be the other member of the mixed-valent pair. This Fe site must be spin-aligned with Fe1 to undergo electron delocalization via the double exchange mechanism, and it therefore must be one of the remaining A sites, which are each thought to have an δ ~ 0.4 mm s−1.25 The relatively high δ for Fe1 indicates that, on the whole, the covalency of its Fe–ligand interactions (featuring bonds to three μ3-sulfides and one Cys-thiolate) is somewhat lower than that of its double-exchange-coupled partner (featuring bonds to two μ3-sulfides, one μ2-sulfide, and one μ6-carbide). This difference can be attributed at least in part to the greater Fe–S covalency involving μ2-sulfides compared with μ3-sulfides and thiolates40 and may also arise from covalent Fe–C bonding. Additionally, the difference in coordination environments of the Fe sites could result in greater localization of the itinerate electron at the Fe1 site, and this effect would likewise contribute to a higher δ for Fe1.
The insights from spectroscopic analysis of the site-selectively labeled samples—in particular, that the spin of the Fe1 site is well-aligned with the overall electron spin of the cluster, and that the Fe1 site is part of a mixed-valent pair of Fe2.5+ centers—impose experimental constraints on the electronic structure of FeMo-co in the MN state. All electronic configurations that invoke antiparallel spin alignment between the Fe1 site and the total spin can be rejected; this includes the BS3, BS6, BS9, and BS10 family of electronic structures.10, 41 Our results also require that at least one of the neighboring belt Fe sites (Fe2, Fe3, and Fe4) be coaligned with Fe1 in order to engage in electron sharing via the double-exchange mechanism; this requirement further eliminates the BS2 family of electronic structures. Overall, these experimental findings are consistent with the electronic-structure picture favored in recent computational analyses:13–14 an [MoFe7S9C]− core charge state in the BS7 configuration, particularly the three spin isomers BS7–235, BS7–247, and BS7–346, which differ in the identity of the belt Fe that is aligned with the Fe1 site (Fig. 4C). In turn, the determination of the vector-coupling coefficient for 57Fe1 plays an important role in assigning the function of the central FeMo-cofactor carbon.42–43
Characterization of MOX and MR
Having the ability to distinguish between the oxidation states of the Fe1 and belt Fe sites, we next characterized other states of FeMo-co to learn if redox changes occur at the Fe1 site, the belt Fe sites, or both. We began with MOX because comparison of its individual metal valences with those of MN would reveal the site(s) of MN that are most reducing. The reversible oxidation of MN to MOX has been reported,44 and we adapted this procedure to poise the NifDK–M(57Fe7), NifDK–M(57Fe6), and NifDK–M(57Fe1) samples in the MOX state (see Fig. 5A, Methods, and SI Fig. 6). The ground spin state of MOX is S = 0,44–45 and its Mössbauer spectra do not exhibit magnetic splitting even at low temperature (Fig. 5B and SI Fig. 6).44, 46–48 Comparison of the 4.7 K Mössbauer parameters for the Fe1 site in the MN and MOX states (Table 1) reveals a striking shift in hyperfine parameters: δ decreases from 0.54 mm s−1 to 0.36 mm s−1 upon oxidation, and |ΔEQ| likewise decreases from 1.32 to 0.77 mm s−1. Though substantial, the magnitude of the decrease in δ (0.18 mm s−1) is smaller than what would be expected for a localized, Fe2+ to Fe3+ redox event (~0.4 mm s−1) and is instead consistent with conversion of an ~Fe2.5+ site to an Fe3+ site (SI Table 22).36 The value of δavg (80 K) for the belt sites decreases modestly upon oxidation from 0.38 mm s−1 in MN to 0.33 mm s−1 in MOX. The magnitude of this change (~0.05 mm s−1 over six sites, or 0.30 mm s−1 in total) is likewise consistent with the removal of approximately half an electron from the six belt sites (c.f. the Mössbauer spectra for [Fe4S4]2+/+ clusters, whose isomer shifts differ by ~0.48 mm s−1 per electron when normalized to one site). We therefore conclude that the Fe1 site and its double-exchange-coupled partner are redox-active in the interconversion of MN and MOX, and it follows that these metal centers are the most electron-rich in MN.
Figure 5.
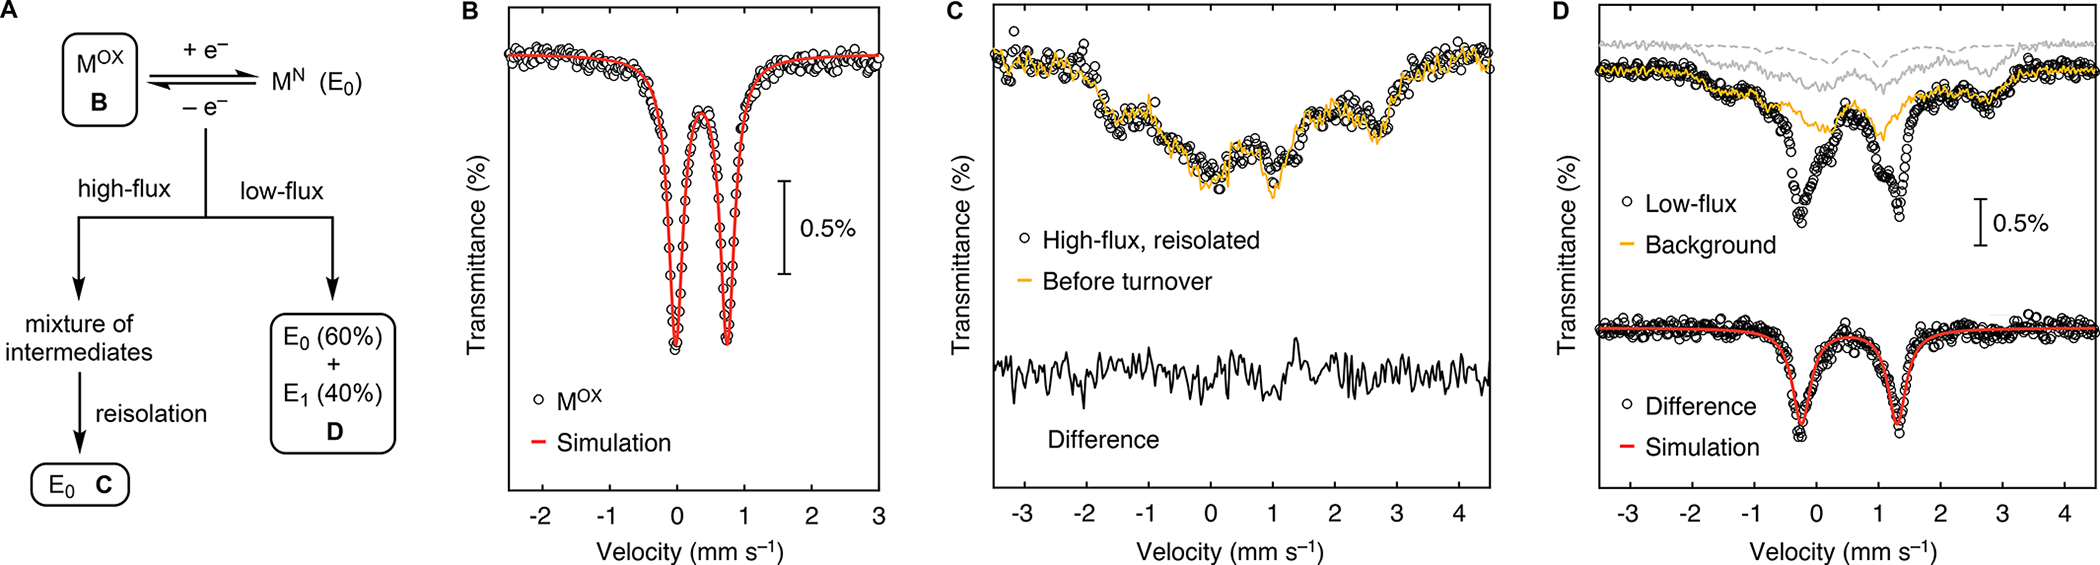
Redox changes at the Fe1 site of FeMo-co as revealed through studies of NifDK–M(57Fe1). A) Scheme showing how the MOX, MN (E0) post-high-flux turnover, and MR (E1) samples were generated. B) 4.7 K Mössbauer spectrum of the sample poised in the MOX state. Contributions from natural-abundance 57Fe have been subtracted (see SI). C) Comparison of the 5.0 K Mössbauer spectra before and after high-flux turnover. Spectra were recorded in the presence of a 77 mT magnetic field (perpendicular) and normalized to the same integrated intensity. D) 5.0 K Mössbauer spectrum of the sample under low-flux turnover. Gray traces represent background signals from E1 (in natural abundance; dashed) and E0 (both enriched at Fe1 and in natural abundance). Yellow trace is the sum of the gray traces.
Using our site-selectively labeled samples to characterize intermediates in N2 reduction catalysis requires that the 57Fe label at the Fe1 site is not lost and does not scramble into other sites during turnover (the latter possibility is raised by evidence for turnover-mediated Fe–S bond cleavage at FeMo-co).49–52 To test whether site-selective labeling is maintained during catalysis, we subjected the NifDK–M(57Fe1) sample to high-flux turnover conditions under N2 for 30 min (see Methods), reisolated NifDK from the reaction mixture, and reanalyzed its metal content and spectroscopic properties. The 57Fe:56Fe ratio determined by ICP-MS analysis is the same pre- and post-turnover (see SI page S39), and the low-temperature Mössbauer spectrum (Fig. 5C) of the post-turnover sample features the same characteristic pattern of the Fe1 site as found in the pre-turnover sample, particularly at the high- and low-energy edges of the spectrum (ca. 2.8 and –1.7 mm s−1). The foregoing results demonstrate that little to no loss or scrambling of the Fe1 site occurs during turnover and that intermediates generated using NifDK–M(57Fe1) samples will retain their 57Fe label with high site-selectivity.
Lastly, we exploited these findings to characterize the first intermediate in N2 reduction, E1, which is generated upon the addition of a proton and an electron to E0. Because FeMo-co is not EPR-active in E1, this state cannot be characterized by 57Fe ENDOR spectroscopy; instead, previous characterization of E1 has relied on techniques that, owing to their poor resolution, do not permit resolution of the individual Fe sites (i.e. Mössbauer and X-ray absorption spectroscopy).23, 25, 53–54 Moreover, no experiments have elucidated the properties of a crystallographically defined Fe site in E1 or in any other intermediate. We therefore sought to apply site-selective labeling to overcome these challenges.
Following reported protocols,23,25,53–54 we subjected the NifDK–M(57Fe1) sample to low-flux turnover conditions, generating a mixture of E0 and E1 (~60/40; see Methods and SI page 41), each with FeMo-co in a reduced state (MN and MR for E0 and E1, respectively). The resulting 5.0 K Mössbauer spectrum (Fig. 5D) contains contributions from the signal of interest—the enriched Fe1 site in the E1 state—as well as background signals from (i) the enriched Fe1 site in the E0 (MN) state, (ii) the Fe2-Fe6 centers in both states at natural abundance, and (iii) the P-cluster (in the PN state in both E0 and E1) at natural abundance. Subtracting these background signals (Fig. 5D; see SI for details) leaves a clean quadrupole doublet (Fig. 5D) corresponding to the Fe1 site in E1 and with the following parameters: δ = 0.53 and |ΔEQ| = 1.54. The similarity in Mössbauer hyperfine parameters for the Fe1 site in E0 and E1 therefore reveal that the proton and electron loaded into FeMo-co in the transition from E0 to E1 are localized at sites other than Fe1, either in a metal–hydride bond (in the case of metal-based protonation, as has been suggested by analogy to the all-Fe nitrogenase)55 or in a metal-based orbital (in the case of S-based protonation, as has been suggested based on spectroscopic and computational studies);53, 56 the Fe1 site remains part of a spin-aligned pair of Fe2.5+ sites with an unchanged primary coordination sphere.
Conclusion
We reported a chemical method for site-selective incorporation of 57Fe into FeMo-co and showed how analysis of site-selectively labeled samples informs on the distribution and coupling of FeMo-co’s valence electrons. The 57Fe ENDOR spectroscopic analysis of MN links the crystallographic Fe1 site to the spectroscopic A2 site, and thereby experimentally connects the electronic properties of an individual site and the geometric structure of FeMo-co. We further showed that (i) the Fe1 site is part of a mixed-valent pair of Fe2.5+ ions; (ii) that this pair is the most reduced moiety in the resting state; and (iii) that the valence and primary coordination sphere is maintained for the Fe1 site in E1, the first intermediate of N2 reduction, E1. Overall, these findings place experimental constraints on the electronic structure of FeMo-co in multiple states, while the observation that 57Fe label in the Fe1 site does not scramble during turnover demonstrates the promise of site-selective isotope editing in providing insights into the mechanism of biological nitrogen fixation.
Methods
Cell growth
The Azotobacter vinelandii strains employed in this study (WT; DJ1141, producing His-tagged NifDK; DJ1143, producing His-tagged apo-NifDK) were cultured in 18 L batches in a 20 L B. Braun Biostat C bioreactor using Burk’s minimal medium. For growths of WT and DJ1141: cultures were supplemented with 6 mM ammonium acetate, derepression was initiated upon ammonium depletion, cells were harvested after 3 hours by centrifugation at 7000 × g for 4 minutes, and the cell paste was flash-frozen in LN2 and stored at –80 °C until purification.57 For growths of DJ1143: cultures were supplemented with 10 mM urea, cells were grown to an OD600 of 4.0, the cells were pelleted by centrifugation at 7000 × g for 4 minutes, derepression was initiated by resuspending the pelleted cells in Burk’s minimum medium containing no urea for 3 hr, the cells were again harvested by centrifugation at 7000 × g for 4 minutes, and the cell paste was flash-frozen in LN2 and stored at −80 °C until needed. 57Fe-enriched NifDK protein was generated using the above protocols except using 57Fe (generated by dissolving 57Fe powder (Trace Science International, 95.5% enrichment) with stoichiometric H2SO4).
NifDK purification
All NifDK purification procedures were carried out in a Coy Labs glove box (<5 ppm O2). All solutions used were sparged with N2 overnight. Cells were lysed using the osmotic shock method as follows: DJ1141 cell paste was resuspended with 3 mL of 25 mM HEPES pH 7.5, 50% glycerol, and 2 mM sodium dithionite (DTH) for every gram of cell paste. After stirring at room temperature for 15 minutes, the cells were pelleted at 25,000 × g for 15 minutes. The supernatant was poured off and the pelleted cells were resuspended in 3 mL buffer containing 25 mM HEPES pH 7.5, 2 mM sodium dithionite, 3 mM phenylmethylsulfonyl fluoride (PMSF), 1 mg/mL lysozyme, and 100 μg/mL DNase I for every gram of cell paste. After 15 minutes of stirring, the lysate was pelleted at 100,000 × g for 1 hr and loaded onto a Co-NTA column equilibrated with buffer containing 500 mM NaCl, 25 mM HEPES pH 7.5, 20% glycerol, and 2 mM DTH. The immobilized protein was washed with ten column volumes of equilibration buffer and eluted with equilibration buffer containing 200 mM imidazole. NifDK was further purified using anion exchange chromatography: the protein solution was diluted four-fold with buffer containing 25 mM HEPES pH 7.5, 20% glycerol, and 2 mM DTH and then loaded onto a DEAE-sepharose column charged with NaCl and equilibrated with the dilution buffer. The column was washed with ten column volumes of 160 mM NaCl, 25 mM HEPES pH 7.5, 2 mM DTH, and 20% glycerol. The immobilized protein was then eluted with buffer containing 500 mM NaCl, 25 mM HEPES pH 7.5, 2 mM DTH, and 20% glycerol. Purified NifDK was concentrated using an AMICON stirred cell equipped with a 30 kDa filter, flash-frozen, and stored in LN2. The concentration of NifDK was estimated by determining the Mo content using inductively coupled plasma mass spectrometry (ICP-MS). Note: In our study, the reported concentration of NifDK is based on the αß heterodimer concentration (with one FeMo-co per heterodimer in holo-NifDK) rather than the α2ß2 heterotetramer concentration (with two FeMo-co per heterotetramer in holo-NifDK).
NifH purification
The purification of NifH was carried out in an MBRAUN glove box (<5 ppm O2) and was performed similarly to what has been previously reported.58 WT A. vinelandii cell paste was lysed as described above. Lysate was loaded onto a DE-52 column charged with NaCl and equilibrated in 25 mM HEPES pH 7.5 and 2 mM DTH. The column was washed with a stepwise gradient with buffer containing 125 mM, 200 mM, 300 mM, and 500 mM NaCl. Fractions were analyzed by EPR spectroscopy; those determined to have NifH were pooled and concentrated using a DE-52 cellulose column and AMICON spin filters equipped with a 10 kDa filter. NifH was then purified further using an Superdex 200 column equilibrated with buffer containing 200 mM NaCl, 25 mM HEPES pH 7.5, and 2 mM DTH. Purified NifH was subsequently concentrated and flash-frozen in LN2. The concentration of NifH was estimated by UV-vis spectroscopy.58
FeMo-co isolation
The protocol for FeMo-co isolation was adapted from a previously reported procedure.32 Protein manipulation was performed in a Coy Labs glove box (<5 ppm O2) and FeMo-co manipulation was carried out in an MBRAUN or Vacuum Atmospheres glove box (<5 ppm O2). NifDK (typical protein concentrations ranging from 100 to 400 μM αß dimer) was diluted ten-fold with aqueous 2 mM DTH. The protein was denatured by the addition of 100 mM citric acid (1.67 mL per 10 mL of diluted protein) added dropwise at 0 °C with stirring. After incubating the mixture for 30 s the protein was precipitated by addition of 200 mM Na2HPO4 (1.7 mL per 10 mL of diluted protein). The precipitated protein was transferred to a 15 mL conical tube and moved to the MBRAUN box where the protein was pelleted at 120 × g for 5 min using a Labnet Z100A centrifuge. The supernatant was removed and the pellet was washed with N,N-dimethylformamide (DMF) (5 mL) and pelleted. This DMF wash step was performed once more. FeMo-co was then extracted by resuspending and vortexing the pellet with 1 to 2 mL of N-methylformamide (NMF) containing 2 mM Na2HPO4 (from a 200 mM aqueous stock solution). After a five-minute incubation at room temperature, the extract was centrifuged at 500 × g for five minutes, and the brown supernatant was collected. The process was repeated until the solution was colorless, and the extracts were combined. The concentration of FeMo-co was estimated by UV-vis spectroscopy using an extinction coefficient of PhS-bound FeMo-co in NMF: 14,800 M−1 cm−1 at 450 nm (SI Fig. 19).
Acetylene reduction activity assays
The specific activity of NifDK was assessed using the acetylene reduction activity assay. Assays were performed in 10 mL crimped vials under an atmosphere of 90:10 argon:acetylene in a 30°C water bath. Each assay contained 800 μL of ATP mix (25 mM Tris pH 7.9, 30 mM creatine phosphate disodium salt, 5 mM ATP disodium salt, 5 mM MgCl2, 25 units/mL phosphocreatine kinase, and 20 mM sodium dithionite), 100 μg of NifDK, and 435 μg of NifH. Assays were initiated with the addition of NifH and quenched after six minutes with 100 μL of 4 M NaOH. Ethylene production was measured by injecting 50 μL of headspace into an Agilent 6890N GC equipped with a flame ionization detector and an HP-PLOT/Q 30 m × 0.319 mm × 20.00 μm column. Ethylene standards were prepared by injecting 1 mL of ethylene into gravimetrically calibrated round bottom flasks containing 1 atm of air.
Post-biosynthetic isotope editing of FeMo-co
Isolated FeMo-co (either 57Fe-enriched or natural-abundance) was treated with 30 equiv ethylenediaminetetraacetic acid (EDTA) (added as a 100 mM aqueous stock solution) and stirred at room temperature for five minutes. Then 35 equiv FeCl2 (either natural-abundance or 57Fe-enriched) was added (as a 100 mM stock solution in 50% v/v NMF/H2O), and the solution was stirred for three minutes at room temperature. Prolonged incubation of EDTA-treated FeMo-co with FeCl2 can lead to the appearance of an unidentified S = 5/2 EPR signal (geff = 4.3); however, samples with this signal are competent for insertion of FeMo-co into apo-NifDK, and as such the reaction with excess FeCl2 appears to be reversible.
Insertion of FeMoco into apo-NifDK
The procedure for inserting FeMo-co onto apo-NifDK protein was adapted from previous reports.59–60 Excess as-isolated or postbiosynthetically modified FeMo-co (up to 1.5 equiv) was added dropwise to freshly prepared crude lysate of DJ1143 (lysed using osmotic shock) with stirring at room temperature. The final concentration of NMF was approximately 1% v/v. Once FeMo-co addition was complete, the now holo-NifDK protein was purified as described above with an additional step. Following anion exchange chromatography, the NifDK protein was applied to a Superdex 200 column equilibrated in 500 mM NaCl, 25 mM HEPES pH 7.5, 20% glycerol, and 2 mM DTH. Fractions containing NifDK were pooled and concentrated. Note: We estimate that 1 g of DJ1143 cell paste grown by the method described above contains ~10 nmol of apo-NifDK; this value was determined by measuring the isolated yield of apo-NifDK across several purifications from a fixed amount of DJ1143 cell paste.
ENDOR sample preparation
The NifDK–M(57Fe7), NifDK–M(57Fe6), and NifDK–M(57Fe1) samples were prepared as discussed above except for an additional step. Some samples contained small amounts of Co impurities that were likely introduced in the Co-NTA purification step. Although this is not an issue for acquiring Mössbauer data, these impurities can be observed in the EPR spectra. To remove these impurities for ENDOR analysis, the holo-NifDK samples were washed with EDTA several times using the following procedure. Samples (~350 μL in volume and containing ~100–300 μM Mo) were washed with EDTA-containing buffer (~10 equiv per Mo, 500 mM NaCl, 25 mM HEPES pH 7.5, 20% glycerol, and 2 mM DTH) by repeated cycles of concentration and dilution using an AMICON centrifugal spin filter (30 kDa cutoff). Approximately every 5–7 cycles, samples were assessed by EPR to determine if the Co was removed. EDTA was then removed by the same concentration and dilution protocol, but with buffer that did not contain EDTA. This protocol does not affect the intensity or shape of the S = 3/2 signal of FeMo-co, though it does lower the specific activity of C2H2 reduction to approximately 60 % of the pre-treatment activity (SI Table 20). The final concentrations for all 57Fe ENDOR samples were approximately 100 μM.
Mössbauer sample preparation
Samples were poised in the MN state by incubation with DTH. Samples were poised in the MOX state by (i) treatment with 500 μM indigodisulfonate (IDS), (ii) gel filtration into 500 mM NaCl, 25 mM HEPES pH 7.5, and 20% glycerol using a PD-10 column (GE Healthcare), (iii) incubation with 7 equiv phenazine methosulfate (PMS) (based on Mo concentration) for three minutes before freezing in LN2.
Samples containing the turnover state E1 were generated by adding NifH (in a ratio of 100:1 NifDK:NifH) to NifDK in PD-10 equilibration buffer (see above) containing 5 mM ATP, 5 mM MgCl2, 20 mM phosphocreatine, 30 mM sodium dithionite, and 25 U per mL of creatine kinase. The sample was freeze-quenched in LN2 after approximately 5 minutes. The yield of E1 was determined by the loss of the resting state EPR signal of NifDK as determined by CW EPR spectroscopy (SI Fig. 12 and 13).
The post-turnover (high-flux) sample was prepared by diluting the NifDK–M(57Fe1) Mössbauer sample to 20 μM with storage buffer that contained 5 mM MgCl2, 5 mM ATP, 20 mM phosphocreatine, 30 mM sodium dithionite, and 25 U per mL creatine kinase. Turnover was initiated by addition NifH to a final concentration of 20 μM; this ratio of components corresponds to high-flux turnover conditions.61 After 30 minutes, the sample was purified using an Ni-NTA column and gel-filtered into storage buffer before being flash-frozen in LN2.
Spectroscopy and spectrometry
Zero-field 57Fe-Mössbauer spectra were recorded with a SEE co. W302 constant-acceleration spectrometer equipped with a JANIS closed cycle He gas refrigerator cryostat (5–200 K). Isomer shifts were quoted relative to α-Fe foil at room temperature. EPR samples were prepared in an anaerobic glove box with an N2 atmosphere and an O2 level of <5 ppm. X-band EPR spectra were recorded on a Bruker EMX spectrometer at 9.37 GHz. Q-band ENDOR data were collected using a locally constructed spectrometer.62
Inductively coupled plasma mass spectrometer (ICP-MS) data were recorded on an Agilent 7900 ICP-MS instrument. Protein samples were digested with concentrated nitric acid (TraceMetal Grade, Fischer) at 70 °C and were diluted with Milli-Q water to final concentration of 2% nitric acid. Standards for Mo were prepared from a 1000 ppm standard solution (VWR BDH Chemicals). Standards for Fe and 56Fe were prepared from a 1000 ppm standard solution (SPEX Certiprep). Standards for 57Fe were prepared as described previously.29 The concentrations of 56Fe and 57Fe in the standard solutions were based on the natural abundance of each isotope in the unenriched standard (91.7% 56Fe, 2.12% 57Fe) and the isotope enrichment in 57Fe powder (95.5% 57Fe, 3.6% 56Fe).
Supplementary Material
Acknowledgements:
We acknowledge the National Institutes of Health (GM141203 to DLMS; GM111097 to BMH), the MIT Research Support Committee (to DLMS), and the National Science Foundation (MCB-1908587 to BMH) for funding. We thank Niklas Thompson for helpful discussions as well as Dennis Dean and Valerie Cash for providing the Av strains used in this work. Support for the ICP-MS instrument was provided by a core center grant P30-ES002109 from the National Institute of Environmental Health Sciences, NIH.
Footnotes
Competing interests: The authors declare no competing interests.
Code availability statement: This study did not use custom code or mathematical algorithms that are deemed central to its conclusions.
Data availability statement:
There are no appropriate repositories for the datasets generated during and/or analysed during the current study. As such, the datasets are available from the corresponding author on reasonable request. PDB 3U7Q was used in the preparation of Fig. 1.
References
- 1.Raymond J, Siefert JL, Staples CR & Blankenship RE, The Natural History of Nitrogen Fixation. Mol. Biol. Evol. 2004, 21 (3), 541–554. [DOI] [PubMed] [Google Scholar]
- 2.Canfield DE, Glazer AN & Falkowski PG, The evolution and future of Earth’s nitrogen cycle. Science 2010, 330 (6001), 192–6. [DOI] [PubMed] [Google Scholar]
- 3.Hoffman BM, Lukoyanov D, Yang Z-Y, Dean DR & Seefeldt LC, Mechanism of Nitrogen Fixation by Nitrogenase: The Next Stage. Chem. Rev. 2014, 114 (8), 4041–4062. [DOI] [PMC free article] [PubMed] [Google Scholar]
- 4.Winter HC & Burris RH, Nitrogenase. Annu. Rev. Biochem. 1976, 45 (1), 409–426. [DOI] [PubMed] [Google Scholar]
- 5.Burgess BK & Lowe DJ, Mechanism of Molybdenum Nitrogenase. Chem. Rev. 1996, 96 (7), 2983–3012. [DOI] [PubMed] [Google Scholar]
- 6.Van Stappen C, et al. , The Spectroscopy of Nitrogenases. Chem. Rev. 2020, 120 (12), 5005–5081. [DOI] [PMC free article] [PubMed] [Google Scholar]
- 7.Einsle O & Rees DC, Structural Enzymology of Nitrogenase Enzymes. Chem. Rev. 2020, 120 (12), 4969–5004. [DOI] [PMC free article] [PubMed] [Google Scholar]
- 8.Seefeldt LC, et al. , Reduction of Substrates by Nitrogenases. Chem. Rev. 2020, 120 (12), 5082–5106. [DOI] [PMC free article] [PubMed] [Google Scholar]
- 9.Spatzal T, et al. , Evidence for Interstitial Carbon in Nitrogenase FeMo Cofactor. Science 2011, 334 (6058), 940. [DOI] [PMC free article] [PubMed] [Google Scholar]
- 10.Lovell T, Li J, Liu T, Case DA & Noodleman L, FeMo Cofactor of Nitrogenase: A Density Functional Study of States MN, MOX, MR, and MI. J. Am. Chem. Soc. 2001, 123 (49), 12392–12410. [DOI] [PubMed] [Google Scholar]
- 11.Harris TV & Szilagyi RK, Comparative Assessment of the Composition and Charge State of Nitrogenase FeMo-Cofactor. Inorg. Chem. 2011, 50 (11), 4811–4824. [DOI] [PMC free article] [PubMed] [Google Scholar]
- 12.Siegbahn PEM, Model Calculations Suggest that the Central Carbon in the FeMo-Cofactor of Nitrogenase Becomes Protonated in the Process of Nitrogen Fixation. J. Am. Chem. Soc. 2016, 138 (33), 10485–10495. [DOI] [PubMed] [Google Scholar]
- 13.Bjornsson R, Neese F & DeBeer S, Revisiting the Mössbauer Isomer Shifts of the FeMoco Cluster of Nitrogenase and the Cofactor Charge. Inorg. Chem. 2017, 56 (3), 1470–1477. [DOI] [PubMed] [Google Scholar]
- 14.Benediktsson B & Bjornsson R, QM/MM Study of the Nitrogenase MoFe Protein Resting State: Broken-Symmetry States, Protonation States, and QM Region Convergence in the FeMoco Active Site. Inorg. Chem. 2017, 56 (21), 13417–13429. [DOI] [PubMed] [Google Scholar]
- 15.Raugei S, Seefeldt LC & Hoffman BM, Critical computational analysis illuminates the reductive-elimination mechanism that activates nitrogenase for N2 reduction. Proc. Natl. Acad. Sci. 2018, 115 (45), E10521. [DOI] [PMC free article] [PubMed] [Google Scholar]
- 16.Li Z, Li J, Dattani NS, Umrigar CJ & Chan GK-L, The electronic complexity of the ground-state of the FeMo cofactor of nitrogenase as relevant to quantum simulations. J. Chem. Phys. 2019, 150 (2), 024302. [DOI] [PubMed] [Google Scholar]
- 17.Cramer SP, Hodgson KO, Gillum WO & Mortenson LE, The molybdenum site of nitrogenase. Preliminary structural evidence from x-ray absorption spectroscopy. J. Am. Chem. Soc. 1978, 100 (11), 3398–3407. [Google Scholar]
- 18.Cramer SP, et al. , The molybdenum site of nitrogenase. 2. A comparative study of molybdenum-iron proteins and the iron-molybdenum cofactor by x-ray absorption spectroscopy. J. Am. Chem. Soc. 1978, 100 (12), 3814–3819. [Google Scholar]
- 19.Conradson SD, et al. , Structural insights from the molybdenum K-edge x-ray absorption near edge structure of the iron-molybdenum protein of nitrogenase and its iron-molybdenum cofactor by comparison with synthetic iron-molybdenum-sulfur clusters. J. Am. Chem. Soc. 1985, 107 (26), 7935–7940. [Google Scholar]
- 20.Venters RA, et al. , ENDOR of the resting state of nitrogenase molybdenum-iron proteins from Azotobacter vinelandii, Klebsiella pneumoniae, and Clostridium pasteurianum. Proton, iron-57, molybdenum-95, and sulfur-33 studies. J. Am. Chem. Soc. 1986, 108 (12), 3487–3498. [Google Scholar]
- 21.Lukoyanov D, Yang Z-Y, Dean DR, Seefeldt LC & Hoffman BM, Is Mo involved in hydride binding by the four-electron reduced (E4) intermediate of the nitrogenase MoFe protein? J. Am. Chem. Soc. 2010, 132 (8), 2526–2527. [DOI] [PMC free article] [PubMed] [Google Scholar]
- 22.Bjornsson R, et al. , Identification of a spin-coupled Mo(III) in the nitrogenase iron–molybdenum cofactor. Chem. Sci. 2014, 5 (8), 3096–3103. [Google Scholar]
- 23.Van Stappen C, et al. , Spectroscopic Description of the E1 State of Mo Nitrogenase Based on Mo and Fe X-ray Absorption and Mössbauer Studies. Inorg. Chem. 2019, 58 (18), 12365–12376. [DOI] [PMC free article] [PubMed] [Google Scholar]
- 24.True AE, Nelson MJ, Venters RA, Orme-Johnson WH & Hoffman BM, Iron-57 hyperfine coupling tensors of the FeMo cluster in Azotobacter vinelandii MoFe protein: determination by polycrystalline ENDOR spectroscopy. J. Am. Chem. Soc. 1988, 110 (6), 1935–1943. [Google Scholar]
- 25.Yoo SJ, Angove HC, Papaefthymiou V, Burgess BK & Münck E, Mössbauer Study of the MoFe Protein of Nitrogenase from Azotobacter vinelandii Using Selective 57Fe Enrichment of the M-Centers. J. Am. Chem. Soc. 2000, 122 (20), 4926–4936. [Google Scholar]
- 26.Lukoyanov DA, et al. , Electron Redistribution within the Nitrogenase Active Site FeMo-Cofactor During Reductive Elimination of H2 to Achieve N≡N Triple-Bond Activation. J. Am. Chem. Soc. 2020, 142 (52), 21679–21690. [DOI] [PMC free article] [PubMed] [Google Scholar]
- 27.Münck E, et al. , Nitrogenase. VIII. Mössbauer and EPR spectroscopy. The MoFe protein component from Azotobacter vinelandii OP. Biochim. Biophys. Acta, Protein Struct. 1975, 400 (1), 32–53. [DOI] [PubMed] [Google Scholar]
- 28.Spatzal T, et al. , Nitrogenase FeMoco investigated by spatially resolved anomalous dispersion refinement. Nat. Commun. 2016, 7 (1), 10902. [DOI] [PMC free article] [PubMed] [Google Scholar]
- 29.Srisantitham S, Badding ED & Suess DLM, Postbiosynthetic modification of a precursor to the nitrogenase iron–molybdenum cofactor. Proc. Natl. Acad. Sci. 2021, 118 (11), e2015361118. [DOI] [PMC free article] [PubMed] [Google Scholar]
- 30.Ribbe MW, Hu Y, Hodgson KO & Hedman B, Biosynthesis of Nitrogenase Metalloclusters. Chem. Rev. 2014, 114 (8), 4063–4080. [DOI] [PMC free article] [PubMed] [Google Scholar]
- 31.Burén S, Jiménez-Vicente E, Echavarri-Erasun C & Rubio LM, Biosynthesis of Nitrogenase Cofactors. Chem. Rev. 2020, 120 (12), 4921–4968. [DOI] [PMC free article] [PubMed] [Google Scholar]
- 32.Shah VK & Brill WJ, Isolation of an iron-molybdenum cofactor from nitrogenase. Proc. Natl. Acad. Sci. 1977, 74 (8), 3249–53. [DOI] [PMC free article] [PubMed] [Google Scholar]
- 33.Rawlings J, et al. , Novel metal cluster in the iron-molybdenum cofactor of nitrogenase. Spectroscopic evidence. J. Biol. Chem. 1978, 253 (4), 1001–4. [PubMed] [Google Scholar]
- 34.Yang SS, et al. , Iron-molybdenum cofactor from nitrogenase. Modified extraction methods as probes for composition. J. Biol. Chem. 1982, 257 (14), 8042–8048. [PubMed] [Google Scholar]
- 35.Mouesca JM, Noodleman L, Case DA & Lamotte B, Spin Densities and Spin Coupling in Iron-Sulfur Clusters: A New Analysis of Hyperfine Coupling Constants. Inorg. Chem. 1995, 34 (17), 4347–4359. [Google Scholar]
- 36.Pandelia M-E, Lanz ND, Booker SJ & Krebs C, Mössbauer spectroscopy of Fe/S proteins. Biochim. Biophys. Acta, Mol. Cell Res. 2015, 1853 (6), 1395–1405. [DOI] [PubMed] [Google Scholar]
- 37.Papaefthymiou V, Girerd JJ, Moura I, Moura JJG & Muenck E, Moessbauer study of D. gigas ferredoxin II and spin-coupling model for Fe3S4 cluster with valence delocalization. J. Am. Chem. Soc. 1987, 109 (15), 4703–4710. [Google Scholar]
- 38.Noodleman L, Exchange coupling and resonance delocalization in reduced iron-sulfur [Fe4S4]+ and iron-selenium [Fe4Se4]+ clusters. 1. Basic theory of spin-state energies and EPR and hyperfine properties. Inorg. Chem. 1991, 30 (2), 246–256. [Google Scholar]
- 39.Venkateswara Rao P & Holm RH, Synthetic Analogues of the Active Sites of Iron–Sulfur Proteins. Chem. Rev. 2004, 104 (2), 527–560. [DOI] [PubMed] [Google Scholar]
- 40.Solomon EI, Gorelsky SI & Dey A, Metal–thiolate bonds in bioinorganic chemistry. J. Comput. Chem. 2006, 27 (12), 1415–1428. [DOI] [PubMed] [Google Scholar]
- 41.Lukoyanov D, et al. , Testing if the Interstitial Atom, X, of the Nitrogenase Molybdenum–Iron Cofactor Is N or C: ENDOR, ESEEM, and DFT Studies of the S = 3/2 Resting State in Multiple Environments. Inorg. Chem. 2007, 46 (26), 11437–11449. [DOI] [PubMed] [Google Scholar]
- 42.Lukoyanov DA, et al. , 13C ENDOR Characterization of the Central Carbon within the Nitrogenase Catalytic Cofactor Indicates That the CFe6 Core Is a Stabilizing “Heart of Steel.” J. Am. Chem. Soc. 2022, 144(40), 18315–18328. [DOI] [PMC free article] [PubMed] [Google Scholar]
- 43.Pérez-González A, et al. , Exploring the Role of the Central Carbide of the Nitrogenase Active-Site FeMo-cofactor through Targeted 13C Labeling and ENDOR Spectroscopy. J. Am. Chem. Soc. 2021, 143 (24), 9183–9190. [DOI] [PMC free article] [PubMed] [Google Scholar]
- 44.Zimmermann R, et al. , Nitrogenase X: Mössbauer and EPR studies on reversibly oxidized MoFe protein from Azotobacter vinelandii OP. Nature of the iron centers. Biochim. Biophys. Acta, Protein Struct. 1978, 537 (2), 185–207. [DOI] [PubMed] [Google Scholar]
- 45.Johnson MK, Thomson AJ, Robinson AE & Smith BE, Characterization of the paramagnetic centres of the molybdenum-iron protein of nitrogenase from Klebsiella pneumoniae using low temperature magnetic circular dichroism spectroscopy. Biochim. Biophys. Acta, Protein Struct. 1981, 671 (1), 61–70. [Google Scholar]
- 46.Lindahl PA, Papaefthymiou V, Orme-Johnson WH & Münck E, Mössbauer studies of solid thionin-oxidized MoFe protein of nitrogenase. J. Biol. Chem. 1988, 263 (36), 19412–8. [PubMed] [Google Scholar]
- 47.Smith BE & Lang G, Mössbauer spectroscopy of the nitrogenase proteins from Klebsiella pneumoniae. Structural assignments and mechanistic conclusions. Biochem J. 1974, 137 (2), 169–80. [DOI] [PMC free article] [PubMed] [Google Scholar]
- 48.Surerus KK, et al. , Moessbauer and integer-spin EPR of the oxidized P-clusters of nitrogenase: POX is a non-Kramers system with a nearly degenerate ground doublet. J. Am. Chem. Soc. 1992, 114 (22), 8579–8590. [Google Scholar]
- 49.Spatzal T, Perez KA, Einsle O, Howard JB & Rees DC, Ligand binding to the FeMo-cofactor: Structures of CO-bound and reactivated nitrogenase. Science 2014, 345 (6204), 1620–1623. [DOI] [PMC free article] [PubMed] [Google Scholar]
- 50.Spatzal T, Perez KA, Howard JB & Rees DC, Catalysis-dependent selenium incorporation and migration in the nitrogenase active site iron-molybdenum cofactor. eLife 2015, 4, e11620. [DOI] [PMC free article] [PubMed] [Google Scholar]
- 51.Kang W, Lee CC, Jasniewski AJ, Ribbe MW & Hu Y, Structural evidence for a dynamic metallocofactor during N2 reduction by Mo-nitrogenase. Science 2020, 368 (6497), 1381–1385. [DOI] [PMC free article] [PubMed] [Google Scholar]
- 52.Lee CC, et al. , Evidence of substrate binding and product release via belt-sulfur mobilization of the nitrogenase cofactor. Nat. Catal. 2022, 5 (5), 443–454. [DOI] [PMC free article] [PubMed] [Google Scholar]
- 53.Van Stappen C, Thorhallsson AT, Decamps L, Bjornsson R & DeBeer S, Resolving the structure of the E1 state of Mo nitrogenase through Mo and Fe K-edge EXAFS and QM/MM calculations. Chem. Sci. 2019, 10 (42), 9807–9821. [DOI] [PMC free article] [PubMed] [Google Scholar]
- 54.Christiansen J, Tittsworth RC, Hales BJ & Cramer SP, Fe and Mo EXAFS of Azotobacter vinelandii Nitrogenase in Partially Oxidized and Singly Reduced Forms. J. Am. Chem. Soc. 1995, 117 (40), 10017–10024. [Google Scholar]
- 55.Lukoyanov DA, et al. , The One-Electron Reduced Active-Site FeFe-Cofactor of Fe-Nitrogenase Contains a Hydride Bound to a Formally Oxidized Metal-Ion Core. Inorg. Chem. 2022, 61 (14), 5459–5464. [DOI] [PubMed] [Google Scholar]
- 56.Cao L, Caldararu O & Ryde U, Protonation and Reduction of the FeMo Cluster in Nitrogenase Studied by Quantum Mechanics/Molecular Mechanics (QM/MM) Calculations. J. Comput. Chem. 2018, 14 (12), 6653–6678. [DOI] [PubMed] [Google Scholar]
Methods-only references:
- 57.Lee C-C, Ribbe MW & Hu Y, Purification of Nitrogenase Proteins. In Metalloproteins: Methods and Protocols, Hu Y, Ed.Springer New York: New York, NY, 2019; pp 111–124. [DOI] [PubMed] [Google Scholar]
- 58.Burgess BK, Jacobs DB & Stiefel EI, Large-scale purification of high activity Azotobacter vinelandII nitrogenase. Biochim. Biophys. Acta, Enzymol. 1980, 614 (1), 196–209. [DOI] [PubMed] [Google Scholar]
- 59.McLean PA, Papaefthymiou V, Orme-Johnson WH & Münck E, Isotopic hybrids of nitrogenase. Mössbauer study of MoFe protein with selective 57Fe enrichment of the P-cluster. J. Biol. Chem. 1987, 262 (27), 12900–12903. [PubMed] [Google Scholar]
- 60.Christiansen J, Goodwin PJ, Lanzilotta WN, Seefeldt LC & Dean DR, Catalytic and biophysical properties of a nitrogenase Apo-MoFe protein produced by a nifB-deletion mutant of Azotobacter vinelandii. Biochemistry 1998, 37 (36), 12611–23. [DOI] [PubMed] [Google Scholar]
- 61.Harris DF, Yang Z-Y, Dean DR, Seefeldt LC & Hoffman BM, Kinetic Understanding of N2 Reduction versus H2 Evolution at the E4(4H) Janus State in the Three Nitrogenases. Biochemistry 2018, 57 (39), 5706–5714. [DOI] [PMC free article] [PubMed] [Google Scholar]
- 62.Davoust CE, Doan PE & Hoffman BM, Q-Band Pulsed Electron Spin-Echo Spectrometer and Its Application to ENDOR and ESEEM. J. Magn. Reson., Ser. A 1996, 119 (1), 38–44. [Google Scholar]
Associated Data
This section collects any data citations, data availability statements, or supplementary materials included in this article.
Supplementary Materials
Data Availability Statement
There are no appropriate repositories for the datasets generated during and/or analysed during the current study. As such, the datasets are available from the corresponding author on reasonable request. PDB 3U7Q was used in the preparation of Fig. 1.