

Abstract
Ribosome assembly is orchestrated by many assembly factors, including ribosomal RNA methyltransferases, whose precise role is poorly understood. Here, we leverage the power of cryo-EM and machine learning to discover that the E. coli methyltransferase KsgA performs a “proofreading” function in the assembly of the small ribosomal subunit by recognizing and partially disassembling particles that have matured but are not competent for translation. We propose that this activity allows inactive particles an opportunity to reassemble into an active state, thereby increasing overall assembly fidelity. Detailed structural quantifications in our datasets additionally enabled expansion of the Nomura assembly map to highlight rRNA helix and r-protein interdependencies, detailing how the binding and docking of these elements are tightly coupled. These results have wide-ranging implications in our understanding of the quality control mechanisms governing ribosome biogenesis and showcase the power of heterogeneity analysis in cryo-EM to unveil functionally relevant information in biological systems.
Keywords: Ribosome assembly, quality control, cryo-electron microscopy, machine learning, structural heterogeneity
INTRODUCTION
During ribosome biogenesis in Escherichia coli, three ribosomal RNAs (rRNAs) and 54 proteins (r-proteins) assemble into discrete small (30S) and large (50S) subunits that later associate to form a functional 70S ribosome1. Throughout assembly, r-proteins aid rRNA folding by binding and stabilizing transient RNA folding states2,3. Concomitant with these folding events, at least 22 known methyltransferases site-specifically modify the rRNA, resulting in 10 and 14 rRNA methylation marks on the 30S and 50S subunits, respectively4,5. The precise impact of many of these marks on ribosome assembly and function remains unclear6.
Whereas the conservation of rRNA methylation sites is generally low between prokaryotes and eukaryotes, two adjacent adenosines (A1518 and A1519; E. coli numbering) located in helix 45 are notable for their conservation across the three kingdoms of life7,8. Dimethylation at the N6 position of these adenosines is catalyzed by the universally conserved, but not universally essential KsgA/Dim1p enzyme family9–12. Though these rRNA methylations are not essential for the survival of E. coli in laboratory conditions, KsgA homologs confer significant fitness advantages under stress conditions in many organisms. In Staphylococcus aureus, for example, KsgA-dependent rRNA methylation increases virulence and contributes to cell survival under oxidative conditions13. Similarly, KsgA-deficiency in Salmonella enterica confers susceptibility to high osmolarity and attenuates virulence14. Early studies established the general belief that these phenotypes were the consequence of KsgA-dependent methylations fine-tuning the structure of the ribosome and ultimately contributing to its fidelity and overall translation efficiency7,15. More recent work, however, has identified phenotypes in ΔksgA E. coli16 that are commonly found in strains lacking well-established ribosome biogenesis factors such as YjeQ, RimM, and Era17–19, leading to the hypothesis that KsgA could also actively participate in ribosome assembly.
To explore the mechanisms through which KsgA assists ribosome assembly, we applied cryo-electron microscopy (cryo-EM) and cryoDRGN20, a recently developed single particle cryo-EM image processing pipeline, to structurally characterize the ensemble of free 30S assembly intermediates that accumulate in a ΔksgA strain of E. coli. Treatment of these purified assembly intermediates with KsgA revealed that it specifically targeted inactive 30S particles and induced large-scale structural remodeling in these particles, suggesting that KsgA acts as a quality control factor during ribosome assembly. Additionally, by leveraging cryoDRGN’s ability to reconstruct a large ensemble of structures, and the ability of our Model-based Analysis of Volume Ensembles (MAVEn) approach to quantify occupancy and flexibility of diverse structural elements, we uncovered how assembly of individual rRNA helices and r-proteins influence one another. These analyses enabled the construction of an “extended” Nomura assembly map21,22 that depicts interdependencies between the native docking of rRNA helices and r-protein binding events, helping to explain further how protein-dependent conformational changes in the 16S rRNA facilitate the high degree of cooperativity observed in ribosome biogenesis23.
KsgA impacts the assembly of ribosomal small subunits.
To investigate the role of KsgA in the assembly of ribosomal small subunits (SSU), we first isolated and characterized SSU assembly intermediates that accumulated in ΔksgA cells24 grown at low temperature. Consistent with a previously reported KsgA-dependent defect in ribosome biogenesis16, these cells contained more unprocessed 17S rRNA, exhibited a distinct sucrose gradient profile, and the 30SΔksgA particles isolated from them bore an incomplete complement of ribosomal proteins when compared to that isolated from wild-type cells (Supplementary Figure 1). Using microscale thermophoresis, we found that these 30SΔksgA particles were competent to bind to KsgA in vitro with higher affinity than the mature 30S subunits (Supplementary Figure 2), consistent with the isolation of a particle on which KsgA might act.
Next, we used single particle cryo-electron microscopy (cryo-EM) to visualize the 30SΔksgA particles and to evaluate the effect of adding KsgA to them in vitro. The resulting consensus maps exhibited two striking features. First, both maps bore canonical features of immature SSUs, including incomplete or missing density in helix 44, which is strictly required for subunit joining and subsequent translation25,26. Second, each map exhibited highly fragmented densities in the head, platform, and spur domains, consistent with conformational or compositional heterogeneity in these regions. Surprisingly, in the KsgA-treated samples, the local resolution in these regions was further diminished, consistent with even greater structural variability (Figure 1A).
Figure 1: KsgA treatment of 30SΔksgA particles produces a heterogeneous structural ensemble.
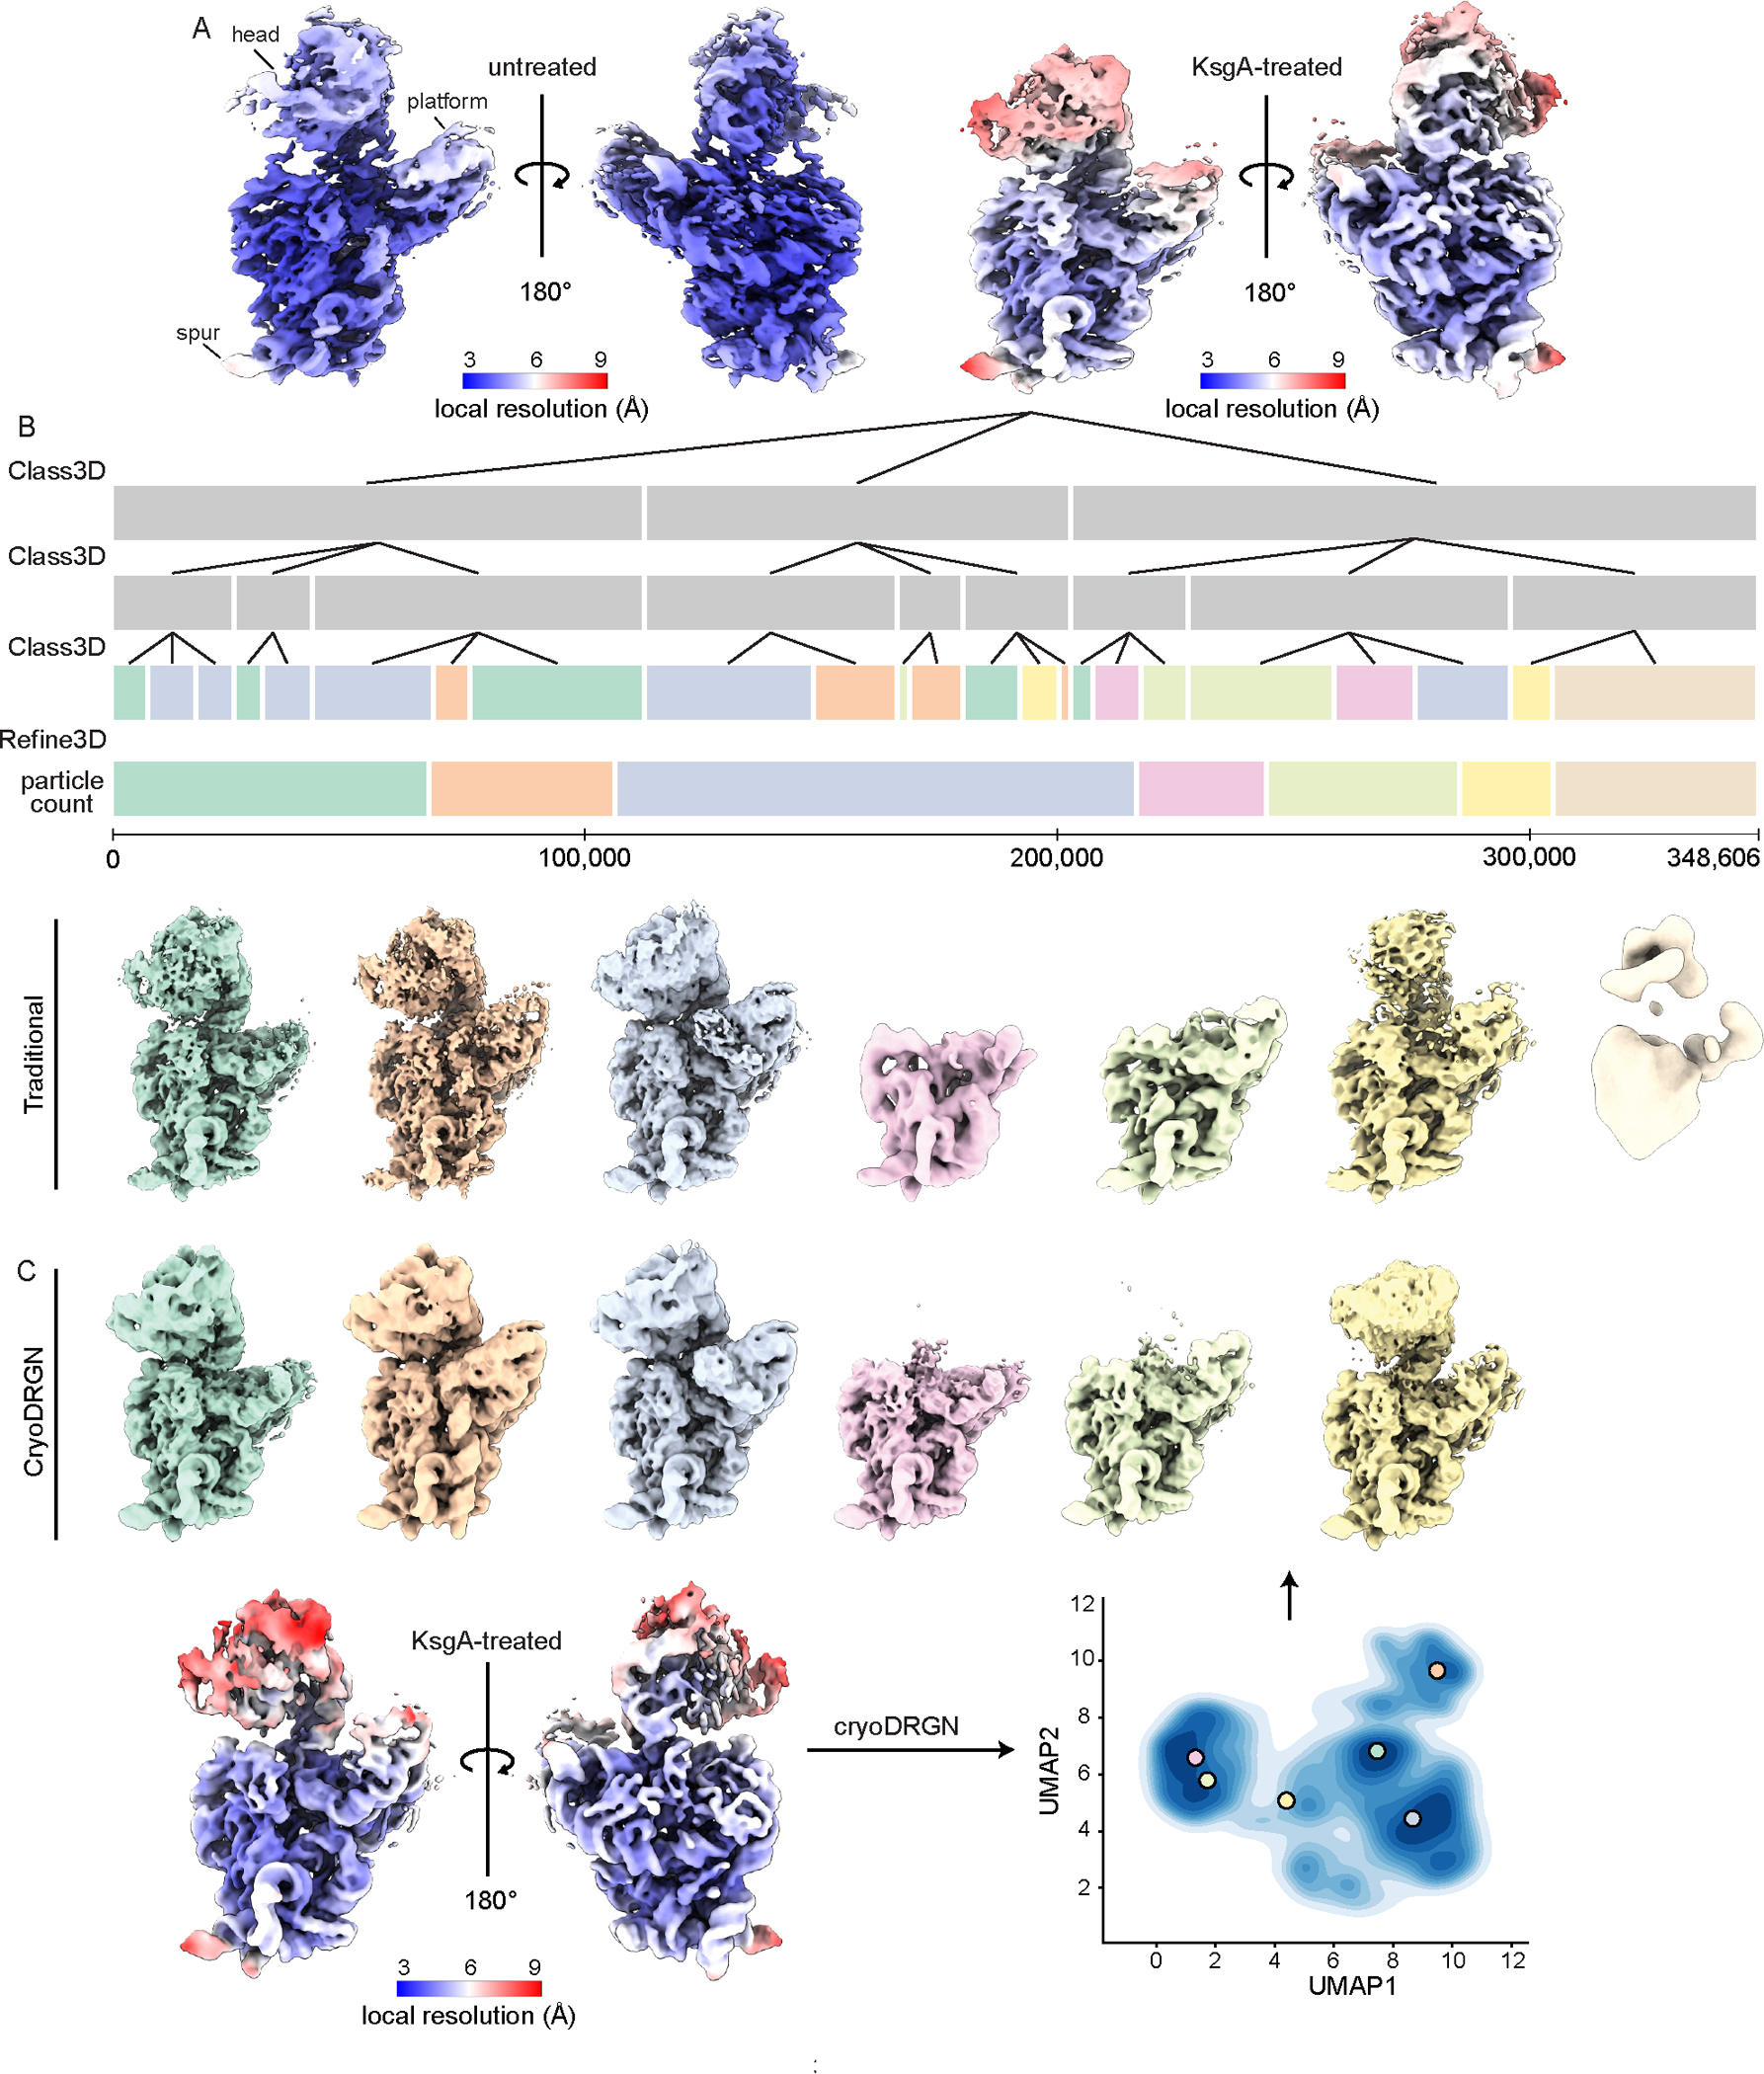
(A) Density maps produced from untreated and KsgA-treated 30SΔksgA particles, colored by local resolution. (B) Traditional hierarchical classification and refinement of KsgA-treated particles. Each bar represents a layer of 3D-classification or refinement, with its length proportional to the number of particles in that class. Classes in the final layer are colored to indicate how they were pooled for 3D refinement, and volumes are colored to match. (C) Consensus map of KsgA-treated particles included in the final round of cryoDRGN training (see Supplementary Figure 4), colored by local resolution, and UMAP representation of the latent space produced by cryoDRGN analysis of these particles (bottom). Colored markers indicate the position in latent space from which volumes sampled were generated (top).
KsgA binding remodels large rRNA domains.
Given the unexpected increase in structural variability upon addition of KsgA, we aimed to investigate these structures further. Systematically analyzing heterogeneous structural ensembles remains an open challenge in cryo-EM, and thus we employed both RELION’s traditional Maximum Likelihood-based 3D-classification and refinement methods27 (Figure 1B; Supplementary Figure 3B) and cryoDRGN20, a neural network-based reconstruction approach that has shown great promise in this arena28. Specifically, we trained a cryoDRGN model on this dataset, producing a latent encoding for each particle and a trained decoder network capable of producing density maps from any position in latent space supported by underlying particle images (Supplementary Figure 4A). Consistent with large-scale, discrete heterogeneity, we found that the latent space was featured, and volumes sampled from various populated locations within the latent space revealed the presence of massive structural variability in the head, platform, and KsgA-binding site (Figure 1C). These “major” structural classes were similar to those uncovered using traditional 3D-classification (Figure 1B; Supplementary Figure 3B), supporting the accuracy of cryoDRGN’s neural network-based approach.
To systematically interrogate structural heterogeneity present within the KsgA-treated dataset, we exploited cryoDRGN’s powerful generative model by sampling 500 volumes from the latent space, effectively generating density maps from all regions of latent space that were supported by data (Supplementary Figure 4B). To interpret the resulting density maps, we applied a coarse-grained analysis of subunit occupancy and flexibility, which we have named MAVEn28,29,30. Specifically, we measured the amount of density we observed for each rRNA helix and r-protein, relative to that expected based on the atomic model of the fully mature subunit (Figure 2A). The resulting heatmap depicted the fraction of natively localized density occupied by each structural element (69 columns) in each density map (500 rows), and revealed that a vast array of structures was present upon KsgA addition (Figure 2B). Using the hierarchically clustered occupancy map, we grouped these structures into classes of broadly similar density maps, and we generated representative structures of each class using cryoDRGN (Figure 2C, Supplementary Figure 5A, and Methods). Here, we observed both highly mature (classes 1–4) and substantially less mature structures (classes 5–11), including maps that lacked density for the head (classes 8–9), platform (classes 5–6), or both (classes 7 and 10).
Figure 2: Analysis of KsgA-treated 30SΔksgA particles with MAVEn reveals large structural domains that cooperatively interconvert.
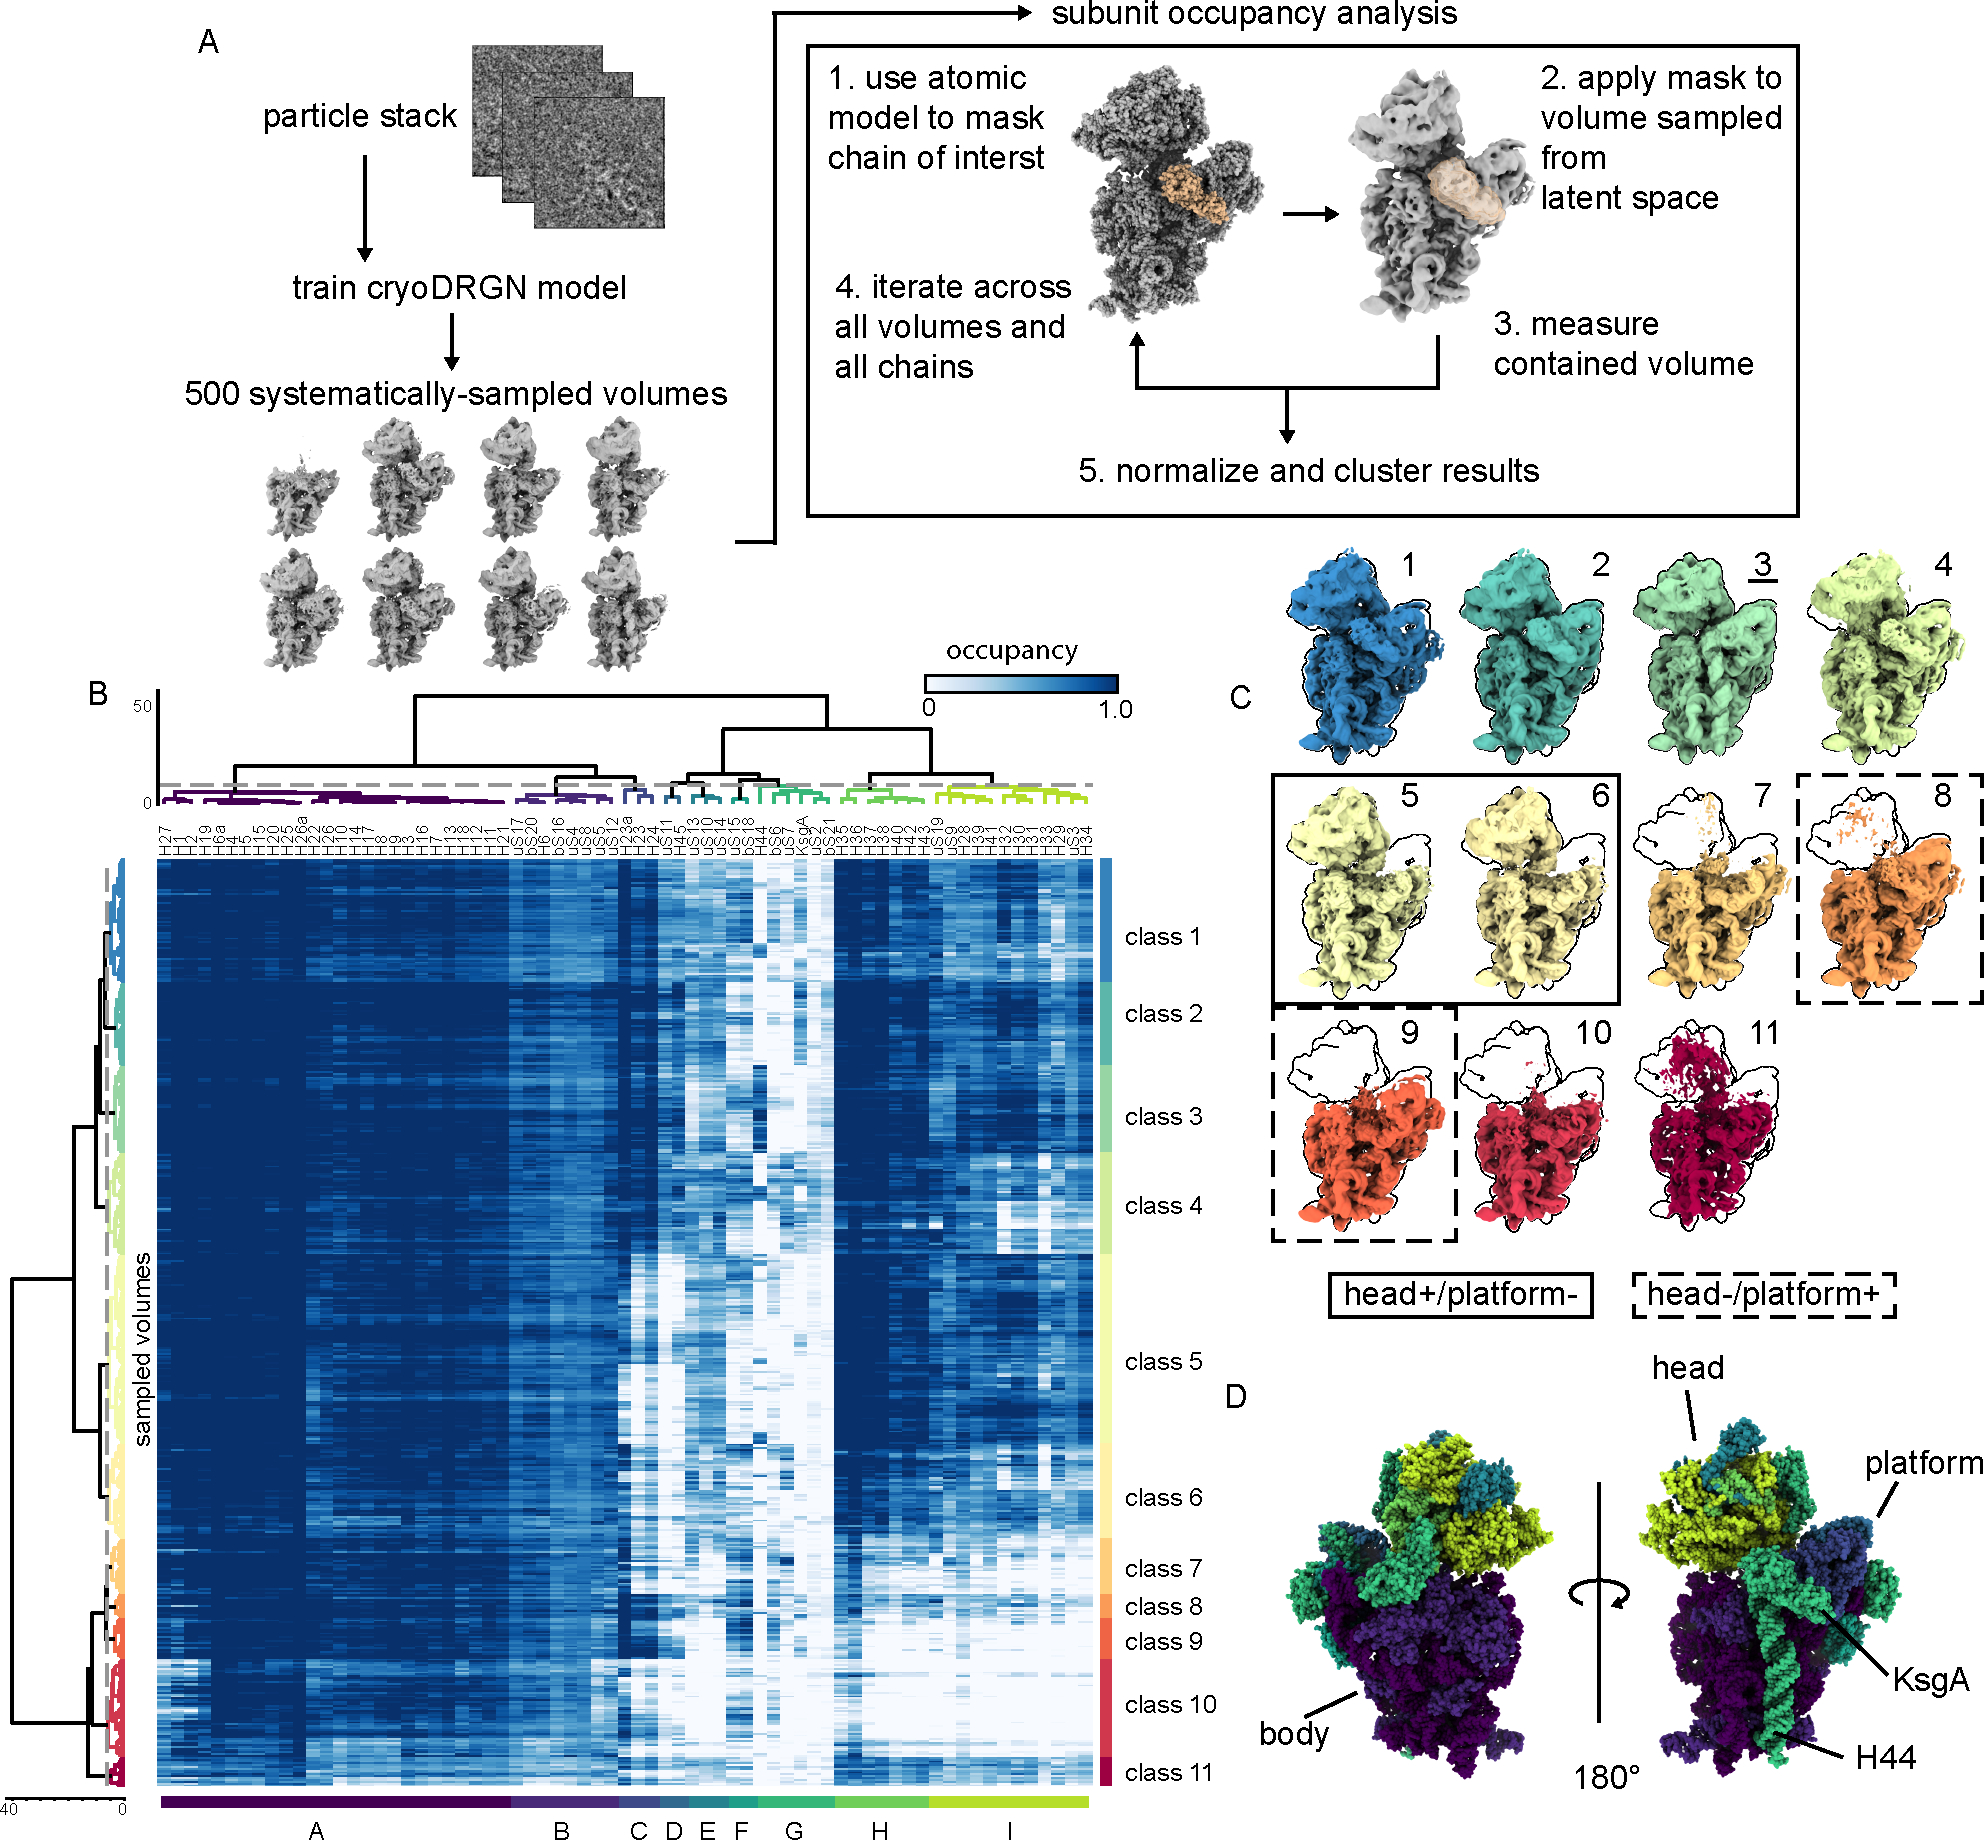
(A) Depiction of our MAVEn approach (see Methods). (B) Results of applying MAVEn to KsgA-treated particles, displayed as a heatmap. Rows (500) correspond to sampled density maps and columns (69) correspond to structural elements defined by the atomic model. (C) Volumes generated from centroid position in latent space of each of the classes shown in (B). Volumes are outlined by the silhouette of the mature 30S (class 3, underlined). Maps with head density but no platform density are highlighted with a solid box; maps with platform density but no head density are surrounded with dashed boxes. (D) Atomic models of the 30S subunit used in performing MAVEn (PDB: 4V9D, 4ADV) are colored by the structural blocks defined through hierarchical clustering in (B). Structural features of interest are annotated.
KsgA addition reveals interconverting structural blocks.
When inspecting the columns of the MAVEn-generated heatmap (Figure 2B), we noticed structured blocks consistent with the cooperative assembly of the 30S subunit29. The blocks were structurally coherent, containing neighboring rRNA helices and r-proteins, and were primarily organized around the head, platform, and body domains (Figure 2D). Careful inspection of structural blocks C/D and H/I, which encompass the platform and head, respectively, revealed that their occupancy was uncoupled, with some volumes bearing only the head, some bearing only the platform, and others having both or neither. In contrast, blocks corresponding to the body (A/B) were always present, consistent with prior work hypothesizing a requirement for the formation of the body before assembly of the head or platform31–33. Overall, these observations support the existence of parallel pathways facilitating the independent assembly of the head and platform domains.
Interestingly, although these structural blocks are largely coherent, consistent with their cooperative maturation, they are not perfectly so. For example, 29 maps in class 4 exhibited low occupancy of helices 32 and 33, which represent the most distal region of the head domain (Figure 2B). Visual inspection of these maps revealed rotations of the head domain away from the body, using the neck that connects the head to the body as a fulcrum. This apparent conformational flexibility likely contributed to the relatively poor local resolution of the head density in our traditional 3D reconstructions (Figure 1B), highlighting the power of this coupled cryoDRGN and MAVEn approach to resolve lowly populated conformers.
KsgA binds a diverse array of ribosomal small subunits.
In addition to systematically enumerating large-scale structural changes, this cryoDRGN-based approach allowed us to thoroughly quantify the presence or absence of proteins and rRNA helices across the dataset. Thus, we could readily determine the fraction of the ribosomal particles bound to KsgA upon treatment. We found that only ~39% of the particles were bound to KsgA, despite having added the factor super-stoichiometrically and in excess of the apparent KD (Supplementary Figure 2). This sub-stoichiometric KsgA occupancy implied that not all of the ribosomal particles were competent to bind KsgA and suggested that KsgA may recognize features on the ribosome that were not uniformly present.
To better understand which structural elements KsgA recognizes, we used MAVEn to extract the subset of maps with high KsgA occupancy. We designated these maps as “KsgA-bound” and performed hierarchical clustering of the occupancy matrix of this KsgA-bound subset of 185 maps (Figure 3A, Supplementary Figure 5B). Consistent with recent reports of KsgA bound to a mature 30S subunit34,35, we observed clear density near the decoding center that was well fit by an atomic model of KsgA36 (Figure 3B–C). Notably, we found that KsgA bound to particles of highly variable composition, including maps presenting densities for all major domains (body, platform and head; class 3) and maps lacking portions of the platform (class 4) or the head (class 5) (Figure 3B). This result highlighted the relative independence of the KsgA binding site and distal elements in the head, suggesting that KsgA primarily senses local structural elements on the 30S particles.
Figure 3: KsgA binds a diverse array of assembly states.
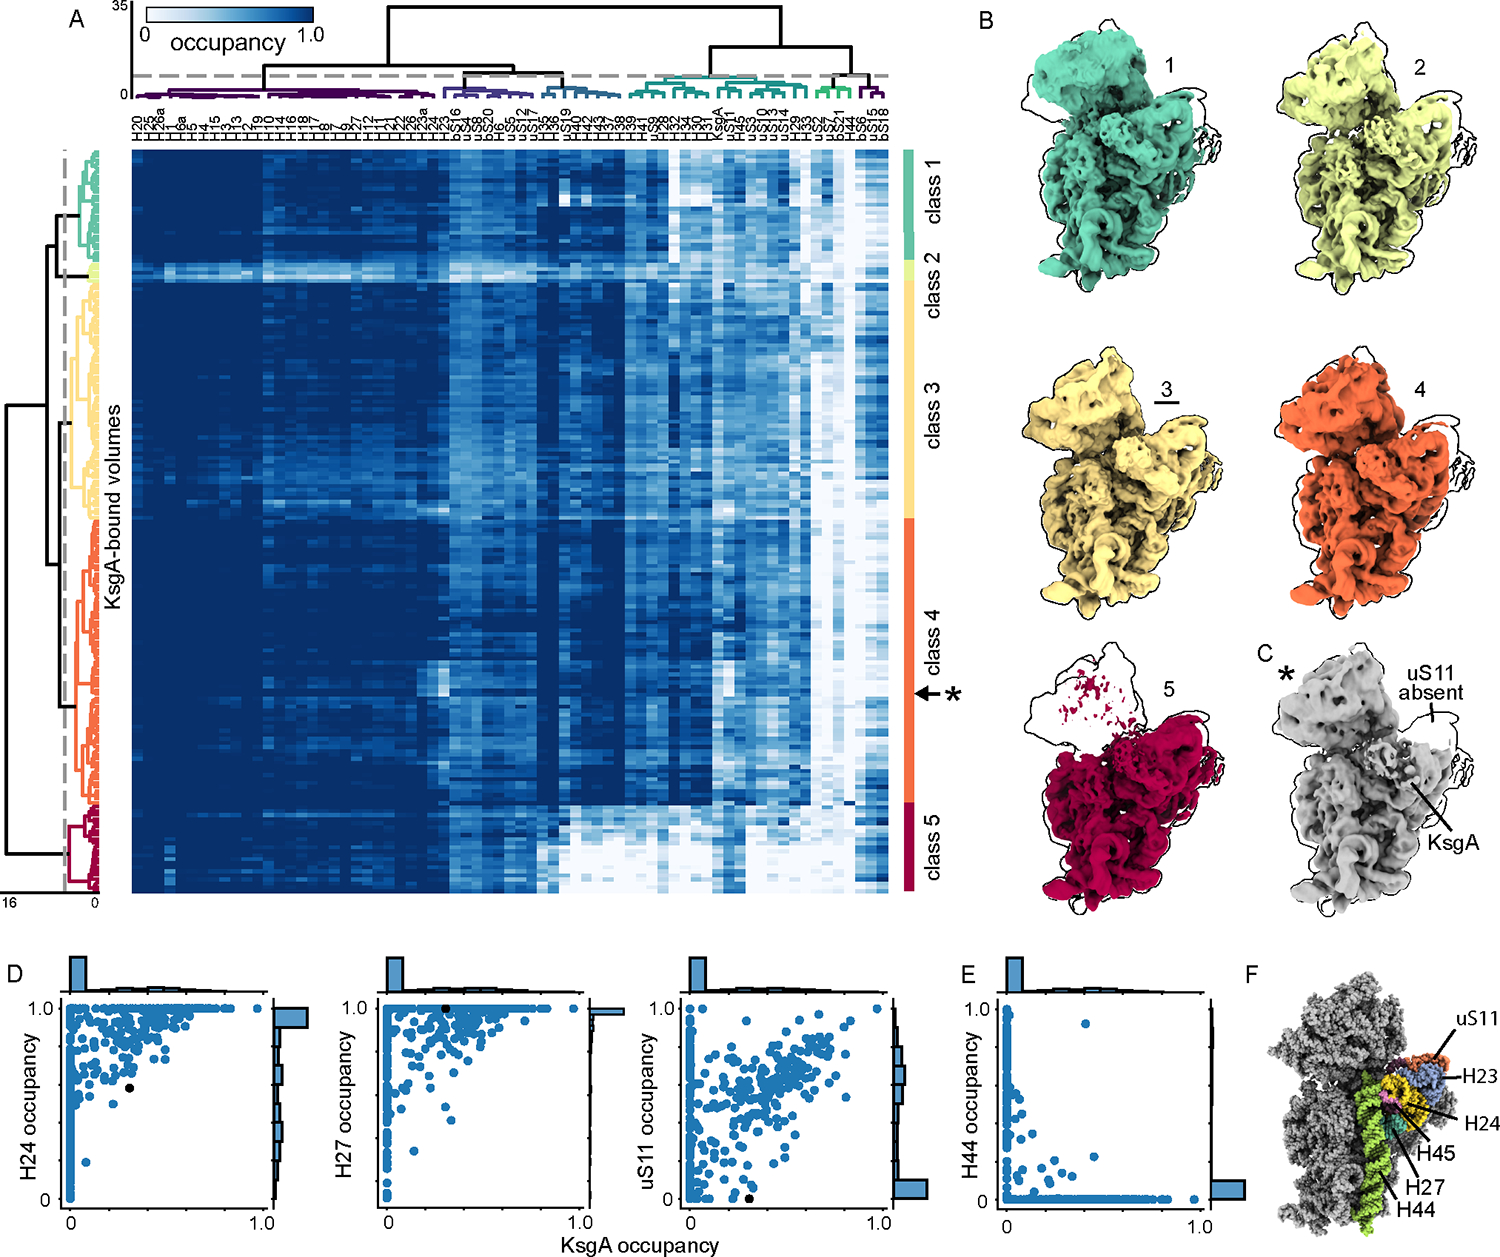
(A) Re-clustering of KsgA-bound maps (185) based on KsgA subunit occupancy, displayed as a heatmap. (B) Centroid maps for KsgA-bound classes, outlined by the most mature volume (class 3, underlined). (C) A map sampled from row labeled with * in (A). Note that platform element uS11 is missing. (D) Correlations between occupancy of KsgA and platform elements thought to be critical for KsgA binding. The black dot notes the occupancy of volume depicted in (C). (E) Correlation between KsgA and H44 occupancy, consistent with mutually exclusive KsgA binding and H44 docking. (F) Atomic models of the 30S ribosome (PDB: 4V9D, 4ADV) with structural features annotated. KsgA is hidden to show platform elements.
Detailed inspection of occupancy patterns in ribosomal elements proximal to the KsgA binding site highlighted those dispensable for KsgA association, and those consistently occupied in our structures. Indeed, we found that rRNA helices 24 and 27 are highly occupied in all maps with high KsgA occupancy (Figure 3D), consistent with work implicating these helices in binding of KsgA’s C-terminal domain35. This analysis further highlighted the mutually exclusive occupancy of KsgA and helix 44, and it highlighted that uS11 in the platform is largely, but not strictly, required for KsgA binding as we identified five KsgA-bound maps lacking uS11 (Figure 3C–F).
rRNA backbone contacts facilitate KsgA binding.
To inspect the atomic contacts supporting KsgA binding, we next collected a larger dataset of the KsgA-treated 30SΔksgA particles and, using hierarchical classification and multi-body refinement in RELION37,38, we reconstructed a 2.8 Å resolution map of this complex that grossly resembled that of KsgA bound to mature 30SΔksgA subunits derived from dissociation of 70SΔksgA particles35 (Figure 4, Supplementary Figure 6).
Figure 4. Substrate engagement by KsgA displaces a gatekeeping rRNA helix.
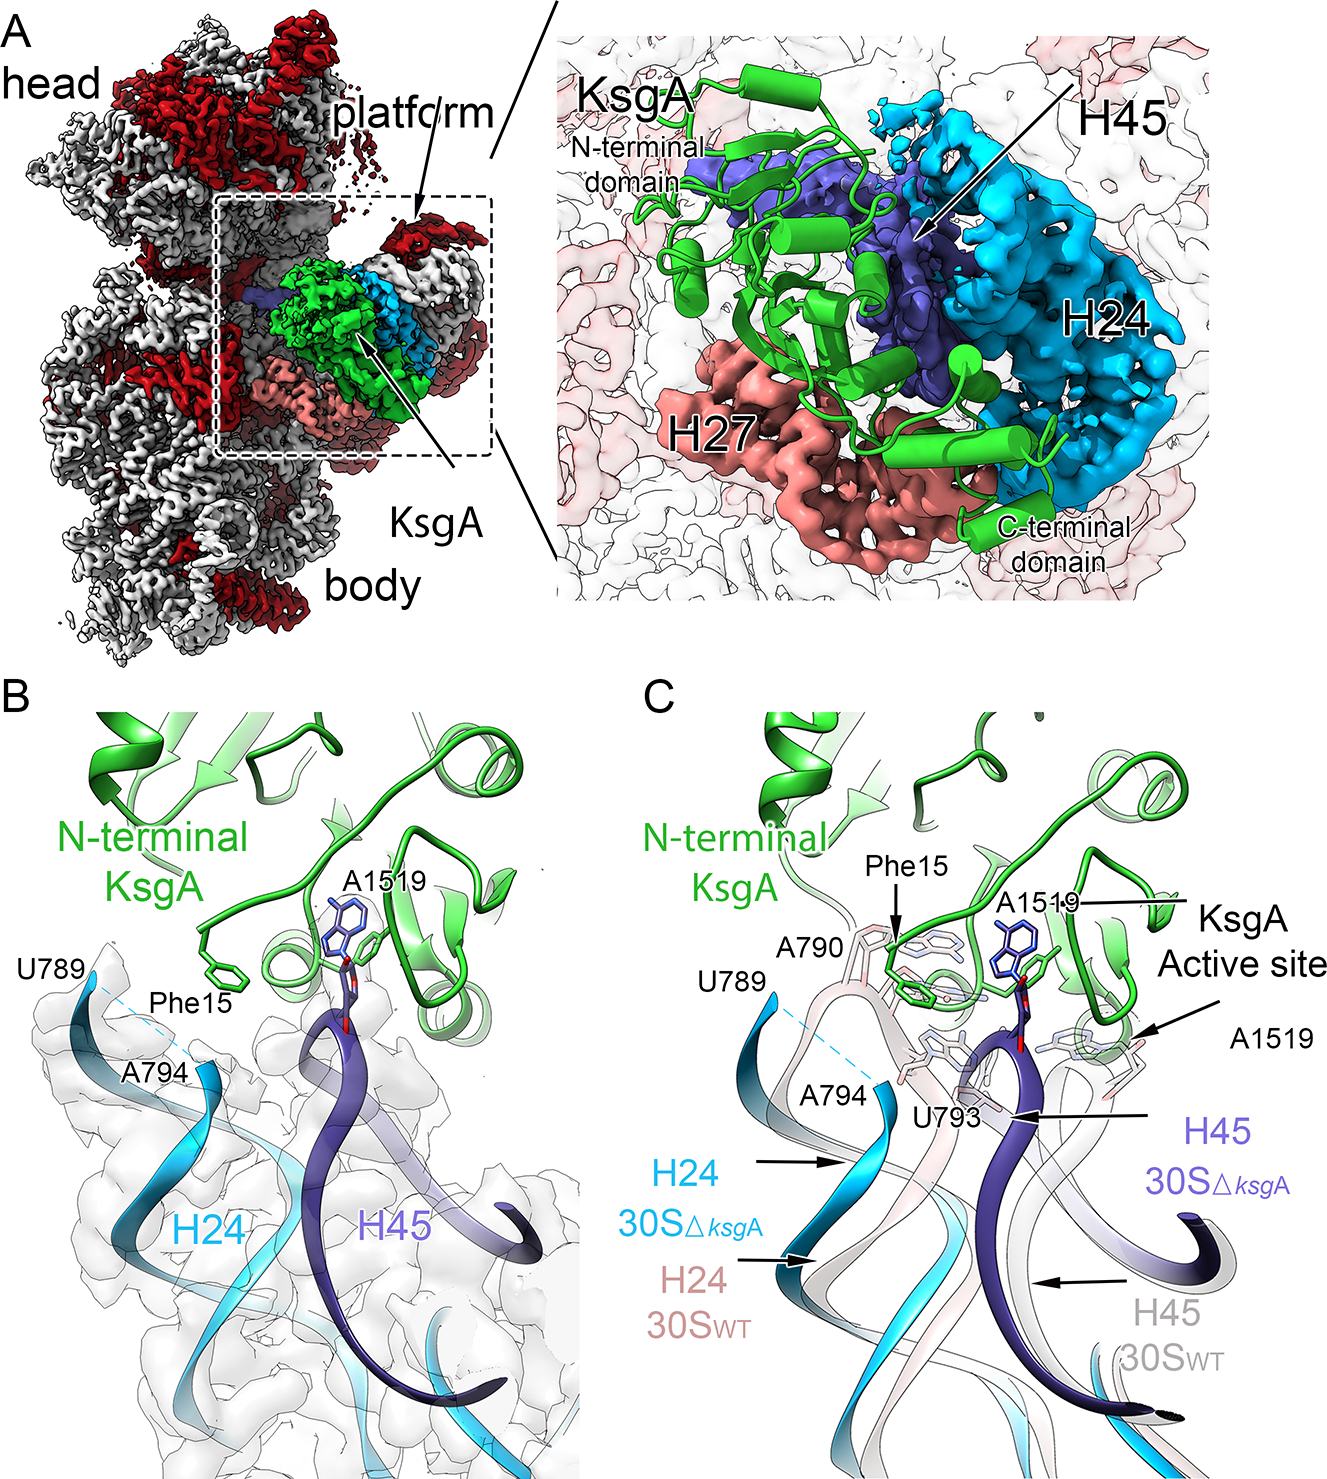
(A) Interface view of the cryo-EM structure obtained for the immature 30SΔksgA particle bound to KsgA (green). Ribosomal proteins are shown in red, the 16S rRNA is shown in light gray, and structural landmarks of the ribosomal subunit are indicated. Key rRNA helices interacting with KsgA are colored pink (helix 27), cyan (helix 24) and blue (helix 45). The interaction area is enlarged in the right panel, and depicts a molecular model of KsgA derived from the cryo-EM map. (B) Magnified view of the interface between KsgA’s N-terminal region and rRNA helix 24, and KsgA’s active site and substrate residue A1519 from helix 45. Note the lack of cryo-EM density (gray) corresponding to helix tip residues 790–793, and the proximity of KsgA residue Phe15 to this region. (C) Overlay of rRNA helices 24 and 45 from the molecular model of the mature 30SWT subunit in the absence of KsgA (rose) and those from the 30SΔksgA particle bound to KsgA (H24 in cyan; H45 in purple). Note positioning of A1519 in KsgA’s active site necessitates displacement of helix to avoid steric clashes between helices 24 and 45.
Construction of a molecular model using this map (Table 1, Supplementary Figures 7–8) revealed that KsgA binding was primarily supported by contacts to backbone phosphates and sugars of rRNA helices 24, 27, and 45 (Supplementary Figure 9A–C), with the substrate rRNA residue (A1519) bound in the KsgA catalytic site and stabilized in this conformation by a π-stacking interaction with KsgA residue Tyr116 (Supplementary Figure 9D). In contrast, KsgA substrate residue A1518 was placed away from the active site, suggesting that A1519 is methylated first. We further observed KsgA active site residues Asn113 and Leu114, which are known to facilitate catalysis39, hydrogen bonded to the methyl-receiving N6 atom of A1519, apparently priming it for methylation (Supplementary Figure 9D). Notably, this overall positioning of helix 45, which contains the substrate residues, was maintained primarily through KsgA contacts to backbone elements of the rRNA, suggesting that such stabilizing contacts would also be available when A1518 binds in the active site for subsequent KsgA-dependent methylation.
TABLES.
Cryo-EM data collection, refinement and validation statistics
| 30SΔKsgA + KsgA (EMD-28720) (PDB 8EYT) | 30S Inactive conformation (EMD-28692) (PDB 8EYQ) | |
|---|---|---|
|
| ||
| Data collection and processing | ||
| Magnification | 105,000x | 105,000x |
| Voltage (kV) | 300 | 300 |
| Electron exposure (e−/Å2) | 72 | 45 |
| Defocus range (μm) | −1.25 to −2.75 | −1.25 to −2.75 |
| Pixel size (Å) | 0.855 | 0.855 |
| Symmetry imposed | C1 | C1 |
| Initial particle images (no.) | 665,547 | 552,604 |
| Final particle images (no.) | 231,280 | 316,895 |
| Map resolution (Å) | 2.8 | 3.3 |
| FSC threshold | 0.143 | 0.143 |
| Map resolution range (Å) | 2.5–5 | 3–5 |
| Refinement | ||
| Initial model used (PDB code) | 4YBB & 1QYR | 7BOF |
| Model resolution (Å) | 2.8 | 3.3 |
| FSC threshold | 0.143 | 0.143 |
| Model resolution range (Å) | 2.5–5 | 3–5 |
| Map sharpening B factor (Å2) | 15 | 50 |
| Model composition | ||
| Non-hydrogen atoms | 50,707 | 48,194 |
| Protein residues | 2,588 | 1,965 |
| RNA nucleotides | 1,415 | 1,525 |
| Ligands | - | - |
| B factors (Å2) | ||
| Protein | 96.78 | 143.64 |
| RNA | 90.44 | 150.51 |
| Ligand | - | - |
| R.m.s. deviations | ||
| Bond lengths (Å) | 0.018 | 0.005 |
| Bond angles (°) | 1.450 | 0.814 |
| Validation | ||
| MolProbity score | 2.09 | 2.19 |
| Clashscore | 12.39 | 13.59 |
| Poor rotamers (%) | 1.26 | 1.29 |
| Ramachandran plot | ||
| Favored (%) | 93.91 | 92.49 |
| Allowed (%) | 5.15 | 6.94 |
| Disallowed (%) | 0.94 | 0.57 |
Our model additionally showed that upon binding, KsgA’s N-terminal region approached helix 24 (H24) and we were unable to resolve density corresponding to H24 nucleotides 790–793 (Figure 4B), suggesting that KsgA binding induced flexibility in this region. Comparing our molecular model with that of KsgA-free 30SWT led us to hypothesize that this KsgA-induced remodeling of H24 plays a functional role in regulated catalysis. Indeed, in the canonical conformation, H24 residues 790–793 would protrude into the KsgA active site, with nucleotide U793 precluding A1519 from adopting the “flipped-out” conformation required to access the KsgA active site (Figure 4C). As such, we interpreted the coupled H24 and H45 motions upon KsgA binding as catalysis-independent priming of the substrate for methylation.
Nearly mature 30S subunits accumulate in KsgA’s absence.
To understand how the 30S subunit assembles in the absence of KsgA, we applied our cryoDRGN-MAVEn pipeline to untreated immature 30SΔksgA particles (Supplementary Figure 4 and Supplementary Figure 5C). Given KsgA’s role as an assembly factor, we expected these structures to generally appear less mature than those observed upon addition of the factor. Instead, we were surprised to find that these ribosomal particles were significantly less heterogeneous than the ones present upon addition of KsgA, with the centroid volumes generated using MAVEn appearing more similar to the mature 30S (Figure 5A, Supplementary Figures 10–11). Indeed, only one of these ten representative volumes lacked head density entirely (class 8, Figure 5A); in comparison, in the KsgA-treated dataset, four of the eleven representative volumes lacked head density (classes 7–10, Figure 2C). To better estimate the total number of particles from each dataset bearing head density, we generated a down-sampled volume at each on-data position in the latent space of each dataset. These volumes were then queried for occupancy of the entire head region following binarization (Figure 5B, Supplementary Figure 12A, see Methods). By applying a fractional occupancy threshold to distinguish particles with head density from those lacking head density, we determined that 2.3% of particles in the untreated dataset lacked head density. In contrast, this number increased to 15.5% upon KsgA addition (Figure 5B). In addition to measuring the occupancy of the head across each dataset, we also measured how similar the untreated vs. KsgA-treated particles were to a mature volume. To do so, we used our 500 sampled volumes from each dataset and calculated a voxel-wise sum of squared residuals between each volume and a paired mature reference volume (see Methods). Plotting this data as a cumulative distribution function (Figure 5C) or inspecting density maps sampled at regular intervals along the y-axis of this plot (Supplementary Figure 13) highlighted that untreated particles are globally more similar to the mature structure than their KsgA-treated counterparts.
Figure 5: Nearly-mature SSUs accumulate in the absence of KsgA.
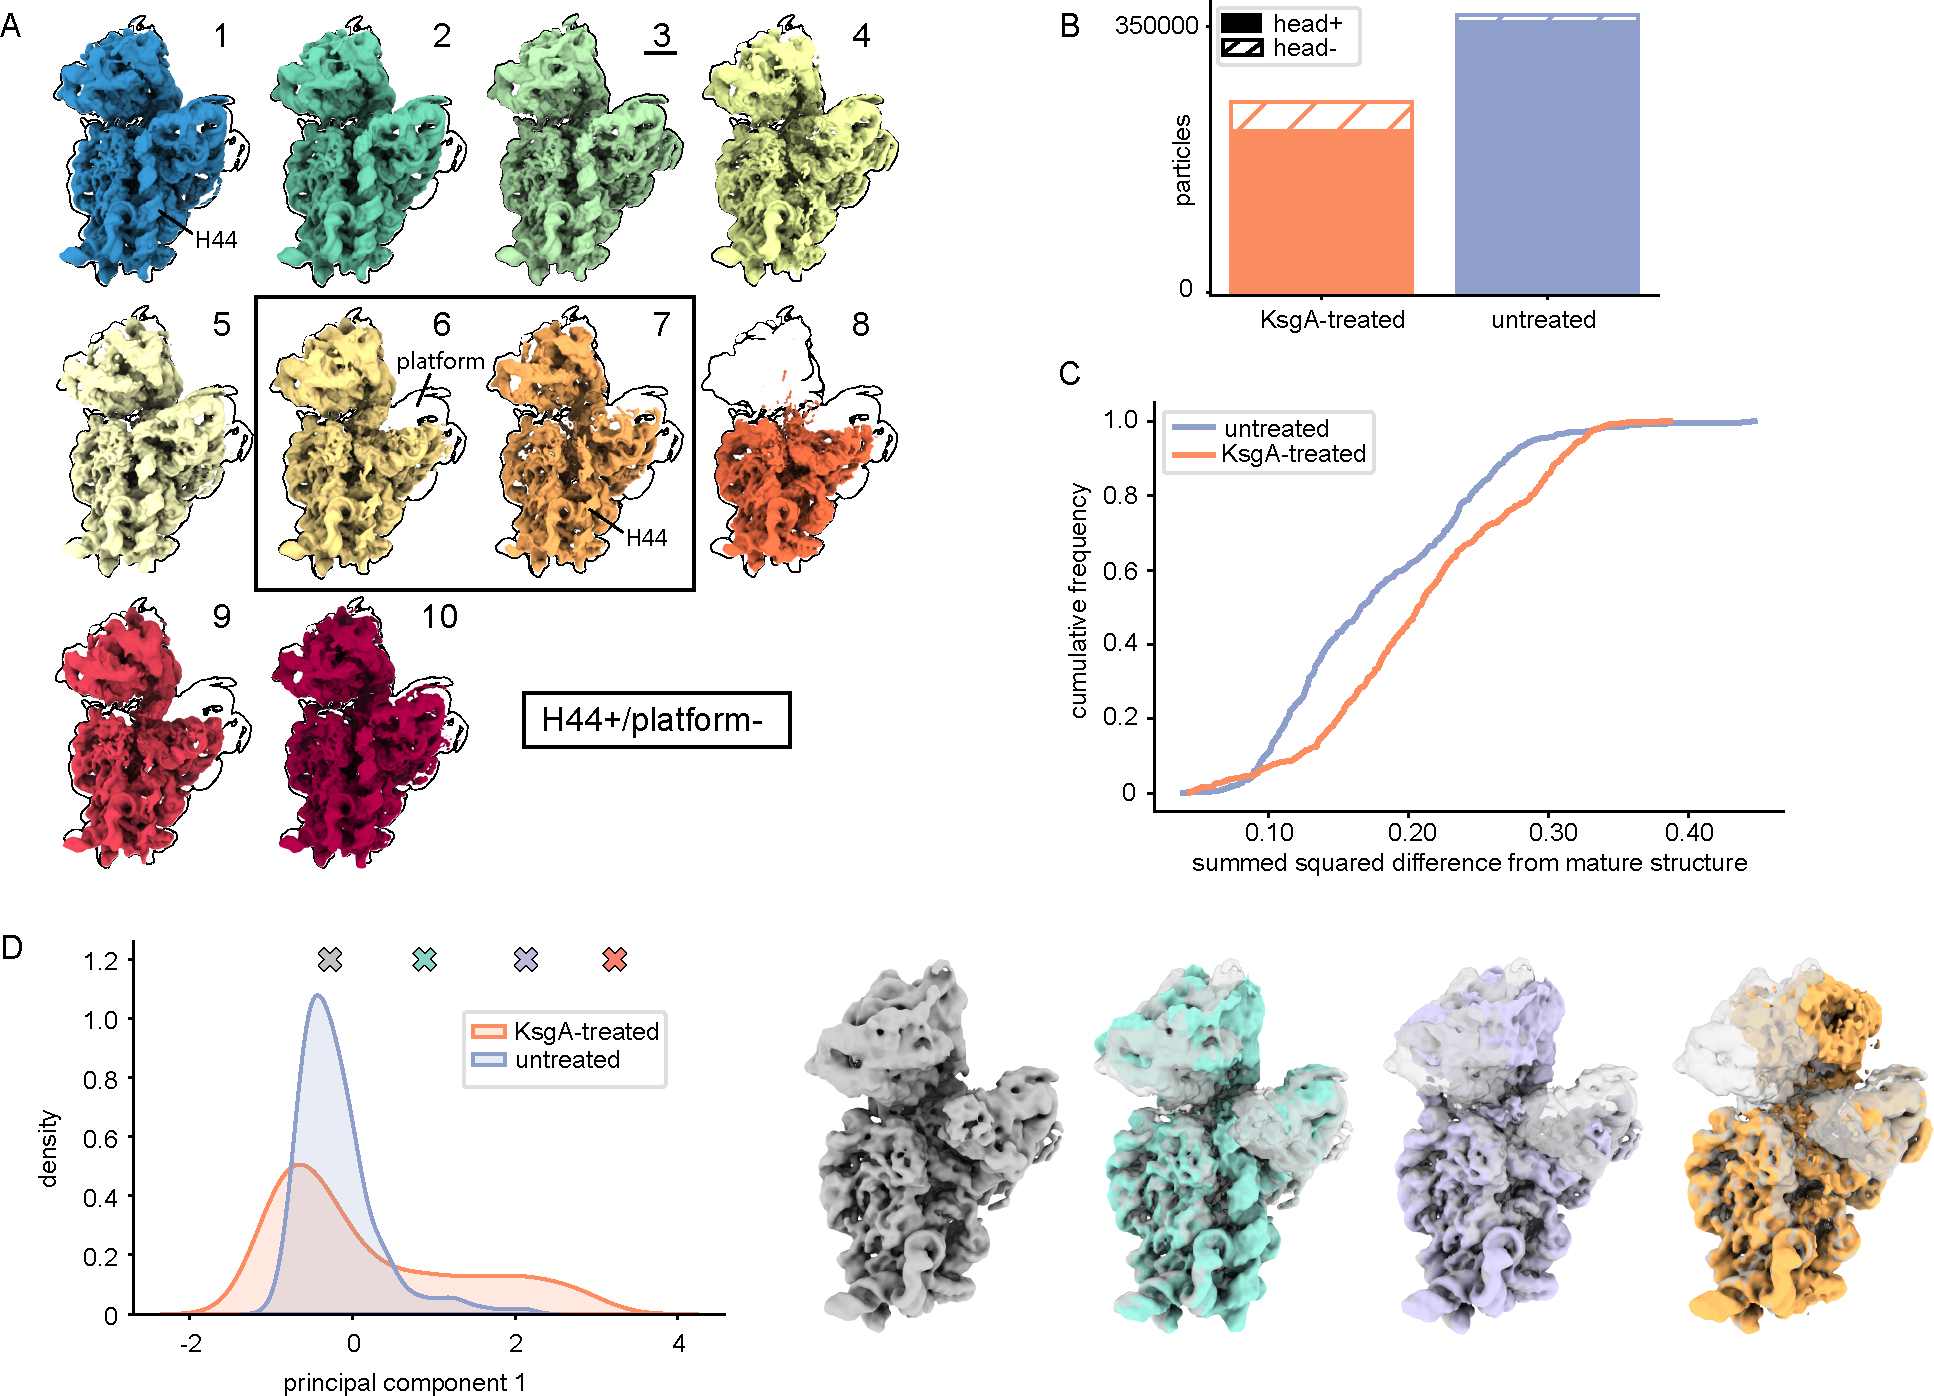
(A) Centroid maps for classes of untreated particles, as defined by MAVEn (see Supplementary Figure 11). Maps are outlined by the most mature class (3, underlined). A solid box surrounds maps that presented helix 44 density but lacked platform density. (B) Total number of head+ and head− particles in each dataset (see Methods). (C) Cumulative frequency plot for normalized summed squared difference values calculated between individual binarized maps and the paired mature 30S reference map (see Methods). (D) Principal component analysis was performed on the voxels within a mask corresponding to the native H32/H33 region in 500 volumes sampled from the head+ subset of latent space for each dataset. The density distribution along the first principal component is shown for each dataset. Colored markers indicate positions along principal component 1 from which the volumes in the right panel were sampled. The initial gray volume is overlaid with each structure for reference.
KsgA induces partial disassembly of the ribosomal SSU.
Because particles were less mature upon addition of KsgA, we reasoned that KsgA binding may lead to partial disassembly of nearly-mature 30SΔksgA particles. To explore this possibility biochemically, we asked whether KsgA binding led to dissociation of r-proteins by treating immature 30SΔksgA particles with a 10-fold molar excess of KsgA at 37°C for 20 min. Following the incubation, the ribosomal particles were separated from free r-proteins by ultracentrifugation and the pelleted particles were analyzed by quantitative mass spectrometry40–42. Interestingly, we found that the r-protein composition after KsgA-treatment was indistinguishable from that of the untreated immature 30SΔksgA particles (Supplementary Figure 1C), indicating that r-proteins do not appreciably dissociate upon KsgA binding. Instead, these data support a model in which KsgA binding causes uncoupling of the head and body, with each domain remaining bound by r-proteins, but now capable of rotating relative to one another.
To quantify the destabilization of the head upon KsgA treatment, we employed “voxel principal component analysis” (vPCA) approach43–46 (Supplementary Figure 12, and Methods) that leveraged cryoDRGN’s ability to generate many density maps. This vPCA method allowed us to visualize head domain motions within our structural ensembles, and to compare the degree of motion before and after addition of KsgA. Indeed, with vPCA, we observed a long-tailed distribution along principal component 1 specifically in the KsgA-treated dataset, and volumes sampled within the tail bore an undocked and rotated conformation of the head domain (Figure 5D). The presence of particles with undocked heads specifically in the KsgA-treated dataset supports a model in which KsgA binding causes uncoupling of the body and head, permitting free rotation of the head domain (Supplementary Video 1).
KsgA recognizes an inactive conformation of a key RNA helix.
This apparent KsgA-induced structural uncoupling was surprising and led us to hypothesize that specific particles accumulating in the ΔksgA strain may subtly differ from mature, active 30SWT particles, with this difference allowing for specific recognition and remodeling by KsgA. According to such a “proofreading” model47, KsgA would preferentially bind to such particles, induce structural remodeling through uncoupling of the head and body, and thus allow the particle another opportunity to re-assemble into an active form.
To test this hypothesis, we carefully inspected the untreated dataset for evidence of such structures. Helix 44 (H44) is traditionally considered to be one of the last elements of the 30S ribosome to form48, and thus we were surprised that the majority (76%) of the 30SΔksgA particles had significant H44 occupancy and that this proportion decreased to 19% upon addition of KsgA (Figure 6A, see Methods). Visual inspection of the centroid volumes from the untreated sample (Figure 5A), and quantitation of H44 occupancy revealed many particles in which H44 was present even in the absence of platform structural elements uS11 and H45, suggesting premature H44 docking (Figure 6B). Given these observations and the proximity of H44 to the KsgA binding site, we hypothesized KsgA may be recognizing a structural feature related to this premature H44 docking. In support of this hypothesis, we noted a substantial population of particles that, when queried individually for H44 occupancy (see Methods), displayed H44 occupancy between 0.4 and 0.6, which was suggestive of H44 adopting non-canonical conformations (Figure 6A). Indeed, volumes sampled from within this region displayed H44 in an unexpected, but previously reported inactive conformation49 in which H44 is “unlatched” and moved away from the body of the ribosome. This conformation, which was first discovered in the 1960s by Elson and colleagues, is not competent to bind to 50S particles or support translation50.
Figure 6: KsgA recognizes and remodels inactive subunits.
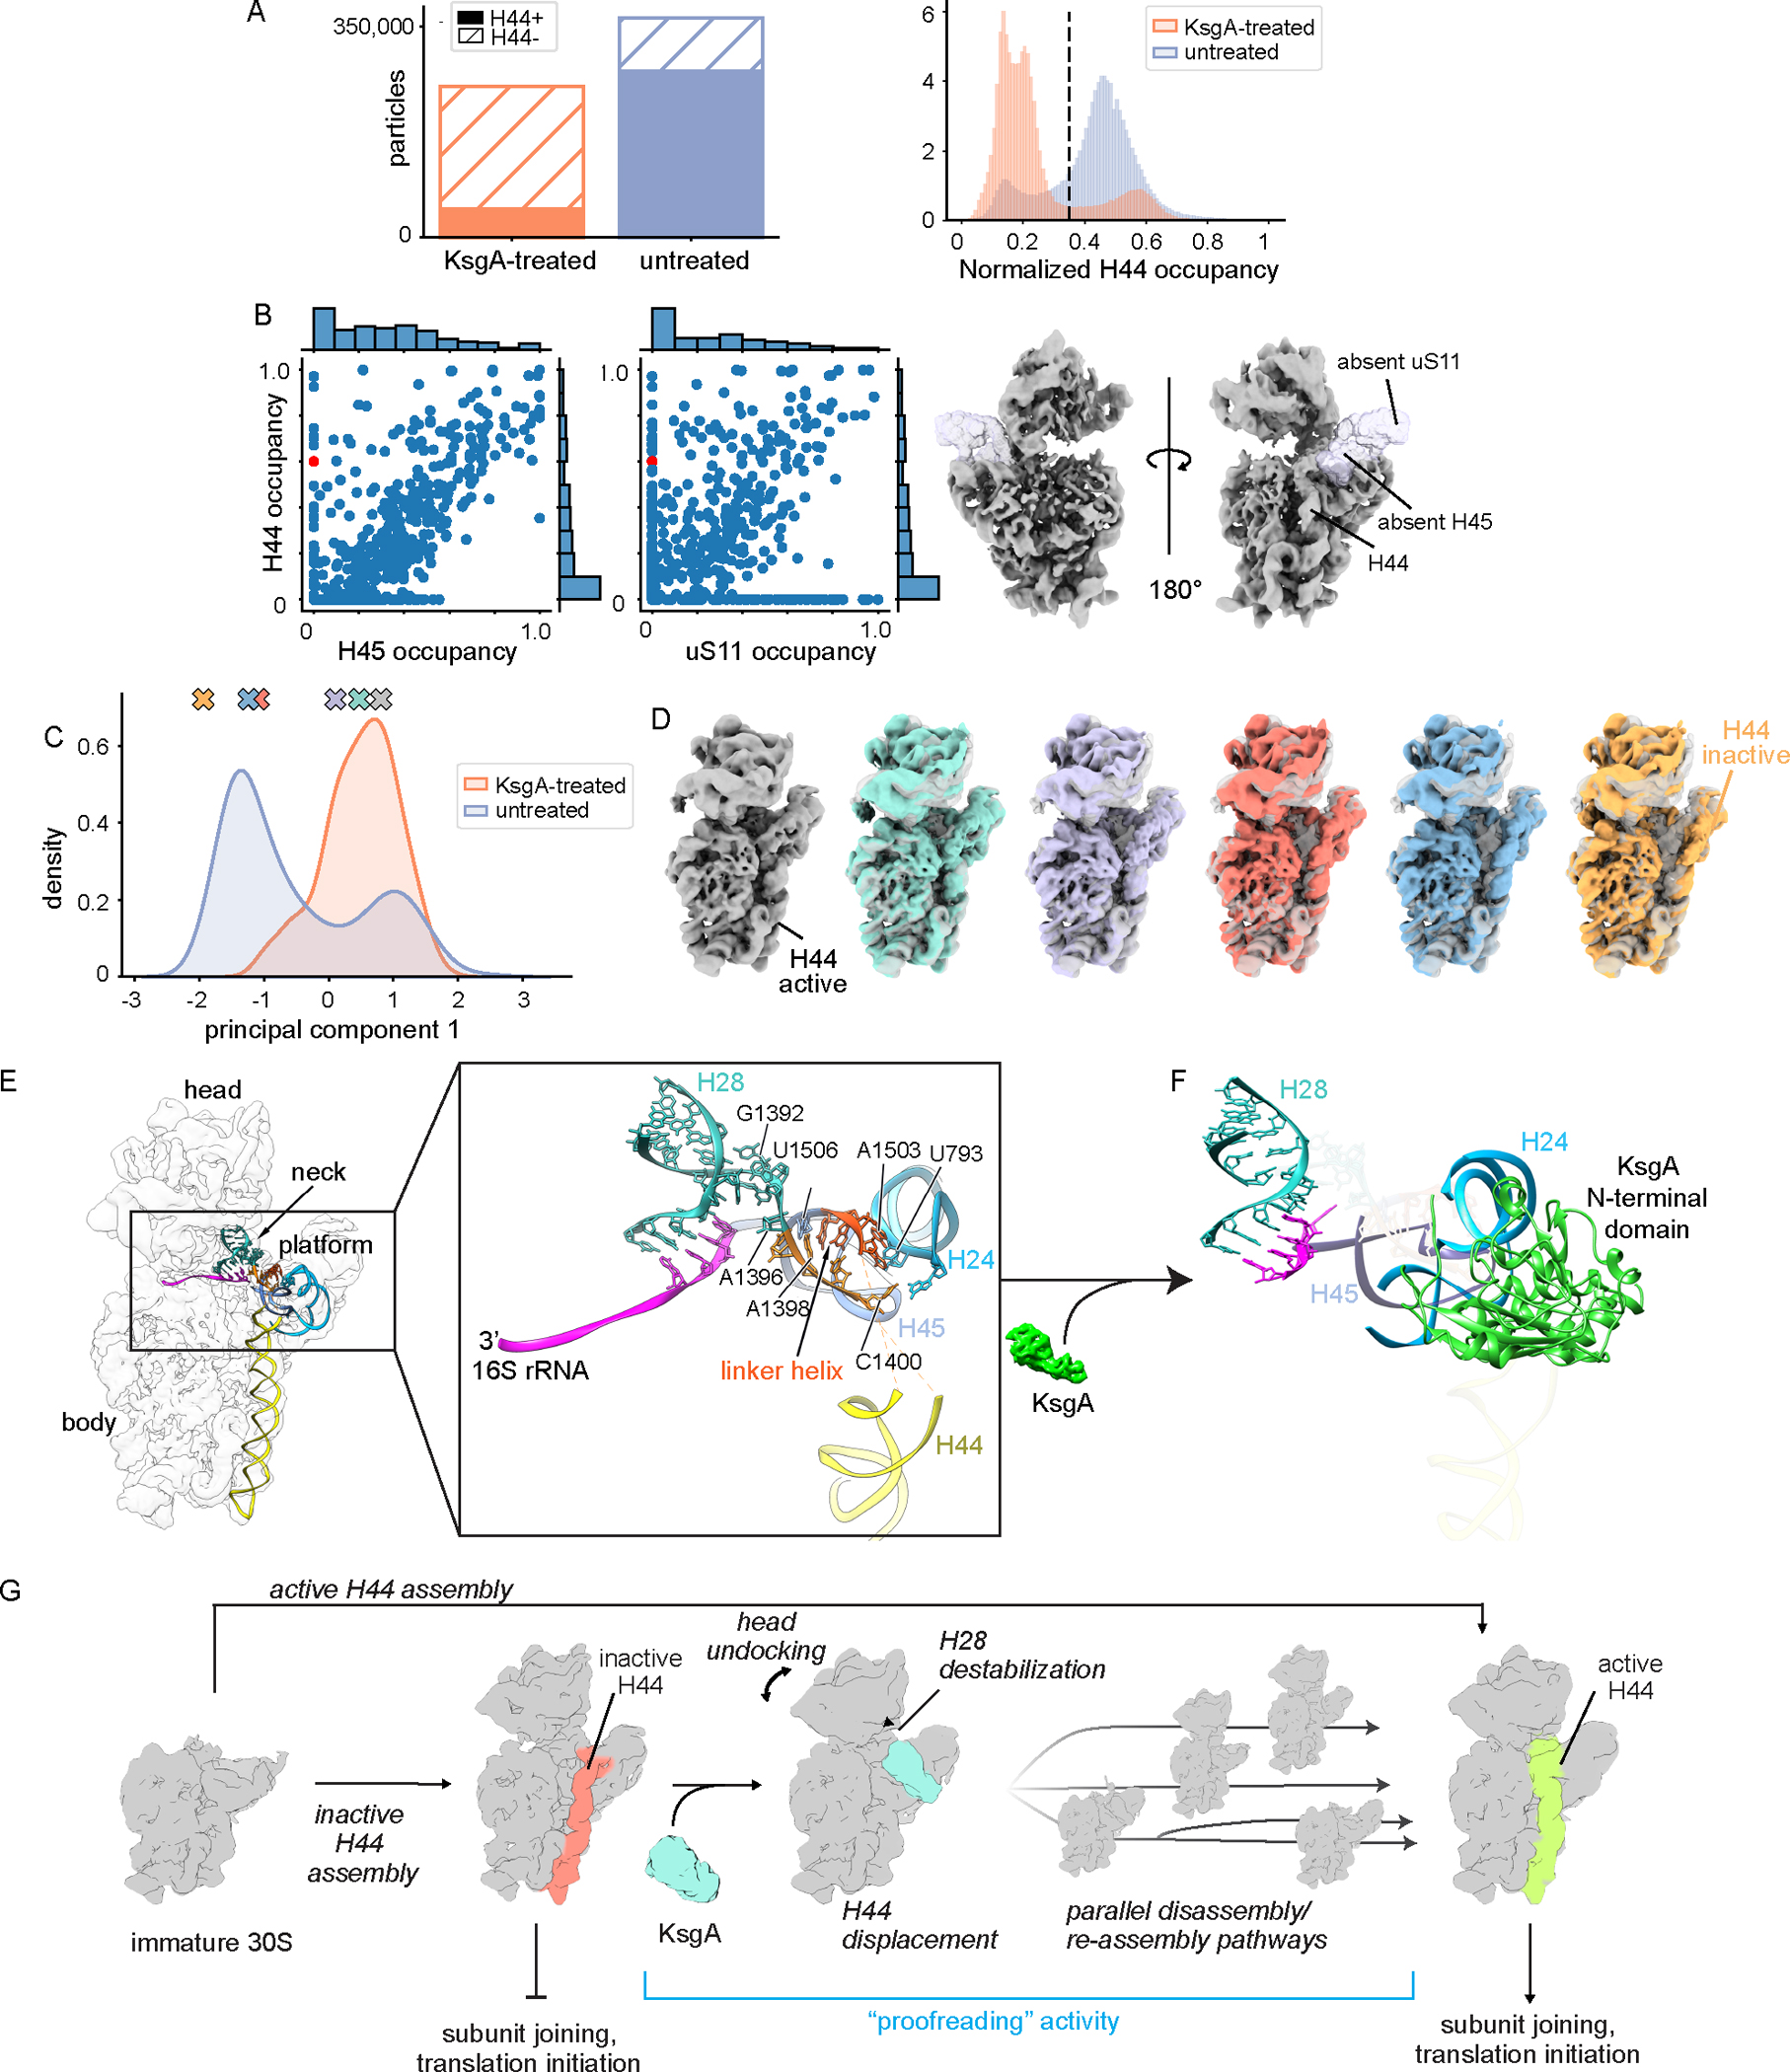
(A) Bar chart displaying the total number of H44− and H44+ particles in each dataset (left), and histogram depicting the occupancy of helix 44 in all particles from both datasets (right). The dashed line notes the occupancy threshold used to distinguish H44+ and H44− particles. (B) Occupancy correlations between H44 and platform elements H45 and uS11 in maps from the untreated particles (left). An example H45−/uS11−/H44+ volume is shown (right) and the red markers indicate the position of this volume in the scatterplots. (C) Results from performing principal component analysis on the voxels within a mask surrounding H44 for 1000 volumes sampled from the H44+ subset of each dataset. The marginal distribution of the first principal component values from the two datasets is shown. (D) Volumes sampled along principal component 1 are noted by colored markers in (C). (E) Molecular model of the untreated 30SΔksgA structure with H44 in the inactive conformation. The inset highlights the linker helix that forms in this structure and contributes to stabilization of the head and platform domains, with nucleotides important in stabilizing these domains annotated. (F) Molecular model of KsgA bound to the 30SΔksgA particle depicting an equivalent region and in a similar orientation to that shown in the (E). Putative steric clashes that would exist between KsgA’s N-terminal domain and key rRNA helices are noted by semi-transparent rendering of these helices. (G) Integrated model depicting KsgA’s proposed role in late stage assembly of the small ribosomal subunit.
To better quantify the number of ribosomal particles in the inactive and active conformations we again employed our vPCA approach, now focusing on the H44 region. We observed that the first principal component cleanly segregated volumes on the basis of the inactive versus active conformation (Figure 6C), and that sampling volumes along this principal component allowed for visualization of the active-inactive transition (Figure 6D, Supplementary Video 2). By plotting the particle distribution along principal component 1 within each dataset we found that the inactive H44 conformation was over-represented in the untreated dataset, and that this inactive conformation effectively disappeared upon treatment with KsgA (Figure 6C). These observations were consistent with a role for KsgA in pruning the H44 inactive state and were reminiscent of classic proofreading systems47.
KsgA binding destabilizes a key rRNA linker helix.
To understand the mechanism by which KsgA prunes the inactive ribosomal particles and induces uncoupling of the head and platform domains, we built a molecular model (Table 1, Supplementary Figure 7 and Supplementary Figure 14) using the H44-inactive density map from the untreated dataset (Supplementary Figure 3A and Supplementary Figure 10; class 2). In our structure, residues 1397–1400 and 1502–1505 formed a small “linker helix” at the junction between body, platform, and neck. We found that this linker helix was primed to position and stabilize helix 28 (H28), which is the main structural element determining the position of the head domain with respect to the body domain, and it also appeared to stabilize H24 and H45 in the platform domain (Figure 6E). In contrast, this linker helix and portions of H28 were absent in maps derived from KsgA-bound 30SΔksgA particles, and the linker helix space was occupied by KsgA’s N-terminal domain (Figure 6F). This analysis suggested that upon binding, the N-terminal domain of KsgA disrupted this critical linker helix, and thereby destabilized the platform domain, induced uncoupling of the head and body domains, and simultaneously displaced inactive conformations of H44.
Taken together, these data support a model in which 30S particles can assemble completely in the absence of KsgA, but in doing so produce a subset of inactive particles. Our results suggest that when KsgA is present, it specifically targets these inactive particles, with KsgA binding resulting in partial subunit disassembly through undocking of inactive helix 44, destabilization of the platform domain, and uncoupling of the head and body domains via destabilization of a key linker helix in the subunit neck. We hypothesize that upon KsgA methylation and subsequent dissociation, these particles can then re-assemble with a new opportunity for helix 44 to adopt an active conformation, which, in totality, should increase the overall fidelity of the assembly process (Figure 6G).
DISCUSSION
KsgA as an assembly factor.
Whereas KsgA’s non-essential but highly conserved role in rRNA methylation has been known for decades9–11,51, recent genetic and biochemical assays have suggested an additional role for KsgA in supervising ribosome biogenesis16. Indeed, treatment of 30S subunit components with KsgA during in vitro reconstitution increases the translational activity of the resulting particles, but this effect is independent of the methylation activity15,52,53. KsgA deficient in methylation activity can also rescue the cold-sensitive phenotype of a strain expressing a mutant of Era (Era E200K), an essential assembly factor for the 30S subunit54. These results have led to a general model of KsgA acting as a late-stage ribosome biogenesis factor. In this model, KsgA is hypothesized to couple its binding to conformational rearrangements within the 30S that would allow that particle to more effectively undergo subunit joining and initiate translation16, with methylation serving to aid KsgA dissociation. Our study illuminates these long-hypothesized structural transitions, and reconciles decades of biochemical and genetic studies into an integrated model of KsgA’s role in late-stage ribosome biogenesis.
Our data is consistent with a “proofreading” role for KsgA, wherein it specifically recognizes subtly inactive subunits and, upon binding, displaces both the critical intersubunit helix 44 as well as an underappreciated linker helix that helps to stabilize the platform domain and to orient the head domain relative to the body. According to our structures, KsgA binding induces structural destabilization that uncouples the body, head, and platform domains, resulting in partial subunit disassembly. Interestingly, this partial disassembly does not involve dissociation of any of the r-proteins already included in the assembly intermediates. Our structures additionally confirm and highlight key atomic contacts that facilitate binding of substrate adenosines in the KsgA active site, and they provide a plausible structural model for: 1) the order of base methylation; 2) how the rRNA contacts are maintained as successive substrates are flipped into the active site; and 3) how the methylated products are released. Taken together, these structures yield an assembly factor-mediated proofreading model in which nearly mature but inactive particles are recognized and destabilized by KsgA binding, resulting in partial subunit disassembly. We hypothesize that upon methylation and subsequent KsgA dissociation, these particles reassemble, and are thereby provided another opportunity to adopt a translationally active conformation (Figure 6G). We interpret this role of KsgA as a mechanism to maximize the efficiency of the assembly process for ribosomal small subunits, and to enforce the proper assembly order.
Finally, we note that our KsgA-bound structure, like others recently published34,35 is incompatible with subunit joining, explaining how expression of a catalytically inactive variant KsgAE66A profoundly inhibits cell growth16. Overall, this proposed role of KsgA resembles that recently assigned to RbgA, a ribosome assembly factor in Bacillus subtilis, which ensures the 50S subunit follows a canonical maturation pathway where the functional sites are the last structural motifs to mature55.
Uncovering coupled assembly reactions through structure.
The classic Nomura assembly map21,22, which depicts ribosomal protein binding inter-dependencies, has long guided our understanding of small subunit assembly. Incorporating the docking status of rRNA helices into such a map could, in principle, reveal new information linking assembly of ribosomal proteins and rRNA helices. Indeed, generating such an extended Nomura map has long been a goal of the ribosome biogenesis field2,3,23,56–59. However, experiments to determine such interdependencies are challenging, as one must assess the structural status of each rRNA helix with single-molecule resolution, and correlate its status with the presence or absence of each r-protein across the population. Nonetheless, we hypothesized that cryoDRGN’s powerful generative model, which we found can resolve rRNA helices and r-proteins in hundreds-to-thousands of density maps, might be well suited for such a task.
To test this hypothesis, we constructed a directed graph in which each node represented one rRNA helix or r-protein, and an edge between any two nodes reflected a dependency. To calculate inter-node dependencies, we used the MAVEn results from the KsgA-treated dataset and plotted the resulting dependency map (Figure 7; Methods). Consistent with existing data supporting early formation of the ribosomal body relative to the head31, this analysis highlighted that primary binders – rRNA helices and r-proteins whose occupancy was independent of all other elements – were primarily located in the body (Figure 2B). In contrast, full occupancy of the head helices required both the body elements and rRNA helices 28, 35, and 36, which form the SSU “neck” (Figure 7; Supplementary Figure 15). This analysis further highlighted the highly cooperative nature of head domain assembly. Specifically, sampled volumes exhibited either minimal or nearly complete occupancy for most head elements, resulting in no observable dependencies between head r-proteins uS3, uS14, uS9, and uS7, and the core head helices (H29, H30, H31, H37-H43). In contrast, the rRNA helices at the most extreme terminus of the head (H32 and H33) appeared to depend on the formation of the core head elements, and indirectly on helix 28. We interpret this dependence as reflecting the mobility of the undocked head in many KsgA-treated particles; this interpretation is consistent with our vPCA analysis that showed increased head mobility upon KsgA treatment. Taken together, this analysis allowed for an expansion of the classic ribosome assembly maps to now include rRNA helices, and we expect that such maps can be further refined as additional assembly intermediates are structurally characterized.
Figure 7: Network analysis reveals assembly dependency map for KsgA-treated SSUs.
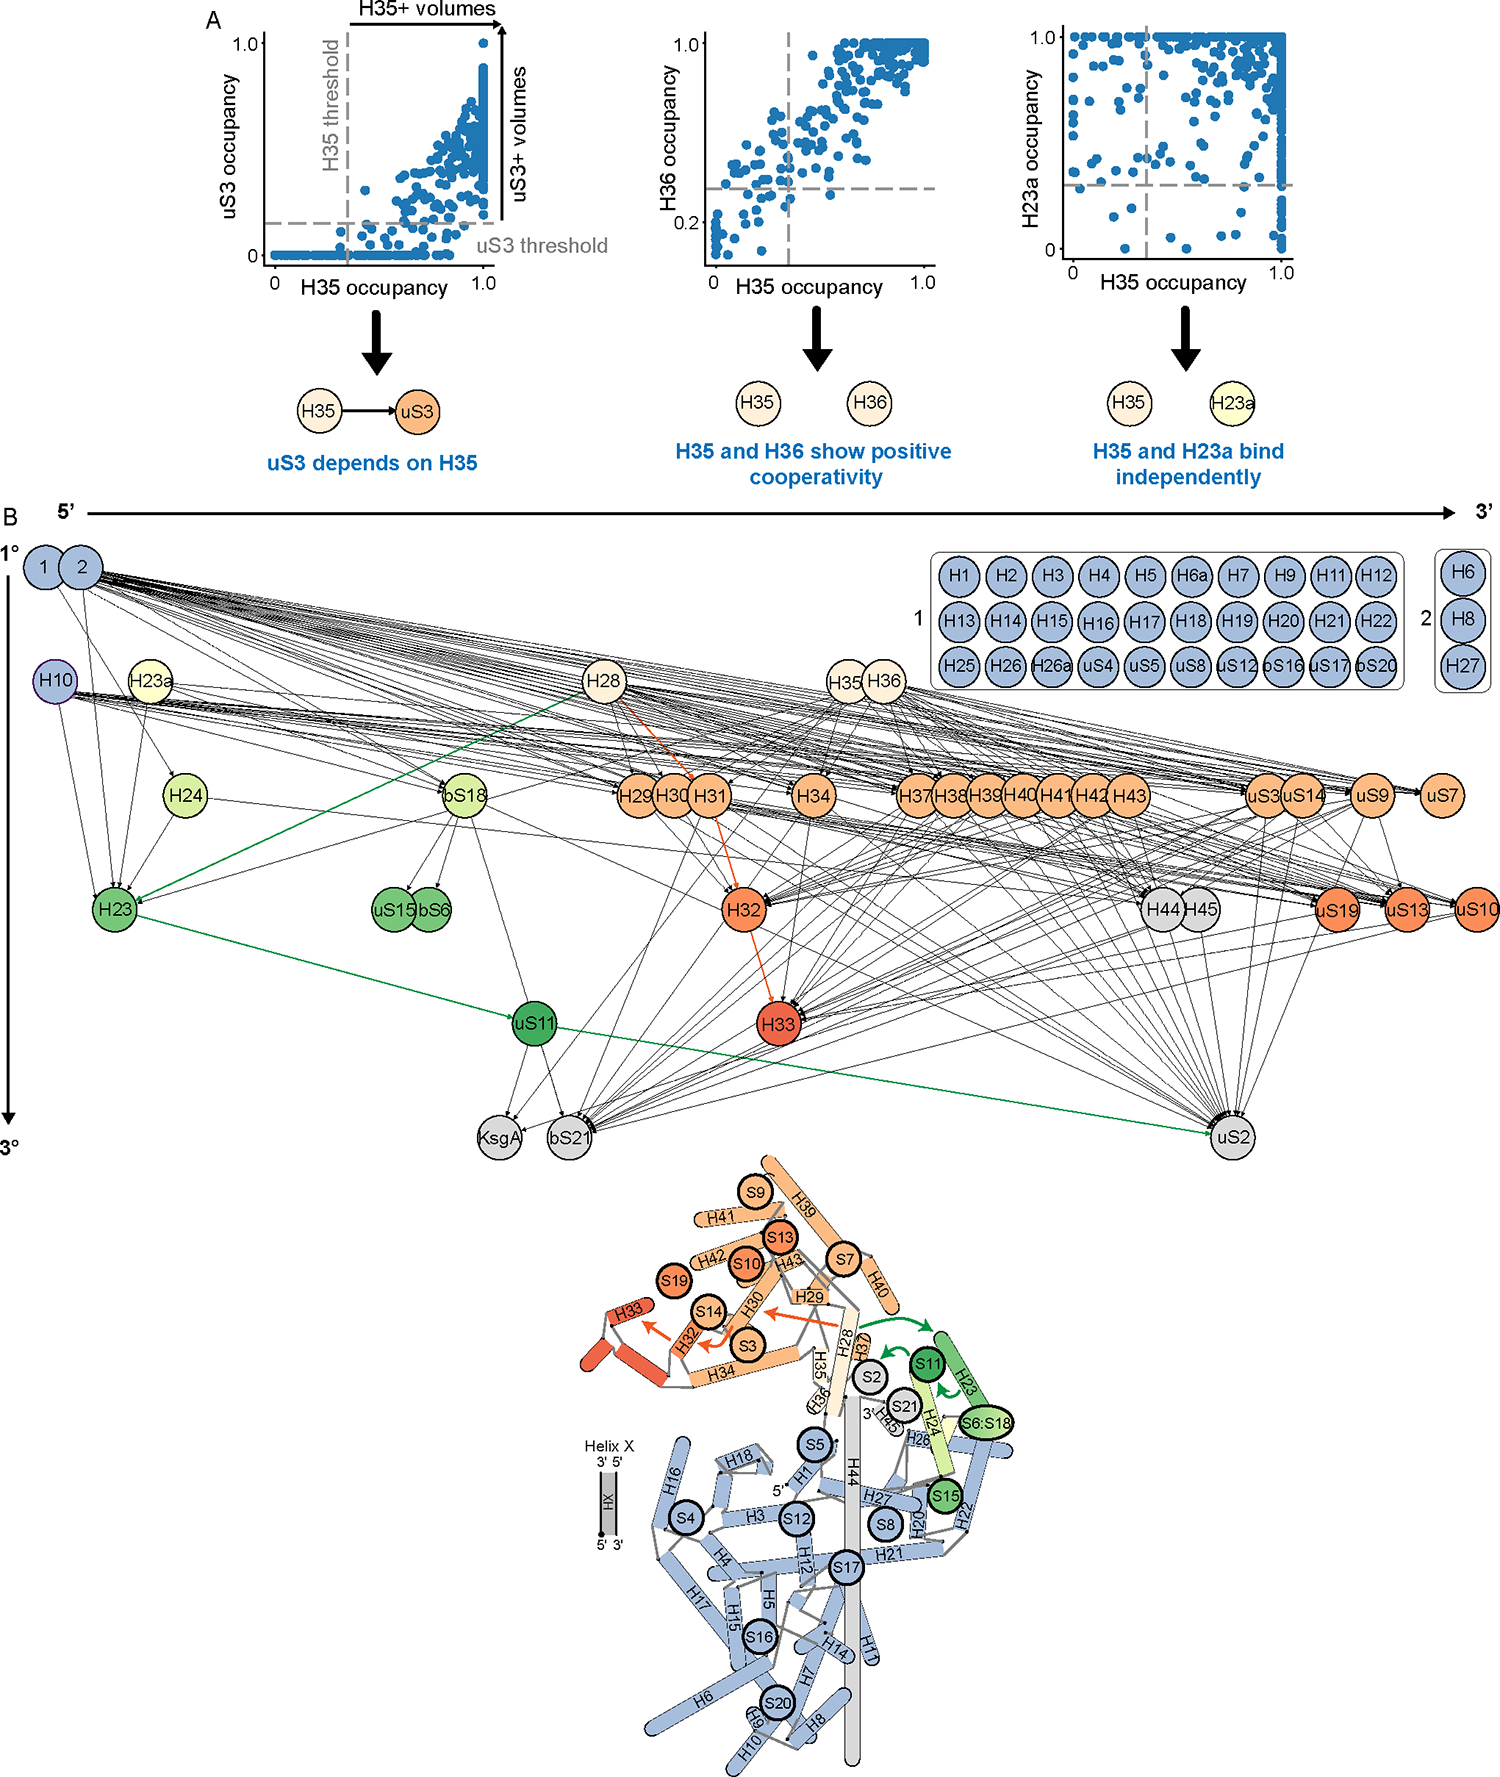
(A) Examples of dependency relationship calculations, as described in Methods. Dependency relationships were defined as a unidirectional requirement of occupancy of a given subunit for occupancy of another. (B) A directed acyclic graph is constructed from the calculated dependency relationships. Each node is an r-protein or rRNA helix, and each dependency relationship is a directed edge from the independent subunit to the dependent subunit. Edges of the graph were pruned to eliminate direct paths between any two nodes if there existed also an indirect path between these nodes. Nodes were also consolidated (boxed nodes) if they had all the same incoming and outgoing edges. With the exception of the consolidated body elements, nodes are arrayed horizontally 5′-to-3′ along the rRNA transcript and positioned vertically to reflect primary, secondary, and tertiary elements as determined by this graphical analysis. Nodes are colored by domain in line with the model below, which was adapted from Sykes & Williamson 200962. Colored arrows highlight representative key links between helix 28 and downstream head and platform domain elements.
Systematic analysis of heterogeneous structural ensembles.
Traditional approaches to resolving structural heterogeneity employ iterative rounds of hierarchical 3D classification, and require significant expert-guided intervention, with users supplying the number of classes within each round, as well as the total number of rounds of classification (Figure 1B). Although recent work has proposed quantitative standards for determining when a dataset has been sufficiently classified60, questions remain about how to choose the number of classes or the classification end-point, and how robust results are to these classification parameters. Thus, methods to analyze and quantify structural heterogeneity that are more robust, unbiased, and reproducible are desirable. The coupled cryoDRGN-MAVEn approach we present here represents one avenue for conducting this type of analysis.
Comparing the results of traditional 3D classification and MAVEn on the datasets presented here suggests that the two approaches identify grossly similar classes of particles (Figure 1). However, the application of MAVEn to cryoDRGN-generated maps permitted us to interrogate heterogeneity on a more granular scale than permitted by 3D classification, allowing maps that differed only by the presence or absence of single proteins to be identified (Figure 2A–B). Notably, guided by this analysis, one can readily identify particle subsets that, when analyzed with traditional tools, produce reconstructions mimicking those from cryoDRGN (Supplementary Figure 16, see Methods). MAVEn also identified rare structural states missed by traditional classification, including a small subpopulation of immature KsgA-bound 30S particles completely lacking density for the head (Figure 3B). Furthermore, by sampling hundreds of volumes from the structural ensemble, MAVEn has greater statistical power to extract correlative relationships between subunits of interest, which we used to identify individual binding prerequisites for KsgA (Figure 3D). Importantly, we find that the results from applying MAVEn are highly reproducible when repeated with different random seeds for the initial k-means clustering step (Supplementary Figure 17), suggesting that this approach indeed provides a robust analysis of the heterogeneity in the dataset.
MAVEn nonetheless has several key limitations — principally that it is an atomic model-based approach and relies on the assumption that subunits are either present in their native conformation, or absent. As exemplified by helix 44 and the head domain, this approach is challenged by conformational heterogeneity, where subunits may be present but in an alternative location. In such instances, we found applying a voxel-based principal component analysis (vPCA) to relevant subsets of the particle stack was a powerful approach to characterize the local motions of conformationally flexible subunits (Figure 5D, 6C, Supplementary Figure 12).
In addition to elucidating the role of KsgA in ribosome biogenesis, the approaches outlined here for systematically analyzing and quantifying structural landscapes may prove more broadly useful in realizing the single-molecule potential of cryo-EM. In combination with the various machine learning-based approaches recently developed for generating large volume ensembles from cryo-EM datasets20,61, these described MAVEn and vPCA approaches provide new tools to leverage the heterogeneity present in single particle cryo-EM datasets to uncover biological insights about dynamic proteins and their complexes.
MATERIAL AND METHODS
Bacterial strains and protein overexpression clones.
The parental Escherichia coli K-12 (BW25113) and ksgA null (JW0050–3) strains from the Keio collection24 were obtained from E. coli Genetic Resource Center, Yale University. The sequence of the ksgA gene (NCBI reference sequence: NC_000913.3) with a thrombin-cleavable N-terminal His6 tag was optimized for overexpression in E. coli cells using GeneOptimizer software, synthesized (Life Technologies; Thermo Fisher Scientific), cloned into the carrier pMA-T plasmid using the SfiI and SfiI cloning sites, and subsequently subcloned into the final expression vector pET15b using the NdeI and a BamHI restriction sites.
Purification of ribosomal particles.
The immature 30SΔksgA subunits were purified from E. coli ksgA Keio collection24 deletion strain JW0050–3; 30SWT subunits were purified from parental strain BW25113. All strains were grown in LB (4L for JW0050–3; 3L for BW25113) at 25°C with shaking (225 rpm). The rRNA from ΔksgA and wild type cells were extracted and analyzed by agarose gel electrophoresis according to Loeng et al18. For ribosome purification, cells were cooled to 4°C and collected by centrifugation at 3,000g for 15 mins in a Beckman JLA-8.1000 rotor upon reaching OD600=0.2 (JW0050–3) or OD600=0.6 (BW25113). Pellets were then resuspended in 14 mL buffer A [20 mM Tris-HCl at pH 7.5, 10 mM magnesium acetate, 60 mM NH4Cl, 0.5 mM EDTA, 3 mM 2-mercaptoethanol, cOmplete protease inhibitor tablet (Roche), DNase I (Roche)]. Resuspended cells were lysed by sonication on ice and the cell lysate was centrifuged at 42,000g for 30 minutes in a Beckman 70Ti rotor to clear cell debris. The supernatant was layered over a 1.1 M sucrose cushion in buffer A lacking protease inhibitors (3 mL supernatant and 3mL sucrose cushion) and centrifuged for 16 hours at 118,000g in a Beckman 70Ti rotor. The pellet containing the ribosomal particles was then resuspended in buffer E [10 mM Tris-HCl at pH 7.5, 10 mM Mg acetate, 60 mM NH4Cl, 3 mM 2-mercaptoethanol] (30SΔksgA) or buffer C [10 mM Tris-HCl pH 7.5, 10 mM Mg acetate, 500 mM NH4Cl, 0.5 mM EDTA, and 3 mM 2-mercaptoethanol] (30SWT). Resuspended crude ribosomes (~120 A260 units) were applied to 34 mL 10%–30% (w/v) sucrose gradients prepared in buffer E. Gradients were then centrifuged at 31,000g for 16 hours in a Beckman SW32Ti rotor and fractionated using a Brandel fractionator apparatus and an AKTA Prime FPLC system (GE Healthcare). The profile was monitored by UV absorbance at A254 and the relevant fractions were collected. Fractions for each ribosomal particle were pooled and spun down in a Beckman MLA-80 rotor for 16 hours at 108,000g. The resulting pellets (30SΔksgA) were washed and resuspended in 75 μL buffer E, flash frozen in liquid nitrogen, and stored at −80°C. Washed 70SWT pellets were resuspended in buffer F [10 mM Tris-HCl, pH 7.5, 1.1 mM magnesium acetate, 60 mM NH4Cl, 0.5 mM EDTA, and 2 mM 2-mercaptoethanol], and ~120 A260 units were applied to a 34 mL of 10%–30% (wt/vol) sucrose gradient prepared with buffer F. The gradient was centrifuged and fractionated, as above. Fractions containing 30SWT, which resulted from 70SWT dissociation in buffer F, were selected, pooled and pelleted as above. They were then resuspended in 200 μL buffer E, flash frozen, and stored at −80°C. Mature 70S ribosomes used for analysis by mass spectrometry were purified from the parental strain BW25113 as previously described41.
Protein overexpression and purification.
KsgA was purified from E. coli strain BL21-A1 transformed with the pET15b-ksgA plasmid. Cells were grown at 37°C with shaking (225 rpm) in LB medium supplemented with 100 μg/mL ampicillin; expression was induced at an OD600 of 0.6 by adding L-arabinose (0.2%) and IPTG (1mM) and incubating at 25°C for 4 hours. Cells were harvested by centrifugation at 3,700g for 15 minutes and washed with 30 mL of PBS 1x buffer before resuspension in 20 mL of buffer A1 [50 mM Na2HPO4 at pH 7.5, 300 mM NaCl, 5% glycerol], with addition 1 mM PMSF, 1 mM benzamidine, 5 μg/ml leupeptin, 70 μg/ml pepstatin. The cells were lysed by sonication on ice, then centrifuged at 30,000g for 45 minutes to clear cell debris. The supernatant was filtered with a 0.45-μm syringe filter (Millipore) and loaded onto a HisTrap HP column (GE Healthcare). The column was washed with eight column volumes of buffer A1 containing 75 mM imidazole and six column volumes of buffer A1 containing 100 mM imidazole. KsgA was eluted with 250 mM imidazole in buffer A1. Purity of the fractions was monitored by SDS/PAGE and fractions containing KsgA protein were collected and pooled together. The N-terminal His6 tag was removed by digestion with thrombin (GE Healthcare) by adding the enzyme at a concentration of 10 Units per mg of KsgA protein during overnight dialysis against PBS. Precipitated protein was removed by filtration, and the filtrate was loaded on to a Hi Trap SP HP column (GE healthcare) equilibrated in buffer B1 [50 mM Na2HPO4 at pH 7.5, 50 mM NaCl, 5% glycerol]. The column was washed with ten column volumes of buffer B1 containing 80 mM NaCl and then eluted with buffer B1 containing 340 mM NaCl. Fractions containing KsgA were pooled and concentrated using a 10-kDa cutoff filter (Amicon), and the concentrated KsgA was then diluted in storage buffer [50 mM Na2HPO4 at pH 7.5, 50 mM NaCl, 5% glycerol] at the ratio of 1:10 before storage at −80°C.
Microscale thermophoresis experiments.
The amine residues of purified KsgA were fluorescently labeled with NHS red using the Protein Labeling Kit RED-NHS 2nd Generation (Cat # MO-L011 Nanotemper). The labeling reaction was performed according to the manufacturer’s protocol by mixing KsgA at a final concentration of 20 μM with a 3-fold molar excess of dye at room temperature for 30 minutes in the dark. The provided labeling buffer was supplemented with 10 mM magnesium acetate. Free dye was eliminated using the Gravity Flow Column B pre-equilibrated with buffer containing 10 mM Tris-HCl pH 7.5, 15 mM MgCl2, 6 mM 2-mercaptoethanol and 0.05% Tween 20. Labeled KsgA was diluted in MST buffer [10mM Tris-HCl pH 7.5, 60mM NH4Cl, 15 mM Mg acetate, 6 mM 2-mercaptoethanol, 0.05% Tween 20] to a concentration of 100 nM, and a serial dilution of ribosomal particles in MST buffer was prepared. The labeled KsgA was mixed 1:1 (v/v) with each different concentration of ribosomal particles, yielding a final concentration of KsgA at 50 nM, and concentrations of ribosomal particles spanning from 0.053 nM to 1.75 μM. All reactions were incubated for 20 minutes at 25 °C before loading into premium glass capillaries (NanoTemper Technologies). Microscale thermophoresis (MST) measurements were performed using the Monolith NT.115 microscale thermophoresis instrument (NanoTemper Technologies) at 25 °C. Experiments were conducted at LED power of 100% and medium MST IR-laser power. The resulting binding curves and dissociation constants (KD) were obtained by plotting the normalized fluorescence (Fnorm = F1 /F0) versus the logarithm of the ribosomal subunit concentration. The obtained KD values were calculated from three independently performed experiments using the NanoTemper analysis software (version 2.2.6).
Quantitative mass spectrometry analysis.
For mass spectrometry analysis of KsgA-treated immature 30SΔksgA particles, KsgA (10 μM) was mixed with 30SΔksgA particles (1 μM) in a 200 μL reaction in modified buffer E containing 6 mM 2-mercaptoethanol, and the reaction mixture was incubated at 37°C for 20 minutes. 50 μL aliquots of each reaction were laid over a 150 μL 1.1 M sucrose cushion in buffer E and subsequently ultra-centrifuged at 436,000g for 3.5 hours in a Beckman Coulter TLA-100 rotor. The pellets were resuspended in 20 μL of buffer E and concentration was measured at A260 prior to flash freezing in liquid nitrogen and stored at −80°C. The sample containing untreated 30SΔksgA particles was prepared in a similar manner, but KsgA was not added to the initial reaction.
Samples were prepared in triplicate for mass spectrometry by resuspending 10 pmol of each sample in ribosome lysis buffer [20 mM Tris, pH 7.6, 200 mM NH4Cl, 0.5 mM EDTA, 10 mM MgCl2, 6 mM 2-mercaptoethanol, 13% trichloroacetic acid] and spiking each resulting sample with a constant volume of 15N-labeled cellular lysate that was previously assessed to provide roughly stoichiometric quantities of ribosomal proteins for normalization. Samples were incubated on ice for 30 minutes, then centrifuged for 30 minutes at 4°C and washed with 10% TCA and acetone. Following the final wash, pellets were dried at room temperature for 30 minutes, then resuspended in 100 mM NH4HCO3 and 5% acetonitrile. Samples were reduced by adding dithitreitol (5 mM) and incubating in a 65°C water bath for 10 minutes, then alkylated by adding iodoacetamide (10 mM) and incubating at 30°C for 30 minutes. Trypsin digestion was carried out overnight at 37°C, then samples were desalted using Pierce C18 spin columns. For each sample, peptides were spiked with Pierce iRT standards (450 fmol) and then were loaded in buffer MSA [4% acetonitrile, 0.1% Formic acid] onto an Acclaim PepMap 20mm C18 column coupled to an EASYSpray nano 500mm analytical column (Thermo) through a switching valve. After washing with MSA, peptides were eluted from the analytical column across a 90 minute 4%–40% gradient of acetonitrile in MSA and injected onto a Q-Exactive HF-X mass spectrometer (Thermo). Data was collected in replicate either in variable-window DIA or top-12 DDA acquisition modes. DIA acquisitions used the following parameters: 70 variably spaced MS2 isolation windows spanning 390–1390 Thompsons with 25 NCE collision energy, 35 ms max injection time, 5e5 AGC target, and 15k resolution, with 3 MS1 scans over the range 390–1390 Thompsons collected at 120k resolution, 3e6 AGC target, 35 ms max injection time evenly interspersed over the 70 MS2 scans each cycle. Top-12 DDA acquisitions used the following parameters: MS1 acquisition at 60k resolution, 3e6 AGC target, 50 ms max injection time scanning 390–1390, and MS2 acquisitions at 15k resolution, 25 NCE collision energy, 1e5 AGC target, 100 ms max injection times, and 2 Thompson isolation windows. DDA results were pooled and searched with Comet63 and iProphet64 to create a library for searching DIA data. DIA data were manually curated to select high signal peaks in Skyline65, and the resulting report was exported for normalization. Peptide abundances were normalized to the intensity of the 15N peak, and protein intensity was calculated as the median normalized MS1 peptide intensity. The stoichiometry relative to the wildtype 70S ribosome was calculated for each protein by dividing the protein intensity in the given sample by the median protein intensity in the wildtype 70S samples. The results of these stoichiometry calculations were then hierarchically clustered.
Cryo-electron microscopy.
Immature 30SΔksgA particles were diluted in modified buffer E that contained 6 mM 2- mercaptoethanol to a final concentration of 720 nM. For KsgA-treated immature 30SΔksgA particles, KsgA was added in a 10-fold excess to obtain a solution with ribosomal subunits and KsgA at concentrations of 0.5 μM and 5.2 μM, respectively. Both samples were incubated at 37 °C for 20 minutes before sample vitrification was performed in a Vitrobot Mark IV (Thermo Fisher Scientific Inc.) at 25 °C and 100% humidity. For all grids, 3.6 μL of the relevant sample was applied to holey carbon grids (C-flat CF-2/1–3Cu-T) that had been glow discharged in air at 15 mA for 15 seconds. Grids were blotted for 3 seconds with a blot force of +1 before plunging.
Datasets for the immature 30SΔksgA subunits and KsgA-treated immature 30SΔksgA were collected using SerialEM software66 in the Titan Krios at FEMR-McGill (Table 1). Movies were recorded in a Gatan K3 direct electron detector equipped with a Quantum LS imaging filter. The total dose used for each movie was 45 e/Å2 equally spread in 33 frames for the untreated dataset, and 71 e/Å2 total dose across 30 frames for the KsgA-treated dataset. Both datasets were collected at a magnification of 105,000x, yielding images with a calibrated pixel size of 0.855 Å. The nominal defocus range used during data collection was between −1.25 and −2.75 μm.
Image processing with RELION.
Cryo-EM movies in the untreated dataset were corrected for beam-induced motion using RELION’s implementation of the MotionCor2 algorithm37,67. We used 5 × 5 patches, no frame grouping, B factor 150 and dose-weighting. Only dose-weighted averages were saved. CTF parameter estimation was done using CTFFIND-4.168 using the dose-weighted averages with a 30–5.0 Å resolution range and 512 pixel FFT box size. Minimum and maximum defocus values were set up at 1,000, and 50,000 Å and the defocus step size was set at 100 Å. Only micrographs with a resolution estimated to 8 Å or better were selected for further processing. The remaining processing steps were done using RELION 3.1.237. Particle were automatically picked by template matching. To obtain the templates for particle autopicking, we first manually picked 5,091 particles from ~50 micrographs collected at various defocuses. These particles were subjected to one round of reference-free 2D classification requesting 50 classes. This first set of templates was used to do a new round of template-matching autopicking in 200 randomly selected micrographs. The 19,669 particles selected were subjected to a single round of 2D classification requesting 70 classes. A total of 37 classes were selected and then used for template-matching autopicking of the entire set of 5,424 micrographs. In this process, templates were low pass filtered at 20Å, and we used a picking threshold of 0.5 and a minimum inter-particle distance of 150 Å. The 775,859 particles selected were extracted from the dose-weighted summed micrographs, further binned 4 × 4 (3.4 Å/pixel, 96 pixel box size) and subjected to two rounds of 2D classification for the particle curation process. We used a regularization parameter (tau fudge) value of T = 2 for all 2D classifications. The particles from the best-aligned classes generated a particle stack of 552,604 particles. To separate the particles representing the various assembly intermediates of the 30SΔksgA particles, we performed a three-layered 3D classification strategy that resulted in the seven final classes shown in Supplementary Figure 3A. In each layer, each obtained class was classified further into three classes. All 3D classifications used a regularization parameter value of T = 4, ran for 25 iterations and used a circular mask of 326Å. The initial 3D reference used in the first layer of 3D classification was obtained by the random sample consensus (RANSAC) approach as implemented in Scipion69. In subsequent classification layers, the 3D maps obtained in each classification were used as initial 3D references for the next layer of 3D classification after applying a low pass filter of 60Å. Resulting maps from 3D classification steps were visually inspected in Chimera70 and those particles assigned to classes representing the same assembly intermediate were pooled together. Because classes 1, 2 and 3, shown in Supplementary Figure 3A, mainly differed in the conformation of the decoding center, particles in each of those classes were subjected to one additional focused 3D classification step using a spherical soft-mask (2-pixel extension, 6-pixel soft cosine edge) around this region and requesting 5 classes. This additional 3D classification step minimized the number of misclassified particles. The final groups of particles for each class were grouped together and processed for high-resolution refinement.
All maps for the various classes were refined in five steps: In the first step, particles from each class were re-extracted with original pixel size (0.855 Å/pixel, 384 pixel box size) and subjected to a 3D auto-refine process with a 326 Å circular mask and using as an initial model the maps obtained via 3D classification (after proper scaling and filtering using a 60 Å low-pass Fourier filter). The resulting maps were used as the initial model for a second step of refinement. This second step was a 3D auto-refine process and used a tight mask created from the maps obtained in the first refinement step. The binarization threshold used to create this mask was selected using Chimera70, and we also extended the binary mask by 4 pixels and added a 10 pixel soft cosine edge. The outputs of the second 3D auto-refine and subsequent postprocessing processes were used in the third refinement step involving CTF refinement with the ‘Fit” parameters set as follows: ‘Perform CTF parameter fitting’ as yes, ‘Fit defocus’ per-particle, ‘fit astigmatism’ per-micrograph, ‘Fit B-factor’ and ‘phase shift’ as no, ‘estimate beamtilt’ as yes, and estimate trefoil and 4th order aberrations as no. In the fourth step, we used the particles of the CTF refinement process to run Bayesian polishing to correct for per-particle beam-induced motion before subjecting these particles to a final round of 3D refinement (fifth refinement step). Bayesian polishing was performed using sigma values of 0.2, 5,000 and 2 for velocity, divergence and acceleration, respectively. Sharpening of the final cryo-EM maps and resolution estimation was done with RELION using the gold-standard approach71,72 and using phase-randomization to account for the convolution effects of the solvent mask on the FSC between the two independent refined half maps72,73. Cryo-EM map visualization was performed in UCSF Chimera70 and Chimera X74,75.
The smaller KsgA-treated dataset generated the cryo-EM maps of the various classes shown in Supplementary Figure 3B, and the larger dataset generated the high-resolution cryo-EM structure of the KsgA-bound 30SΔksgA complex in Figure 4. Both datasets were processed using the same pipeline as described above for the untreated dataset. The initial number of particles extracted after auto-picking were 588,015 (from 5,832 micrographs) and 1,821,260 particles (from 25,270 micrographs), respectively, in these datasets. After two cycles of reference-free 2D classification for each dataset, we produced two particle stacks containing 369,621 and 665,547 particles that were processed separately for 3D classification (four-layered classification with each obtained class classified further into three classes), focused classification in the decoding center region (only for classes 1, 2 and 3 shown in Supplementary Figure 3B) and the five-step refinement described above for the untreated dataset. To best define the density representing KsgA, and the head domain of the 30S subunit in the class exhibiting KsgA bound in the larger dataset, particles in this group (231,280 particles) were subjected to multibody refinement as described below in the molecular model building section below. The obtained cryo-EM map of the KsgA-bound 30SΔksgA complex and parameters for this reconstruction are shown in Figure 4 and Table 1.
CryoDRGN training.
Neural network analysis of structural heterogeneity was carried out using cryoDRGN v0.2.1 and v0.3.2b20. For both KsgA-treated and untreated datasets, the full particle stacks from RELION AutoPicking were run through ab initio model generation and 3D refinement with cryoSPARC76. These consensus reconstructions were used to supply the poses for an initial round of low-resolution cryoDRGN training, in which particles were downsampled to a box size of 128 (2.5367 Å per pixel). The networks for both datasets were trained with a 10-dimensional latent variable and 1024×3 encoder and decoder architectures.
After 50 epochs of low-resolution training for the KsgA-treated dataset and 46 epochs of training for the untreated dataset, the particle stacks were filtered to exclude 70S ribosomes, edge artifacts, ice contaminants, and particles that led to poor quality 3D reconstructions. For the KsgA-treated dataset, filtration was implemented by selecting particles that satisfied the following criteria after UMAP77 dimensionality reduction: UMAP2 < (−2.5*UMAP1 + 15). Filtering reduced the size of the particle stack from 588,015 to 267,905 particles. Likewise, the untreated dataset, consisting of 775,859 particles, was filtered by selecting particles with UMAP2 < (UMAP1 – 0.8), resulting in a final stack of 394,110 particles. As described above, these filtered particle stacks were returned to Relion for joint refinement and Bayesian polishing.
To improve pose assignments, the particles were extracted after Bayesian polishing and the particle stack was imported into cryoSPARC for ab initio model generation and 3D refinement. Model generation and 3D refinement were done both with all particles combined, and with each of the KsgA-treated and untreated dataset particles individually. Pose assignments extracted from the cryoSPARC refinements were paired with the RELION CTF parameters and particle stacks for an additional round of cryoDRGN training in which particles with poor pose assignments were filtered. This filtration training was done at box size 256 (1.27 Å per pixel), with an eight-dimensional latent variable, and a 1024×3 architecture for both the encoder and decoder networks.
Datasets trained individually were filtered by the magnitude of the latent variable, whereas the co-trained dataset was filtered by eliminating particles within k-means clusters visually determined to represent poor pose assignments. Filtering reduced the size of the KsgA-treated dataset to 250,325 particles (retaining 93.4% of the particles) and reduced the size of the untreated dataset to 364,289 particles (retaining 92.4% of the particles). Filtering of the co-trained dataset eliminated 65,168 particles of 662,015 total (retaining 98.4% of the particles). These final filtered particle stacks were subjected to a final round of high resolution cryoDRGN training, with a box size of 256 and eight-dimensional latent variable, and 1024×3 architecture for both the encoder and decoder networks. The full cryoDRGN filtration and analysis pipeline is presented in Supplementary Figure 4A.
Volume ensemble analysis with MAVEn.
To analyze data with MAVEn, 500 volumes were systematically sampled at k-means cluster centers of the latent embeddings. Existing atomic models of the ribosome – PDB: 4V9D78; PDB: 4ADV79 – were used to create masks corresponding to each of the rRNA helices and ribosomal proteins, as well as KsgA. Each of these 69 masks was applied to each of the 500 volumes in turn, and the intensities of all voxels within each masked region was summed. The summed voxel intensity measurements were normalized by the summed voxel intensities of the corresponding subunit found in a map generated from the atomic model using the molmap tool in Chimera70, producing a fractional occupancy measurement. Fractional occupancies were then scaled from the 10th to the 70th percentile of the dataset, and hierarchically clustered to identify patterns in subunit occupancy. Volume classes and structural blocks were defined by setting a threshold distance in the hierarchical clustering. Centroid volumes for each volume class were generated by calculating the median z-coordinates of all particles in the relevant class and identifying the nearest neighbor particle in the original stack to this median point. Volumes from the original hierarchical clustering with a fractional KsgA occupancy of greater than 0.15 were designated as KsgA-bound and were isolated for another round of hierarchical clustering to produce the KsgA-bound heatmap. The code used to carry out these analyses is available at https://github.com/lkinman/MAVEn.
To individually query particles for occupancy of the head and H44, a volume was generated on-the-fly at each on-data position in the latent space of each of the two datasets, at a downsampled box size of 64 (5.07 Å per pixel). Masks corresponding to the entire head (helices 28–43, uS3, uS7, uS9, uS10, uS13, uS14, uS19) or to H44 were generated from existing models of the ribosome (PDB: 4ADV and 4V9D). On-the-fly generated volumes were binarized, and then the binarized voxel values within each of the two masked regions was summed. Occupancies were then normalized to scale from the minimum to the maximum of each mask-dataset pair. A user-defined threshold of 0.25 was applied to distinguish between particles bearing head density (head+) and those lacking head density (head−). A threshold of 0.35 was used to distinguish between particles with strong H44 density (H44+) and those without strong H44 density (H44−).
500 new volumes were then generated from k-means centroid locations of latent space defined by the H44+ subset of each of the datasets. PCA-based analysis of these volumes was done by amplitude-scaling all the volumes relative to a representative volume from the lower-resolution KsgA dataset with Diffmap (http://grigoriefflab.janelia.org/diffmap), aligning the untreated volumes to the KsgA-treated volumes with EMAN280, applying a mask to the H44 region, and finally performing PCA on the resulting voxel array. A similar approach was taken for voxel analysis of the head domain, using the head+ subset of particles defined by individual on-the-fly querying within each dataset, and sampling 500 new volumes from these head+ subsets of latent space. Volumes were again amplitude-scaled to a common map from the KsgA-treated dataset and aligned. A mask was applied to the H32/H33 region, and PCA performed on the resulting voxel array.
To calculate the summed squared residual (SSR) between each sampled volume and a mature 30S volume, we first down-sampled each of the 500 sampled maps from each dataset to a boxsize of 64. The volumes were then binarized, and the only voxels used for the SSR calculations were those occupied in at least 1% of the relevant volume ensemble. The SSR was calculated over this subset of voxels between each sampled volume and the relevant mature centroid volume (class 3 in each dataset).
Nomura assembly map analysis.
Determination of occupancy dependency relationships between subunits was done by defining a threshold for each subunit that divides low-occupancy volumes from high-occupancy volumes. The thresholds were set based on expert-guided manual inspection of the volumes above and below the threshold. For any given subunit and associated occupancy threshold , we define to be the set of volumes with occupancy of greater than . We calculate the fractional dependency of on any other subunit as:
A directed edge from to is built if and . The resulting directed acyclic graph is then pruned by eliminating each edge if there exists another path from to . Finally, all nodes with identical in- and out- edges were grouped and treated as a single node in the resulting graph, as these nodes cannot be distinguished by our graphical analysis.
Cryo-EM map analysis and molecular model building.
To build the molecular model of the KsgA + 30SΔksgA complex, we used the particles assigned to this class in the large KsgA-treated dataset and first performed multi-body refinement by dividing the consensus cryo-EM map into three major bodies (body 1: 30S body, body 2: 30S platform + KsgA and body 3: 30S head). Then, a soft mask was generated for each body and applied to the corresponding map during refinement. We used the automatic sharpening tool ‘phenix.auto sharpen’ from Phenix (version Phenix-dev-4340)81 to further improve the connectivity of the three cryo-EM maps derived from the multi-body refinement process. The molecular model was built from the available structures of the mature 30S ribosomal subunit (PDB: 4YBB)82 and E. coli KsgA (PDB: 1QYR)36. The atomic model of the 30S subunit was truncated into three domains that matched the three bodies in the multi-body refinement process. These initial models were fit into the cryo-EM maps by rigid-body docking in Chimera (version Chimera 1.16.0)70. The model for each body was built independently by successive rounds of real space refinement in Phenix81 and manual model building in Coot (version 0.8.9.2)83,84. The three resulting molecular models were docked into the consensus KsgA-treated 30SΔksgA complex cryo-EM map using the ‘dock_in_map’ tool in Phenix81. Amino acids in the protein components and nucleotides in the 16S rRNA at the interfaces between the 3 bodies were manually built based on the density in the consensus map using Coot. Finally, the molecular coordinates from the three bodies were combined into the entire model for the KsgA-treated 30SΔksgA complex using Coot83,84. The cryo-EM maps for the three bodies of the KsgA-treated 30SΔksgA complex obtained from multi-body refinement were rigid body fit to the consensus map and combined into a single high-resolution composite map using ‘vop add’ command in Chimera.
We also performed multi-body refinement of the cryo-EM map before building a model for the untreated 30SΔksgA particle with the helix 44 in the inactive conformation. In this case, the consensus map was divided into two bodies (body 1: body and platform and body 2: head). The molecular model for this structure was built using the same approach as that obtained for the KsgA-treated 30SΔksgA complex. However, in this case the molecular model was built using PDB model 7BOF34 as starting point.
The quality of the obtained molecular models and the resolvability of the amino acids and nucleotides in the r-proteins and 16S rRNA forming the model was estimated by calculating their Q-scores85.
Supplementary Material
ACKNOWLEDGEMENTS
We thank K. Sears, M. Strauss, K. Basu and other staff members of the Facility for Electron Microscopy Research (FEMR) at McGill University for help with microscope operation and data collection; MIT-Satori administrative team for providing computational resources and support; and B. Powell and E. Zhong, and other members of the Davis and Ortega labs for constructive feedback on this work. This work was funded by the Hugh Hampton Young Fellowship to L.F.K; National Science Foundation CAREER grant 2046778 and National Institutes of Health grant R01-GM144542 to J.H.D; Canadian Institutes of Health Research grant CIHR PJT-180305 to J.O. FEMR is supported by the Canadian Foundation for Innovation, Quebec Government and McGill University. Research in the Davis lab is supported by the Alfred P. Sloan Foundation, the James H. Ferry Fund, the MIT J-Clinic, and the Whitehead Family.
Footnotes
COMPETING INTERESTS
The authors declare no competing interests.
CODE AVAILABILITY
The MAVEn software, including scripts for on-the-fly reconstruction and analysis and voxel PCA, is available at: https://github.com/lkinman/MAVEn.
DATA AVAILABILITY
The density map and the model for the KsgA-bound 30SΔksgA and untreated 30SΔksgA structures were deposited in the Electron Microscopy Data Bank, using codes EMD-28720 and EMD-28692, respectively and in the Protein Data Bank using codes PDB-8EYT, and PDB-8EYQ, respectively. EMDB and PDB codes are also indicated in Table 1. Unfiltered particle stacks were deposited at EMPIAR with the following IDs: untreated dataset (EMPIAR-11529), small KsgA-treated dataset used for cryoDRGN and MAVEn (EMPIAR-11526), and large KsgA-treated dataset used for high-resolution reconstruction of the KsgA-bound structure (EMPIAR-11528). Trained cryoDRGN models were deposited at Zenodo at 10.5281/zenodo.7884215.
REFERENCES
- 1.Shajani Z, Sykes MT & Williamson JR Assembly of bacterial ribosomes. Annu Rev Biochem 80, 501–526 (2011). 10.1146/annurev-biochem-062608-160432 [DOI] [PubMed] [Google Scholar]
- 2.Duss O, Stepanyuk GA, Puglisi JD & Williamson JR Transient Protein-RNA Interactions Guide Nascent Ribosomal RNA Folding. Cell 179, 1357–1369 e1316 (2019). 10.1016/j.cell.2019.10.035 [DOI] [PMC free article] [PubMed] [Google Scholar]
- 3.Rodgers ML & Woodson SA Transcription Increases the Cooperativity of Ribonucleoprotein Assembly. Cell 179, 1370–1381 e1312 (2019). 10.1016/j.cell.2019.11.007 [DOI] [PMC free article] [PubMed] [Google Scholar]
- 4.Machnicka MA et al. MODOMICS: a database of RNA modification pathways−-2013 update. Nucleic Acids Res 41, D262–267 (2013). 10.1093/nar/gks1007 [DOI] [PMC free article] [PubMed] [Google Scholar]
- 5.Popova AM & Williamson JR Quantitative analysis of rRNA modifications using stable isotope labeling and mass spectrometry. J Am Chem Soc 136, 2058–2069 (2014). 10.1021/ja412084b [DOI] [PMC free article] [PubMed] [Google Scholar]
- 6.Pletnev P et al. Comprehensive Functional Analysis of Escherichia coli Ribosomal RNA Methyltransferases. Front Genet 11, 97 (2020). 10.3389/fgene.2020.00097 [DOI] [PMC free article] [PubMed] [Google Scholar]
- 7.Mangat CS & Brown ED Ribosome biogenesis; the KsgA protein throws a methyl-mediated switch in ribosome assembly. Mol Microbiol 70, 1051–1053 (2008). 10.1111/j.1365-2958.2008.06484.x [DOI] [PubMed] [Google Scholar]
- 8.Van Knippenberg PH, Van Kimmenade JM & Heus HA Phylogeny of the conserved 3’ terminal structure of the RNA of small ribosomal subunits. Nucleic Acids Res 12, 2595–2604 (1984). 10.1093/nar/12.6.2595 [DOI] [PMC free article] [PubMed] [Google Scholar]
- 9.Poldermans B, Roza L & Van Knippenberg PH Studies on the function of two adjacent N6,N6-dimethyladenosines near the 3’ end of 16 S ribosomal RNA of Escherichia coli. III. Purification and properties of the methylating enzyme and methylase-30 S interactions. J Biol Chem 254, 9094–9100 (1979). [PubMed] [Google Scholar]
- 10.Poldermans B, Van Buul CP & Van Knippenberg PH Studies on the function of two adjacent N6,N6-dimethyladenosines near the 3’ end of 16 S ribosomal RNA of Escherichia coli. II. The effect of the absence of the methyl groups on initiation of protein biosynthesis. J Biol Chem 254, 9090–9093 (1979). [PubMed] [Google Scholar]
- 11.Poldermans B, Goosen N & Van Knippenberg PH Studies on the function of two adjacent N6,N6-dimethyladenosines near the 3’ end of 16 S ribosomal RNA of Escherichia coli. I. The effect of kasugamycin on initiation of protein synthesis. J Biol Chem 254, 9085–9089 (1979). [PubMed] [Google Scholar]
- 12.Lafontaine DL, Preiss T & Tollervey D Yeast 18S rRNA dimethylase Dim1p: a quality control mechanism in ribosome synthesis? Mol Cell Biol 18, 2360–2370 (1998). 10.1128/mcb.18.4.2360 [DOI] [PMC free article] [PubMed] [Google Scholar]
- 13.Kyuma T, Kizaki H, Ryuno H, Sekimizu K & Kaito C 16S rRNA methyltransferase KsgA contributes to oxidative stress resistance and virulence in Staphylococcus aureus. Biochimie 119, 166–174 (2015). 10.1016/j.biochi.2015.10.027 [DOI] [PubMed] [Google Scholar]
- 14.Chiok KL, Addwebi T, Guard J & Shah DH Dimethyl adenosine transferase (KsgA) deficiency in Salmonella enterica Serovar Enteritidis confers susceptibility to high osmolarity and virulence attenuation in chickens. Appl Environ Microbiol 79, 7857–7866 (2013). 10.1128/AEM.03040-13 [DOI] [PMC free article] [PubMed] [Google Scholar]
- 15.Cunningham PR et al. Site-specific mutation of the conserved m6(2)A m6(2)A residues of E. coli 16S ribosomal RNA. Effects on ribosome function and activity of the ksgA methyltransferase. Biochim Biophys Acta 1050, 18–26 (1990). 10.1016/0167-4781(90)90135-o [DOI] [PubMed] [Google Scholar]
- 16.Connolly K, Rife JP & Culver G Mechanistic insight into the ribosome biogenesis functions of the ancient protein KsgA. Mol Microbiol 70, 1062–1075 (2008). 10.1111/j.1365-2958.2008.06485.x [DOI] [PMC free article] [PubMed] [Google Scholar]
- 17.Himeno H et al. A novel GTPase activated by the small subunit of ribosome. Nucleic Acids Res 32, 5303–5309 (2004). https://doi.org:32/17/5303 [pii] 10.1093/nar/gkh861 [DOI] [PMC free article] [PubMed] [Google Scholar]
- 18.Leong V, Kent M, Jomaa A & Ortega J Escherichia coli rimM and yjeQ null strains accumulate immature 30S subunits of similar structure and protein complement. RNA 19, 789–802 (2013). 10.1261/rna.037523.112rna.037523.112 [pii] [DOI] [PMC free article] [PubMed] [Google Scholar]
- 19.Thurlow B et al. Binding properties of YjeQ (RsgA), RbfA, RimM and Era to assembly intermediates of the 30S subunit. Nucleic Acids Res 44, 9918–9932 (2016). 10.1093/nar/gkw613 [DOI] [PMC free article] [PubMed] [Google Scholar]
- 20.Zhong ED, Bepler T, Berger B & Davis JH CryoDRGN: reconstruction of heterogeneous cryo-EM structures using neural networks. Nat Methods 18, 176–185 (2021). 10.1038/s41592-020-01049-4 [DOI] [PMC free article] [PubMed] [Google Scholar]
- 21.Held WA, Ballou B, Mizushima S & Nomura M Assembly mapping of 30 S ribosomal proteins from Escherichia coli. Further studies. J Biol Chem 249, 3103–3111 (1974). [PubMed] [Google Scholar]
- 22.Mizushima S & Nomura M Assembly mapping of 30S ribosomal proteins from E. coli. Nature 226, 1214 (1970). [DOI] [PubMed] [Google Scholar]
- 23.Stern S, Powers T, Changchien LM & Noller HF RNA-protein interactions in 30S ribosomal subunits: folding and function of 16S rRNA. Science 244, 783–790 (1989). [DOI] [PubMed] [Google Scholar]
- 24.Baba T et al. Construction of Escherichia coli K-12 in-frame, single-gene knockout mutants: the Keio collection. Mol Syst Biol 2, 2006 0008 (2006). https://doi.org:msb4100050 [pii] 10.1038/msb4100050 [DOI] [PMC free article] [PubMed] [Google Scholar]
- 25.Qin D, Liu Q, Devaraj A & Fredrick K Role of helix 44 of 16S rRNA in the fidelity of translation initiation. RNA 18, 485–495 (2012). 10.1261/rna.031203.111 [DOI] [PMC free article] [PubMed] [Google Scholar]
- 26.Schuwirth BS et al. Structures of the bacterial ribosome at 3.5 A resolution. Science 310, 827–834 (2005). [DOI] [PubMed] [Google Scholar]
- 27.Scheres SH Processing of Structurally Heterogeneous Cryo-EM Data in RELION. Methods Enzymol 579, 125–157 (2016). 10.1016/bs.mie.2016.04.012 [DOI] [PubMed] [Google Scholar]
- 28.Kinman LF, Powell BM, Zhong ED, Berger B & Davis JH Uncovering structural ensembles from single-particle cryo-EM data using cryoDRGN. Nat Protoc 18, 319–339 (2023). 10.1038/s41596-022-00763-x [DOI] [PMC free article] [PubMed] [Google Scholar]
- 29.Davis JH & Williamson JR Structure and dynamics of bacterial ribosome biogenesis. Philosophical transactions of the Royal Society of London. Series B, Biological sciences 372 (2017). 10.1098/rstb.2016.0181 [DOI] [PMC free article] [PubMed] [Google Scholar]
- 30.Davis JH et al. Modular Assembly of the Bacterial Large Ribosomal Subunit. Cell 167, 1610–1622 e1615 (2016). 10.1016/j.cell.2016.11.020 [DOI] [PMC free article] [PubMed] [Google Scholar]
- 31.Mulder AM et al. Visualizing ribosome biogenesis: parallel assembly pathways for the 30S subunit. Science 330, 673–677 (2010). 10.1126/science.1193220330/6004/673 [pii] [DOI] [PMC free article] [PubMed] [Google Scholar]
- 32.Sashital DG et al. A combined quantitative mass spectrometry and electron microscopy analysis of ribosomal 30S subunit assembly in E. coli. eLife 3 (2014). 10.7554/eLife.04491 [DOI] [PMC free article] [PubMed] [Google Scholar]
- 33.Nomura M Biosynthesis of bacterial ribosomes. Symp Soc Dev Biol 30, 195–199 (1974). [DOI] [PubMed] [Google Scholar]
- 34.Schedlbauer A et al. A conserved rRNA switch is central to decoding site maturation on the small ribosomal subunit. Sci Adv 7 (2021). 10.1126/sciadv.abf7547 [DOI] [PMC free article] [PubMed] [Google Scholar]
- 35.Stephan NC, Ries AB, Boehringer D & Ban N Structural basis of successive adenosine modifications by the conserved ribosomal methyltransferase KsgA. Nucleic Acids Res 49, 6389–6398 (2021). 10.1093/nar/gkab430 [DOI] [PMC free article] [PubMed] [Google Scholar]
- 36.O’Farrell HC, Scarsdale JN & Rife JP Crystal structure of KsgA, a universally conserved rRNA adenine dimethyltransferase in Escherichia coli. J Mol Biol 339, 337–353 (2004). 10.1016/j.jmb.2004.02.068 [DOI] [PubMed] [Google Scholar]
- 37.Zivanov J et al. New tools for automated high-resolution cryo-EM structure determination in RELION-3. eLife 7 (2018). 10.7554/eLife.42166 [DOI] [PMC free article] [PubMed] [Google Scholar]
- 38.Nakane T, Kimanius D, Lindahl E & Scheres SH Characterisation of molecular motions in cryo-EM single-particle data by multi-body refinement in RELION. eLife 7 (2018). 10.7554/eLife.36861 [DOI] [PMC free article] [PubMed] [Google Scholar]
- 39.O’Farrell HC, Musayev FN, Scarsdale JN & Rife JP Control of substrate specificity by a single active site residue of the KsgA methyltransferase. Biochemistry 51, 466–474 (2012). 10.1021/bi201539j [DOI] [PubMed] [Google Scholar]
- 40.Jomaa A et al. Functional domains of the 50S subunit mature late in the assembly process. Nucleic Acids Res 42, 3419–3435 (2014). 10.1093/nar/gkt1295 [DOI] [PMC free article] [PubMed] [Google Scholar]
- 41.Razi A et al. Role of Era in assembly and homeostasis of the ribosomal small subunit. Nucleic Acids Res 47, 8301–8317 (2019). 10.1093/nar/gkz571 [DOI] [PMC free article] [PubMed] [Google Scholar]
- 42.Ni X et al. YphC and YsxC GTPases assist the maturation of the central protuberance, GTPase associated region and functional core of the 50S ribosomal subunit. Nucleic Acids Res 44, 8442–8455 (2016). 10.1093/nar/gkw678 [DOI] [PMC free article] [PubMed] [Google Scholar]
- 43.Melero R et al. Continuous flexibility analysis of SARS-CoV-2 spike prefusion structures. IUCrJ 7, 1059–1069 (2020). 10.1107/S2052252520012725 [DOI] [PMC free article] [PubMed] [Google Scholar]
- 44.Tagare HD, Kucukelbir A, Sigworth FJ, Wang H & Rao M Directly reconstructing principal components of heterogeneous particles from cryo-EM images. J Struct Biol 191, 245–262 (2015). 10.1016/j.jsb.2015.05.007 [DOI] [PMC free article] [PubMed] [Google Scholar]
- 45.Haselbach D et al. Structure and Conformational Dynamics of the Human Spliceosomal B(act) Complex. Cell 172, 454–464 e411 (2018). 10.1016/j.cell.2018.01.010 [DOI] [PubMed] [Google Scholar]
- 46.Punjani A & Fleet DJ 3D variability analysis: Resolving continuous flexibility and discrete heterogeneity from single particle cryo-EM. J Struct Biol 213, 107702 (2021). 10.1016/j.jsb.2021.107702 [DOI] [PubMed] [Google Scholar]
- 47.Hopfield JJ Kinetic proofreading: a new mechanism for reducing errors in biosynthetic processes requiring high specificity. Proc Natl Acad Sci U S A 71, 4135–4139 (1974). 10.1073/pnas.71.10.4135 [DOI] [PMC free article] [PubMed] [Google Scholar]
- 48.Jomaa A et al. Understanding ribosome assembly: the structure of in vivo assembled immature 30S subunits revealed by cryo-electron microscopy. RNA 17, 697–709 (2011). https://doi.org:rna.2509811 [pii] 10.1261/rna.2509811 [DOI] [PMC free article] [PubMed] [Google Scholar]
- 49.Jahagirdar D et al. Alternative conformations and motions adopted by 30S ribosomal subunits visualized by cryo-electron microscopy. RNA 26, 2017–2030 (2020). 10.1261/rna.075846.120 [DOI] [PMC free article] [PubMed] [Google Scholar]
- 50.Zamir A, Miskin R & Elson D Interconversions between inactive and active forms of ribosomal subunits. FEBS Lett 3, 85–88 (1969). 10.1016/0014-5793(69)80103-1 [DOI] [PubMed] [Google Scholar]
- 51.Sparling PF Kasugamycin resistance: 30S ribosomal mutation with an unusual location on the Escherichia coli chromosome. Science 167, 56–58 (1970). [DOI] [PubMed] [Google Scholar]
- 52.Cunningham PR, Richard RB, Weitzmann CJ, Nurse K & Ofengand J The absence of modified nucleotides affects both in vitro assembly and in vitro function of the 30S ribosomal subunit of Escherichia coli. Biochimie 73, 789–796 (1991). 10.1016/0300-9084(91)90058-9 [DOI] [PubMed] [Google Scholar]
- 53.Igarashi K et al. Relationship between methylation of adenine near the 3’ end of 16-S ribosomal RNA and the activity of 30-S ribosomal subunits. Eur J Biochem 113, 587–593 (1981). 10.1111/j.1432-1033.1981.tb05103.x [DOI] [PubMed] [Google Scholar]
- 54.Inoue K, Basu S & Inouye M Dissection of 16S rRNA methyltransferase (KsgA) function in Escherichia coli. J Bacteriol 189, 8510–8518 (2007). 10.1128/JB.01259-07 [DOI] [PMC free article] [PubMed] [Google Scholar]
- 55.Seffouh A et al. RbgA ensures the correct timing in the maturation of the 50S subunits functional sites. Nucleic Acids Res (2022). 10.1093/nar/gkac059 [DOI] [PMC free article] [PubMed] [Google Scholar]
- 56.Dutca LM & Culver GM Assembly of the 5’ and 3’ minor domains of 16S ribosomal RNA as monitored by tethered probing from ribosomal protein S20. J Mol Biol 376, 92–108 (2008). 10.1016/j.jmb.2007.10.083 [DOI] [PMC free article] [PubMed] [Google Scholar]
- 57.Jagannathan I & Culver GM Assembly of the central domain of the 30S ribosomal subunit: roles for the primary binding ribosomal proteins S15 and S8. J Mol Biol 330, 373–383 (2003). 10.1016/s0022-2836(03)00586-2 [DOI] [PubMed] [Google Scholar]
- 58.Woodson SA RNA folding pathways and the self-assembly of ribosomes. Accounts of chemical research 44, 1312–1319 (2011). 10.1021/ar2000474 [DOI] [PMC free article] [PubMed] [Google Scholar]
- 59.Rodgers ML & Woodson SA A roadmap for rRNA folding and assembly during transcription. Trends Biochem Sci 46, 889–901 (2021). 10.1016/j.tibs.2021.05.009 [DOI] [PMC free article] [PubMed] [Google Scholar]
- 60.Rabuck-Gibbons JN, Lyumkis D & Williamson JR Quantitative mining of compositional heterogeneity in cryo-EM datasets of ribosome assembly intermediates. Structure 30, 498–509 e494 (2022). 10.1016/j.str.2021.12.005 [DOI] [PMC free article] [PubMed] [Google Scholar]
- 61.Chen M & Ludtke SJ Deep learning-based mixed-dimensional Gaussian mixture model for characterizing variability in cryo-EM. Nat Methods 18, 930–936 (2021). 10.1038/s41592-021-01220-5 [DOI] [PMC free article] [PubMed] [Google Scholar]
- 62.Sykes MT & Williamson JR A complex assembly landscape for the 30S ribosomal subunit. Annu Rev Biophys 38, 197–215 (2009). 10.1146/annurev.biophys.050708.133615 [DOI] [PMC free article] [PubMed] [Google Scholar]
REFERENCES (METHODS)
- 63.Eng JK, Jahan TA & Hoopmann MR Comet: an open-source MS/MS sequence database search tool. Proteomics 13, 22–24 (2013). 10.1002/pmic.201200439 [DOI] [PubMed] [Google Scholar]
- 64.Shteynberg D et al. iProphet: multi-level integrative analysis of shotgun proteomic data improves peptide and protein identification rates and error estimates. Mol Cell Proteomics 10, M111 007690 (2011). 10.1074/mcp.M111.007690 [DOI] [PMC free article] [PubMed] [Google Scholar]
- 65.MacLean B et al. Skyline: an open source document editor for creating and analyzing targeted proteomics experiments. Bioinformatics 26, 966–968 (2010). 10.1093/bioinformatics/btq054 [DOI] [PMC free article] [PubMed] [Google Scholar]
- 66.Schorb M, Haberbosch I, Hagen WJH, Schwab Y & Mastronarde DN Software tools for automated transmission electron microscopy. Nat Methods 16, 471–477 (2019). 10.1038/s41592-019-0396-9 [DOI] [PMC free article] [PubMed] [Google Scholar]
- 67.Zheng SQ et al. MotionCor2: anisotropic correction of beam-induced motion for improved cryo-electron microscopy. Nat Methods 14, 331–332 (2017). 10.1038/nmeth.4193 [DOI] [PMC free article] [PubMed] [Google Scholar]
- 68.Rohou A & Grigorieff N CTFFIND4: Fast and accurate defocus estimation from electron micrographs. J Struct Biol 192, 216–221 (2015). 10.1016/j.jsb.2015.08.008 [DOI] [PMC free article] [PubMed] [Google Scholar]
- 69.Gomez-Blanco J, Kaur S, Ortega J & Vargas J A robust approach to ab initio cryo-electron microscopy initial volume determination. J Struct Biol 208, 107397 (2019). 10.1016/j.jsb.2019.09.014 [DOI] [PubMed] [Google Scholar]
- 70.Pettersen EF et al. UCSF Chimera--a visualization system for exploratory research and analysis. J Comput Chem 25, 1605–1612 (2004). [DOI] [PubMed] [Google Scholar]
- 71.Henderson R et al. Outcome of the first electron microscopy validation task force meeting. Structure 20, 205–214 (2012). 10.1016/j.str.2011.12.014 [DOI] [PMC free article] [PubMed] [Google Scholar]
- 72.Scheres SH & Chen S Prevention of overfitting in cryo-EM structure determination. Nat Methods 9, 853–854 (2012). 10.1038/nmeth.2115 [DOI] [PMC free article] [PubMed] [Google Scholar]
- 73.Chen S et al. High-resolution noise substitution to measure overfitting and validate resolution in 3D structure determination by single particle electron cryomicroscopy. Ultramicroscopy 135, 24–35 (2013). 10.1016/j.ultramic.2013.06.004 [DOI] [PMC free article] [PubMed] [Google Scholar]
- 74.Goddard TD et al. UCSF ChimeraX: Meeting modern challenges in visualization and analysis. Protein Sci 27, 14–25 (2018). 10.1002/pro.3235 [DOI] [PMC free article] [PubMed] [Google Scholar]
- 75.Pettersen EF et al. UCSF ChimeraX: Structure visualization for researchers, educators, and developers. Protein Sci 30, 70–82 (2021). 10.1002/pro.3943 [DOI] [PMC free article] [PubMed] [Google Scholar]
- 76.Punjani A, Rubinstein JL, Fleet DJ & Brubaker MA cryoSPARC: algorithms for rapid unsupervised cryo-EM structure determination. Nat Methods 14, 290–296 (2017). 10.1038/nmeth.4169 [DOI] [PubMed] [Google Scholar]
- 77.Becht E et al. Dimensionality reduction for visualizing single-cell data using UMAP. Nat Biotechnol (2018). 10.1038/nbt.4314 [DOI] [PubMed] [Google Scholar]
- 78.Dunkle JA et al. Structures of the bacterial ribosome in classical and hybrid states of tRNA binding. Science 332, 981–984 (2011). 10.1126/science.1202692 [DOI] [PMC free article] [PubMed] [Google Scholar]
- 79.Boehringer D, O’Farrell HC, Rife JP & Ban N Structural insights into methyltransferase KsgA function in 30S ribosomal subunit biogenesis. J Biol Chem 287, 10453–10459 (2012). 10.1074/jbc.M111.318121 [DOI] [PMC free article] [PubMed] [Google Scholar]
- 80.Tang G et al. EMAN2: an extensible image processing suite for electron microscopy. J Struct Biol 157, 38–46 (2007). 10.1016/j.jsb.2006.05.009 [DOI] [PubMed] [Google Scholar]
- 81.Adams PD et al. PHENIX: a comprehensive Python-based system for macromolecular structure solution. Acta Crystallogr D Biol Crystallogr 66, 213–221 (2010). 10.1107/S0907444909052925 [DOI] [PMC free article] [PubMed] [Google Scholar]
- 82.Noeske J et al. High-resolution structure of the Escherichia coli ribosome. Nat Struct Mol Biol 22, 336–341 (2015). 10.1038/nsmb.2994 [DOI] [PMC free article] [PubMed] [Google Scholar]
- 83.Emsley P & Cowtan K Coot: model-building tools for molecular graphics. Acta Crystallogr D Biol Crystallogr 60, 2126–2132 (2004). [DOI] [PubMed] [Google Scholar]
- 84.Emsley P, Lohkamp B, Scott WG & Cowtan K Features and development of Coot. Acta Crystallogr D Biol Crystallogr 66, 486–501 (2010). 10.1107/S0907444910007493 [DOI] [PMC free article] [PubMed] [Google Scholar]
- 85.Pintilie G et al. Measurement of atom resolvability in cryo-EM maps with Q-scores. Nat Methods 17, 328–334 (2020). 10.1038/s41592-020-0731-1 [DOI] [PMC free article] [PubMed] [Google Scholar]
Associated Data
This section collects any data citations, data availability statements, or supplementary materials included in this article.
Supplementary Materials
Data Availability Statement
The density map and the model for the KsgA-bound 30SΔksgA and untreated 30SΔksgA structures were deposited in the Electron Microscopy Data Bank, using codes EMD-28720 and EMD-28692, respectively and in the Protein Data Bank using codes PDB-8EYT, and PDB-8EYQ, respectively. EMDB and PDB codes are also indicated in Table 1. Unfiltered particle stacks were deposited at EMPIAR with the following IDs: untreated dataset (EMPIAR-11529), small KsgA-treated dataset used for cryoDRGN and MAVEn (EMPIAR-11526), and large KsgA-treated dataset used for high-resolution reconstruction of the KsgA-bound structure (EMPIAR-11528). Trained cryoDRGN models were deposited at Zenodo at 10.5281/zenodo.7884215.