Abstract
Ceramide synthases (CerS) catalyze ceramide formation via N‐acylation of a sphingoid base with a fatty acyl‐CoA and are attractive drug targets for treating numerous metabolic diseases and cancers. Here, we present the cryo‐EM structure of a yeast CerS complex, consisting of a catalytic Lac1 subunit and a regulatory Lip1 subunit, in complex with C26‐CoA substrate. The CerS holoenzyme exists as a dimer of Lac1‐Lip1 heterodimers. Lac1 contains a hydrophilic reaction chamber and a hydrophobic tunnel for binding the CoA moiety and C26‐acyl chain of C26‐CoA, respectively. Lip1 interacts with both the transmembrane region and the last luminal loop of Lac1 to maintain the proper acyl chain binding tunnel. A lateral opening on Lac1 serves as a potential entrance for the sphingoid base substrate. Our findings provide a template for understanding the working mechanism of eukaryotic ceramide synthases and may facilitate the development of therapeutic CerS modulators.
Keywords: ceramide, ceramide synthase, cryo‐EM, Lac1, Lip1
Subject Categories: Membranes & Trafficking, Metabolism, Structural Biology
A structure of the yeast Lac1‐Lip1 sphingosine N‐acyltransferase complex reveals how a dimer of heterodimers binds its substrate.

Introduction
Ceramide is not only a building block of complex sphingolipids but also a critical signaling molecule in all eukaryotic organisms that regulates numerous cellular processes, such as apoptosis, senescence, proliferation, and differentiation (Hannun & Obeid, 2008, 2018; Gault et al, 2010; Harrison et al, 2018; Summers et al, 2019). However, the aberrant accumulation of ceramide is a hallmark of numerous human metabolic diseases, such as obesity, diabetes, and cardiovascular disease (Hla & Dannenberg, 2012; Chaurasia & Summers, 2015, 2021; Havulinna et al, 2016; Laaksonen et al, 2016; Lemaitre et al, 2018; Mantovani et al, 2018, 2020; Summers, 2018; Karjalainen et al, 2019; Hilvo et al, 2020; Poss et al, 2020a, 2020b; Choi et al, 2021). Ceramide is mainly synthesized in the ER from the reaction of a sphingoid base with a fatty acyl‐CoA via sphinganine N‐acyltransferases, also known as ceramide synthases (CerSs) (Pewzner‐Jung et al, 2006; Levy & Futerman, 2010; Mullen et al, 2012) (Fig 1A). CerS enzymes are promising therapeutic targets for various metabolic diseases such as obesity, insulin resistance, cardiovascular diseases, and non‐alcoholic steatohepatitis (NASH), as well as cancers (Park et al, 2014; Brachtendorf et al, 2019; Raichur, 2020).
Figure 1. Biochemical and structural characterization of the yeast Lac1‐Lip1 complex.
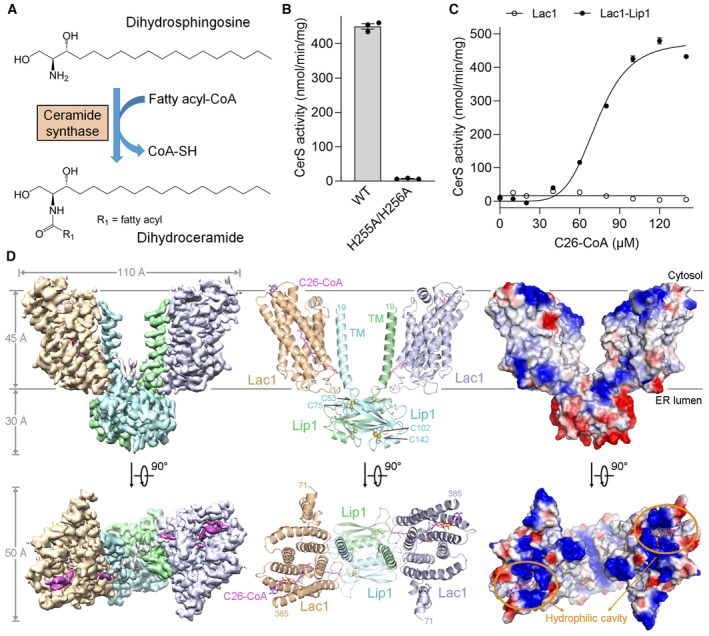
- Ceramide synthase (CerS) catalyzes ceramide formation via N‐acylation of a sphingoid base with a fatty acyl‐CoA. Dihydrosphingosine (DHS), a representative sphingoid base, was used to generate dihydroceramide in the activity assays in this study.
- Enzymatic activity of the wild‐type (WT) Lac1‐Lip1 complex and the catalytic mutant Lac1H255A/H256A‐Lip1 complex. Each data point is the average ± SEM of three independent experiments.
- CerS activity versus C26‐CoA concentration for the Lac1 alone protein and the Lac1‐Lip1 complex. The activity curve of the Lac1‐Lip1 complex follows an allosteric sigmoidal equation with a Khalf of 72.99 ± 1.44 μM for C26‐CoA and a V max of 475.7 ± 13.1 nmol/min/mg. Each data point is the average ± SEM of three independent experiments.
- Perpendicular views of the cryo‐EM map, overall structure, and electrostatic potential surface of the C26‐CoA‐bound Lac1‐Lip1 complex. Lac1 and Lip1 form a heterotetramer with a 2:2 stoichiometry. C26‐CoA lies inside the Lac1 subunit and traverses the lipid bilayer. The two Lac1 subunits are shown in wheat and light blue, respectively; the two Lip1 subunits are shown in light cyan and light green, respectively; C26‐CoA is shown in magenta. The two intramolecular disulfide bonds within Lip1 are shown in spheres. TM, transmembrane helix.
Source data are available online for this figure.
CerS enzymes were first identified over 20 years ago in the budding yeast Saccharomyces cerevisiae, where two distinct members, Lag1 and Lac1, are required for acyl‐CoA‐dependent ceramide synthesis reaction (Guillas et al, 2001; Schorling et al, 2001). Both Lag1 and Lac1 catalyze the N‐acylation of a sphingoid base [dihydrosphingosine (DHS) or phytosphingosine (PHS)] with the preferred C26‐CoA to generate C26‐dihydroceramide or C26‐phytoceramide (Guillas et al, 2001; Schorling et al, 2001). A later study revealed that a regulatory Lip1 subunit forms a complex with the catalytic subunit Lag1 or Lac1 and is required for CerS activity both in vivo and in vitro (Vallée & Riezman, 2005). Nevertheless, the exact role of Lip1 in the ceramide synthesis reaction is unknown, and no obvious homologs of Lip1 were found in mammals (Vallée & Riezman, 2005).
Mammals contain six distinct CerS isoforms (CerS1‐6), each of which strongly favors a particular subset of acyl‐CoA substrates with different acyl chain lengths varying between C14 and C26 (Venkataraman et al, 2002; Guillas et al, 2003; Riebeling et al, 2003; Mizutani et al, 2005, 2006; Laviad et al, 2008). It has been clear that ceramide species with different acyl chain lengths execute distinct biological functions (Hannun & Obeid, 2011; Turpin‐Nolan & Brüning, 2020). An 11‐amino acid sequence, located between the last two transmembrane helices (TMs), has been shown to determine the acyl chain specificity of mammalian CerS (Tidhar et al, 2012, 2018). However, the mechanistic details of how this region controls the acyl chain specificity await further investigation.
Members of the CerS family share a common multiple transmembrane TRAM‐Lag‐CLN8 (TLC) domain of ~200 residues, which is also found in other protein families (Winter & Ponting, 2002). A conserved stretch of 52 residues, called the Lag1p motif, is found within the TLC domain of the CerS family, but not in the other two TLC domain families (Jiang et al, 1998; Winter & Ponting, 2002). Four highly conserved charged residues in the Lag1p motif, two histidine and two aspartate residues, have been predicted to be located in the active site of the CerS enzyme family (Kageyama‐Yahara & Riezman, 2006; Spassieva et al, 2006) (Fig EV1). The lack of structural information regarding CerS has largely limited the mechanistic understanding of CerS functions. In this study, we report the first atomic structure of a eukaryotic CerS, the yeast Lac1‐Lip1 complex, bound with an acyl‐CoA substrate at an overall resolution of 3.09 Å, as determined by single‐particle cryo‐EM. We also established an in vitro biochemical assay to measure the CerS activity. Combined with structure‐guided mutational analysis, our work serves as a foundation for understanding the structure–function relationship of eukaryotic CerSs.
Figure EV1. Sequence alignments of yeast Lac1 and Lag1, and human CerS family members.
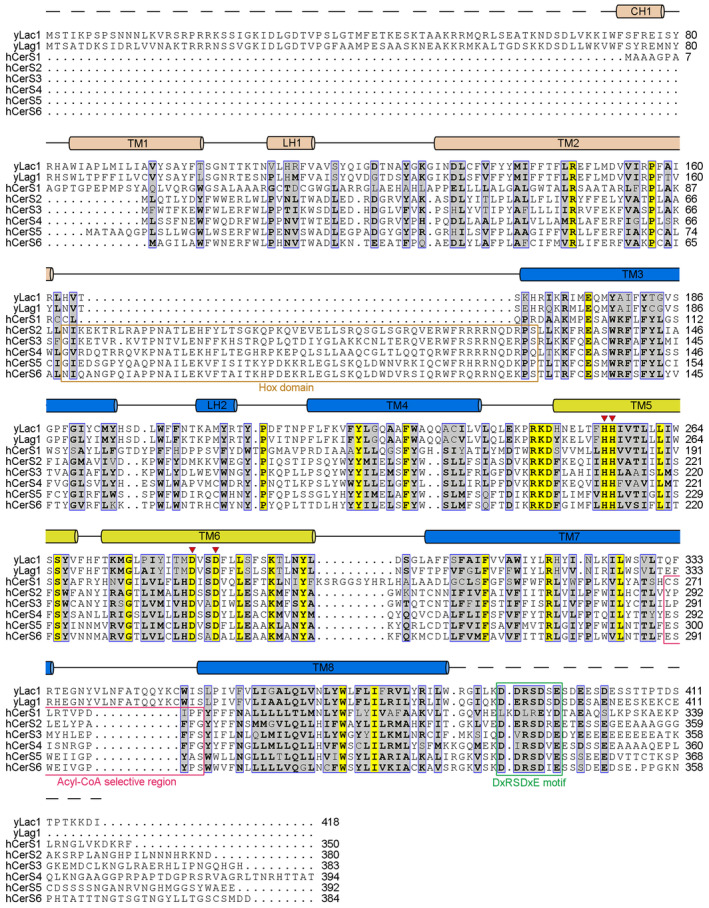
Secondary structural elements of yeast Lac1 are labeled above the sequence alignment. CH: cytosolic helix; TM: transmembrane helix; LH: luminal helix. The NTD is colored wheat. The TLC domain is colored marine with the Lag1p motif shown in yellow. The four red triangles indicate the predicted catalytic histidine and aspartate residues in the Lag1p motif. The Hox domains and acyl‐CoA selective regions in human CerS are highlighted with wheat and dark pink boxes, respectively. The DxRSDxE dimerization motif is highlighted with a green box. The UniProt IDs for the aligned sequences are as follows: yLac1: P28496; yLag1: P38703; hCerS1: P27544; hCerS2: Q96G23; hCerS3: Q8IU89; hCerS4: Q9HA82; hCerS5: Q8N5B7; and hCerS6: Q6ZMG9. “y” for Saccharomyces cerevisiae (yeast) and “h” for Homo sapiens (human).
Results
Biochemical characterization of the yeast Lac1‐Lip1 complex
Yeast Lag1 (411 residues) and Lac1 (418 residues) share 73% sequence identity and appear to be functionally redundant proteins since single deletions caused no obvious defects in yeast (Jiang et al, 1998; Barz & Walter, 1999). The recombinant protein expression and purification of Lag1‐Lip1 and Lac1‐Lip1 complexes are described in detail in Materials and Methods (Fig EV2A). We employed an in vitro enzymatic assay, previously utilized for assessing the activity of serine palmitoyltransferase (SPT) complex (Li et al, 2021; Liu et al, 2023; Xie et al, 2023), to measure the activity of the purified CerS complexes. This was achieved by monitoring the release of free CoA‐SH from the N‐acyltransferase reaction (Fig 1A). In the presence of 100 μM DHS and 100 μM C26‐CoA substrates, the catalytic activity of the Lac1‐Lip1 complex could be readily detected (Fig 1B), whereas the activity of the Lag1‐Lip1 complex was only around 5% of that of the Lac1‐Lip1 complex (Fig EV2B). As negative controls, mutations of the two highly conserved histidine residues in the Lag1p motif of Lag1 or Lac1 to alanine (H255A/H256A) resulted in a complete loss of enzymatic activity of both complexes (Figs 1B and EV2B). Since the purified Lac1‐Lip1 complex exhibited much higher enzymatic activity compared to the purified Lag1‐Lip1 complex, we focused on the Lac1‐Lip1 complex for the following biochemical and structural studies.
Figure EV2. Biochemical characterization of the Lac1‐Lip1 and Lag1‐Lip1 complexes.
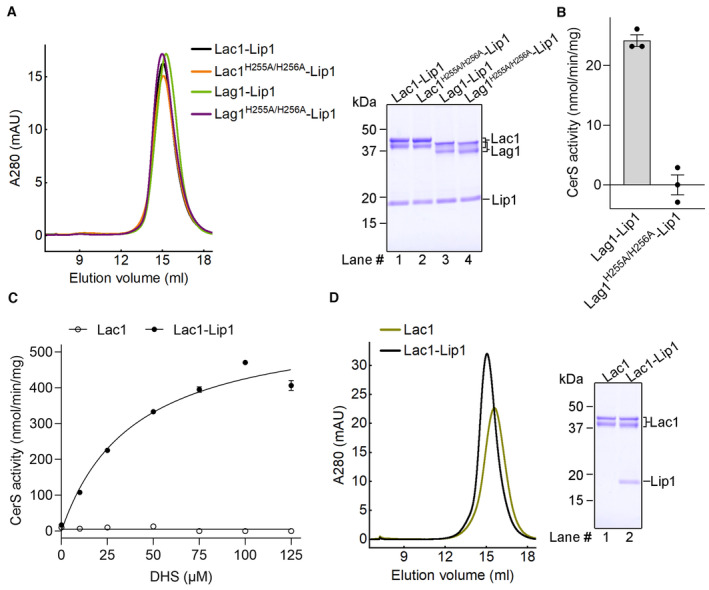
- Size exclusion chromatography (SEC) profiles and Coomassie blue‐stained SDS‐PAGE gel of the purified Lac1‐Lip1 and Lag1‐Lip1 complexes.
- Enzymatic activity of the WT Lag1‐Lip1 complex and the catalytic mutant Lag1H255A/H256A‐Lip1. Each data point is the average ± SEM of three independent experiments.
- CerS activity versus DHS concentration for the Lac1 alone protein and the Lac1‐Lip1 complex. The activity curve of the Lac1‐Lip1 complex follows a Michaelis–Menten equation with a K m of 39.44 ± 6.29 μM for DHS and a V max of 593.3 ± 34.5 nmol/min/mg. Each data point is the average ± SEM of three independent experiments.
- SEC profile and Coomassie blue‐stained SDS‐PAGE gel of the Lac1 alone protein and the Lac1‐Lip1 complex.
We measured the enzymatic activity of the Lac1‐Lip1 complex with various concentrations of C26‐CoA or DHS. The activity curve with different concentrations of DHS follows a Michaelis–Menten equation (Fig EV2C), whereas the activity curve with different concentrations of C26‐CoA fits well with an allosteric sigmoidal equation (Fig 1C), suggesting that C26‐CoA has a regulatory role on the complex. To investigate whether Lip1 contributes to the enzymatic activity of the purified complex, we expressed and purified the Lac1 subunit alone. The Lac1 alone protein was well‐folded and exhibited a monodisperse peak in size‐exclusion chromatography (SEC) (Fig EV2D), suggesting that Lip1 is not necessary for the proper folding of Lac1. No enzymatic activity was detected for Lac1 alone protein (Figs 1C and EV2C), supporting that Lip1 is essential for the enzymatic activity of the purified complex.
Structural determination of the Lac1‐Lip1 complex
The structure of the Lac1‐Lip1 complex was determined by single‐particle cryo‐electron microscopy (cryo‐EM) in the presence of 0.5 mM C26‐CoA substrate (Appendix Fig S1A–F). Representative 2D averages indicated a dimeric organization of the complex (Appendix Fig S1B). A density map of the Lac1‐Lip1 complex was reconstructed to an overall resolution of 3.09 Å with an imposed C2 symmetry (Appendix Fig S1F). The EM map was of excellent quality, enabling unambiguous model building for most of the protein regions and assignment of C26‐CoA (Appendix Fig S2A–E, Appendix Table S1). The resolved structure reveals that the Lac1‐Lip1 holoenzyme is a dimer of Lac1‐Lip1 heterodimers (Fig 1D). In each Lac1‐Lip1 heterodimer, a C26‐CoA molecule lies inside the Lac1 subunit and traverses the lipid bilayer, with the CoA moiety facing the cytosol (Fig 1D).
The N‐terminal 18 residues of Lip1 were invisible in the cryo‐EM map (Fig 1D), probably owing to its intrinsic flexibility. The resolved Lip1 structure (residues 19–150) contains a single transmembrane helix (TM) and a luminal α/β domain consisting of five anti‐parallel β‐sheet strands and two α helices (Fig EV3A). The TM of Lip1 is responsible for the assembly of Lac1‐Lip1 heterodimer, while the luminal domain of Lip1 mediates homo‐dimerization (Fig 1D). A Dali (Holm, 2022) search for structural homologs of Lip1 in the Protein Data Bank (PDB) failed to identify any protein with a similar fold, implying that Lip1 represents a novel fold.
Figure EV3. Features of Lip1 dimer.
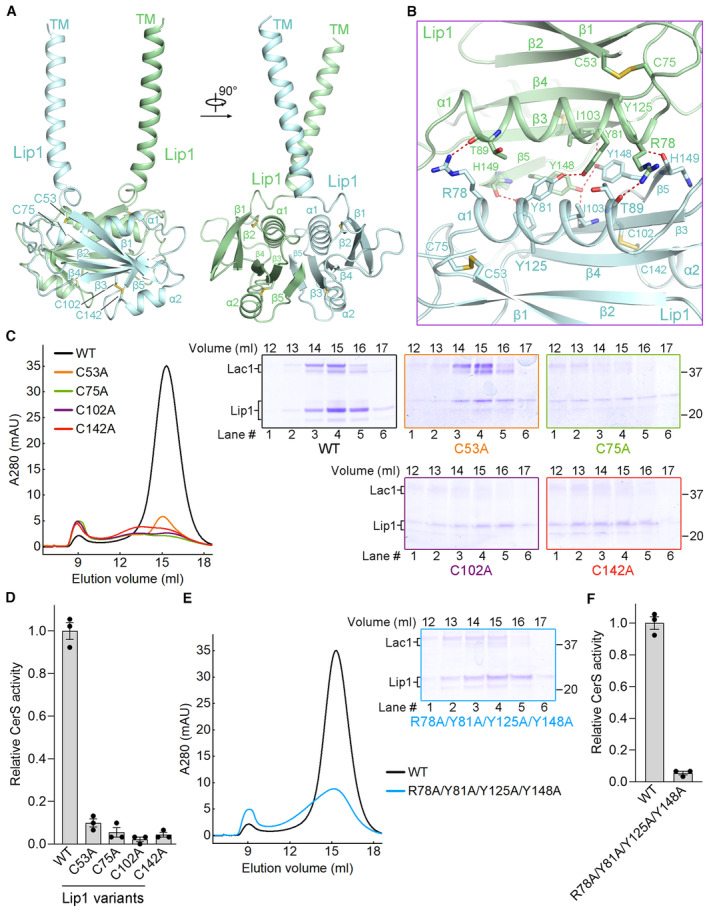
- Overall structure of Lip1 dimer.
- Lip1 dimer interface.
- SEC profiles and Coomassie blue‐stained SDS‐PAGE gel of the Lip1 cysteine mutants.
- Normalized CerS activity of the Lip1 cysteine mutants. Each data point is the average ± SEM of three independent experiments.
- SEC profile and Coomassie blue‐stained SDS‐PAGE gel of the Lip1 dimer interface variant.
- Normalized CerS activity of the Lip1 dimer interface variant. Each data point is the average ± SEM of three independent experiments.
Two intramolecular disulfide bonds (Cys53‐Cys75, Cys102‐Cys142) were found within the luminal domain of each Lip1 subunit (Figs 1D and EV3A and B). We generated four single‐cysteine mutants of Lip1 (C53A, C75A, C102A, C142A) and purified the mutated Lac1‐Lip1 complexes (Fig EV3C). These four mutants resulted in greatly reduced expression levels, poor solution behavior in SEC, and less than 10% of the enzymatic activity of the WT complex (Fig EV3C and D). The results indicate that the two intramolecular disulfide bonds within the luminal domain of Lip1 are important for the proper folding and enzymatic activity of the complex.
The Lip1 homo‐dimerization interface involves extensive interactions between the α1/β3/β4/β5 segments of both subunits (Fig EV3B). To investigate the functional impact of Lip1 homo‐dimerization interface, we generated a four‐point mutation of Lip1 (R78A/Y81A/Y125A/Y148A) (Fig EV3B). Although the mutated complex remained partially as dimer in SEC, this mutant displayed prominently reduced expression level, relatively poor solution behavior with broad SEC peak, and approximately 5% of the enzymatic activity of the WT complex (Fig EV3E and F). The data implies that the Lip1 homo‐dimerization interface might also be important for the proper folding and enzymatic activity of the complex.
Lac1 encloses a conserved hydrophilic reaction chamber
Each Lac1 subunit contains eight TMs (TM1‐TM8), with both N‐ and C‐termini facing the cytosol (Fig 2A). Among the eight TMs of Lac1, TM3‐TM8 constitute the TLC domain and TM1‐TM2 are named as the N‐terminal domain (NTD) (Fig 2A). The N‐terminal 70 residues and C‐terminal 33 residues of Lac1 were not resolved, indicating the high flexibility of these regions. The structure reveals three long luminal loops of Lac1, which connect TM1/2, TM3/4, and TM7/8, respectively (Fig 2A). In addition to the eight TMs, three short helices were resolved in the Lac1 structure, including one cytosolic helix (CH1) preceding TM1 and two luminal helices (LH1 and LH2) located within TM1/2 and TM3/4 loops, respectively (Fig 2A).
Figure 2. A conserved hydrophilic reaction chamber within Lac1.
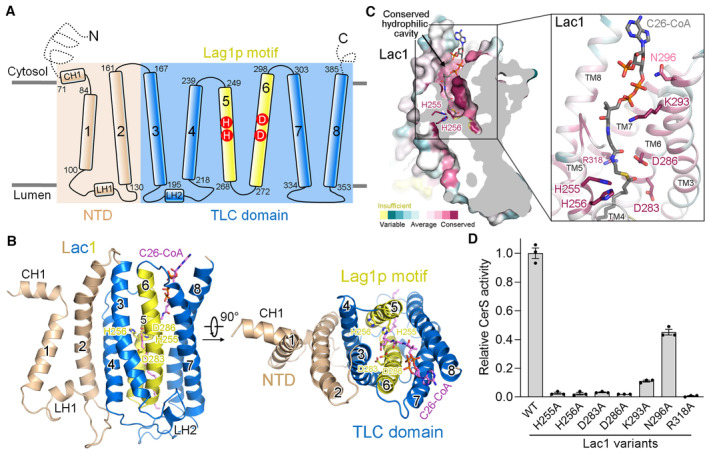
- Schematic representation of the topology of Lac1. NTD, N‐terminal domain; TLC, TRAM‐LAG1‐CLN8; CH, cytosolic helix; LH, luminal helix.
- Two perpendicular views of the Lac1 subunit. The NTD is colored wheat. The TLC domain is colored marine with the Lag1p motif shown in yellow. C26‐CoA is shown in magenta sticks. The predicted catalytic histidine and aspartate residues in the Lag1p motif are shown in sticks.
- A conserved hydrophilic cavity within the TLC domain of Lac1. Lac1 is colored by the amino acid conservation scores calculated by ConSurf (Yariv et al, 2023) analysis of the yeast and human CerS members presented in Fig EV1. The conserved charged and polar residues within the hydrophilic cavity are shown in sticks. C26‐CoA is shown in gray sticks.
- Functional characterization of the conserved charged and polar residues shown in panel (C) by CerS activity. The activities of Lac1‐Lip1 variants were normalized relative to that of the WT Lac1‐Lip1 complex. Each data point is the average ± SEM of three independent experiments.
Source data are available online for this figure.
The TLC domain of Lac1 forms a large hydrophilic cavity within the membrane that is open to the cytosolic side (Figs 1D and 2B and C). The four highly conserved charged residues within the Lag1p motif (TM5‐TM6) of Lac1, namely His255, His256, Asp283, and Asp286, are buried inside the cavity with their side chains facing the cavity (Fig 2B and C). The hydrophilic CoA moiety of C26‐CoA binds within the cavity, placing the thioester bond of C26‐CoA close to the conserved His and Asp residues (Fig 2B and C). These structural observations further support the possibility that the highly conserved His and Asp residues shared by CerS family enzymes are involved in substrate binding and/or catalysis and indicate that the acyl‐transfer reaction occurs within the membrane.
To assess the function of residues within the hydrophilic cavity, we first made four single‐point alanine mutations targeting the highly conserved His and Asp residues of Lac1 (H255A, H256A, D283A, D286A). All four single‐point mutations did not affect the folding of the complexes (Appendix Fig S3A), but the purified mutants essentially lost the catalytic activity (Fig 2D). We also generated three other Lac1 mutants targeting the two other invariant charged residues and one less conserved polar residue within the hydrophilic cavity (K293A, R318A, N296A) (Appendix Fig S3A). The enzymatic activity of the three mutants was severely impaired (Fig 2D). Together, these studies suggest that the charged and polar residues within the hydrophilic cavity are crucial for enzyme‐catalyzed reactions, possibly due to their important roles in substrate binding and/or catalysis.
Acyl chain binding tunnel
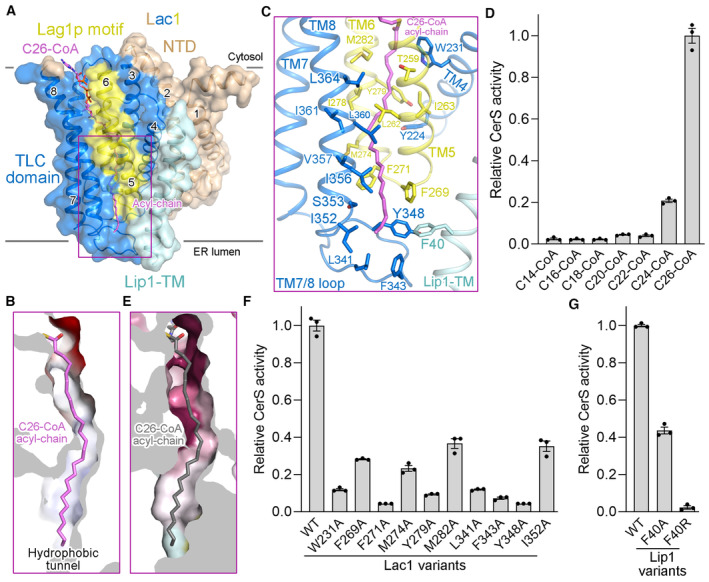
The acyl chain of C26‐CoA extends through the reaction chamber towards the ER lumen (Fig 3A). The acyl chain lies deep within a hydrophobic tunnel formed by TM4‐TM8 of Lac1 and is coordinated by numerous hydrophobic residues lining the tunnel (Fig 3B and C). Four hydrophobic residues (Leu341, Phe343, Tyr348, and Ile352) in the last luminal loop (TM7/8 loop) of Lac1 and one hydrophobic residue (Phe40) in the TM of Lip1 make close contacts with the distal end of acyl chain, allowing the tunnel to perfectly accommodate a 26‐carbon acyl chain (Fig 3C). The activity of the Lac1‐Lip1 complex was examined using a series of acyl‐CoA substrates with shorter acyl chains (Fig 3D). The activity of Lac1‐Lip1 complex in the presence of C24‐CoA was only ~20% of that with C26‐CoA as a substrate, and the activity obtained using C22‐ to C14‐CoA was less than 5% of that with C26‐CoA as a substrate (Fig 3D). Acyl‐CoA molecules with shorter acyl chains cannot fully occupy the hydrophobic tunnel, which may explain the molecular basis for the acyl chain‐length selectivity of the Lac1‐Lip1 complex.
Figure 3. The acyl chain binding tunnel.
-
AC26‐CoA is coordinated by the TLC domain of Lac1 and the TM of Lip1.
-
BA hydrophobic tunnel for C26‐CoA acyl‐chain binding in Lac1.
-
CA close‐up view of the interactions between C26‐CoA acyl‐chain and the Lac1‐Lip1 complex. The residues lining the acyl chain binding tunnel are shown in sticks.
-
DAcyl‐chain selectivity of the Lac1‐Lip1 complex revealed by CerS activity. Each data point is the average ± SEM of three independent experiments.
-
EThe distal end of the hydrophobic tunnel for C26‐CoA acyl‐chain coordination is not conserved. Lac1 is colored by the same amino acid conservation scores as in Fig 2C.
-
F, GFunctional characterization of Lac1 (F) and Lip1 (G) hydrophobic residues for C26‐CoA acyl‐chain binding by CerS activity. Each data point is the average ± SEM of three independent experiments.
Source data are available online for this figure.
In contrast to the highly conserved residues in the hydrophilic reaction chamber enclosed by Lac1, residues lining the acyl chain binding tunnel are less conserved in yeast and human CerS homologs, especially those near the distal end of the acyl chain (Fig 3E). This is consistent with the distinct acyl‐CoA preferences of yeast and human CerS homologs. Ten Lac1 hydrophobic residues lining the acyl chain binding tunnel were individually mutated to the less bulky residue alanine (W231A, F269A, F271A, M274A, Y279A, M282A, L341A, F343A, Y348A, and I352A). The mutated complexes were well‐folded (Appendix Fig S3B), but their catalytic activity was drastically reduced (Fig 3F). Mutation of Phe40 of Lip1 to alanine or arginine (F40A, F40R) also preserved protein folding (Appendix Fig S3C), but led to ~60% or complete loss of catalytic activity, respectively (Fig 3G). Data on these two Lip1 mutants suggest that Lip1 can enhance the catalytic activity of the complex probably by engaging in Lac1 interaction and acyl chain binding, akin to the stimulatory role of small regulatory subunit in the human SPT complex (Li et al, 2021; Wang et al, 2021). In conclusion, these results support the importance of acyl chain binding residues for the optimal catalytic activity of the complex.
Interactions between Lac1 and Lip1
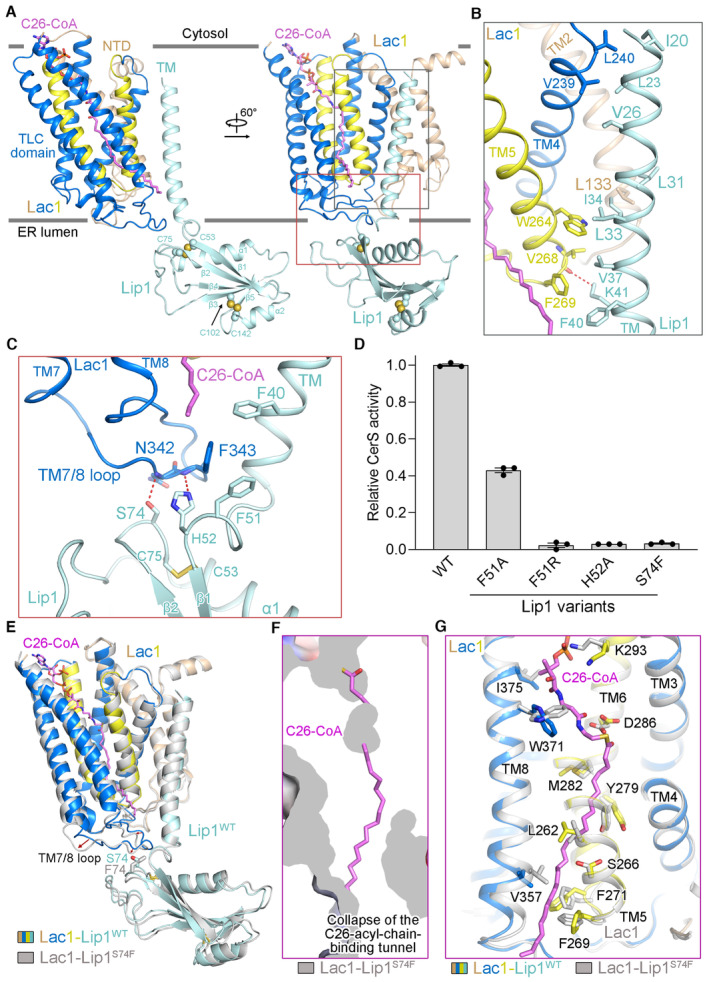
Lac1‐Lip1 heterodimer is assembled mainly through the interactions between TM of Lip1 and TMs 2/4/5 of Lac1 (Fig 4A and B). The hydrophobic residues Ile20/Leu23/Val26 of Lip1‐TM pack closely against Val239/Leu240 of Lac1‐TM4 near the cytosolic side of the membrane (Fig 4B). Meanwhile, the hydrophobic residues Leu31/Ile34 and Leu33/Val37/Phe40 of Lip1‐TM pack against Leu133 of Lac1‐TM2 and Trp264/Phe269 of Lac1‐TM5, respectively, near the luminal side of the membrane (Fig 4B). Moreover, the side chain of Lys41 in Lip1‐TM forms a potential hydrogen bond with the main chain of Val268 in Lac1‐TM5, further strengthening the Lac1‐Lip1 TM interface on the luminal side (Fig 4B). We created two Lip1 mutants at the TM interaction interface, namely Lip1V37F/K41F and Lip1V37Y/K41Y. Our results indicate that both mutants partially impaired the formation of the complex between Lac1 and Lip1, providing evidence for the importance of the TM interaction interface in the formation of the Lac1‐Lip1 complex (Appendix Fig S4A).
Figure 4. Interactions between Lac1 and Lip1.
-
AOverall structure of a Lac1‐Lip1 heterodimer. The two interaction interfaces between Lac1 and Lip1, namely the TM interaction interface and the luminal interaction interface, are highlighted with gray and red boxes, respectively.
-
B, CDetailed views of the TM interaction interface between Lac1 and Lip1 (B) and the luminal interaction interface between Lac1 and Lip (C). All potential polar interactions are displayed by red dashed lines.
-
DFunctional characterization of Lip1 residues at the luminal interaction interface between Lac1 and Lip1 by CerS activity. Each data point is the average ± SEM of three independent experiments.
-
EStructural superposition of the Lac1‐Lip1WT heterodimer (colored based on the subunits and domains) and the Lac1‐Lip1S74F heterodimer (colored light gray).
-
FCollapse of the C26 acyl chain binding tunnel within Lac1 in the Lac1‐Lip1S74F mutant structure.
-
GLocal conformational changes of residues lining the C26‐CoA binding site in the Lac1‐Lip1S74F mutant structure.
Source data are available online for this figure.
In addition to the interaction interface in the TM region, Lip1 also makes contact with Lac1 in the luminal region (Fig 4A and C). At the luminal interaction interface, Phe51/His52/Ser74 in the luminal domain of Lip1 and Asn342/Phe343 in the TM7/8 loop of Lac1 are very close to each other, with the side chains of His52 and Ser74 in Lip1 forming potential hydrogen bonds with the main chains of Phe343 and Asn342 in Lac1, respectively (Fig 4C). To explore the functional importance of the luminal interaction interface, we generated four Lip1 mutants (F51A, F51R, H52A, and S74F). The mutated complexes folded similarly as the WT complex, and these four mutants did not affect the binding between Lip1 and Lac1 (Appendix Fig S4B), indicating that the binding between Lip1 and Lac1 is mainly contributed by the TM interaction interface. Mutation of Phe51 or His52 of Lip1 to alanine resulted in a ~60% reduction or essentially complete loss of catalytic activity, respectively (Fig 4D). Mutating Phe51 of Lip1 to a charged arginine or mutating Ser74 of Lip1 to a bulky phenylalanine also nearly abolished the enzymatic activity of the complex (Fig 4D). We also assessed the enzymatic activity of the Lac1‐Lip1F51A, Lac1‐Lip1F51R, Lac1‐Lip1H52A, and Lac1‐Lip1S74F mutants using C14‐ to C26‐CoA substrates. Our data showed that the Lac1‐Lip1F51A mutant displayed similar acyl‐CoA substrate selectivity as the WT complex, and the other three mutants were essentially inactive with all the acyl‐CoA substrates tested (Appendix Fig S4C). These results suggest that the specific interaction of Lip1 and Lac1 in the luminal region is important for the enzymatic activity of the complex.
Since the TM7/8 loop of Lac1 plays a key role in defining the acyl chain binding tunnel, we suspected that mutations in Lip1, responsible for the binding with TM7/8 loop of Lac1, may directly perturb the acyl chain binding tunnel (Fig 4C), leading to the greatly reduced catalytic activity of the mutants (Fig 4D). To corroborate this hypothesis, we determined the cryo‐EM structure of the Lac1‐Lip1S74F mutant at an overall resolution of 3.85 Å (Appendix Fig S5A–F). By comparing the structure of the Lac1‐Lip1S74F heterodimer with that of the WT Lac1‐Lip1 heterodimer, we observed that the Lip1S74F mutation caused an evident conformational change in the TM7/8 loop of Lac1 (Fig 4E). More importantly, the C26 acyl chain binding tunnel within Lac1 observed in the WT complex collapsed in the Lip1S74F mutant complex (Fig 4F), accomplished by some local conformational changes of residues lining the acyl chain binding tunnel (Fig 4G). Conformational changes in the residues lining the acyl chain binding tunnel, such as W371 and K293, which are distant from Lip1S74F, could potentially be attributed to the subtle perturbation of the Lac1 structure resulting from the direct conformational change of the TM7/8 loop. The collapsed acyl chain binding tunnel presumably explains the abolished catalytic activity of the Lip1S74F mutant complex (Fig 4D). Altogether, these studies suggest that the interaction of Lip1 and Lac1 in the luminal region is crucial for maintaining the proper acyl chain binding tunnel as well as the optimal activity of the complex.
A lateral opening on Lac1
In addition to a large cytosolic opening (Fig 1D), Lac1 also features a small lateral opening in the membrane‐embedded region (Fig 5A). This lateral opening converges with the reaction chamber of Lac1 near the thioester bond of C26‐CoA (Fig 5A), indicating that the lateral opening could potentially serve as an entry site for the sphingoid base substrate. Consistent with this possibility, a lipid‐like density was observed close to the lateral opening (Fig 5A). The lipid‐like density stretches over the lateral opening and approaches the predicted catalytic sites (Fig 5B). The residues surrounding the lipid‐like density are predominantly hydrophobic, but two polar residues, Ser186 and Gln227, are located in proximity to the entrance of the lateral opening (Fig 5C). Taken together, these structural observations support the hypothesis that the lateral opening on Lac1 may allow for the entrance of the sphingoid base substrate, with polar residues Ser186 and/or Gln227 potentially assisting in coordinating the polar head of the sphingoid base.
Figure 5. A lateral opening on Lac1.
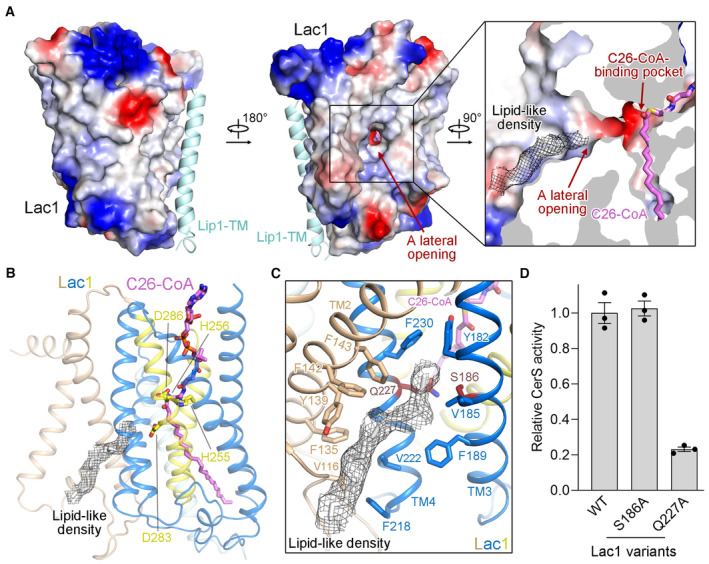
- Detailed views of the lateral opening on Lac1.
- A lipid‐like density stretches over the lateral opening and approaches the predicted catalytic sites. For visualization and clarification, an acyl chain was modeled into the lipid‐like density.
- While the residues surrounding the lipid‐like density are predominantly hydrophobic, two polar residues, Ser186 and Gln227, are located near the entrance of the lateral opening.
- CerS activity of the lateral‐opening mutants. Each data point is the average ± SEM of three independent experiments.
Source data are available online for this figure.
Mutating Ser186 to alanine did not affect the enzymatic activity of the complex, whereas mutating Gln227 to alanine greatly reduced the enzymatic activity of the complex to only about 20% of that of the WT complex (Fig 5D, Appendix Fig S4D). These results suggest that Gln227 is important for the catalytic activity of the complex, possibly due to its role in sphingoid base binding.
Discussion
The structure of the yeast CerS in complex with C26‐CoA substrate presented here not only reveals that the holoenzyme is a dimer of heterodimers but also elucidates the structural basis of C26‐CoA binding. The structural observation, coupled with structure‐guided mutational analysis, clarifies the use of a conserved hydrophilic reaction chamber in the ER membrane for catalysis. The C26‐CoA thioester bond is located near the predicted catalytic His and Asp residues. The Lip1 subunit interacts with Lac1, fulfilling a crucial role in preserving a proper acyl chain binding tunnel and likely contributing to acyl chain binding. These findings shed light on the molecular mechanism underlying the stimulating effect of Lip1 on the catalytic activity of the complex. A lateral opening was revealed on Lac1 for the potential entrance of the sphingoid base substrate. These results provide a basis for understanding the catalytic mechanism of the CerS enzymes.
Based on our study, we proposed a working model for yeast CerS‐catalyzed ceramide formation (Fig EV4A and B). The C26‐CoA substrate enters the reaction chamber of Lac1‐Lip1 heterodimer probably from the cytosolic side of the membrane leaflet. The CoA moiety of C26‐CoA is located in the hydrophilic chamber, while the acyl‐chain moiety lies in the hydrophobic tunnel (Fig EV4A, left). The sphingoid base substrate might approach the reaction chamber through a lateral opening on Lac1 (Fig EV4A, left). The sphingosine N‐acyltransferase reaction for ceramide synthesis occurs through a proposed one‐step catalytic mechanism (Fig EV4B), similar to that for Hedgehog (Hh) acyltransferase (HHAT), which accounts for the N‐palmitoylation of Hh proteins (Jiang et al, 2021). In the proposed catalytic mechanism, Asp283 or Asp286 of Lac1 functions as a general base to activate the amino group of sphingoid base for nucleophilic attack on the carbonyl carbon of C26‐CoA, which is coordinated by His255 or His256 (Fig EV4B). After the catalytic reaction, the product of free CoA‐SH is released to the cytosol, whereas the hydrophobic product ceramide diffuses into the membrane bilayer (Fig EV4A, right). Further studies, including the structure of CerS in a complex with a sphingoid base substrate and the structures in distinct catalytic states, are necessary to delineate the precise catalytic mechanism.
Figure EV4. Proposed working mechanism of yeast CerS.
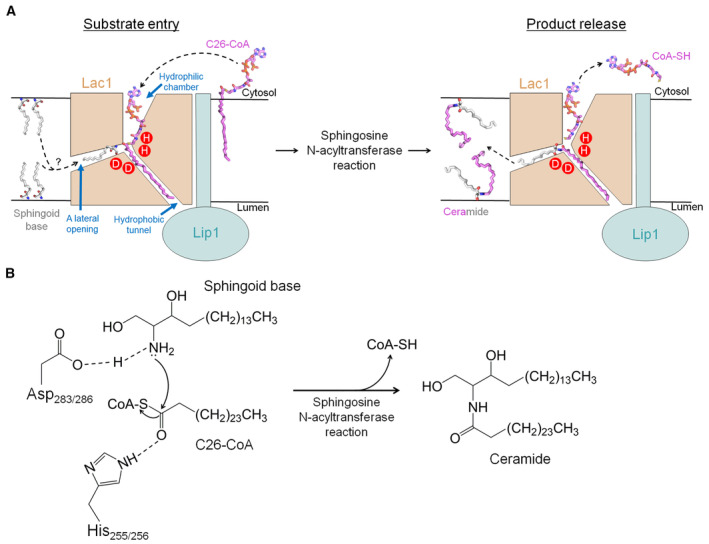
- A hypothetic model for yeast CerS‐catalyzed ceramide formation. The C26‐CoA substrate enters the reaction chamber within Lac1 probably through the cytosolic side of the membrane. The CoA moiety of C26‐CoA is located in the hydrophilic reaction chamber, while the acyl‐chain moiety is positioned in the hydrophobic tunnel. Once the sphingoid base substrate from either leaflet of the membrane enters a lateral opening on Lac1, it approaches the catalytic histidine and aspartate residues near the thioester bond of C26‐CoA, preparing for the sphingosine N‐acyltransferase reaction. After the reaction, the product of free CoA‐SH is released to the cytosol, whereas the hydrophobic product ceramide is released to either leaflet of the membrane. For simplicity, only one Lac1‐Lip1 heterodimer is illustrated.
- Proposed catalytic mechanism. Asp283 or Asp286 of Lac1 functions as a general base to activate the amino group of the sphingoid base for nucleophilic attack on the carbonyl carbon of C26‐CoA, which is coordinated by His255 or His256. The CerS‐catalyzed acyl transfer reaction promotes the N‐acylation of sphingoid base for ceramide production and releases free CoA‐SH.
Due to the current unavailability of an experimental high‐resolution structure of mammalian CerS, we utilized AlphaFold‐predicted human CerS structures (hCerS1AF‐hCerS6AF) (Jumper et al, 2021) as substitutes to compare the structure–function relationship between mammalian CerS and yeast CerS (Fig EV5A and B). When hCerS5AF was superimposed on the Lac1‐Lip1 heterodimer, it was observed that the N‐terminal region preceding TM1 of hCerS5AF, which forms three short luminal helices (LH1‐LH3) near the luminal side of the membrane, experienced severe clashes with the TM of Lip1 (Fig EV5B). These clashes could potentially provide an explanation for the absence of Lip1 homologs in mammals. Given the high conservation of both the hydrophilic reaction chamber (Fig 2C) and the upper portion of the acyl‐chain binding tunnel (Fig 3E) among yeast and human CerS homologs, it is probable that human CerS homologs employ the same reaction chamber and tunnel as the Lac1‐Lip1 complex to coordinate acyl‐CoA substrates. However, the residues lining the lower portion of the acyl‐chain binding tunnel do not exhibit conservation in yeast and human CerS homologs (Fig 3E), suggesting that these variable regions present in human CerS homologs might have a role in accommodating substrates with different acyl‐chain lengths. Supporting this speculation, an 11‐residue region within hCerS5AF (referred to as acyl‐CoA selective region in Figs EV1 and EV5A), belonging to these variable regions, has been proposed to determine the acyl‐CoA selectivity in mammalian CerS (Tidhar et al, 2018). Further structural and biochemical studies are needed to fully uncover the mechanism of acyl‐CoA substrate selectivity in human CerS homologs.
Figure EV5. Human CerS structural models predicted by AlphaFold.
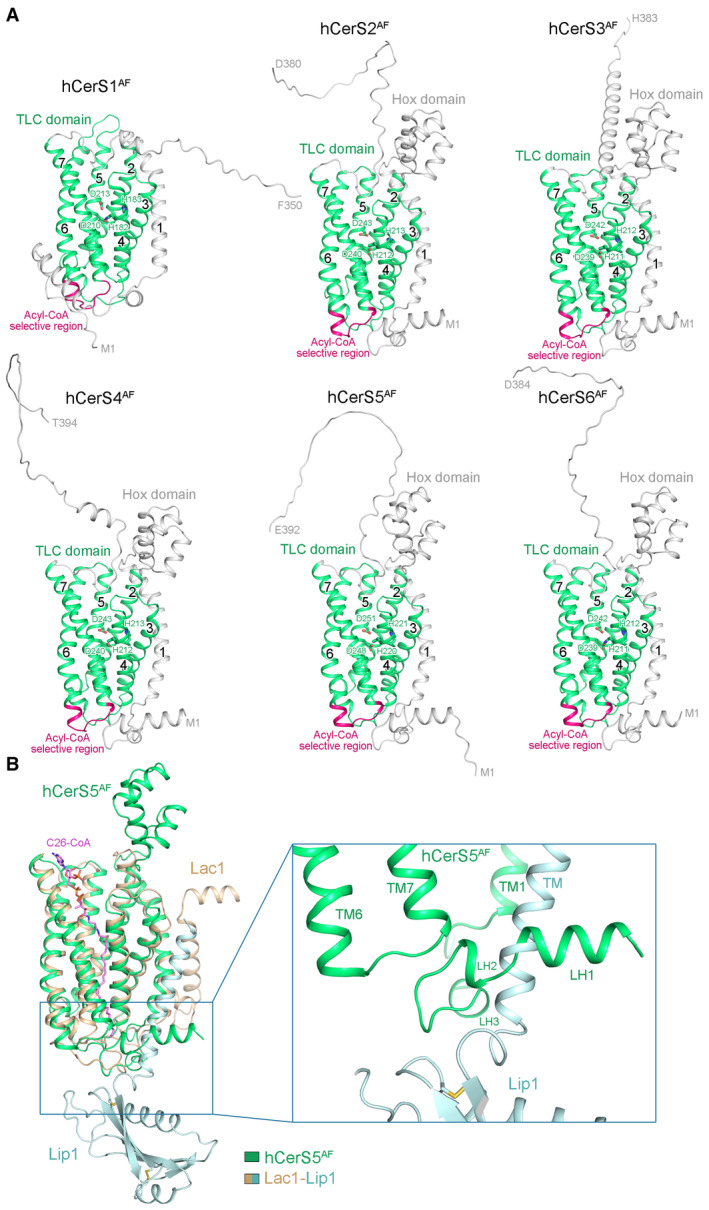
- The AlphaFold‐predicted human CerS structures (hCerS1AF‐hCerS6AF). The N‐terminal regions and Hox domains of hCerSs are colored light gray. The TLC domains are colored green with the acyl‐CoA selective regions highlighted in dark pink. The predicted catalytic histidine and aspartate residues in the Lag1p motifs are shown in sticks.
- Structural superposition of the hCerS5AF (colored green) and the Lac1‐Lip1 heterodimer (colored wheat and light cyan). The N‐terminal region of hCerS5AF severely clashes with the TM of Lip1.
The Lac1‐Lip1 complex structure shows that the homo‐dimeric organization of the Lac1‐Lip1 holoenzyme is mediated only by the Lip1 subunit, while no interaction was found between the two Lac1 subunits. Mammalian CerS (except CerS1) have been shown to form both homo‐ and hetero‐dimers via a conserved C‐terminal DxRSDxE motif, and mammalian CerS activity can be modulated by homo‐ and hetero‐dimerization (Laviad et al, 2012; Kim et al, 2022). This conserved dimerization motif is also present in yeast Lac1 and Lag1 (Fig EV1). This motif is not resolved in our structure, suggesting its intrinsic flexibility in the current structure. Interestingly, in our SEC experiments for large‐scale purification of the Lac1‐Lip1 complex, we often observed a larger but less abundant Lac1‐Lip1 complex prior to the 2:2 Lac1‐Lip1 complex peak (Appendix Fig S6A). Cryo‐EM analysis of the larger Lac1‐Lip1 complex revealed particles bigger than the 2:2 Lac1‐Lip1 complex (Appendix Fig S6B). We could clearly identify two Lip1 dimers from the larger particles in the representative 2D averages (Appendix Fig S6B). The size and shape of the larger Lac1‐Lip1 complex are consistent with a 4:4 Lac1‐Lip1 complex, which is formed by two copies of 2:2 Lac1‐Lip1 complexes through a dimerization interface mediated by Lac1 (Appendix Fig S6C). However, the larger Lac1‐Lip1 complex appears to be highly heterogeneous in the cryo‐EM samples (Appendix Fig S6B), hindering 3D reconstruction of the 4:4 Lac1‐Lip1 complex. Further investigations are needed to determine the Lac1‐mediated dimer interface and whether this interface regulates yeast CerS activity, as it will have important implications for understanding the molecular mechanisms by which mammalian CerS is regulated by dimerization.
Apart from the previously reported post‐translational regulation of mammalian CerS via dimerization, both mammalian and yeast CerS have been revealed to be regulated via phosphorylation (Muir et al, 2014; Fresques et al, 2015; Sassa et al, 2016). Since the phosphorylation sequences at the N‐ and C‐termini of Lac1 (Ser23/Ser24 and Ser393/Ser395/Ser397) are highly flexible in the resolved structures, further exploration is required to ascertain the molecular mechanism by which phosphorylation regulates CerS activity. Despite many remaining questions, the results presented in this study offer critical insights into the structure and mechanism of eukaryotic CerSs. These findings are considered important for understanding CerS biology and are expected to facilitate the rational design of CerS modulators for the treatment of metabolic diseases and cancers in the future.
Materials and Methods
Protein expression and purification
The full‐length cDNA sequences of yeast Lac1 (Uniprot: P28496), Lag1 (Uniprot: P38703), and Lip1 (Uniprot: Q03579) were codon‐optimized and individually subcloned into the pCAG vector fused with a Flag‐tag or without a tag. All variants were generated with a standard two‐step PCR‐based strategy. The Flag‐tag was added at the C‐termini of Lac1, Lag1, and their variants, or the N‐termini of Lip1 and its variants. The Lac1‐Lip1 complexes bearing Lac1 mutations were purified by the C‐terminal Flag‐tagged Lac1, while the Lac1‐Lip1 complexes with Lip1 mutations were purified by the N‐terminal Flag‐tagged Lip1. HEK 293F suspension cells (Invitrogen) were grown in SMM 293T‐II medium (Sino Biological Inc.) at 37°C, supplied with 5% CO2 in a shaker. The cells were transiently transfected with one or two expression plasmids and polyethyleneimine (PEI) (Yeasen) at a cell density of around 2.5 × 10⁶ cells per ml. About 1.5 mg of expression plasmids were preincubated with 4.5 mg PEI in 50 ml fresh medium for 15–30 min at room temperature before being applied to 1 liter of cell culture. After 12 h of infection, 10 mM sodium butyrate was added to boost protein expression for another 48 h. The cells were harvested by centrifugation at 4,000 g for 10 min. The cell pellets were flash‐frozen in liquid nitrogen and stored at −80°C.
All protein purification steps were performed at 4°C. Cell pellets were resuspended in lysis buffer (25 mM HEPES pH 7.0, 150 mM NaCl) supplemented with a protease inhibitor cocktail (Amresco). The cell membranes were solubilized with 1% (w/v) GDN (Anatrace) at 4°C for 2 h. After centrifugation at 37,000 g for 1 h, the supernatant was collected and loaded onto anti‐Flag G1 affinity resin (GenScript), rinsed with the wash buffer (W buffer) (25 mM HEPES pH 7.0, 150 mM NaCl, and 0.01% GDN). The resin was washed with 20 column volumes of W buffer before being eluted with W buffer plus Flag peptide (200 μg/ml). The protein was further purified by size‐exclusion chromatography (SEC) using a Superose 6 Increase 10/300 GL column (GE Healthcare) equilibrated with W buffer. The peak fractions were pooled and concentrated for subsequent cryo‐EM sample preparation. The protein for biochemical studies was purified similarly, except that the detergent used to solubilize the membrane was replaced by 1% (w/v) LMNG (Anatrace) and 0.2% (w/v) CHS (Anatrace).
In vitro CerS activity assay
A continuous spectrophotometric assay (Li et al, 2021; Liu et al, 2023; Xie et al, 2023) was used to monitor the ceramide synthase activity of the purified protein by measuring the release of CoA‐SH from acyl‐CoA substrates. The sulfhydryl (‐SH) group of CoA‐SH reacts with 5,5′‐dithiobis‐2‐nitrobenzoic acid (DTNB) to produce the yellow‐colored TNB (5‐thio‐2‐nitrobenzoic acid) with maximum absorbance at 412 nm. A standard curve with CoA‐SH concentrations varying between 10 and 250 μM was produced. The assays were performed on a 50‐μl scale at 37°C in 96‐well plates with a BioTek plate reader. Absorbance at 412 nm was recorded for 1 h upon reaction initiation. A typical reaction mixture contained 0.3 μM yeast CerS protein complex, 0.4 mM DTNB, 100 μM DHS, 100 μM acyl‐CoA, and 10% (v/v) DMSO in W buffer. To measure the curve of CerS activity versus various concentrations of C26‐CoA, the DHS concentration was retained at 100 μM. To measure the curve of CerS activity versus various concentrations of DHS, the C26‐CoA concentration was kept at 100 μM. The CerS activity was calculated from the raw data that stays in the linear range and determined according to the CoA‐SH standard curve. The statistical analysis was performed with GraphPad Prism 8. For all dot‐plot graphs and curves, each data point is the average of three independent experiments, and error bars represent SEM.
Sample preparation and cryo‐EM data collection
For the cryo‐EM sample preparation of the C26‐CoA‐bound Lac1‐Lip1 complex, a final concentration of 30 μM C26‐CoA was added into the elution buffer during protein purification, and 0.5 mM C26‐CoA was incubated with 20 mg/ml Lac1‐Lip1 complex at 4°C for 30 min before grid preparation. The Quantifoil Cu R1.2/1.3300 mesh grids were glow‐discharged at 15 mA for 45 s in a PELCO easiGlow device before use. Aliquots of 3 μl purified protein were applied to the glow‐discharged grids. After blotting for 4.5 s at 8°C with 100% humidity, the grids were flash‐frozen in liquid ethane and cooled by liquid nitrogen using Vitrobot (Mark IV, Thermo Fisher Scientific). The sample preparation for the Lac1‐Lip1S74F complex was performed similarly without adding extra C26‐CoA. The datasets were collected with EPU automatically on a 300 kV Titan Krios microscope equipped with a GIF Quantum energy filter (Gatan) with a slit width of 20 eV and a K3 Summit direct electron detector (Gatan). All movie stacks were recorded at a nominal magnification of ×81,000 with defocus values from −2.0 to −1.0 μm. Each stack was exposed in super‐resolution mode for 2.3 s in 32 frames with a total dose of 50 e−/Å2.
Cryo‐EM data processing
Data processing procedures were summarized in flow charts in the Appendix Figs S1C and S5C. For the C26‐CoA‐bound Lac1‐Lip1 complex and the Lac1‐Lip1S74F complex, a total of 5,059 and 2,721 micrographs were collected, respectively. The stacks were motion corrected with dose weighting using MotionCor2 (Zheng et al, 2017), and binned twofold, resulting in a pixel size of 1.072 Å. The defocus values were estimated by Gctf (Zhang, 2016). A total of 5,112,832 and 2,355,239 particles were automatically picked from the two datasets in Relion 3.0 (Zivanov et al, 2018), respectively. All the following data processing procedures were performed in CryoSPARC (Punjani et al, 2017). A total of 862,488 and 626,235 particles were selected from the 2D classifications for the C26‐CoA‐bound Lac1‐Lip1 complex and the Lac1‐Lip1S74F complex, respectively. After two rounds of multiclass ab‐initio reconstruction, heterogeneous refinement, and non‐uniform refinement, 355,520 and 213,962 particles with good structural features were chosen, respectively. A further round of resolution‐gradient classification, non‐uniform refinement, and local refinement with C2 symmetry yielded reconstructions with overall resolutions of 3.09 and 3.85 Å with 179,070 and 93,964 particles for the C26‐CoA‐bound Lac1‐Lip1 complex and the Lac1‐Lip1S74F complex, respectively. Resolutions were estimated by the gold‐standard Fourier shell correlation 0.143 criterion (Rosenthal & Henderson, 2003) with high‐resolution noise substitution (Chen et al, 2013).
Model building and refinement
The Lac1 and Lip1 models predicted from AlphaFold were used as the initial models for C26‐CoA‐bound Lac1‐Lip1 model building. The predicted models were docked into the map using UCSF Chimera (Pettersen et al, 2004). Each residue was manually adjusted in Coot (Emsley et al, 2010). Structure refinements were carried out by Phenix (Adams et al, 2010) in real space with secondary structure and geometry restraints. The C26‐CoA‐bound Lac1‐Lip1 structure was used as the initial model for the Lac1‐Lip1S74F model building. All the structural models were validated using Phenix and MolProbity (Williams et al, 2018). The refinement and validation statistics were summarized in Appendix Table S1. All structural figures were prepared using PyMol (DeLano, 2002) or Chimera.
Author contributions
Xin Gong: Conceptualization; formal analysis; supervision; funding acquisition; writing – original draft; writing – review and editing. Tian Xie: Data curation; formal analysis; writing – review and editing. Qi Fang: Data curation; formal analysis. Zike Zhang: Data curation. Yanfei Wang: Data curation. Feitong Dong: Data curation.
Disclosure and competing interests statement
The authors declare that they have no conflict of interest.
Supporting information
Appendix
Expanded View Figures PDF
Review Process File
PDF+
Source Data for Figure 1
Source Data for Figure 2
Source Data for Figure 3
Source Data for Figure 4
Source Data for Figure 5
Acknowledgements
We thank the Cryo‐EM Facility of the Southern University of Science and Technology (SUSTech) for providing the facility support. We are grateful to Ma X., Gao Y., and all the other staffs in the SUSTech cryo‐EM center for their technical support on data collection. This work was supported by the National Natural Science Foundation of China (32122043 and 92057101 to XG), the Guangdong Basic and Applied Basic Research Foundation (2019B151502047 to XG), and the Shenzhen Science and Technology Program (RCYX20200714114522081 and 20220815111002002 to XG).
The EMBO Journal (2023) 42: e114889
Data availability
The EM density maps generated in this study have been deposited in the EMDB under accession codes EMD‐35862 (https://www.ebi.ac.uk/emdb/EMD‐35862) for C26‐CoA‐bound Lac1‐Lip1 complex and EMD‐35863 (https://www.ebi.ac.uk/emdb/EMD‐35863) for Lac1‐Lip1S74F complex. The atomic coordinates have been deposited in the PDB under the accession codes 8IZD (https://www.rcsb.org/structure/8IZD) for C26‐CoA‐bound Lac1‐Lip1 complex and 8IZF (https://www.rcsb.org/structure/8IZF) for Lac1‐Lip1S74F complex. Source data are provided with the manuscript.
References
- Adams PD, Afonine PV, Bunkoczi G, Chen VB, Davis IW, Echols N, Headd JJ, Hung LW, Kapral GJ, Grosse‐Kunstleve RW et al (2010) PHENIX: a comprehensive Python‐based system for macromolecular structure solution. Acta Crystallogr D Biol Crystallogr 66: 213–221 [DOI] [PMC free article] [PubMed] [Google Scholar]
- Barz WP, Walter P (1999) Two endoplasmic reticulum (ER) membrane proteins that facilitate ER‐to‐Golgi transport of glycosylphosphatidylinositol‐anchored proteins. Mol Biol Cell 10: 1043–1059 [DOI] [PMC free article] [PubMed] [Google Scholar]
- Brachtendorf S, El‐Hindi K, Grösch S (2019) Ceramide synthases in cancer therapy and chemoresistance. Prog Lipid Res 74: 160–185 [DOI] [PubMed] [Google Scholar]
- Chaurasia B, Summers SA (2015) Ceramides ‐ lipotoxic inducers of metabolic disorders. Trends Endocrinol Metab 26: 538–550 [DOI] [PubMed] [Google Scholar]
- Chaurasia B, Summers SA (2021) Ceramides in metabolism: key lipotoxic players. Annu Rev Physiol 83: 303–330 [DOI] [PMC free article] [PubMed] [Google Scholar]
- Chen SX, McMullan G, Faruqi AR, Murshudov GN, Short JM, Scheres SHW, Henderson R (2013) High‐resolution noise substitution to measure overfitting and validate resolution in 3D structure determination by single particle electron cryomicroscopy. Ultramicroscopy 135: 24–35 [DOI] [PMC free article] [PubMed] [Google Scholar]
- Choi RH, Tatum SM, Symons JD, Summers SA, Holland WL (2021) Ceramides and other sphingolipids as drivers of cardiovascular disease. Nat Rev Cardiol 18: 701–711 [DOI] [PMC free article] [PubMed] [Google Scholar]
- DeLano WL (2002) The PyMOL molecular graphics system on world wide web. http://www.pymol.org
- Emsley P, Lohkamp B, Scott WG, Cowtan K (2010) Features and development of Coot. Acta Crystallogr D Biol Crystallogr 66: 486–501 [DOI] [PMC free article] [PubMed] [Google Scholar]
- Fresques T, Niles B, Aronova S, Mogri H, Rakhshandehroo T, Powers T (2015) Regulation of ceramide synthase by casein kinase 2‐dependent phosphorylation in Saccharomyces cerevisiae . J Biol Chem 290: 1395–1403 [DOI] [PMC free article] [PubMed] [Google Scholar]
- Gault CR, Obeid LM, Hannun YA (2010) An overview of sphingolipid metabolism: from synthesis to breakdown. Adv Exp Med Biol 688: 1–23 [DOI] [PMC free article] [PubMed] [Google Scholar]
- Guillas I, Kirchman PA, Chuard R, Pfefferli M, Jiang JC, Jazwinski SM, Conzelmann A (2001) C26‐CoA‐dependent ceramide synthesis of Saccharomyces cerevisiae is operated by Lag1p and Lac1p. EMBO J 20: 2655–2665 [DOI] [PMC free article] [PubMed] [Google Scholar]
- Guillas I, Jiang JC, Vionnet C, Roubaty C, Uldry D, Chuard R, Wang J, Jazwinski SM, Conzelmann A (2003) Human homologues of LAG1 reconstitute Acyl‐CoA‐dependent ceramide synthesis in yeast. J Biol Chem 278: 37083–37091 [DOI] [PubMed] [Google Scholar]
- Hannun YA, Obeid LM (2008) Principles of bioactive lipid signalling: lessons from sphingolipids. Nat Rev Mol Cell Biol 9: 139–150 [DOI] [PubMed] [Google Scholar]
- Hannun YA, Obeid LM (2011) Many ceramides. J Biol Chem 286: 27855–27862 [DOI] [PMC free article] [PubMed] [Google Scholar]
- Hannun YA, Obeid LM (2018) Sphingolipids and their metabolism in physiology and disease. Nat Rev Mol Cell Biol 19: 175–191 [DOI] [PMC free article] [PubMed] [Google Scholar]
- Harrison PJ, Dunn TM, Campopiano DJ (2018) Sphingolipid biosynthesis in man and microbes. Nat Prod Rep 35: 921–954 [DOI] [PMC free article] [PubMed] [Google Scholar]
- Havulinna AS, Sysi‐Aho M, Hilvo M, Kauhanen D, Hurme R, Ekroos K, Salomaa V, Laaksonen R (2016) Circulating ceramides predict cardiovascular outcomes in the population‐based FINRISK 2002 cohort. Arterioscler Thromb Vasc Biol 36: 2424–2430 [DOI] [PubMed] [Google Scholar]
- Hilvo M, Meikle PJ, Pedersen ER, Tell GS, Dhar I, Brenner H, Schöttker B, Lääperi M, Kauhanen D, Koistinen KM et al (2020) Development and validation of a ceramide‐ and phospholipid‐based cardiovascular risk estimation score for coronary artery disease patients. Eur Heart J 41: 371–380 [DOI] [PubMed] [Google Scholar]
- Hla T, Dannenberg AJ (2012) Sphingolipid signaling in metabolic disorders. Cell Metab 16: 420–434 [DOI] [PMC free article] [PubMed] [Google Scholar]
- Holm L (2022) Dali server: structural unification of protein families. Nucleic Acids Res 50: W210–W215 [DOI] [PMC free article] [PubMed] [Google Scholar]
- Jiang JC, Kirchman PA, Zagulski M, Hunt J, Jazwinski SM (1998) Homologs of the yeast longevity gene LAG1 in Caenorhabditis elegans and human. Genome Res 8: 1259–1272 [DOI] [PubMed] [Google Scholar]
- Jiang Y, Benz TL, Long SB (2021) Substrate and product complexes reveal mechanisms of Hedgehog acylation by HHAT. Science 372: 1215–1219 [DOI] [PMC free article] [PubMed] [Google Scholar]
- Jumper J, Evans R, Pritzel A, Green T, Figurnov M, Ronneberger O, Tunyasuvunakool K, Bates R, Žídek A, Potapenko A et al (2021) Highly accurate protein structure prediction with AlphaFold. Nature 596: 583–589 [DOI] [PMC free article] [PubMed] [Google Scholar]
- Kageyama‐Yahara N, Riezman H (2006) Transmembrane topology of ceramide synthase in yeast. Biochem J 398: 585–593 [DOI] [PMC free article] [PubMed] [Google Scholar]
- Karjalainen JP, Mononen N, Hutri‐Kähönen N, Lehtimäki M, Hilvo M, Kauhanen D, Juonala M, Viikari J, Kähönen M, Raitakari O et al (2019) New evidence from plasma ceramides links apoE polymorphism to greater risk of coronary artery disease in Finnish adults. J Lipid Res 60: 1622–1629 [DOI] [PMC free article] [PubMed] [Google Scholar]
- Kim JL, Ben‐Dor S, Rosenfeld‐Gur E, Futerman AH (2022) A novel C‐terminal DxRSDxE motif in ceramide synthases involved in dimer formation. J Biol Chem 298: 101517 [DOI] [PMC free article] [PubMed] [Google Scholar]
- Laaksonen R, Ekroos K, Sysi‐Aho M, Hilvo M, Vihervaara T, Kauhanen D, Suoniemi M, Hurme R, März W, Scharnagl H et al (2016) Plasma ceramides predict cardiovascular death in patients with stable coronary artery disease and acute coronary syndromes beyond LDL‐cholesterol. Eur Heart J 37: 1967–1976 [DOI] [PMC free article] [PubMed] [Google Scholar]
- Laviad EL, Albee L, Pankova‐Kholmyansky I, Epstein S, Park H, Merrill AH Jr, Futerman AH (2008) Characterization of ceramide synthase 2: tissue distribution, substrate specificity, and inhibition by sphingosine 1‐phosphate. J Biol Chem 283: 5677–5684 [DOI] [PubMed] [Google Scholar]
- Laviad EL, Kelly S, Merrill AH Jr, Futerman AH (2012) Modulation of ceramide synthase activity via dimerization. J Biol Chem 287: 21025–21033 [DOI] [PMC free article] [PubMed] [Google Scholar]
- Lemaitre RN, Yu C, Hoofnagle A, Hari N, Jensen PN, Fretts AM, Umans JG, Howard BV, Sitlani CM, Siscovick DS et al (2018) Circulating sphingolipids, insulin, HOMA‐IR, and HOMA‐B: the Strong Heart Family Study. Diabetes 67: 1663–1672 [DOI] [PMC free article] [PubMed] [Google Scholar]
- Levy M, Futerman AH (2010) Mammalian ceramide synthases. IUBMB Life 62: 347–356 [DOI] [PMC free article] [PubMed] [Google Scholar]
- Li S, Xie T, Liu P, Wang L, Gong X (2021) Structural insights into the assembly and substrate selectivity of human SPT‐ORMDL3 complex. Nat Struct Mol Biol 28: 249–257 [DOI] [PubMed] [Google Scholar]
- Liu P, Xie T, Wu X, Han G, Gupta SD, Zhang Z, Yue J, Dong F, Gable K, Niranjanakumari S et al (2023) Mechanism of sphingolipid homeostasis revealed by structural analysis of Arabidopsis SPT‐ORM1 complex. Sci Adv 9: eadg0728 [DOI] [PMC free article] [PubMed] [Google Scholar]
- Mantovani A, Bonapace S, Lunardi G, Salgarello M, Dugo C, Gori S, Barbieri E, Verlato G, Laaksonen R, Byrne CD et al (2018) Association of plasma ceramides with myocardial perfusion in patients with coronary artery disease undergoing stress myocardial perfusion scintigraphy. Arterioscler Thromb Vasc Biol 38: 2854–2861 [DOI] [PubMed] [Google Scholar]
- Mantovani A, Bonapace S, Lunardi G, Canali G, Dugo C, Vinco G, Calabria S, Barbieri E, Laaksonen R, Bonnet F et al (2020) Associations between specific plasma ceramides and severity of coronary‐artery stenosis assessed by coronary angiography. Diabetes Metab 46: 150–157 [DOI] [PubMed] [Google Scholar]
- Mizutani Y, Kihara A, Igarashi Y (2005) Mammalian Lass6 and its related family members regulate synthesis of specific ceramides. Biochem J 390: 263–271 [DOI] [PMC free article] [PubMed] [Google Scholar]
- Mizutani Y, Kihara A, Igarashi Y (2006) LASS3 (longevity assurance homologue 3) is a mainly testis‐specific (dihydro)ceramide synthase with relatively broad substrate specificity. Biochem J 398: 531–538 [DOI] [PMC free article] [PubMed] [Google Scholar]
- Muir A, Ramachandran S, Roelants FM, Timmons G, Thorner J (2014) TORC2‐dependent protein kinase Ypk1 phosphorylates ceramide synthase to stimulate synthesis of complex sphingolipids. Elife 3: e03779 [DOI] [PMC free article] [PubMed] [Google Scholar]
- Mullen TD, Hannun YA, Obeid LM (2012) Ceramide synthases at the centre of sphingolipid metabolism and biology. Biochem J 441: 789–802 [DOI] [PMC free article] [PubMed] [Google Scholar]
- Park JW, Park WJ, Futerman AH (2014) Ceramide synthases as potential targets for therapeutic intervention in human diseases. Biochim Biophys Acta 1841: 671–681 [DOI] [PubMed] [Google Scholar]
- Pettersen EF, Goddard TD, Huang CC, Couch GS, Greenblatt DM, Meng EC, Ferrin TE (2004) UCSF Chimera–a visualization system for exploratory research and analysis. J Comput Chem 25: 1605–1612 [DOI] [PubMed] [Google Scholar]
- Pewzner‐Jung Y, Ben‐Dor S, Futerman AH (2006) When do Lasses (longevity assurance genes) become CerS (ceramide synthases)?: insights into the regulation of ceramide synthesis. J Biol Chem 281: 25001–25005 [DOI] [PubMed] [Google Scholar]
- Poss AM, Holland WL, Summers SA (2020a) Risky lipids: refining the ceramide score that measures cardiovascular health. Eur Heart J 41: 381–382 [DOI] [PubMed] [Google Scholar]
- Poss AM, Maschek JA, Cox JE, Hauner BJ, Hopkins PN, Hunt SC, Holland WL, Summers SA, Playdon MC (2020b) Machine learning reveals serum sphingolipids as cholesterol‐independent biomarkers of coronary artery disease. J Clin Invest 130: 1363–1376 [DOI] [PMC free article] [PubMed] [Google Scholar]
- Punjani A, Rubinstein JL, Fleet DJ, Brubaker MA (2017) cryoSPARC: algorithms for rapid unsupervised cryo‐EM structure determination. Nat Methods 14: 290–296 [DOI] [PubMed] [Google Scholar]
- Raichur S (2020) Ceramide synthases are attractive drug targets for treating metabolic diseases. Front Endocrinol 11: 483 [DOI] [PMC free article] [PubMed] [Google Scholar]
- Riebeling C, Allegood JC, Wang E, Merrill AH Jr, Futerman AH (2003) Two mammalian longevity assurance gene (LAG1) family members, trh1 and trh4, regulate dihydroceramide synthesis using different fatty acyl‐CoA donors. J Biol Chem 278: 43452–43459 [DOI] [PubMed] [Google Scholar]
- Rosenthal PB, Henderson R (2003) Optimal determination of particle orientation, absolute hand, and contrast loss in single‐particle electron cryomicroscopy. J Mol Biol 333: 721–745 [DOI] [PubMed] [Google Scholar]
- Sassa T, Hirayama T, Kihara A (2016) Enzyme activities of the ceramide synthases CERS2‐6 are regulated by phosphorylation in the C‐terminal region. J Biol Chem 291: 7477–7487 [DOI] [PMC free article] [PubMed] [Google Scholar]
- Schorling S, Vallée B, Barz WP, Riezman H, Oesterhelt D (2001) Lag1p and Lac1p are essential for the Acyl‐CoA‐dependent ceramide synthase reaction in Saccharomyces cerevisae . Mol Biol Cell 12: 3417–3427 [DOI] [PMC free article] [PubMed] [Google Scholar]
- Spassieva S, Seo JG, Jiang JC, Bielawski J, Alvarez‐Vasquez F, Jazwinski SM, Hannun YA, Obeid LM (2006) Necessary role for the Lag1p motif in (dihydro)ceramide synthase activity. J Biol Chem 281: 33931–33938 [DOI] [PubMed] [Google Scholar]
- Summers SA (2018) Could ceramides become the new cholesterol? Cell Metab 27: 276–280 [DOI] [PubMed] [Google Scholar]
- Summers SA, Chaurasia B, Holland WL (2019) Metabolic messengers: ceramides. Nat Metab 1: 1051–1058 [DOI] [PMC free article] [PubMed] [Google Scholar]
- Tidhar R, Ben‐Dor S, Wang E, Kelly S, Merrill AH Jr, Futerman AH (2012) Acyl chain specificity of ceramide synthases is determined within a region of 150 residues in the Tram‐Lag‐CLN8 (TLC) domain. J Biol Chem 287: 3197–3206 [DOI] [PMC free article] [PubMed] [Google Scholar]
- Tidhar R, Zelnik ID, Volpert G, Ben‐Dor S, Kelly S, Merrill AH Jr, Futerman AH (2018) Eleven residues determine the acyl chain specificity of ceramide synthases. J Biol Chem 293: 9912–9921 [DOI] [PMC free article] [PubMed] [Google Scholar]
- Turpin‐Nolan SM, Brüning JC (2020) The role of ceramides in metabolic disorders: when size and localization matters. Nat Rev Endocrinol 16: 224–233 [DOI] [PubMed] [Google Scholar]
- Vallée B, Riezman H (2005) Lip1p: a novel subunit of acyl‐CoA ceramide synthase. EMBO J 24: 730–741 [DOI] [PMC free article] [PubMed] [Google Scholar]
- Venkataraman K, Riebeling C, Bodennec J, Riezman H, Allegood JC, Sullards MC, Merrill AH Jr, Futerman AH (2002) Upstream of growth and differentiation factor 1 (uog1), a mammalian homolog of the yeast longevity assurance gene 1 (LAG1), regulates N‐stearoyl‐sphinganine (C18‐(dihydro)ceramide) synthesis in a fumonisin B1‐independent manner in mammalian cells. J Biol Chem 277: 35642–35649 [DOI] [PubMed] [Google Scholar]
- Wang Y, Niu Y, Zhang Z, Gable K, Gupta SD, Somashekarappa N, Han G, Zhao H, Myasnikov AG, Kalathur RC et al (2021) Structural insights into the regulation of human serine palmitoyltransferase complexes. Nat Struct Mol Biol 28: 240–248 [DOI] [PMC free article] [PubMed] [Google Scholar]
- Williams CJ, Headd JJ, Moriarty NW, Prisant MG, Videau LL, Deis LN, Verma V, Keedy DA, Hintze BJ, Chen VB et al (2018) MolProbity: more and better reference data for improved all‐atom structure validation. Protein Sci 27: 293–315 [DOI] [PMC free article] [PubMed] [Google Scholar]
- Winter E, Ponting CP (2002) TRAM, LAG1 and CLN8: members of a novel family of lipid‐sensing domains? Trends Biochem Sci 27: 381–383 [DOI] [PubMed] [Google Scholar]
- Xie T, Liu P, Wu X, Dong F, Zhang Z, Yue J, Mahawar U, Farooq F, Vohra H, Fang Q et al (2023) Ceramide sensing by human SPT‐ORMDL complex for establishing sphingolipid homeostasis. Nat Commun 14: 3475 [DOI] [PMC free article] [PubMed] [Google Scholar]
- Yariv B, Yariv E, Kessel A, Masrati G, Chorin AB, Martz E, Mayrose I, Pupko T, Ben‐Tal N (2023) Using evolutionary data to make sense of macromolecules with a “face‐lifted” ConSurf. Protein Sci 32: e4582 [DOI] [PMC free article] [PubMed] [Google Scholar]
- Zhang K (2016) Gctf: real‐time CTF determination and correction. J Struct Biol 193: 1–12 [DOI] [PMC free article] [PubMed] [Google Scholar]
- Zheng SQ, Palovcak E, Armache JP, Verba KA, Cheng Y, Agard DA (2017) MotionCor2: anisotropic correction of beam‐induced motion for improved cryo‐electron microscopy. Nat Methods 14: 331–332 [DOI] [PMC free article] [PubMed] [Google Scholar]
- Zivanov J, Nakane T, Forsberg BO, Kimanius D, Hagen WJ, Lindahl E, Scheres SH (2018) New tools for automated high‐resolution cryo‐EM structure determination in RELION‐3. Elife 7: e42166 [DOI] [PMC free article] [PubMed] [Google Scholar]
Associated Data
This section collects any data citations, data availability statements, or supplementary materials included in this article.
Supplementary Materials
Appendix
Expanded View Figures PDF
Review Process File
PDF+
Source Data for Figure 1
Source Data for Figure 2
Source Data for Figure 3
Source Data for Figure 4
Source Data for Figure 5
Data Availability Statement
The EM density maps generated in this study have been deposited in the EMDB under accession codes EMD‐35862 (https://www.ebi.ac.uk/emdb/EMD‐35862) for C26‐CoA‐bound Lac1‐Lip1 complex and EMD‐35863 (https://www.ebi.ac.uk/emdb/EMD‐35863) for Lac1‐Lip1S74F complex. The atomic coordinates have been deposited in the PDB under the accession codes 8IZD (https://www.rcsb.org/structure/8IZD) for C26‐CoA‐bound Lac1‐Lip1 complex and 8IZF (https://www.rcsb.org/structure/8IZF) for Lac1‐Lip1S74F complex. Source data are provided with the manuscript.


