Abstract.
Purpose
We describe a method to identify repeatable liver computed tomography (CT) radiomic features, suitable for detection of steatosis, in nonhuman primates. Criteria used for feature selection exclude nonrepeatable features and may be useful to improve the performance and robustness of radiomics-based predictive models.
Approach
Six crab-eating macaques were equally assigned to two experimental groups, fed regular chow or an atherogenic diet. High-resolution CT images were acquired over several days for each macaque. First-order and second-order radiomic features were extracted from six regions in the liver parenchyma, either with or without liver-to-spleen intensity normalization from images reconstructed using either a standard (B-filter) or a bone-enhanced (D-filter) kernel. Intrasubject repeatability of each feature was assessed using a paired -test for all scans and the minimum -value was identified for each macaque. Repeatable features were defined as having a minimum -value among all macaques above the significance level after Bonferroni’s correction. Features showing a significant difference with respect to diet group were identified using a two-sample -test.
Results
A list of repeatable features was generated for each type of image. The largest number of repeatable features was achieved from spleen-normalized D-filtered images, which also produced the largest number of second-order radiomic features that were repeatable and different between diet groups.
Conclusions
Repeatability depends on reconstruction kernel and normalization. Features were quantified and ranked based on their repeatability. Features to be excluded for more robust models were identified. Features that were repeatable but different between diet groups were also identified.
Keywords: computed tomography, steatosis, image reconstruction, radiomics, nonhuman primates, repeatability
1. Introduction
Radiomics extracts large amounts of features from medical images and converts them into minable numerical data. Radiomics analyses are gaining increasing interest as quantitative readouts for unbiased image-classification tasks, toward the improved discrimination of disease phenotypes and evaluation of novel therapeutic regimens. For the liver, radiomics has been used to characterize a variety of conditions, from hepatic malignancies to diffuse liver diseases encompassing a range of pathological manifestations.1–5 Central tendency first-order radiomic features derived from unenhanced computed tomography (CT) images, such as region mean or median, have been used to discriminate moderate from severe liver steatosis,6–11 defined as intrahepatic accumulation of fats equivalent to at least 5% of the whole organ weight or within hepatocytes.12 Second-order features were found to be useful in characterizing milder liver disease, an important step to allow for earlier intervention.13 However, there are still several challenges to the widespread application of radiomics for characterizing liver (or other organ) diseases in the clinical setting and preclinical laboratory. First and foremost, the repeatability and reproducibility of radiomic features need to be rigorously assessed to identify potential sources of uncertainty, and therefore misclassification, in radiomics-based analyses.14
Repeatability is defined as feature stability when imaging the same subject multiple times on the same imaging scanner using the same image acquisition method and downstream image reconstruction and analysis workflows. Repeatability is usually considered to be dependent on day-to-day experimental changes or fluctuating individual physiological variability over time. In contrast, reproducibility is a term applied to describe feature stability when images are acquired using different equipment, operator, or image acquisition protocols; reconstructed with different kernels;14 or analyzed with different software.15
Although high feature stability is desirable for the application of radiomics into clinical decision-making,16 it is challenging to acquire multiple replicate measurements to evaluate feature repeatability and reproducibility in humans,17 especially when trying to acquire comparable images from healthy and diseased individuals.
In this work, we examined the repeatability of first-order and second-order liver radiomic features derived from sequential CT imaging in six crab-eating macaques. Three were fed regular nonatherogenic chow, whereas three were fed an atherogenic diet for months. An atherogenic diet, enriched in fats, is typically used to promote the development of atherosclerotic vascular disease,18 and, in our study, also resulted in liver steatosis (data not shown). Repeatable radiomic features were identified in the entire dataset and also separately in the two groups (nonatherogenic control and atherogenic). This analysis provided information on CT radiomic feature stability in general and also when the liver is affected by a specific pathological process, as exemplified in this diet-induced model of liver steatosis. Preliminary results have been previously published in a SPIE Medical Imaging conference paper.19
2. Methodology
2.1. Animal Preparation
Six crab-eating macaques (Macaca fascicularis Raffles, 1821) of either Cambodian or Mauritian origin were retrospectively selected from a group of 21 macaques (reference cohort) used in studies that investigated viral infection severity under different dietary regimens. Inclusion criteria for the six macaques included in this analysis were: (1) not having been exposed to any virus and (2) not having had extrahepatic (specifically lung) abnormalities on any CT scans. Macaques of both sexes were divided into two experimental groups (control group: , fed regular nonatherogenic chow, age years, weight 3.39 to 3.68 kg; atherogenic group: , fed an atherogenic diet, age years, weight 5.40 to 5.85 kg).20,21 Macaques in the atherogenic group were on the diet for a minimum of 21 months before the first scan. Typically, it takes a minimum of 18 months to develop significant atherosclerosis in this model.22 At intake, all macaques were in general good health based on physical examination and review of laboratory screenings by a board-certified veterinarian. Macaques in the control group were imaged nine times within 2 months. Macaques from the atherogenic group were imaged six times within 3 weeks (Fig. 1). Therefore, a total of 45 imaging sessions were performed. All imaging sessions were performed with the same CT acquisition protocol and on the same imaging scanner. Macaques were anesthetized in accordance with standard procedures prior to all manipulations, including medical imaging.23
Fig. 1.
Time interval of each scan with respect to the first imaging session of each macaque.
All experiments were performed in the maximum [biosafety level 4 (BSL-4)] containment laboratory at the Integrated Research Facility at Fort Detrick (IRF-Frederick), a facility accredited by the Association for Assessment and Accreditation of Laboratory Animal Care International. The IRF-Frederick is part of the National Institutes of Health, the National Institute of Allergy and Infectious Diseases (NIAID), Division of Clinical Research (DCR). Experimental procedures were approved by the NIAID DCR Animal Care and Use Committee and conducted in compliance with the Animal Welfare Act regulations, Public Health Service policy, and the Guide for the Care and Use of Laboratory Animals (eighth edition).
2.2. CT Image Acquisition
Prior to each imaging session, macaques were administered glycopyrrolate and anesthetized with ketamine via the intramuscular route. Anesthesia was maintained using a constant rate intravenous infusion of propofol at . Macaques were placed on the scanner bed in a supine head-out/feet-in position and connected to a ventilator to facilitate 15- to 20-s breath holds during acquisition. The pressure for the breath-hold was maintained at 150 mm . Vital signs were monitored throughout the procedure.23 High-resolution chest CT scans were performed using the 16-slice CT component of a Gemini TF 16 PET/CT (Philips Healthcare, Cleveland, Ohio, United States). Images were acquired in helical scan mode with the following parameter settings: ultrahigh resolution, 140 kVp, , 1-mm slice thickness, 0.5-mm increment, 0.688-mm pitch, collimation, and 0.75-s rotation. CT images were reconstructed using a matrix size for a 180-mm transverse field-of-view, resulting in a pixel size of . Two types of CT images were produced: one with a standard reconstruction kernel for smoother images and the other with a bone-enhanced reconstruction kernel for sharper images.24 No contrast agent was administered.
2.3. Radiomic Feature Extraction
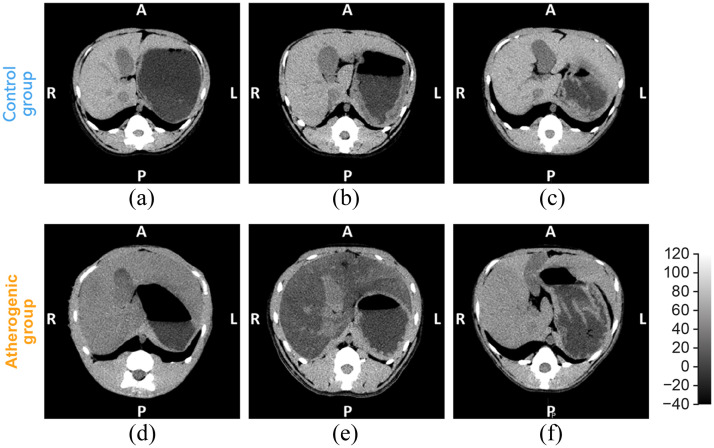
This study used 45 chest CT scans from six macaques (control group: , fed regular nonatherogenic chow; atherogenic group: , fed an atherogenic diet) (Fig. 2). Radiomic features were extracted from six spherical regions of interest (ROIs) with a diameter of 10 mm (Fig. 3). Regions were labeled as right-superior, right-mid-center, right-mid-lateral, right-inferior, left-lateral, and left-mid and manually defined in the parenchymal regions, where fat deposition occurs (Fig. 3). ROI locations were kept consistent among different macaques and longitudinally within the same animal. For each macaque, liver ROIs were defined by a single rater (with years of experience in preclinical CT image analysis, including ROI generation) on the first imaging session and then registered to following sessions using a rigid registration pipeline in MIM Software version 7.1.6 (MIM Software, Cleveland, Ohio, United States). Minor manual adjustment of ROI locations was performed when, after careful inspection by the experienced rater, alignment was deemed suboptimal. Given the known limited accuracy of intersubject rigid liver registration, for each animal, ROI locations on the first imaging session were evaluated and adjusted for consistency across subjects on a case-by-case basis. ROIs from images reconstructed using both and reconstruction kernels were used for analysis. Since normalization of liver-to-spleen HU is often used as a criterion to diagnose liver diseases, such as steatosis,25 radiomic features were also computed from -kernel and -kernel reconstructed images after liver HU normalization by mean spleen attenuation, leading to four types of images being analyzed [B-filter (ORIG), B-filter (NORM), D-filter (ORIG), and D-filter (NORM)]. Therefore, a total of 180 images (1080 ROIs) were included in this study.
Fig. 2.
Representative single time point axial unenhanced CT images for (a)–(f) macaques 1 to 6 are shown in the liver window (width, 160 HU; level, 40 HU). A, anterior; P, posterior; R, right; L, left; CT, computed tomography; and HU, Hounsfield units.
Fig. 3.
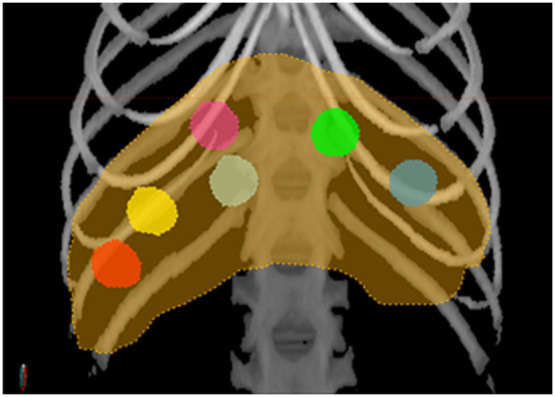
Placement of ROIs in the liver (orange contour) is illustrated on the maximum intensity projection of the CT image shown in the bone window (W/L = 1300/500 HU). Six spherical ROIs with a diameter of 10 mm were manually placed within the liver parenchyma (with four in the right lobes (magenta: right-superior, light tan: right-mid-center, yellow: right-mid-lateral, red: right-inferior) and two in the left lobes (green: left-mid, blue-gray: left-lateral). ROIs, regions of interest; CT, computed tomography; and HU, Hounsfield units.
To calculate spleen mean attenuation, this organ was segmented from each CT image using an automated method relying on convolutional neural networks, adapted from an algorithm that we have previously described for liver segmentation.26 Briefly, this method uses a feature pyramids network (FPN) to produce a multiscale feature representation in which all levels are semantically strong, including the high-resolution levels. The FPN was trained using input patches of size , which were randomly extracted from both organ and nonorgan areas with equal numbers. The output of the FPN was a probability map that was resampled to the original image size and smoothed using a Gaussian filter and then thresholded to form a binary mask, from which mean spleen attenuation was computed to normalize each image. After this procedure, liver-to-spleen attenuation normalization was computed using a custom-built workflow in MIM Software version 7.1.6 (MIM Software, Cleveland, Ohio, United States) that divides all intensities in the CT image by the mean attenuation computed from the segmented spleen.
Radiomic feature extraction was performed using PyRadiomics 2.2.0 (Ref. 27) and MIM Software version 7.1.6 (MIM Software, Cleveland, Ohio, United States). For each image, 93 features were extracted, comprising 18 first-order and 75 second-order features (Table 1). The second-order features were derived from five different matrices as follows:
Table 1.
List of the 18 first-order and 75 second-order features extracted from each ROI.
| First-order | GLCM (second-order) | GLDM (second-order) |
| 10 Percentile | Autocorrelation | Dependence entropy |
| 90 Percentile | Cluster prominence | Dependence nonuniformity |
| Energy | Cluster shade | Dependence nonuniformity normalized |
| Entropy | Cluster tendency | Dependence variance |
| Interquartile range | Contrast | Gray-level nonuniformity |
| Kurtosis | Correlation | Gray-level variance |
| Maximum | Difference average | High gray-level emphasis |
| Mean absolute deviation | Difference entropy | Large dependence emphasis |
| Mean | Difference variance | Large dependence high gray-level emphasis |
| Median | Inverse difference | Large dependence low gray-level emphasis |
| Minimum | Inverse difference moment | Low gray-level emphasis |
| Range | Inverse difference moment normalized | Small dependence emphasis |
| Robust mean absolute deviation | Inverse difference normalized | Small dependence high gray-level emphasis |
| Root square mean | Informational measure of correlation 1 | Small dependence low gray-level emphasis |
| Skewness | Informational measure of correlation 2 | |
| Total energy | Inverse variance | GLRLM (second-order) |
| Uniformity | Joint average | Gray-level nonuniformity |
| Variance | Joint energy | Gray-level nonuniformity normalized |
| Joint entropy | Gray-level variance | |
| GLSZM (second-order) | Maximal correlation coefficient | High gray-level run emphasis |
| Gray-level nonuniformity | Maximum probability | Long run emphasis |
| Gray-level nonuniformity normalized | Sum average | Long run, high gray-level emphasis |
| Gray-level variance | Sum entropy | Long run, low gray-level emphasis |
| High gray-level zone emphasis | Sum squares | Low gray-level run emphasis |
| Large area emphasis | Run entropy | |
| Large area high gray-level emphasis | NGTDM (second-order) | Run length nonuniformity |
| Large area low gray-level emphasis | Busyness | Run length nonuniformity normalized |
| Low gray-level zone emphasis | Coarseness | Run percentage |
| Size zone nonuniformity | Complexity | Run variance |
| Size zone nonuniformity normalized | Contrast | Short run emphasis |
| Small area emphasis | Strength | Short run, high gray-level emphasis |
| Small area high gray-level emphasis | Short run, low gray-level emphasis | |
| Small area low gray-level emphasis | ||
| Zone entropy | ||
| Zone percentage | ||
| Zone variance |
GLCM, gray-level co-occurrence matrix; GLDM, gray-level dependence matrix; GLRMLM, gray-level run-length matrix; GLSZM, gray-level size zone matrix (GLSZM); NGTDM, neighboring gray-tone difference matrix.
-
•
24 features from the gray-level co-occurrence matrix (GLCM);
-
•
14 features from the gray-level dependence matrix (GLDM);
-
•
16 features from the gray-level run length matrix (GLRLM);
-
•
16 features from the gray-level size zone matrix (GLSZM);
-
•
5 features from the neighboring gray tone difference matrix (NGTDM).
For radiomic feature extraction, images were discretized using a 2-HU bin width, resulting in to 40 bins for B-filter (ORIG) images, depending on each case. For D-filter (ORIG) images, the number of bins approximately doubled for the same bin width given their higher intensity range caused by the higher image sharpness. For the normalized images, the bin width was adjusted for normalized intensities, keeping the same bin width of 0.02 for all normalized images. The radius of the spherical ROIs was 10 mm; therefore, their volume was roughly , which is . Considering the image resolution, for a uniform distribution of intensities, this would result in (B-filter) to 150 (D-filter) voxels per bin in the original images and (B-filter) to 300 (D-filter) voxels per bin in the normalized images.
To compute second-order features, for each voxel, the two closest neighbors were considered for each of the 13 possible three-dimensional directions. Each direction equally contributed to the texture matrices.
2.4. Statistical Analysis
2.4.1. Repeatability of radiomic features
The first step was to investigate intrasubject feature variability regardless of the intersubject (within-group) variations and intergroup variations. For each macaque, first-order and second-order radiomic features extracted from each ROI were compared to the same features extracted from the same ROI on all other scans of the same macaque using multiple paired -tests across different time points. Each time point was not characterized by a single value but by a set of six values that are not independent and reflect spatial variations in addition to the temporal variations; for example, due to changes in physiological conditions or minor errors in image registration across time points. For each feature, a total of 153 -tests were performed using three significance levels to investigate the dependence of the results on the sensitivity of the tests. More stringent -values are expected to detect minor differences between scans to deem a feature nonrepeatable. 28 Significance levels of 0.05, 0.01, and 0.005 resulted, after Bonferroni correction, with a of , , and , respectively [ of 11.57, 13.91, and 14.89, respectively, where ]. The analysis was performed on images reconstructed using both a standard () kernel and a bone-enhanced () kernel, with and without liver-to-spleen normalization.
Features for which -values were all greater or equal to the established corrected significance levels for all comparisons were defined as repeatable. The percentage of repeatable features within each feature class was computed for each type of image.
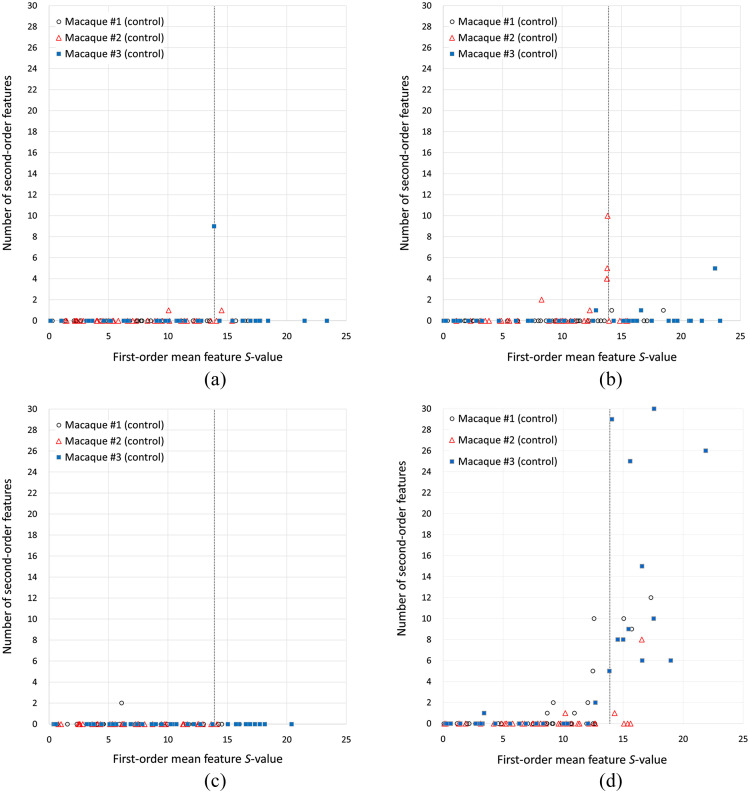
To investigate how liver attenuation changes may affect the repeatability of second-order features, we computed the number of nonrepeatable second-order features as a function of the -value of the mean (first-order feature) when scans from two different days were compared for the same macaque. The analysis was performed for a significance level of 0.01 in the paired -tests.
2.4.2. Radiomic feature difference between diet groups
The second step was to evaluate intergroup (nonatherogenic control versus atherogenic) differences of radiomic features. Radiomic features were compared between the two groups using a two-sample -test with a significance level of 0.01. Given that nonimaging information (such as, histopathology or blood biomarkers) was not included in the analysis, the aim of this section was to identify features that were sensitive to the diet as a proxy for liver steatosis.
Features that were simultaneously sensitive to the diet and repeatable (as defined in the previous section) were identified.
2.4.3. Heterogeneity of radiomic feature values
We investigated the heterogeneity of radiomic feature values across ROIs to identify features with high spatial variation across the liver parenchyma. We performed this analysis in both the control and atherogenic groups independently. Large spatial variations of radiomic features across ROIs in the control group may indicate that those features are sensitive to the intrinsic normal liver texture. To detect heterogeneously distributed radiomic features, we computed the coefficient of variation (CV) of each feature at every scan and then calculated the average coefficient in both the control and atherogenic groups, identifying features with variations and .
3. Results
3.1. Repeatability of Radiomic Features
3.1.1. Repeatability of second-order radiomic features
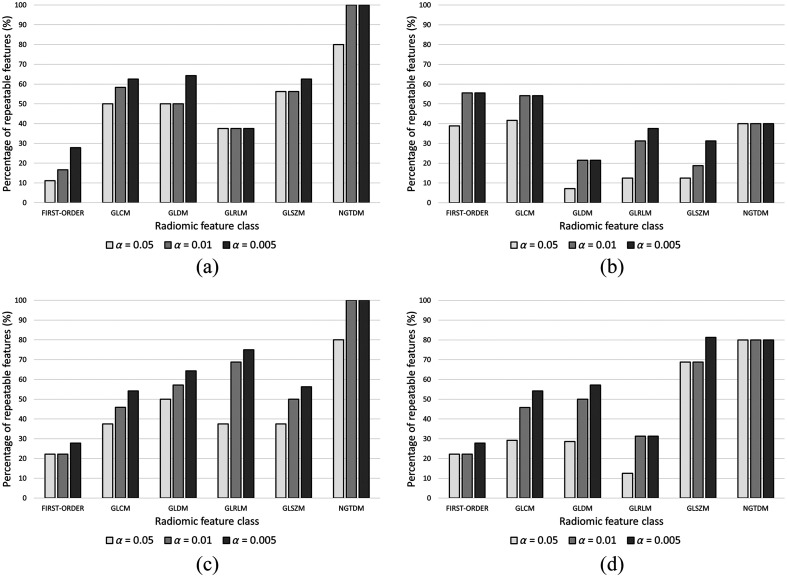
We found that features extracted from second-order D-filter images showed greater repeatability than those of the B-filter, with features from normalized images providing greater repeatability than original images. The largest number of repeatable second-order radiomic features out of 75 features was achieved from normalized images: 41 (54.7%) for B-filter and 43 (57.3%) for D-filter reconstructions, while, without normalization, 26 features (34.7%) were repeatable for B-filter and 38 (50.7%) for D-filter reconstructions, for a significance level of 0.01 (Table 2). The repeatability of each radiomic feature class with significance levels of 0.05, 0.01, and 0.005 is shown in Fig. 4. The percentage of repeatable radiomic features differed among radiomic feature classes and tended to increase with more stringent -values. However, each type of image exhibited different patterns. For D-filter (NORM) images, the highest repeatability (above 50%) was achieved by NGTDM, GLRLM, and GLDM, whereas the lowest (below 50%) was achieved by GLSZM and GLCM, for a significance level of 0.01.
Table 2.
Counts of repeatable second-order radiomic features for each type of image.
| Significance level () | B-filter (NORM) | B-filter (ORIG) | D-filter (NORM) | D-filter (ORIG) |
|---|---|---|---|---|
| 0.05 | 38 (50.7%) | 17 (22.7%) | 32 (42.7%) | 28 (37.3%) |
| 0.01 | 41 (54.7%) | 26 (34.7%) | 43 (57.3%) | 38 (50.7%) |
| 0.005 | 45 (60.0%) | 29 (38.7%) | 48 (64.0%) | 43 (57.3%) |
NORM: CT image for which the attenuation was normalized to the mean spleen attenuation. ORIG: original CT image.
Fig. 4.
Percentage of repeatable radiomic features for significance levels of 0.05, 0.01, and 0.005 for each of the images: (a) B-filter (NORM), (b) B-filter (ORIG), (c) D-filter (NORM), and (d) D-filter (ORIG). GLCM, gray-level co-occurrence matrix; GLDM, gray-level dependence matrix; GLRMLM, gray-level run length matrix; GLSZM, gray-level size zone matrix; and NGTDM, neighboring gray tone difference matrix.
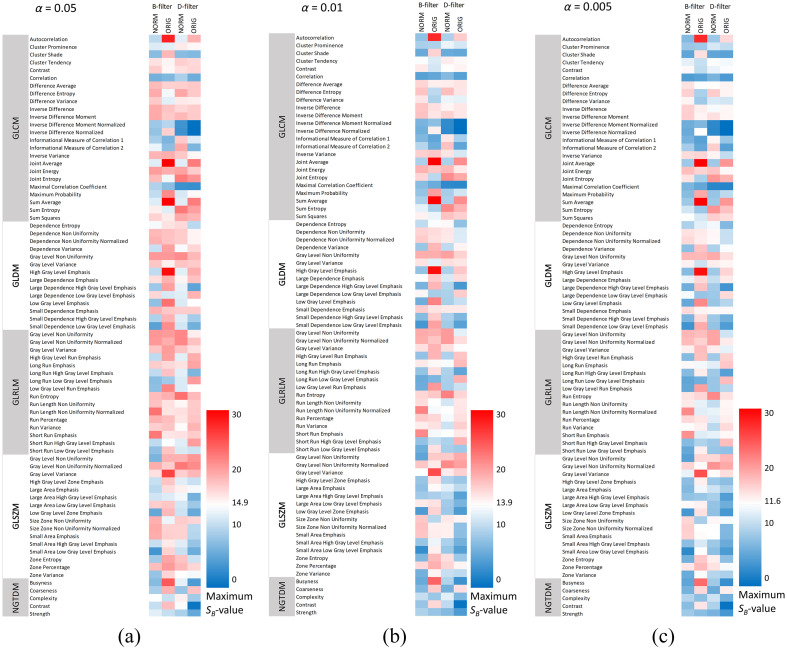
The maximum -value for each second-order radiomic feature and for each image is shown in Fig. 5 for different significance levels. This figure provides detailed information about which features met the repeatability criterion: maximum , 13.9, and 11.6 for significance levels of 0.05, 0.01, and 0.005, respectively.
Fig. 5.
Maximum intrasubject SB-value compared between B-filter (NORM), B-filter (ORIG), D-filter (NORM), and D-filter (ORIG) images and significance levels of (a) 0.05, (b) 0.01, and (c) 0.005. In blue, SB-values (), 13.9 (), and 11.6 () are associated with repeatable features. GLCM, gray-level co-occurrence matrix; GLDM, gray-level dependence matrix; GLRMLM, gray-level run length matrix; GLSZM, gray-level size zone matrix; and NGTDM, neighboring gray tone difference matrix.
3.1.2. Repeatability of first-order radiomic features
Most first-order features were not repeatable according to the method used in this work, including central tendency features with multiple tests for which the null hypothesis was rejected. The differences were driven by the change in the mean attenuation among scan days. The most significant difference was found between two different days for macaque #3 (), with mean attenuations of and in the B-filter (ORIG) for two consecutive scans a few days apart. In this case, the low standard deviations among ROIs (2.3 and 1.2 HU) compared to the relatively high difference between mean attenuations at different days (10.6 HU) indicates that the placement of the ROIs does not affect the estimation of the liver attenuation or an intraparenchymal attenuation heterogeneity. Instead, it may be caused by physiological variations between two imaging days, e.g., body weight fluctuation or hydration status, resulting in a homogeneous change in liver attenuation. Particularly, this macaque had exhibited a weight loss of 5% on the day when the higher attenuation was observed. All outliers corresponded to higher attenuations; therefore, the variation in mean attenuation should not be considered a confounding factor because fat accumulation in liver tissue causes a reduction in the liver attenuation observed in CT images.
3.1.3. Impact of first-order mean feature repeatability on second-order features
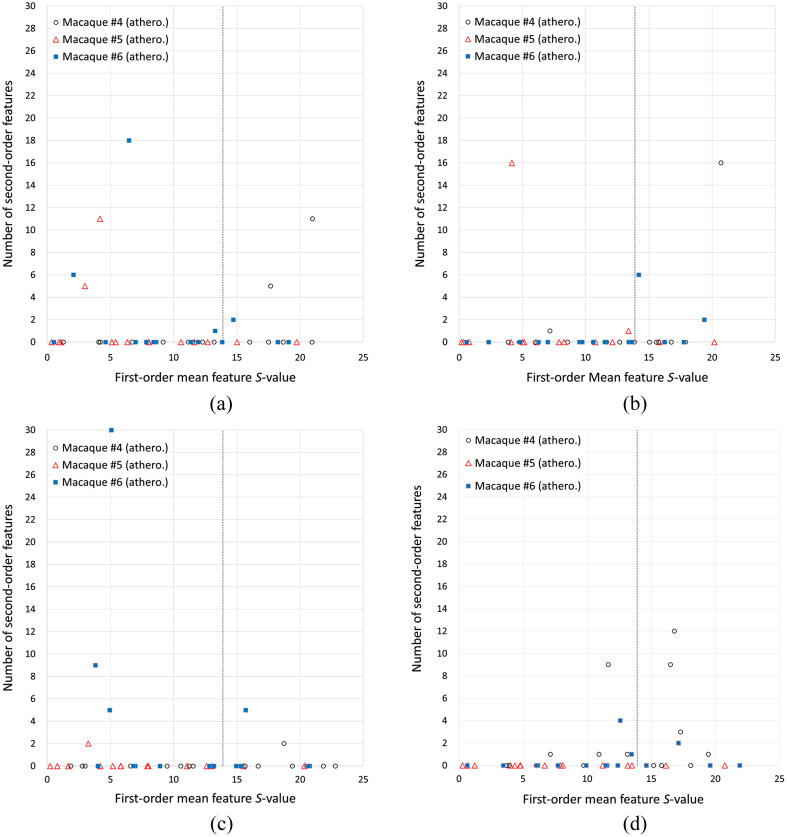
The number of nonrepeatable second-order features as a function of the -value of the mean (first-order feature) when scans from two different days were compared for the same macaque is shown in Figs. 6 and 7, for the control group and the atherogenic group, respectively. Tests with () correspond to group I (null hypothesis is accepted). Group II corresponds to (), in which the null hypothesis was rejected, which means that the first-order mean feature has significantly different values at two different days when it is expected to be the same. Each marker in the figures represents one of the 153 comparisons between two scans on different days, indicating how many of the 75 tests resulted in a rejection of the null hypothesis of the paired -test of a given feature for that particular comparison. There were 108 comparisons in the control group and 45 in the atherogenic group, which resulted in 8100 and 3375 features tested in each group, respectively.
Fig. 6.
Number of nonreproducible second-order features as a function of the first-order mean feature -test -value for all the intrasubject -test in the control group: (a) D-filter (NORM), (b) D-filter (ORIG), (c) B-filter (NORM), and (d) B-filter (ORIG).
Fig. 7.
Number of nonreproducible second-order features as a function of the first-order mean feature -test -value for all the intrasubject -test in the atherogenic group: (a) D-filter (NORM); (b) D-filter (ORIG); (c) B-filter (NORM); and (d) B-filter (ORIG).
Only a limited number of tests of second-order features resulted in a rejection of the null hypothesis. The worst case is B-filter (ORIG) in group II, with 2.914% of the tests. In all cases except B-filter (ORIG), there were fewer tests for which the null hypothesis was rejected in group II compared with group I (Table 3). In the normalized images, the percentage of tests for which the null hypothesis was rejected was smaller in the control group (average 0.04%) compared to the original images (average 0.86%) (Table 3). In contrast, the original images’ percentages were 0.92 and 0.52 for the control and atherogenic groups, respectively. Overall, normalized images produced a small number of nonrepeatable second-order features [Figs. 6(a) and 6(c)]. On the other hand, B-filter (ORIG) produced the highest number of nonrepeatable second-order features [Fig. 6(d)]. Normalized images in the atherogenic group produced more nonrepeatable second-order features [Figs. 7(a) and 7(c)] than in their control group counterparts [Figs. 6(a) and 6(c)]. Particularly, the lowest percentage of tests that rejected the null hypothesis was achieved with D-filter (NORM) in group II, with a slight increase in group I (Table 3).
Table 3.
Counts of tests in group I and group II where the null hypothesis that compares feature distributions from two different days was rejected. Group I: null hypothesis of the mean first-order feature was accepted (). Group II: null hypothesis of the mean first-order feature was rejected ().
| Control group | Atherogenic group | |||||||
|---|---|---|---|---|---|---|---|---|
| B (NORM) | B (ORIG) | D (NORM) | D (ORIG) | B (NORM) | B (ORIG) | D (NORM) | D (ORIG) | |
| Group I | 2 (0.025%) | 30 (0.370%) | 10 (0.123%) | 27 (0.333%) | 46 (1.363%) | 17 (0.504%) | 41 (1.215%) | 17 (0.504%) |
| Group II | 0 (0.000%) | 236 (2.914%) | 1 (0.012%) | 8(0.099%) | 26(0.770%) | 27(0.800%) | 3 (0.089%) | 9(0.267%) |
. NORM: CT image for which the attenuation was normalized to the mean spleen attenuation. ORIG: original CT image.
3.2. Feature Sensitivity to Diet
All first-order features were significantly different between both diet groups in all four images, with the exception of:
-
•
D-filter (NORM): energy, kurtosis, skewness, and total energy;
-
•
D-filter (ORIG): kurtosis and skewness;
-
•
B-filter (NORM): energy, kurtosis, total energy;
-
•
B-filter (ORIG): entropy and kurtosis.
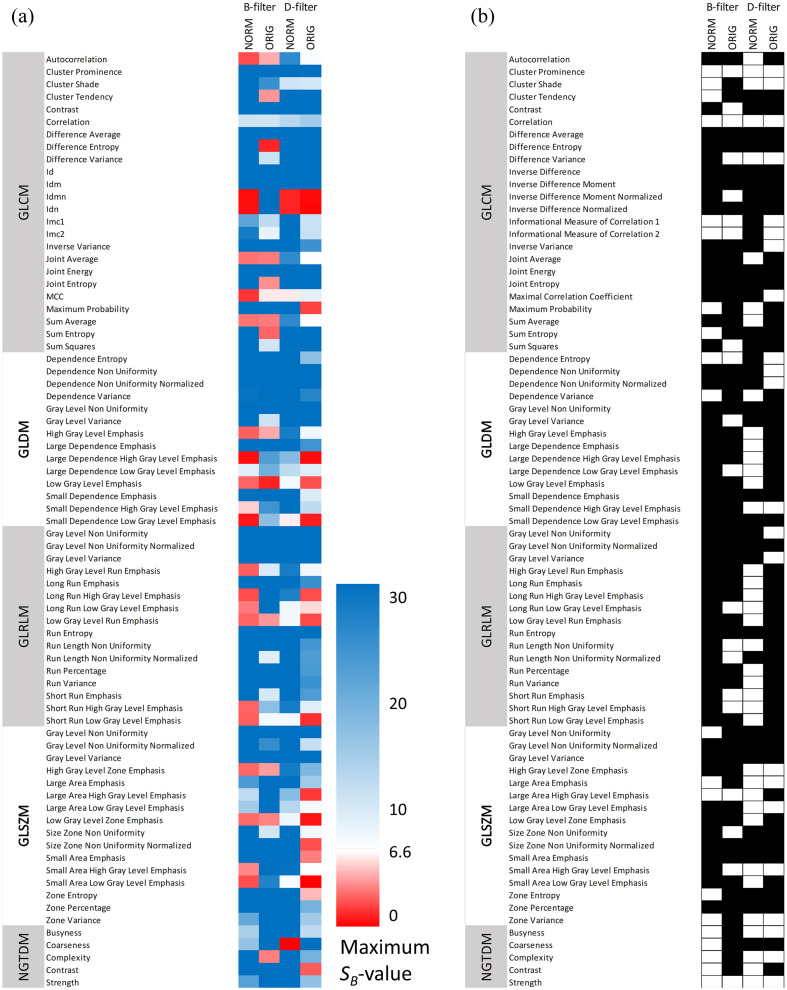
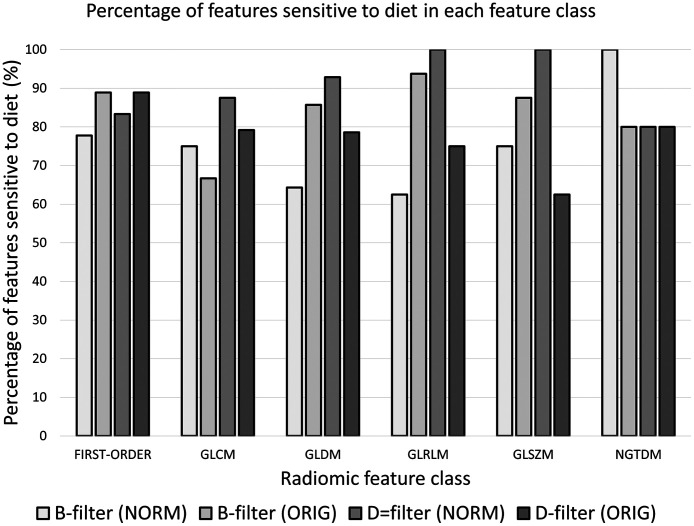
The intergroup -value for each second-order radiomic feature and each image is shown in Fig. 8(a). This figure provides detailed information about which features met the criterion to be significantly different between groups (minimum ). The number of second-order radiomic features sensitive to diets out of 75 second-order features for a threshold of -value = 6.65 () is shown in Table 4. D-filter (NORM) produced the largest number of features that were significantly different between groups. Therefore, 84 out of 93 (90.3%) first-order and second-order radiomic features were significantly different between groups in D-filter (NORM). The percentage of radiomic features sensitive to diet in each feature class for each type of images is shown in Fig. 9. The number of second-order radiomic features simultaneously sensitive to diets and nearly repeatable out of 75 second-order features is shown in Table 4 and Fig. 8(b). D-filter (NORM) produced the largest number of features that were simultaneously significantly different between diet groups and nearly repeatable. However, for a given image, the percentage of sensitive radiomic features was comparable among different radiomic feature classes (Fig. 9). When the 14 first-order features were included, 66 first-order and second-order features met both criteria, representing 71.0% of all 93 features. However, this result needs further evaluation because, in this analysis, diet is being used as a proxy for liver disease.
Fig. 8.
(a) Maximum intergroup -value of second-order radiomic features compared between B-filter (NORM), B-filter (ORIG), D-filter (NORM, and D-filter (ORIG) images. Dark blue represents -values equal or . -values (blue) are associated with features that are significantly different in both groups; (b) second-order features from B-filter (NORM), B-filter (ORIG), D-filter (NORM, and D-filter (ORIG) images that are simultaneously repeatable and significantly different between groups (white) and those that do not simultaneously meet both criteria (black). GLCM: gray-level co-occurrence matrix; GLDM: gray-level dependence matrix; GLRMLM, gray-level run length matrix; GLSZM, gray-level size zone matrix; and NGTDM, neighboring gray tone difference matrix.
Table 4.
Counts of second-order radiomic features sensitive to diet for each type of image.
| B-filter (NORM) | B-filter (ORIG) | D-filter (NORM) | D-filter (ORIG) | |
|---|---|---|---|---|
| Sensitive to diet | 54 (72.0%) | 61 (81.3%) | 70 (93.3%) | 56 (74.7%) |
| Sensitive to diet and repeatable | 29 (38.7%) | 24 (32.0%) | 52 (69.3%) | 40 (53.3%) |
NORM: CT image for which the attenuation was normalized to the mean spleen attenuation. ORIG: original CT image.
Fig. 9.
Percentage of radiomic features sensitive to diets in each feature class for each of the images: B-filter (NORM), B-filter (ORIG), D-filter (NORM), and D-filter (ORIG). GLCM, gray-level co-occurrence matrix; GLDM, gray-level dependence matrix; GLRMLM, gray-level run length matrix; GLSZM, gray-level size zone matrix; and NGTDM, neighboring gray tone difference matrix.
3.3. Radiomic Feature Spatial Heterogeneity
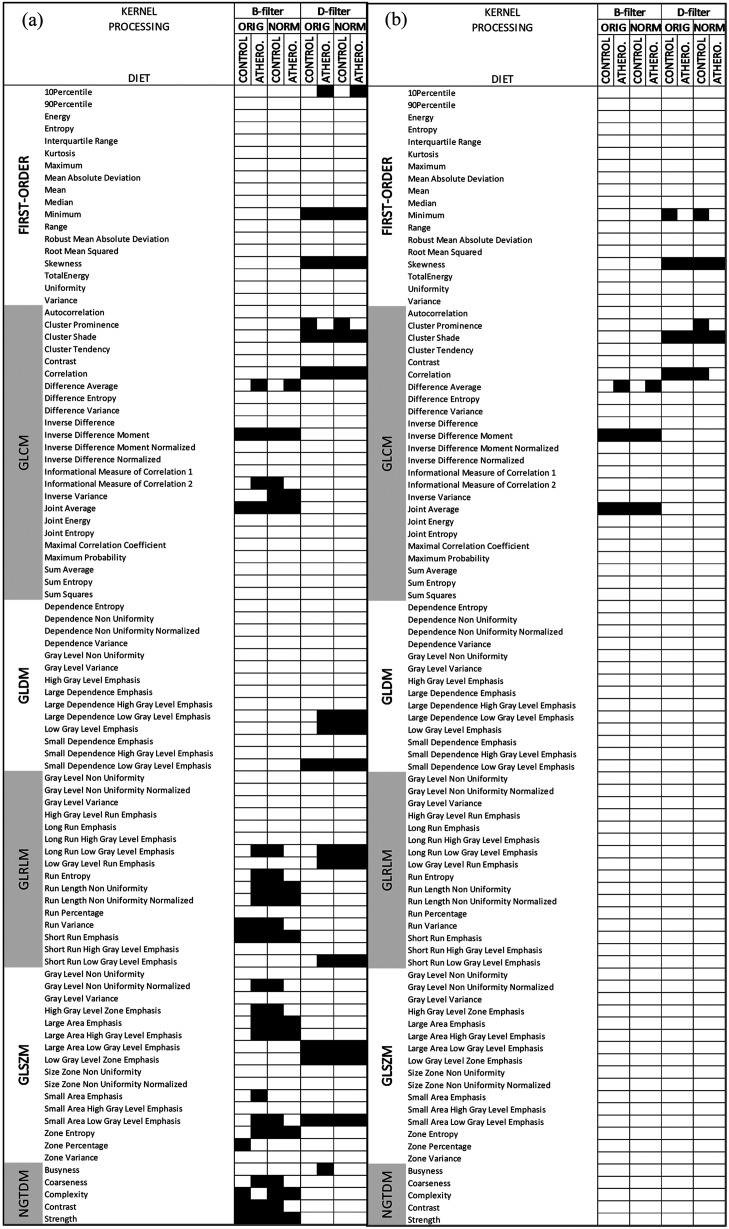
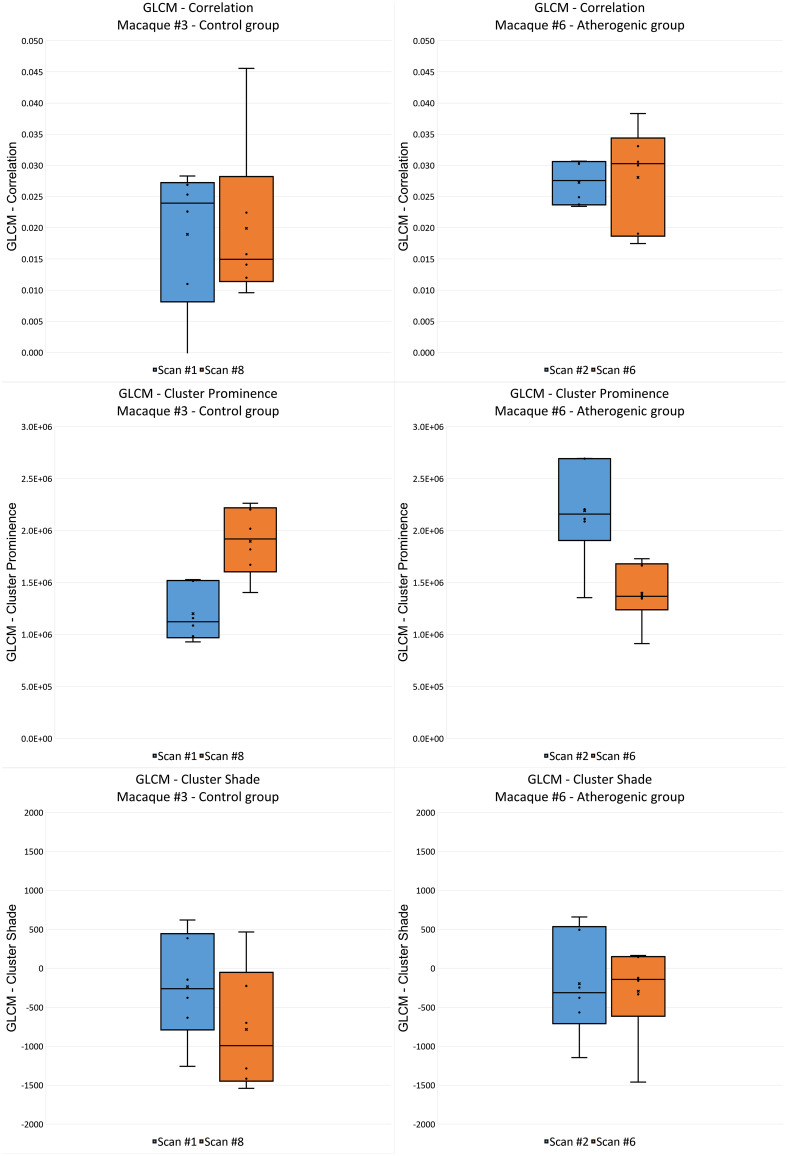
To detect heterogeneously distributed radiomic features, we computed the CV of each feature at every scan and then calculated the average coefficient in both the control and atherogenic groups. Radiomic features with high spatial variation were identified: (Fig. 10, left) and (Fig. 10, right). Heterogeneous features in B-filtered images tended to be more homogeneous in D-filtered images and vice versa. Most features that were heterogeneous in the atherogenic group were also heterogeneous in the control group. In D-filter NORM images, 14 () and 5 () heterogeneous features were found in the control group. For the latter, features were first-order minimum, first-order skewness, GLCM cluster prominence, GLCM cluster shade, and GLCM correlation. Given the large spatial variation at each scan, these features were not significantly different among scans (Fig. 11). The variation of longitudinally nearly repeatable features, such as GLCM correlation and GLCM cluster shade, was large so that no individual ROI was representative of the distribution (Fig. 11).
Fig. 10.
Radiomic features with average CVs (left) and (right) in the control and atherogenic groups for all four types of images: B-filter (ORIG), B-filter (NORM), D-filter (ORIG), and D-filter (NORM). GLCM, gray-level co-occurrence matrix; GLDM, gray-level dependence matrix; GLRMLM, gray-level run length matrix; GLSZM, gray-level size zone matrix; and NGTDM, neighboring gray tone difference matrix.
Fig. 11.
Second-order features identified as nearly repeatable with a large spatial coefficient of variance when all ROIs are considered. GLCM, gray-level co-occurrence matrix; GLDM, gray-level dependence matrix; GLRMLM, gray-level run length matrix; GLSZM, gray-level size zone matrix; and NGTDM, neighboring gray tone difference matrix.
4. Discussion
Establishing radiomic feature repeatability and reproducibility is of paramount importance to extract meaningful information from these analyses in either research or clinical settings. However, investigating these aspects in healthy subjects and patients with disease is challenging. Our study, using sequential CT imaging of crab-eating macaques on different dietary regimens (regular nonatherogenic chow versus an atherogenic diet), offers important information about the repeatability of liver CT radiomic features that would be difficult to acquire in humans. First, repeated CT acquisitions in the same macaque enabled the identification of repeatable radiomic features. Second, features that were repeatable regardless of liver pathophysiology could be identified. Fully repeatable features were identified in both -kernel and -kernel filtered CT images with and without normalization relative to the mean spleen attenuation. Radiomic features that were significantly different between the control and atherogenic groups were also identified.
In our study, we generated four types of CT images using different reconstruction and mathematical algorithms; therefore, we evaluated repeatable features in each set of images. In addition to evaluating standard CT images, spleen-normalized liver images were used to transform all images from their original grayscale into a standard grayscale, in which values have been typically associated with the presence of fat in the liver.29 We observed that spleen-normalized CT liver images showed an increased number of repeatable radiomic features in both B-filter and D-filter reconstructions with respect to their nonnormalized counterparts.
The percentage of repeatable radiomic features differed among radiomic feature classes and increased with more stringent -values. However, each type of image exhibited different patterns. For D-filter (NORM) images, the highest repeatability was achieved by NGTDM, GLRLM, and GLDM, whereas the lowest was achieved by GLSZM and GLCM for a significance level of 0.01.
A few intrasubject -tests exhibited lower -values in a limited number of first-order features, potentially indicating poor repeatability. However, intrasubject differences in liver attenuations (such as, measures of central tendency) were deemed too small to be associated with real pathophysiological fluctuations. The highest observed difference was an increase of between two scans of the same macaque (73 to 84 HU). Particularly, this macaque exhibited a weight loss of 5% on the day when the highest attenuation was observed. One possible explanation is that the reduced water content in less-hydrated tissue might have been responsible for this increased attenuation. Normal liver attenuation in humans is defined as ,30 varying individually 55 to 65 HU,31 whereas steatosis is associated with lower attenuations. Therefore, the apparent lack of repeatability in the set of evaluated first-order features is well within this range. CT images filtered with a kernel provided features with superior discrimination between the control and atherosclerotic groups. Features showing a significant group difference were identified. We also identified second-order features that were temporally repeatable but with a high spatial variance. Most features that were heterogeneously distributed in space in the atherogenic group were also heterogenous in the control group. High spatial variance in a healthy liver is not expected, and therefore, these features should be excluded from further radiomics analysis.
The number of features significantly different between diet groups were compared and was relatively high (69 to 84 out of 93 features), with the maximum number achieved from D-filter (NORM) images, with low variability among feature classes: 83% for first-order features and a maximum of 100% for GLRLM and GLSZM second-order features. The lowest performance was achieved by NGTDM, with 80% of features sensitive to diets. Second-order radiomic features that met both repeatability and sensitivity to diets were also identified. Regarding first-order features, most were sensitive to diets while many were found to be nonrepeatable. This indicates that the stringency of the -value may play an important role in the detection of repeatable first-order features.28 Although identifying features sensitive to diet may not necessarily be directly clinically translatable since they were solely based on administration of different diets (without confirmed histopathological or clinical markers), our analysis implies that liver CT radiomic features may be sensitive to the histopathological status of organs.
This study has some limitations. First, the number of macaques used in our analysis was too low to investigate feature dependence on age and sex in more detail; consequently, we do not have data to estimate what fraction of the observed variation may arise from differences in the selection criterion of the macaques. However, the described intrasubject repeatability analysis is expected to be hardly affected by these parameters. Second, nonimaging information (such as histopathology or blood biomarkers) would have helped to better identify features that were sensitive to the disease process rather than diet. However, this factor does not impact the repeatability analysis. Third, from the feature extraction perspective, it is known that some parameters (such as, bin width) affect feature values. However, it was shown that bin width had only a marginal effect on the total number of stable features. Other parameters (e.g., different scanners, slice thickness, or tube currents) were more critical in this context.32 Since we included images acquired with the same parameters on a single scanner, no resampling or adjustment of bin widths was needed. However, our study used fixed bin widths, which may have resulted in a different number of bins in similar regions if their ranges were different. Furthermore, the average intensity range of ROIs in D-filter images was (as much as twofold) higher than the corresponding B-filter images. Therefore, for a fixed bin width, the number of bins in D-filter images was higher than in their B-filter counterparts. We observed a greater performance of D-filter (NORM) images in terms of repeatability and discrimination. However, eventually, not only the image sharpness and normalization but also the higher number of bins, or a combination of all of these factors, may have been responsible for the higher performance. Fourth, we computed the coefficients of variance of intensity ranges of all ROIs for each macaque, reconstruction kernel, and image normalization. We observed that those variations were low (and slightly lower when computed from D-filtered images). On the other hand, image normalization most likely did not affect those variations. Although changes in the intensity range were not statistically significant in our study, they may still affect some radiomic features. The sources of those variations may require additional data and further investigation. Finally, other statistical approaches are typically accepted to assess repeatability, including Pearson or Spearman correlation coefficient, Bland–Altman plots, CV, and the intraclass correlation coefficient.33,34 All of these methods provide several advantages or disadvantages and can be appropriate for different use cases. In our study, we decided to use paired -tests because we specifically wanted to assess absolute agreement of quantitative radiomic features estimated from a distribution of feature values within the liver parenchyma in the same animals on different imaging days and establish a binary threshold to recommend features as “repeatable” or “nonrepeatable.”35
In conclusion, our findings suggest that in this macaque model of diet-induced liver steatosis, both first-order and second-order features should be considered to improve quantification and scoring of hepatic disease. The potential clinical relevance of nonrepeatable features needs to be further evaluated in established disease models and in data from a health-care setting. Repeatable features were identified to be included in additional radiomics analyses, which may also further elucidate disease predictors, assisting diagnostics in the clinic.
Acknowledgments
The authors would like to thank Oscar Rojas and the Comparative Medicine team [National Institute of Allergy and Infectious Diseases (NIAID) Division of Clinical Research (DCR) Integrated Research Facility at Fort Detrick (IRF-Frederick)] for handling the animals during the studies, Jiro Wada (NIAID DCR IRF-Frederick) for figure preparation and layout, and Anya Crane (NAIAD DCR IRF-Frederick) for critically editing the manuscript. Atherosclerotic crab-eating macaques were procured under R01HL144072 (Principal Investigator, Zahi A. Fayad).
Biographies
Hui Wang is a nuclear medicine imaging scientist (contractor) at the NIH NIAID DCR Integrated Research Facility at Fort Detrick, Frederick, Maryland, United States. She has extensive experience in validating innovative radiotracers in various small animal disease models. Her current research focuses on understanding pathophysiology of high-consequence viral infections using noninvasive molecular imaging techniques, such as PET, SPECT, and CT imaging. She has published more than 60 scientific papers with more than 2300 citations.
Jeffrey Solomon is an imaging scientist (contractor) at the NIH NIAID DCR Integrated Research Facility at Fort Detrick, Frederick, Maryland, United States. In this role, he leads an artificial intelligence (AI) team that implements innovative techniques to create predictive models and automate segmentation of medical images based on machine-learning principles. Working directly with radiologist colleagues, he consults on best-of-class quantitative image analysis methods to employ in infectious disease imaging research.
Syed M. S. Reza is a postdoctoral fellow at the NIH. He earned his BS degree from Bangladesh University of Engineering and Technology, Dhaka, Bangladesh, and his PhD in medical image analysis from the Old Dominion University, Virginia, United States. His research focuses on machine-learning-driven computational modeling for medical image analysis, such as segmentation, classification, disease tracking, and growth prediction for affected organs in infectious disease analyses and brain lesions, tumors, and traumatic brain injury.
Hee-Jeong Yang is an imaging analyst (contractor) at the NIH NIAID DCR Integrated Research Facility at Fort Detrick, Frederick, Maryland, United States. Her training focused on applying various imaging technologies including optical and nuclear medicine imaging in infectious diseases to elucidate host–pathogen interactions, pathogenesis, and therapeutic evaluation. In her current role, she specializes in PET/CT image analysis in preclinical animal models of viral diseases caused by Risk Group 4 organisms.
Winston T. Chu is a data scientist (contractor) at the NIH NIAID DCR Integrated Research Facility at Fort Detrick. His research focus is on the development of innovative techniques driven by AI to automatically segment and classify medical images of infectious diseases.
Ian Crozier is an infectious diseases clinician-scientist at the Frederick National Lab providing support as the chief medical officer (contractor) to the NIH NIAID DCR Integrated Research Facility at Fort Detrick, Frederick, Maryland, United States. His role bridges the human clinical bedside and animal models of emerging high-threat infectious diseases. He has extensive experience at the Ebola virus disease outbreak bedside, including in ongoing clinical research efforts in Western Africa and the Democratic Republic of the Congo.
Philip J. Sayre is a research imaging technologist (contractor) at the NIH NIAID DCR Integrated Research Facility at Fort Detrick, Frederick, Maryland, United States. His research is focused on PET/CT imaging of infectious disease in a BSL-4 setting. This work includes SARS-CoV-2, Ebola virus, Lassa virus, MERS-CoV, Marburg virus, Nipah virus, monkeypox virus, and cowpox virus infections.
Byeong Y. Lee is a biomedical imaging analyst (contractor) at the NIH NIAID DCR Integrated Research Facility at Fort Detrick, Frederick, Maryland, United States. His research aims to develop surrogate imaging biomarkers using in vivo multimodal medical imaging techniques, such as MRI, PET, and CT, as well as advanced imaging analysis methods, to aid in the evaluation of viral infectious disease models and identification of pathophysiology underlying the diseases, evaluation of antiviral therapies, and diagnostics.
Venkatesh Mani serves as a senior imaging scientist (contractor) at the NIH NIAID DCR Integrated Research Facility at Fort Detrick, Frederick, Maryland, United States. He specializes in the use of multimodality imaging, such as MRI, CT, PET, and SPECT to evaluate the molecular biology and pathogenesis of and medical countermeasure development against Risk Group 4 pathogens. He has published more than 100 peer-reviewed papers and has an h-index of 52.
Thomas C. Friedrich is a professor at the University of Wisconsin–Madison of Department of Pathobiological Sciences. He studies why and how immune responses sometimes fail to protect us from acute and chronic diseases.
David H. O’Connor is a University of Wisconsin Medical Foundation Professor of Pathology and Laboratory Medicine at the University of Wisconsin–Madison and a professorial fellow at the University of Melbourne. His research focuses on the interplay between viral pathogenesis, immunity, and host genetics. He has been involved in the movement to accelerate the dissemination of scientific information during the Zika virus and COVID-19 pandemics.
Gabriella Worwa is a study director and associate supervisor (contractor) at the NIH NIAID DCR Integrated Research Facility at Fort Detrick, Frederick, Maryland, United States. She specializes in the development and use of animal models for the study of Risk Group 4 viruses.
Jens H. Kuhn is a principal scientist and the director of virology (contractor) at the NIH NIAID DCR Integrated Research Facility at Fort Detrick, Frederick, Maryland, United States. He specializes in the molecular biology and pathogenesis of and medical countermeasure development against Risk Group 4 pathogens, evolutionary virology and virus taxonomy, and bioweapons defense. He has published more than 310 journal articles, more than 85 book chapters, and 3 books, and has an h-index of 80.
Claudia Calcagno is a study director and associate supervisor (contractor) at the NIH NIAID DCR Integrated Research Facility at Fort Detrick, Frederick, Maryland, United States. She specializes in quantitative multimodality preclinical imaging to aid in the characterization of the pathophysiology and evaluation of countermeasures of pathogens in a BSL-4 environment.
Marcelo A. Castro is a physicist and computational scientist serving as an imaging physicist (contractor) at the NIH NIAID DCR Integrated Research Facility at Fort Detrick, a biosafety level 4 facility, Frederick, Maryland, United States. His specialization includes multimodality quantitative image analysis, radiomics, computational simulations, scientific programming, and data analysis and visualization for multiple models, organs, and diseases. He has published a book, a book chapter, and more than 55 scientific papers with more than 2300 citations.
Contributor Information
Hui Wang, Email: hui.wang3@nih.gov.
Jeffrey Solomon, Email: jeffrey.solomon@nih.gov.
Syed M. S. Reza, Email: syed.reza@nih.gov.
Hee-Jeong Yang, Email: hee-jeong.yang@nih.gov.
Winston T. Chu, Email: winston.chu@nih.gov.
Ian Crozier, Email: ian.crozier@nih.gov.
Philip J. Sayre, Email: philip.john.sayre@nih.gov.
Byeong Y. Lee, Email: byeongyeul.lee@nih.gov.
Venkatesh Mani, Email: venky.mani@nih.gov.
Thomas C. Friedrich, Email: tfriedri@wisc.edu.
David H. O’Connor, Email: dhoconno@wisc.edu.
Gabriella Worwa, Email: gabriella.worwa@nih.gov.
Jens H. Kuhn, Email: kuhnjens@mail.nih.gov.
Claudia Calcagno, Email: manic2@niaid.nih.gov.
Marcelo A. Castro, Email: marcelo.a.castro@gmail.com.
Disclosures
This work was supported in part through Laulima Government Solutions, LLC, prime contract with the U.S. National Institute of Allergy and Infectious Diseases (NIAID) (Contract No. HHSN272201800013C) and Kelly Services’ contract with NIAID (Contract No. 75N93019D00027). H.W., M.A.C., H-J.Y., P.J.S., B-Y.L., and G.W. performed this work as employees of Laulima Government Solutions; LLC. J.H.K., W.T.C., and C.C. performed this work as employees of Tunnell Government Services (TGS), a subcontractor of Laulima Government Solutions, LLC (Contract No. HHSN272201800013C). V.M. performed this work as an employee of Kelly Services (Contract No. 75N93019D00027) with NIAID (Task Order No. 75N93021F00010). This work was also supported in part with federal funds from the National Institutes of Health (NIH) National Cancer Institute (NCI) (Contract No.data-availability75N910D00024, Task Order No. 75N91019F00130) with Leidos Biomedical Research, Inc. I.C. and J.S. performed this work as employees of Leidos Biomedical Research, Inc. as supported by the Clinical Monitoring Research Program Directorate, Frederick National Lab for Cancer Research, sponsored by NCI. This project was also partially funded by the NIH Clinical Center Radiology and Imaging Sciences Center for Infectious Disease Imaging (CIDI), Clinical Center, NIH (S.R. and W.T.C.). The views and conclusions contained in this document are those of the authors and should not be interpreted as necessarily representing the official policies, either expressed or implied, of the U.S. Department of Health and Human Services or of the institutions and companies affiliated with the authors, nor does mention of trade names, commercial products, or organizations imply endorsement by the U.S. Government. The study protocol was reviewed and approved by the NIH NIAID Division of Clinical Research (DCR) Integrated Research Facility at Fort Detrick (IRF-Frederick) Animal Care and Use Committee in compliance with all applicable federal regulations governing the protection of animals and research. The authors have no relevant financial interests in the manuscript and no other potential conflicts of interest to disclose.
Code and Data Availability
The work presented in this manuscript relies on the public library PyRadiomics 2.2.0 (https://pyradiomics.readthedocs.io). The datasets generated and analyzed during the current study may be available from the corresponding author only upon reasonable request and within the terms of the agreement signed by the participant institutions.
References
- 1.Ding S., et al. , “Computed tomography-based radiomic analysis for preoperatively predicting the macrovesicular steatosis grade in cadaveric donor liver transplantation,” Biomed. Res. Int. 2022, 2491023 (2022). 10.1155/2022/2491023 [DOI] [PMC free article] [PubMed] [Google Scholar]
- 2.Naganawa S., et al. , “Imaging prediction of nonalcoholic steatohepatitis using computed tomography texture analysis,” Eur. Radiol. 28(7), 3050–3058 (2018). 10.1007/s00330-017-5270-5 [DOI] [PubMed] [Google Scholar]
- 3.Park H. J., Park B., Lee S. S., “Radiomics and deep learning: hepatic applications,” Kor. J. Radiol. 21(4), 387–401 (2020). 10.3348/kjr.2019.0752 [DOI] [PMC free article] [PubMed] [Google Scholar]
- 4.Wei J., et al. , “Radiomics in liver diseases: current progress and future opportunities,” Liver Int. Off. J. Int. Assoc. Study Liver 40(9), 2050–2063 (2020). 10.1111/liv.14555 [DOI] [PMC free article] [PubMed] [Google Scholar]
- 5.Tang S., et al. , “Clinical-radiomic analysis for non-invasive prediction of liver steatosis on non-contrast CT: a pilot study,” Front. Genet. 14, 1071085 (2023). 10.3389/fgene.2023.1071085 [DOI] [PMC free article] [PubMed] [Google Scholar]
- 6.Wells M. M., et al. , “Computed tomography measurement of hepatic steatosis: prevalence of hepatic steatosis in a Canadian population,” Can. J. Gastroenterol. Hepatol. 2016, 4930987 (2016). 10.1155/2016/4930987 [DOI] [PMC free article] [PubMed] [Google Scholar]
- 7.Kani K. K., et al. , “Imaging patterns of hepatic steatosis on multidetector CT: pearls and pitfalls,” Clin. Radiol. 67(4), 366–371 (2012). 10.1016/j.crad.2011.08.023 [DOI] [PubMed] [Google Scholar]
- 8.Mehta S. R., et al. , “Non-invasive means of measuring hepatic fat content,” World J. Gastroenterol. 14(22), 3476–3483 (2008). 10.3748/wjg.14.3476 [DOI] [PMC free article] [PubMed] [Google Scholar]
- 9.Schwenzer N. F., et al. , “Non-invasive assessment and quantification of liver steatosis by ultrasound, computed tomography and magnetic resonance,” J. Hepatol. 51(3), 433–445 (2009). 10.1016/j.jhep.2009.05.023 [DOI] [PubMed] [Google Scholar]
- 10.Valls C., et al. , “Fat in the liver: diagnosis and characterization,” Eur. Radiol. 16(10), 2292–2308 (2006). 10.1007/s00330-006-0146-0 [DOI] [PubMed] [Google Scholar]
- 11.Zeb I., et al. , “Computed tomography scans in the evaluation of fatty liver disease in a population based study: the multi-ethnic study of atherosclerosis,” Acad. Radiol. 19(7), 811–818 (2012). 10.1016/j.acra.2012.02.022 [DOI] [PMC free article] [PubMed] [Google Scholar]
- 12.Nassir F., et al. , “Pathogenesis and prevention of hepatic steatosis,” Gastroenterol. Hepatol. 11(3), 167–175 (2015). [PMC free article] [PubMed] [Google Scholar]
- 13.Fernando D. H., et al. , “Development and progression of non-alcoholic fatty liver disease: the role of advanced glycation end products,” Int. J. Mol. Sci. 20(20), 5037 (2019). 10.3390/ijms20205037 [DOI] [PMC free article] [PubMed] [Google Scholar]
- 14.Jha A. K., et al. , “Repeatability and reproducibility study of radiomic features on a phantom and human cohort,” Sci. Rep. 11(1), 2055 (2021). 10.1038/s41598-021-81526-8 [DOI] [PMC free article] [PubMed] [Google Scholar]
- 15.Denzler S., et al. , “Impact of CT convolution kernel on robustness of radiomic features for different lung diseases and tissue types,” Br. J. Radiol. 94(1120), 20200947 (2021). 10.1259/bjr.20200947 [DOI] [PMC free article] [PubMed] [Google Scholar]
- 16.Qiu Q., et al. , “Reproducibility and non-redundancy of radiomic features extracted from arterial phase CT scans in hepatocellular carcinoma patients: impact of tumor segmentation variability,” Quantitative Imaging Med. Surg. 9(3), 453–464 (2019). 10.21037/qims.2019.03.02 [DOI] [PMC free article] [PubMed] [Google Scholar]
- 17.Castro M. A., et al. , “Toward the determination of sensitive and reliable whole-lung computed tomography features for robust standard radiomics and delta-radiomics analysis in a nonhuman primate model of coronavirus disease 2019,” J. Med. Imaging 9(6), 066003 (2022). 10.1117/1.JMI.9.6.066003 [DOI] [PMC free article] [PubMed] [Google Scholar]
- 18.Small D. M., et al. , “Physicochemical and histological changes in the arterial wall of nonhuman primates during progression and regression of atherosclerosis,” J. Clin. Investig. 73(6), 1590–1605 (1984). 10.1172/JCI111366 [DOI] [PMC free article] [PubMed] [Google Scholar]
- 19.Wang H., et al. , “Determination of reproducible radiomic features for diagnosis of fatty liver disease in a crab-eating macaque model,” Proc. SPIE 12468, 1246819 (2023). 10.1117/12.2647632 [DOI] [Google Scholar]
- 20.Beason D. P., et al. , “Hypercholesterolemia increases supraspinatus tendon stiffness and elastic modulus across multiple species,” J. Shoulder Elbow Surg. 22(5), 681–686 (2013). 10.1016/j.jse.2012.07.008 [DOI] [PMC free article] [PubMed] [Google Scholar]
- 21.Chung S., et al. , “Dietary cholesterol promotes adipocyte hypertrophy and adipose tissue inflammation in visceral, but not in subcutaneous, fat in monkeys,” Arterioscl. Thromb. Vasc. Biol. 34(9), 1880–1887 (2014). 10.1161/ATVBAHA.114.303896 [DOI] [PMC free article] [PubMed] [Google Scholar]
- 22.Parks J. S., et al. , “Effect of dietary fish oil on coronary artery and aortic atherosclerosis in African green monkeys,” Arteriosclerosis 10(6), 1102–1112 (1990). 10.1161/01.ATV.10.6.1102 [DOI] [PubMed] [Google Scholar]
- 23.Finch C. L., et al. , “Characteristic and quantifiable COVID-19-like abnormalities in CT- and PET/CT-imaged lungs of SARS-CoV-2-infected crab-eating macaques (Macaca fascicularis),” bioRxiv, 2020.2005.2014.096727 (2020).
- 24.Castro M. A., et al. , “Determination of reliable whole-lung CT features for robust standard radiomics and delta-radiomics analysis in a crab-eating macaque model of COVID-19: stability and sensitivity analysis,” Proc. SPIE 12036, 1203621 (2022). 10.1117/12.2607154 [DOI] [Google Scholar]
- 25.Boyce C. J., et al. , “Hepatic steatosis (fatty liver disease) in asymptomatic adults identified by unenhanced low-dose CT,” Am. J. Roentgenol. 194(3), 623–628 (2010). 10.2214/AJR.09.2590 [DOI] [PubMed] [Google Scholar]
- 26.Reza S. M. S., et al. , “Deep learning for automated liver segmentation to aid in the study of infectious diseases in nonhuman primates,” Acad. Radiol. 28 Suppl 1, S37–S44 (2021). 10.1016/j.acra.2020.08.023 [DOI] [PMC free article] [PubMed] [Google Scholar]
- 27.van Griethuysen J. J. M., et al. , “Computational radiomics system to decode the radiographic phenotype,” Cancer Res. 77(21), e104–e107 (2017). 10.1158/0008-5472.CAN-17-0339 [DOI] [PMC free article] [PubMed] [Google Scholar]
- 28.Betensky R. A., “The p-value requires context, not a threshold,” Am. Statist. 73(sup1), 115–117 (2019). 10.1080/00031305.2018.1529624 [DOI] [Google Scholar]
- 29.Iwasaki M., et al. , “Noninvasive evaluation of graft steatosis in living donor liver transplantation,” Transplantation 78(10), 1501–1505 (2004). 10.1097/01.TP.0000140499.23683.0D [DOI] [PubMed] [Google Scholar]
- 30.Graffy P. M., et al. , “Automated liver fat quantification at nonenhanced abdominal CT for population-based steatosis assessment,” Radiology 293(2), 334–342 (2019). 10.1148/radiol.2019190512 [DOI] [PMC free article] [PubMed] [Google Scholar]
- 31.Boll D. T., Merkle E. M., “Diffuse liver disease: strategies for hepatic CT and MR imaging,” Radiographics 29(6), 1591–1614 (2009). 10.1148/rg.296095513 [DOI] [PubMed] [Google Scholar]
- 32.Larue R. T. H. M., et al. , “Influence of gray level discretization on radiomic feature stability for different CT scanners, tube currents and slice thicknesses: a comprehensive phantom study,” Acta Oncol. 56(11), 1544–1553 (2017). 10.1080/0284186X.2017.1351624 [DOI] [PubMed] [Google Scholar]
- 33.Traverso A., et al. , “Repeatability and reproducibility of radiomic features: a systematic review,” Int. J. Radiat. Oncol. Biol. Phys. 102(4), 1143–1158 (2018). 10.1016/j.ijrobp.2018.05.053 [DOI] [PMC free article] [PubMed] [Google Scholar]
- 34.Xue C., et al. , “Acquisition repeatability of MRI radiomics features in the head and neck: a dual-3D-sequence multi-scan study,” Vis. Comput. Ind. Biomed. Art 5(1), 10 (2022). 10.1186/s42492-022-00106-3 [DOI] [PMC free article] [PubMed] [Google Scholar]
- 35.Koo T. K., Li M. Y., “A guideline of selecting and reporting intraclass correlation coefficients for reliability research,” J. Chiropractic Med. 15(2), 155–163 (2016). 10.1016/j.jcm.2016.02.012 [DOI] [PMC free article] [PubMed] [Google Scholar]
Associated Data
This section collects any data citations, data availability statements, or supplementary materials included in this article.
Data Availability Statement
The work presented in this manuscript relies on the public library PyRadiomics 2.2.0 (https://pyradiomics.readthedocs.io). The datasets generated and analyzed during the current study may be available from the corresponding author only upon reasonable request and within the terms of the agreement signed by the participant institutions.


