

Abstract
Background:
Air pollution is a major risk factor for planetary health and has long been suspected of predisposing humans to respiratory diseases induced by pathogens like influenza viruses. However, epidemiological evidence remains elusive due to lack of longitudinal data from large cohorts.
Objective:
Our aim is to quantify the short-term association of influenza incidence with exposure to ambient air pollutants in Chinese cities.
Methods:
Based on air pollutant data and influenza surveillance data from 82 cities in China over a period of 5 years, we applied a two-stage time series analysis to assess the association of daily incidence of reported influenza cases with six common air pollutants [particulate matter with aerodynamic diameter (), particulate matter with aerodynamic diameter (), , , CO, and ], while adjusting for potential confounders including temperature, relative humidity, seasonality, and holiday effects. We built a distributed lag Poisson model for one or multiple pollutants in each individual city in the first stage and conducted a meta-analysis to pool city-specific estimates in the second stage.
Results:
A total of 3,735,934 influenza cases were reported in 82 cities from 2015 to 2019, accounting for 72.71% of the overall case number reported in the mainland of China. The time series models for each pollutant alone showed that the daily incidence of reported influenza cases was positively associated with almost all air pollutants except for ozone. The most prominent short-term associations were found for and with cumulative risk ratios of 1.094 [95% confidence interval (CI): 1.054, 1.136] and 1.093 (95% CI: 1.067, 1.119), respectively, for each increase in the concentration at each of the lags of 1–7 d. Only showed a significant association with the daily incidence of influenza cases in the multipollutant model that adjusts all six air pollutants together. The impact of air pollutants on influenza was generally found to be greater in children, in subtropical cities, and during cold months.
Discussion:
Increased exposure to ambient air pollutants, particularly , is associated with a higher risk of influenza-associated illness. Policies on reducing air pollution levels may help alleviate the disease burden due to influenza infection. https://doi.org/10.1289/EHP12146
Introduction
Rapid economic development and urbanization are often achieved at the expense of air quality. A growing body of evidence indicates significant associations between exposure to air pollutants and adverse health effects, such as chronic cardiovascular and respiratory diseases.1–4 In recent years, numerous epidemiological studies have also suggested an association between ambient air pollution exposure and acute respiratory morbidity and mortality.5–7 For example, an ecological study conducted in Brisbane, Australia correlated pediatric influenza cases with increasing ozone () and particulate matter with aerodynamic diameter ().6 Similarly, high concentrations of and sulfur dioxide () were linked to more frequent emergency room visits due to pneumonia and influenza in São Paulo, Brazil.8 In addition, reduced population exposure to air pollution as a result of the COVID-19-related lockdown was found to possibly explain the decline in premature mortality from respiratory and cardiovascular diseases.9 In contrast, a study in the United States found no significant impact of air pollution or other environmental exposures on the incidence of influenza-associated hospitalization.10
China has undergone rapid industrialization and urbanization over the past three decades, a process that has been accompanied by a notable increase in air pollution. This trend has inspired research in the potential associations between infectious diseases and air-pollution, with influenza viruses being the most extensively studied pathogen in recent years. A multicity study in China found that 10.7% of incident influenza cases could be attributed to exposure to ambient particulate matter with aerodynamic diameter ().11 Effects of air pollutants including , , carbon monoxide (CO), , and nitrogen dioxide () on the incidence of influenza or influenza-like illness were also extensively explored in single cities of China, mainly among densely populated metropolitan areas such as Beijing, Wuhan, and Hefei.5,12 Associations between ambient levels of and daily numbers of influenza cases were found in some cities (e.g., Nanjing, Wuhan, and Chongqing)13–15 but not in others (e.g., Jinan or Hefei).16,17 There could be a variety of reasons for these inconsistent findings, such as different methodologies used or failure to consider confounding variables or autocorrelations in disease incidence. For a given air pollutant under investigation, potential confounders include other air pollutants and meteorological conditions. These confounders may affect both the target pollutant and the incidence of the disease of interest. In addition, how target pollutants and confounders are associated with a disease may vary across regions. Finally, due to the transmission nature of infectious diseases, the intrinsic autocorrelation of disease incidence over time needs to be taken into account to minimize bias in the findings.
In the current study, applying a two-stage time series model to the national surveillance data of influenza, we aim to examine potential associations between influenza incidence and ambient air pollutant levels in China.
Methods
We linked daily numbers of reported influenza cases from all cities across the mainland of China to the concentration data of six ambient air pollutants (, , , , CO, and ) collected between 1 January 2015 and 31 December 2019. A two-stage time series approach was employed to systematically examine the association between ambient air pollutant levels and the daily incidence of reported influenza cases at the city level. Here, daily incidence is defined as the number of new cases per 100,000 people per day.
Data Collection and Management
We extracted the daily reported number of influenza cases from 2015 to 2019 at city level from the Chinese Information System for Disease Control and Prevention (CISDCP), an internet-based real-time reporting system of notifiable infectious diseases in China.18 Influenza is classified as a class C notifiable disease by the National Health Commission of the People’s Republic of China (NHCC). According to the “Diagnostic Criteria for Influenza (WS285-2008)” issued by the NHCC (http://www.nhc.gov.cn/wjw/s9491/200802/38820.shtml), a laboratory-confirmed influenza case is defined as a person with influenza-like symptoms (fever and cough or sore throat) and laboratory-confirmed infection with seasonal influenza A or B virus using one or more of the following laboratory tests: reverse-transcriptase polymerase chain reaction, real-time reverse-transcriptase polymerase chain reaction, viral culture, detection for specific antigen of influenza A or B virus from respiratory epithelial cells, or seroconversion or a increase in specific antibody to seasonal influenza A or B virus between acute and convalescent serum samples. A clinically diagnosed influenza case is defined as a person visiting a hospital during the season of high flu activity or when hospital visits due to upper respiratory tract infection significantly increase or when a local outbreak of upper respiratory tract infection occurs along with one or more of the following clinical manifestations: a) body temperature , with some of clinical symptoms such as cough, sore throat, chills, headache, dizziness, muscular pain, fatigue, etc.; b) gastrointestinal symptoms such as anorexia, abdominal pain, abdominal distension, vomiting, and diarrhea for a few patients; c) complications with sinusitis, otitis media, laryngitis, bronchitis, pneumonia, and even respiratory and circulatory failure and death for a few patients; d) lowered respiratory sound, pulmonary moist rales, and pulmonary wheezing sound but without the signs of pulmonary parenchymal lesions for a few children less than 2 years old or some patients with chronic medical conditions; e) unilateral or bilateral pulmonary parenchymal lesions by chest X-ray examination for severe patients and some with pleural effusion; or f) relatively low or no high peripheral white blood cell count and relative increase of peripheral blood lymphocytes for common patients and both decreased peripheral white blood cell count and peripheral blood lymphocytes for the most severe patients. In this study, both laboratory and clinically confirmed influenza cases were aggregated according to their symptom onset dates to form city-specific daily numbers of influenza cases.
Daily measurements of six ambient air pollutants (, , , , , and CO) and two meteorological variables (temperature and relative humidity) at the city level were collected from the China National Environmental Monitoring Center (http://www.cnemc.cn/sssj) and the China Meteorological Data Service Center (http://data.cma.cn), respectively. We based the daily measurements on the 24-h averages of , , , , and CO, and the maximum value of 8-h moving averages of , according to the “Technical Regulation on Ambient Air Quality Index” (HJ633-2012) issued by the Ministry of Ecology and Environment of China.19 The daily average temperature (°C) and relative humidity (%) were calculated as the average of the four readings at 0200 hours, 0800 hours, 1400 hours, and 2000 hours every day.20,21 A summary of city-specific air pollutant levels and meteorological factors is given in Tables S1–S4. City-specific demographic data including age structure, population size, and population weighted geometric mean density (PWD-G) were collected from the seventh national census of the National Bureau of Statistics (http://www.stats.gov.cn/sj/pcsj/rkpc/7rp/indexch.htm) and the Asia continental population dataset of WorldPop (https://www.worldpop.org/methods/pwd; https://www.worldpop.org/doi/10.5258/SOTON/WP00013) (Table S5).
For the primary analysis, we selected a total of 82 cities each with at least 500 influenza cases reported per year during the study period (2015–2019) to avoid unreliable estimation caused by sparse data (Figure 1A). Less than 5% of the daily air pollutant measurements were missing, which were imputed using Kalman smoothing. All 82 cities are located in China’s temperate and subtropical climate zones. We grouped the calendar months into cold season with relatively high flu activity (November to April) and warm season with relatively low flu activity (May to October), based on the time series of influenza incidence (Figure S1; Excel Table S1).
Figure 1.

Spatial distribution of average concentration levels of six air pollutants and Pearson correlations between daily influenza incidence and 1-week moving-average of air pollutant concentrations in selected Chinese cities during 2015–2019. (A) The locations of the 82 cities selected for the primary analysis. (B) The spatial distributions of average concentration levels of six pollutants (background) and their Pearson correlations with daily influenza incidence (points) at the city level. Points are colored red for positive correlation and blue for negative correlations. Points are shaped as triangles when the correlation is not statistically significant (). The map outline in this figure was obtained from the Ministry of Civil Affairs of the People’s Republic of China (http://xzqh.mca.gov.cn/map). This figure was generated by using ArcGIS (version 10.7), QGIS (version 3.12) and R software (version 4.1.2). Numeric data for air pollution can be found in Tables S2–S4; Pearson correlation and -value data can be found in Table S7. Note: , carbon monoxide; , nitrogen dioxide; , ozone; PM, particulate matter; , sulfur dioxide.
Statistical Analysis
The Pearson correlations between the daily incidence of influenza cases and the moving average of six air pollutant concentrations over the previous 7 days was evaluated for each of the 82 cities and was mapped. We used a two-stage time series modeling strategy to assess the short-term associations between air pollutants and the daily incidence of influenza cases. We consider two age groups, 0–14 years old and years old and refer to them as children and adults, respectively, although the adult group also includes some adolescents. This grouping is because city-specific population size data are available only as 5-year age groups (0–4, 5–9, etc.).
First-Stage Models
In the first stage, a distributed lag model was used to explore the relationship between a given air pollutant at lags of 1–7 d and the daily incidence of influenza for each selected city,22 assuming that the association of air pollutants with acute health outcomes is mainly short-term.23,24 The model takes an additive form:
where is the number of symptom onsets of reported influenza cases of city on day . Quasi-Poisson distribution with a log link was used to account for overdispersion in the time series of daily number of cases, as indicated by the heavily skewed distribution of city-level daily incidence and the larger variance of the daily count of influenza cases than its mean in the majority of the cities (Figure S2; Table S6). is the logarithm of city-specific population size serving as the offset. As the model can be equivalently written as , we are effectively modeling the daily incidence. is a natural cubic spline function of time with 7 degrees of freedom (df) per year to capture both the long-term trend and seasonality. indicates the day of the week, and indicates holidays associated with the spring Festival and the National Day. The summer school-closure days were additionally adjusted in the subgroup analysis of children). is the log-sum of case counts over the previous 3 days, an autocorrelation to account for the fact that influenza is a contagious disease with an incubation period of 1–3 d.25 and are the natural cubic spline functions with 3 df to account for the potential nonlinear effects of temperature and relative humidity, respectively, both averaged over the 7 days before day . represents the linear effects of air pollutants levels at 1 to 7 d before day , where the linear effects vary over the lags as natural cubic splines function with 3 df. is the single-day air pollutant level associated with lag . The exponential of a linear effect at a given lag is interpreted as the risk ratio associated with a increase in the concentration of the air pollutant at that lag.
Second-Stage Model
In the second stage, the city-specific exposure-response associations between air pollutants and case numbers estimated from the first stage were pooled using a random-effect meta-analysis with restricted maximum likelihood (REML).26 Based on the pooled estimates, the linear effects of air pollutant exposure at lags of 1–7 d were then summed and exponentiated to obtain the final estimates to which we refer as the cumulative risk ratio (CRR). CRR is interpreted as the corresponding multiplicative increase in influenza incidence at each increase of in the average concentration of a given air pollutant during the lag period of 1–7 d.
We first applied this two-stage procedure to each pollutant separately (single-pollutant models) and then adjusted all six pollutants simultaneously in the same model (multipollutant model). The single pollutant models were fitted separately for subgroups of age (children vs. adults), climate zone (temperate vs. subtropical), and flu activity (high vs. low). Meta regression was used to assess the heterogeneity of the pollutant associations with influenza across cities and their dependence on city-level characteristics, including population density, annual median level of pollution, proportion of children ( years old), longitude, and latitude. Cochran’s Q test and I2 statistic were used to assess the heterogeneity of the associations with and without controlling for these city-level characteristics.
Attributable Fraction
Based on the national-level pooled effect estimates from the single and multipollutant models, we calculated the city-specific attributable fractions of influenza cases associated with exposure to ambient air pollutants using a forward approach27:
where is the attributable fraction for day of city i, l is the lag days from 1 to 7, is the attributable number for city i, and and are the total attributable number and attributable fraction. is the pooled linear effect estimate for lag l, is the concentration of the given air pollutant, and is the excessive risk imposed by the given pollutant levels at lags of 1–7 d on day of city i. is the number of follow-up days for city i, is the number of symptom onsets of reported cases in city on day , and M is the total number of cities. Note that is interpreted as the attributable or etiological fraction when but the preventable fraction otherwise. As our target is the national average attributable fraction, we used the pooled estimate of instead of the best linear unbiased prediction (BLUP) estimate of the city-specific for calculating . In addition, AF estimates based on BLUP estimates will be more variable and thus less generalizable to other cities or years.
Sensitivity Analysis
We performed a variety of sensitivity analyses to validate the robustness of the main findings, incorporating all cities with at least 300 cases per year (130 cities) and at least 400 cases per year (103 cities), modifying the degrees of freedom for meteorological variables (3 to 5 df), extending the lag days for averaging meteorological variables (from 7 d to 10 d and 14 d), and using the log-sum of case counts in the previous 3–5 d (mean serial interval of influenza is about 3.6 d) for the autocorrelation term.28 In addition, to explore potential nonlinear relationships between ambient air pollutants exposure and daily influenza incidence, associations of air pollutants with influenza were also parameterized using a cubic polynomial function, and paired Wilcoxon test was used to compare the city-specific Bayesian information criterion (BIC) values between the linear and nonlinear pollutant effect models.
All statistical analyses were conducted using R software (version 4.1.2; R Development Core Team). Statistical significance was considered achieved for . Additionally, the related thematic maps of influenza and air pollution in this study were created utilizing QGIS (version 3.12) and R software (version 4.1.2) based on the National Administrative Map (review number GS2022-1873) derived from the Ministry of Civil Affairs of the People’s Republic of China (http://xzqh.mca.gov.cn/map).
Results
From 2015 to 2019, a total of 5,207,795 clinically diagnosed and laboratory-confirmed influenza cases were reported to the CISDCP from all 372 cities of Mainland China. Annual incidence exhibits a large spatial discrepancy between regions, and the variation patterns are similar between children and adults, although children clearly had higher incidence than adults (Figure S3). A total of 82 cities including 26 in the temperate zone and 56 in the subtropical zone met the inclusion criterion of cases per year. A total of 3,735,934 cases were included in the study, 68.73% of whom were children. Patients were more likely to be male among children (56.41%) and female among adults (52.78%). In addition, more cases were reported in the subtropical zone (71.41%) (Table 1). The annual median levels of ambient air pollutants were different across cities, and most pollutants, especially and , had higher concentration levels in the north, especially for and (Figure S4; Table S2–S4). Daily incidence of reported influenza cases was positively associated with daily levels of , , and in most of the cities, especially in the heavily polluted northern cities, and negatively associated with ; however, spatial heterogeneity in the associations was found for most pollutants, e.g., positive correlations tended to occur in the north for , , , and CO (Figure 1B; Table S7). In addition, temporal associations were found between the influenza incidence and all air pollutants, with their peaks (valley of ) overlapping in the cold months (Figure S1).
Table 1.
Distribution of reported influenza cases in 82 selected cities of China during 2015–2019 by age group, sex, climate zone and season.
| Children (y old) | Adults (y old) | Number of influenza cases | |||||
|---|---|---|---|---|---|---|---|
| 0–4 | 5–9 | 10–14 | 15–44 | 45–74 | |||
| Total | 1,193,078 (31.94%) | 1,007,010 (26.95%) | 367,692 (9.84%) | 726,012 (19.43%) | 381,256 (10.21%) | 60,886 (1.63%) | 3,735,934 |
| Sex | |||||||
| Female | 512,163 (29.51%) | 448,127 (25.82%) | 158,886 (9.15%) | 395,115 (22.76%) | 193,802 (11.17%) | 27,670 (1.59%) | 1,735,763 |
| Male | 680,915 (34.04%) | 558,883 (27.94%) | 208,806 (10.44%) | 330,897 (16.54%) | 187,454 (9.37%) | 33,216 (1.66%) | 2,000,171 |
| Climate zone | |||||||
| Subtropical | 865,975 (33.37%) | 760,618 (29.50%) | 281,359 (11.03%) | 460,597 (17.75%) | 182,977 (7.08%) | 32,776 (1.27%) | 2,667,734 |
| Temperate | 327,103 (28.35%) | 246,392 (20.61%) | 86,333 (6.88%) | 265,415 (23.63%) | 198,279 (18.00%) | 28,110 (2.53%) | 1,068,200 |
| Season | |||||||
| Cold (November–April) | 918,988 (31.07%) | 851,365 (28.78%) | 319,166 (10.79%) | 545,322 (18.44%) | 279,384 (9.45%) | 43,587 (1.47%) | 2,957,812 |
| Warm (May–October) | 274,090 (35.23%) | 155,645 (20.00%) | 48,526 (6.24%) | 180,690 (23.22%) | 101,872 (13.09%) | 17,299 (2.22%) | 778,122 |
After adjusting for temperature, relative humidity, seasonality and long-term trend, significant positive short-term associations were found for almost all air pollutants except ozone in the single-pollutant models. The pooled estimates of cumulative risk ratios per increase in daily concentration over the lags of 1–7 d ranged from 1.003 to 1.094 for the six pollutants and were statistically significant except for (Table 2). and had the greatest association with influenza incidence, with CRRs of 1.093 [95% confidence interval (CI): 1.067, 1.119] and 1.094 (95% CI: 1.054, 1.136), respectively, followed by (, 95% CI: 1.015, 1.033) and (, 95% CI: 1.010, 1.023) (Table 2). The lag-specific associations between air pollutants and influenza decayed along the lag days in general, though the risk ratios bounced back slightly at the longer lags for and CO (Figure S5; Table S8). In the multipollutant model including all of the six air pollutants, was the only air pollutant showing significance, with a cumulative risk ratio of 1.089 (95% CI: 1.057, 1.122), that dwarfed the associations with other air pollutants. Based on the single-pollutant models, all air pollutants except for , especially and CO, had contributed substantial fractions () to the influenza incidence in many of the northern Chinese cities, and and CO contributed in most southern cities as well. Based on the multipollutant model, only showed significant attributable risk in most cities, while other pollutants showed nearly none (Figures S6 and S7; Table S9 and S10).
Table 2.
Short-term association between six air pollutants and daily incidence of influenza cases in terms of cumulative risk ratios (95% confidence interval) per increase in the air pollutant concentration simultaneously at all of the lags of 1–7 days prior to symptom onset, estimated by the single-pollutant and multipollutant models; cases reported from 2015 to 2019 in 82 cities in China.
| Air pollutant | Single-pollutant model | Multipollutant modela |
|---|---|---|
| 1.024 (1.015–1.033) | 1.004 (0.985–1.022) | |
| 1.017 (1.010–1.023) | 0.997 (0.985–1.009) | |
| 1.094 (1.054–1.136) | 1.000 (0.977–1.023) | |
| 1.093 (1.067–1.119) | 1.089 (1.057–1.122) | |
| 1.007 (0.9996–1.014) | 1.000 (0.993–1.006) | |
| CO | 1.003 (1.002–1.004) | 1.001 (0.9999–1.001) |
Note: CO, carbon monoxide; , nitrogen dioxide; , ozone; PM, particulate matter; , sulfur dioxide.
For the multipollutant model, all six pollutants were adjusted together in the same model.
We examined the association of influenza incidence with air pollutants within subgroups using single-pollutant models. In general, greater associations of the air pollutants on influenza, particularly those of and , were found in children than in adults, in subtropical cities than in temperate cities, and in months with high flu activity than in months with low flu activity (Figure 2). showed a significant association (, 95% CI: 0.999, 1.018) with influenza incidence during warm months with low influenza activity and a marginal association (, 95% CI: 1.004, 1.012) in the subtropical zone. Using univariate meta-regression, we further assessed heterogeneity of the short-term associations of air pollutants with influenza across cities and whether such variation can be explained by longitude, latitude, PWD-G, and median level of the air pollutant concentration. The short-term associations of air pollutants with influenza varied substantially as indicated by the values of the intercept-only meta-regression models (Table S11). The largest heterogeneity was shown for (), followed by CO (), and had the least variable effects (). City-specific characteristics accounted for only a small amount of variation in the effects, but several were statistically significant. The median level of air pollutant affected the associations with influenza of all air pollutants except for , and latitude affected all but . The proportion of children affected the associations with influenza for , , and (Table S12).
Figure 2.
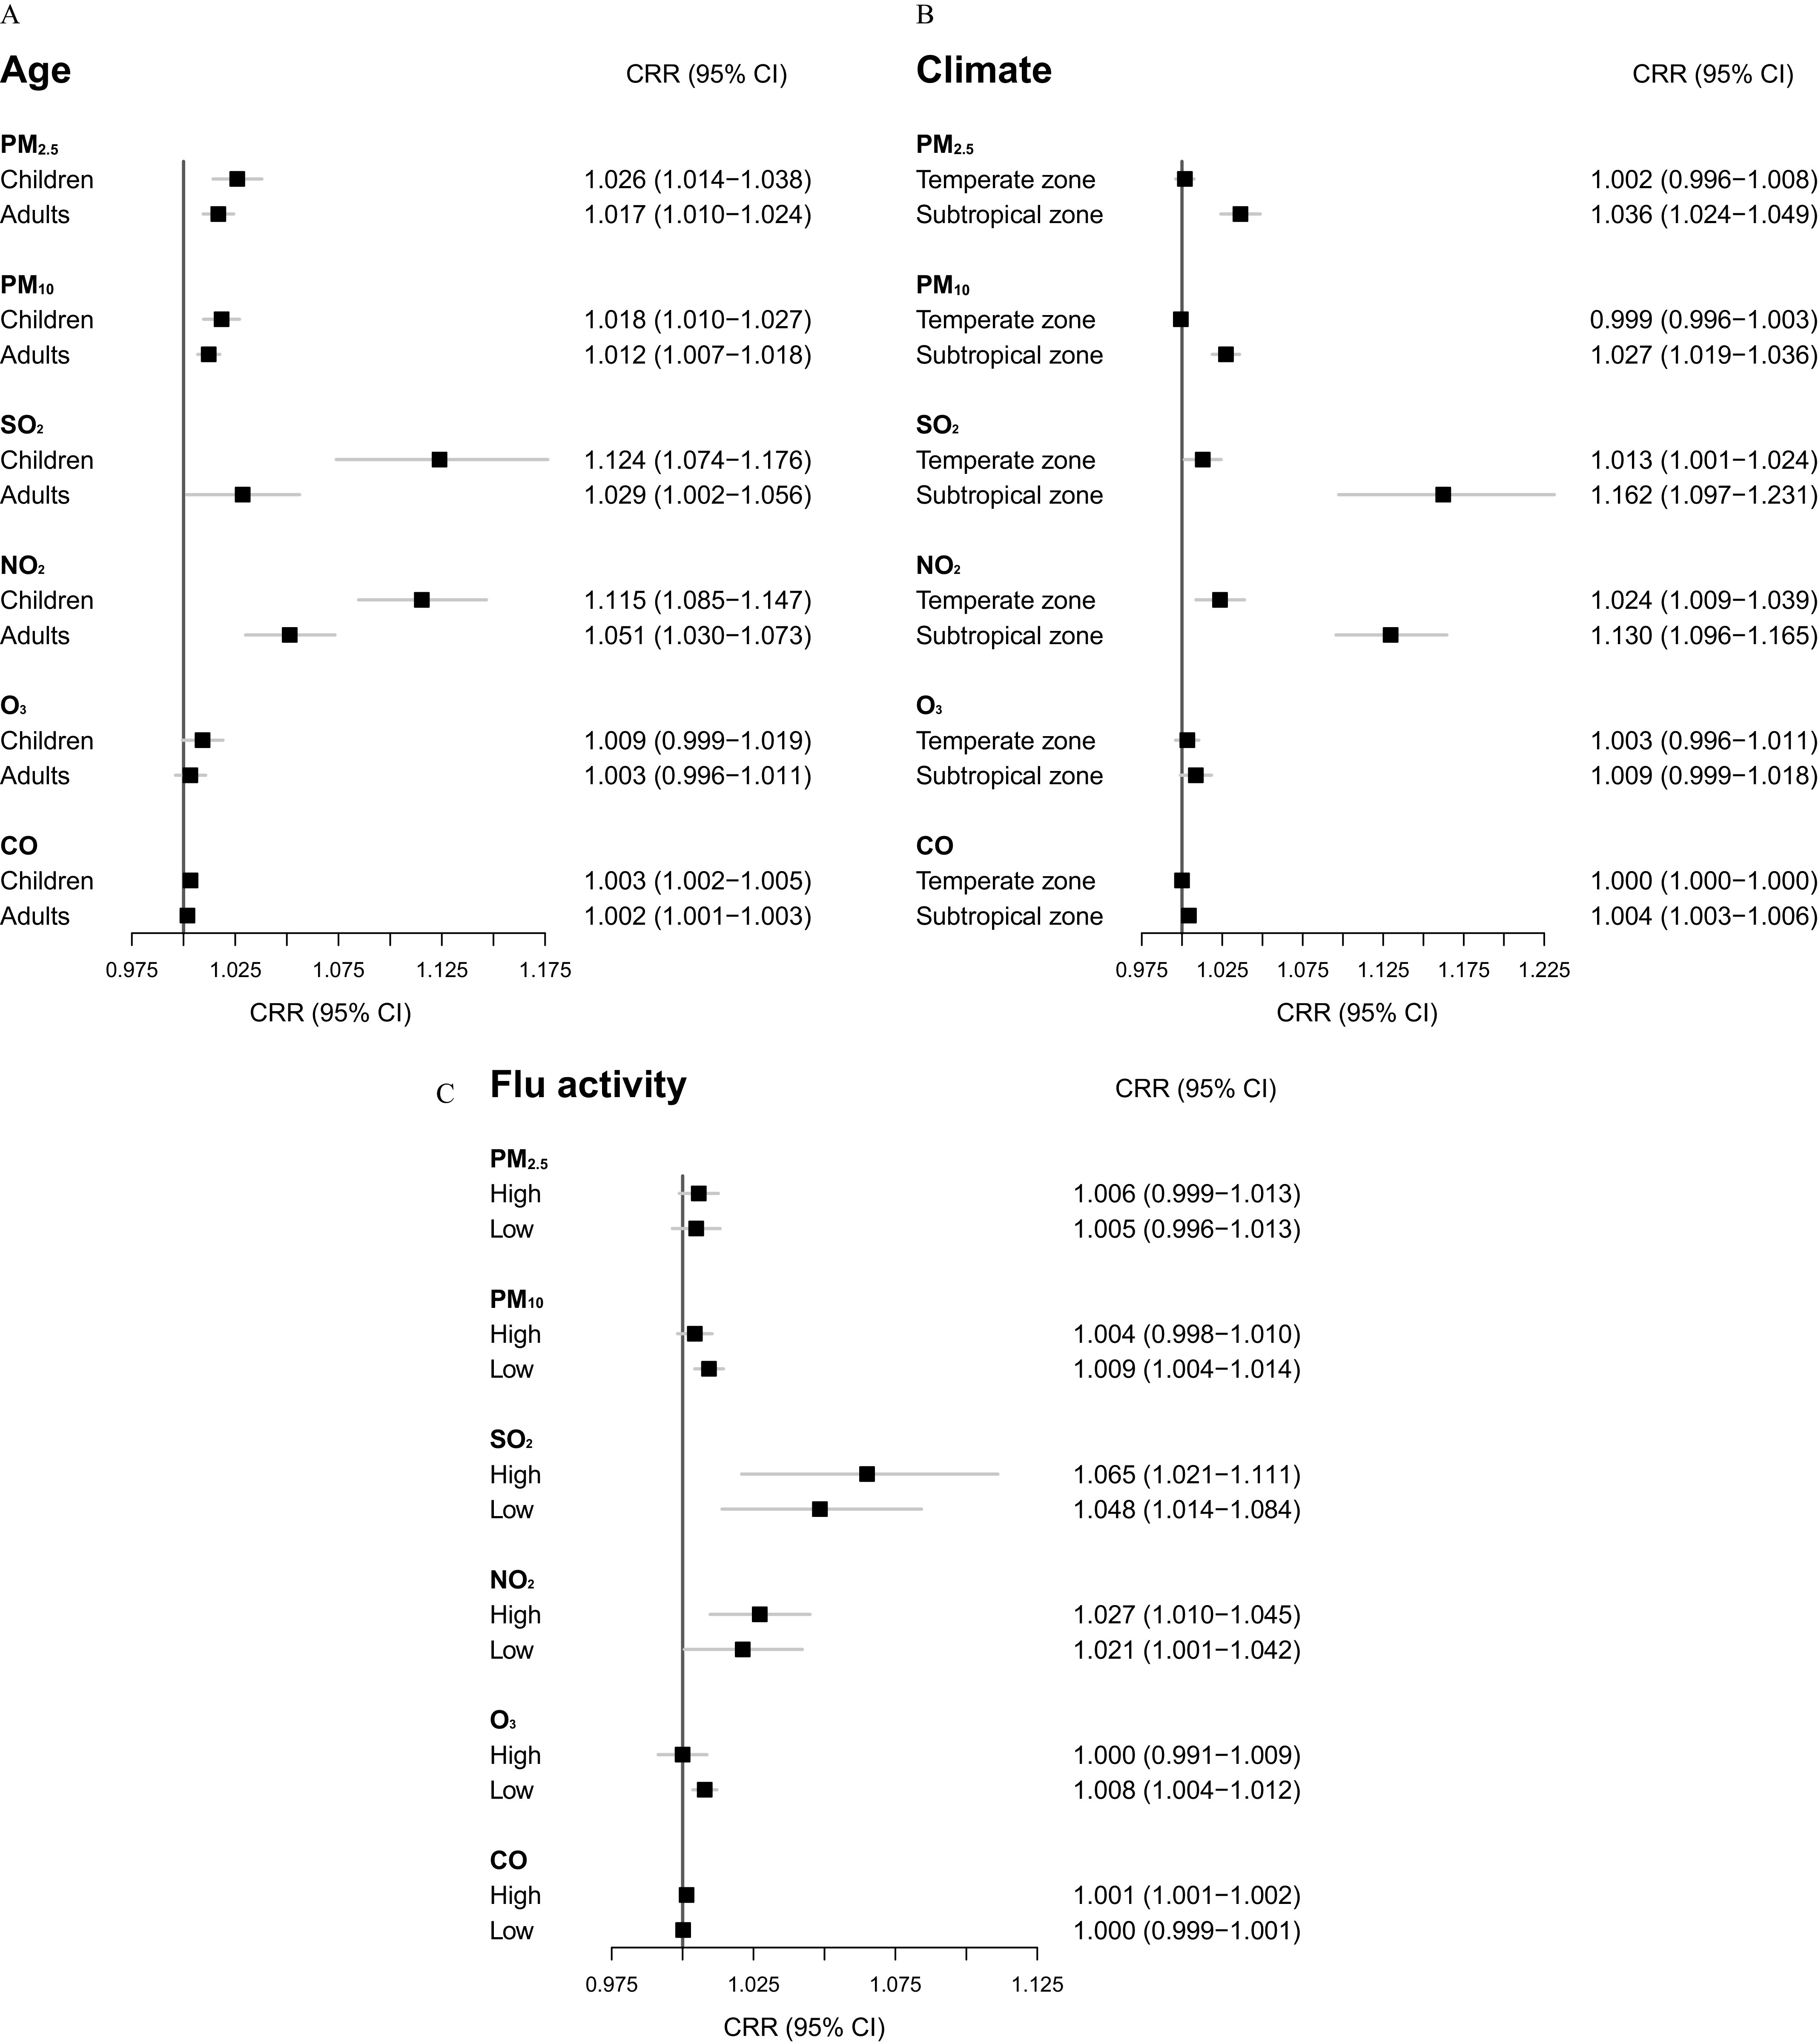
Forest plots comparing the associations of six air pollutants with the daily incidence of influenza cases between subgroups defined by (A) age group, (B) climate zone, and (C) season of flu activity based on single-pollutant distributed lag models. The associations are presented as the cumulative risk ratios per increase in the air pollutant concentration simultaneously at all the lags of 1–7 d prior to symptom onset for 3,735,934 cases reported from 2015 to 2019 in 82 cities in China. Note: CI, confidence interval; CO, carbon monoxide; CRR, cumulative risk ratio; , nitrogen dioxide; , ozone; PM, particulate matter; , sulfur dioxide.
We explored potential nonlinear concentration-incidence relationships by assuming a polynomial function with 3 df for the pollutant associations with influenza at each lag. Significant associations were also found for all air pollutants but (Figure 3; Excel Table S2). The concentration-incidence curves are steeper at lower concentration levels and become flatter as concentration increases for most air pollutants except for . Paired Wilcox test of the quasi-BIC values showed no significant differences between the linear models and nonlinear models (Table S8). Our findings are generally robust to changes in the degrees of freedom or length of lags for meteorological factors, the length of lags for the autocorrelation term, or the number of cites included in the analyses (Table S13).
Figure 3.
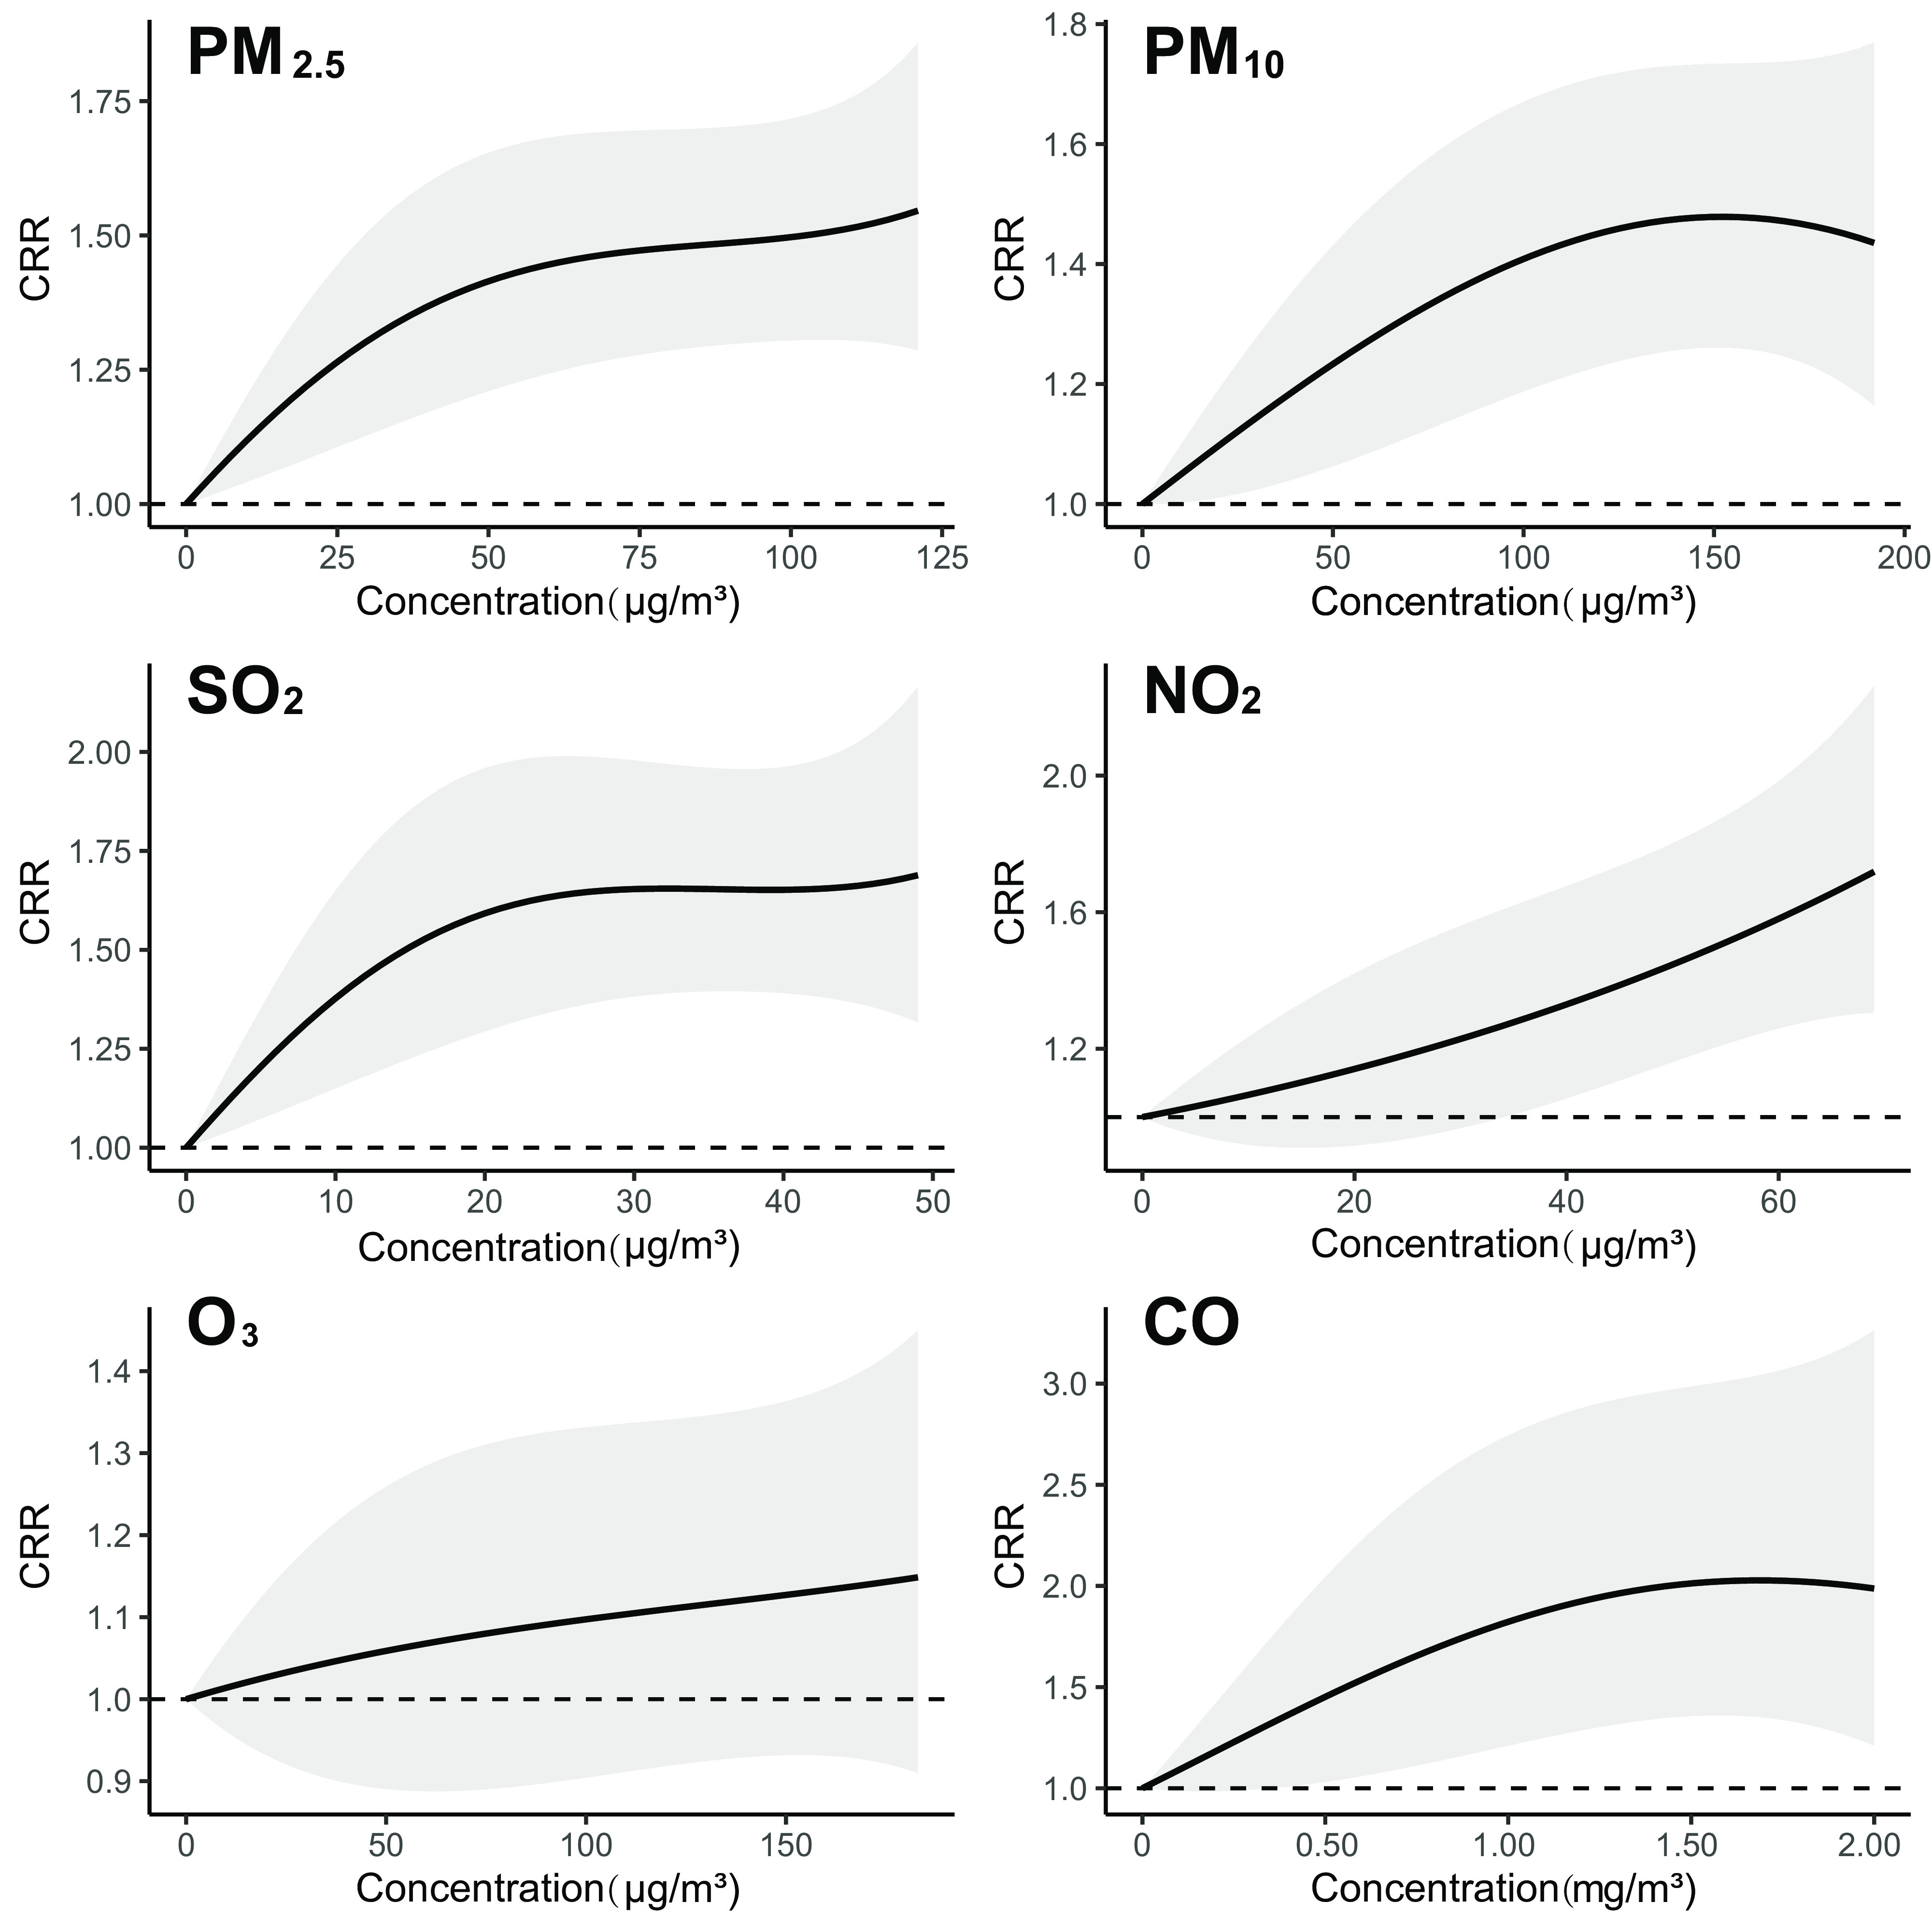
Nonlinear associations of six air pollutants with the daily incidence of influenza cases at different levels of concentration based on single-pollutant distributed lag models. The associations are presented as the cumulative risk ratios per increase in the air pollutant concentration simultaneously at all the lags of 1–7 d prior to symptom onset for 3,735,934 cases reported from 2015 to 2019 in 82 cities in China. The shaded areas represent the 95% CIs. Numeric data on CRR and CI for this figure can be found in Excel Table S2. Note: CI, confidence interval; CO, carbon monoxide; CRR, cumulative risk ratio; , nitrogen dioxide; , ozone; PM, particulate matter; , sulfur dioxide.
Discussion
The potential health associations of air pollution with influenza on congenital disabilities, cardiovascular diseases, and respiratory diseases have raised serious concerns in recent years. However, strong epidemiological evidence for an association between influenza and air pollution is rare. In this retrospective multicity longitudinal observational study, we examined the relationship between daily influenza incidence and six air pollutants in the mainland of China using a two-stage time series modeling approach. The 82 cities covered in this study are representative of cities in China with various characteristics, e.g., temperate vs. subtropical climate zones, megacities (e.g., Beijing and Shanghai) vs. small cities (e.g., Yingtan and Ma’anshan), and heavily polluted (e.g., Liaocheng, Xingtai) vs. lightly polluted (e.g., Kunming, Huangshan).
Our study demonstrated statistically significant associations of reported influenza incidence with , , , , and CO, in general agreement with previous studies.29,30 The association of air pollutants with influenza incidence were generally short-term and decay over longer lags (Figure S5), which is consistent with previous findings and could be explained by the relatively short incubation period (1–3 d) and serial interval of influenza (mean of 3.6 d).16,28,29 was the sole significant pollutant in the multipollutant model, indicating that the role of as the major contributor among all common air pollutants to the risk of influenza-related disease burden in China (Table 2). Conversely, these results do not preclude potential contributions of air pollutants other than to influenza incidence, which could have been masked in the multipollutant model due to the multicollinearity among the pollutants (Figure S8).
The mechanism behind the impact of air pollutants on influenza infection is likely complex and multifaceted. Previous studies have shown that air pollutants can disrupt the immunological barrier via oxidative stress and immune modulation, increase cell susceptibility to RNA viruses, reduce pulmonary function, or act as a transportation media of viruses.31–33 exposure has been reportedly associated with respiratory symptoms by both directly inducing inflammation of the airways and indirectly facilitating inhalation of allergens,34,35 supporting our finding that is the strongest predictor of influenza incidence among all common air pollutants.
The association between ozone exposure and acute respiratory infections, including influenza, has been controversial. Some studies reported a positive or no association between ozone exposure and influenza,36,37 while others found a negative association.16,29 In our study, while the descriptive correlation analysis indicates a negative association between ozone and influenza incidence (Figure 1B), our model adjusting for other potential confounders did not find a significant association in general. A slight positive association between ozone and influenza incidence was found in the warm months with low flu activity as well as in the subtropical zone based on the single-pollutant model (Figure 2). If this association is true, a potential reason is that, during the warm season, influenza is still active in the subtropical zone though the national average incidence is low. A higher temperature would increase the ozone concentration38 (Figure S1) and meanwhile drive people to cluster in air-conditioned indoor environments, creating a positive association. In addition, a mouse study suggested a high-level exposure to ozone may exacerbate the lung pathology due to influenza infection.39
We found a greater association of air pollution with influenza in children vs. adults, which is expected since children are more vulnerable to many respiratory infections, including influenza, than adults.13,40 Air pollutants were found to have a greater association with influenza incidence in subtropical cities where air pollution is generally mild compared to those in the temperate zone. In addition, the median annual pollution level was found to be an important modifier for the associations of air pollutants with influenza. Furthermore, the nonlinear concentration-incidence curves for most air pollutants imply that the risk increases at a higher rate at lower concentrations (Figure 3). Such patterns are consistent with a study on the impact of and on mortality at the global scale.23 The underlying mechanism is unclear, but possible reasons include the following: a) higher utilization of protective measures such as antismog masks against air pollution among residents in heavily polluted cities41 and b) more outdoor activities and thus higher exposure to ambient air pollutants in warmer areas.38,42,43 We also found an increased risk of influenza due to exposure to and during the cold months with high flu activity, in agreement with previous studies (Figure 2).5,44 Cold weather and low humidity during cold months have been associated with extended survivability of virus and bacteria in the environment,45 and the survivability might be related to the increased concentration of air pollutants in that season. Our results on attributable fractions are generally consistent with previous studies as well. For example, we estimated that 7.66% of the influenza incident cases in Guangzhou city were attributable to exposure, close to the 8.10% reported by Zhang et al.46 In general, the attributable fraction is higher in northern China where air pollution is heavier. For example, was found to contribute to 8.83% of influenza cases in Shanwei in the South but 41.11% in Xi’an in the Northwest.
This study has several limitations. First, due to the nature of ecological studies, these findings do not imply a causal link between exposure to air pollution and influenza transmission. Second, we were not able to study the impact of air pollution by type or subtype of influenza virus, as such information was not provided in the CISDCP dataset. Third, while we collected both clinically diagnosed and laboratory-confirmed influenza cases from CISDCP, the proportion of laboratory-confirmed cases among all reported cases was low in China (24.97% for the 82 cities during the study period), so misclassification and underreporting are possible.47 Fourth, we did not consider vaccination in the analyses, but the coverage rate of influenza vaccination was low () in China.48 Additionally, some air quality indicators such as , ammonia, and oxidative potential of air pollutants became popular in recent years, but these data are rarely available and were not available for this study.49,50 Finally, our data is limited to Chinese cities. Given that not all confounders are measured, our results may not be directly generalizable to other countries.
After witnessing its own environmental price paid for economic development and urbanization, China unveiled its landmark Atmospheric Pollution Prevention Action Plan in 2013 and began releasing real-time air pollution data. In recent years, air pollution has been successfully controlled in developed coastal areas, yet it remains a serious problem in some inland and northern provinces where emission-intensive industries are located or relocated.51 While challenges are expected given the substantial disparities in economic development, environment, and culture across these regions, more stringent air pollution control policies will not only reduce the burdens of chronic and acute diseases but also improve crop yields, climate, and the quality of ecological systems.52,53 Extending our approach, future studies may focus on the impact or cost-effectiveness of reducing air pollutants on a variety of notifiable diseases and advise policymakers on how to prioritize cities or regions for air pollution control and prevention.
Supplementary Material
Acknowledgments
L.Q.F., W.L., Y.Y., L.P.W., and X.L.L. conceived and designed the study. L.J.Y., X.L.L., Y.H.W., and H.Y.Z. performed the main data collection and analyses under supervision of L.Q.F., Y.Y., and W.L. L.J.Y., X.L.L., Y.H.W., H.Y.Z., S.M.R., B.G.J., Q.X., and Y.S.S. helped with the analyses. L.J.Y., X.L.L., Y.H.W., H.Y.Z. wrote the first draft, and W.L., L.Q.F., L.P.W., and Y.Y. helped with finalizing the manuscript. All authors contributed to and approved the final version of the manuscript.
This work was supported by Key Research and Development Program of China (2022YFC2303803); National Natural Science Foundation of China (91846302, 81825019); Open Funding of Key Laboratory of Environmental Sense Organ Stress and Health of the Ministry of Environmental Protection (19ZX83). The funders had no role in the design and conduct of the study; collection, management, analysis, and interpretation of the data; preparation, review, or approval of the manuscript; or decision to submit the manuscript for publication.
The relevant data of the model are provided in Excel Tables S3 and S4.
The R code of the models is provided in the supplemental data.
References
- 1.Feng W, Li H, Wang S, Van Halm-Lutterodt N, An J, Liu Y, et al. 2019. Short-term PM10 and emergency department admissions for selective cardiovascular and respiratory diseases in Beijing, China. Sci Total Environ 657:213–221, PMID: , 10.1016/j.scitotenv.2018.12.066. [DOI] [PubMed] [Google Scholar]
- 2.Huang F, Luo Y, Tan P, Xu Q, Tao L, Guo J, et al. 2017. Gaseous air pollution and the risk for stroke admissions: a case-crossover study in Beijing, China. Int J Environ Res Public Health 14(2):189, PMID: , 10.3390/ijerph14020189. [DOI] [PMC free article] [PubMed] [Google Scholar]
- 3.Su PF, Sie FC, Yang CT, Mau YL, Kuo S, Ou HT. 2020. Association of ambient air pollution with cardiovascular disease risks in people with type 2 diabetes: a Bayesian spatial survival analysis. Environ Health 19(1):110, PMID: , 10.1186/s12940-020-00664-0. [DOI] [PMC free article] [PubMed] [Google Scholar]
- 4.Zhang Z, Dong B, Li S, Chen G, Yang Z, Dong Y, et al. 2019. Exposure to ambient particulate matter air pollution, blood pressure and hypertension in children and adolescents: a national cross-sectional study in China. Environ Int 128:103–108, PMID: , 10.1016/j.envint.2019.04.036. [DOI] [PubMed] [Google Scholar]
- 5.Feng C, Li J, Sun W, Zhang Y, Wang Q. 2016. Impact of ambient fine particulate matter (PM2.5) exposure on the risk of influenza-like-illness: a time-series analysis in Beijing, China. Environ Health 15:17, PMID: , 10.1186/s12940-016-0115-2. [DOI] [PMC free article] [PubMed] [Google Scholar]
- 6.Xu Z, Hu W, Williams G, Clements AC, Kan H, Tong S. 2013. Air pollution, temperature and pediatric influenza in Brisbane, Australia. Environ Int 59:384–388, PMID: , 10.1016/j.envint.2013.06.022. [DOI] [PubMed] [Google Scholar]
- 7.Nhung NTT, Schindler C, Dien TM, Probst-Hensch N, Perez L, Künzli N. 2018. Acute effects of ambient air pollution on lower respiratory infections in Hanoi children: an eight-year time series study. Environ Int 110:139–148, PMID: , 10.1016/j.envint.2017.10.024. [DOI] [PubMed] [Google Scholar]
- 8.Martins LC, Latorre MDRDDO, Cardoso MRA, Goncalves FLT, Saldiva PHN, Braga ALF. 2002. [Air pollution and emergency room visits due to pneumonia and influenza in São Paulo, Brazil]. Rev Saude Publica 36(1):88–94, PMID: , 10.1590/s0034-89102002000100014. [DOI] [PubMed] [Google Scholar]
- 9.Chossière GP, Xu H, Dixit Y, Isaacs S, Eastham SD, Allroggen F, et al. 2021. Air pollution impacts of COVID-19-related containment measures. Sci Adv 7(21):eabe1178, PMID: , 10.1126/sciadv.abe1178. [DOI] [PMC free article] [PubMed] [Google Scholar]
- 10.Somayaji R, Neradilek MB, Szpiro AA, Lofy KH, Jackson ML, Goss CH, et al. 2020. Effects of air pollution and other environmental exposures on estimates of severe influenza illness, Washington, USA. Emerg Infect Dis 26(5):920–929, PMID: , 10.3201/eid2605.190599. [DOI] [PMC free article] [PubMed] [Google Scholar]
- 11.Chen G, Zhang W, Li S, Zhang Y, Williams G, Huxley R, et al. 2017. The impact of ambient fine particles on influenza transmission and the modification effects of temperature in China: a multi-city study. Environ Int 98:82–88, PMID: , 10.1016/j.envint.2016.10.004. [DOI] [PMC free article] [PubMed] [Google Scholar]
- 12.Liang Y, Fang L, Pan H, Zhang K, Kan H, Brook JR, et al. 2014. PM2.5 in Beijing - temporal pattern and its association with influenza. Environ Health 13:102, PMID: , 10.1186/1476-069X-13-102. [DOI] [PMC free article] [PubMed] [Google Scholar]
- 13.Huang L, Zhou L, Chen J, Chen K, Liu Y, Chen X, et al. 2016. Acute effects of air pollution on influenza-like illness in Nanjing, China: a population-based study. Chemosphere 147:180–187, PMID: , 10.1016/j.chemosphere.2015.12.082. [DOI] [PubMed] [Google Scholar]
- 14.Meng Y, Lu Y, Xiang H, Liu S. 2021. Short-term effects of ambient air pollution on the incidence of influenza in Wuhan, China: a time-series analysis. Environ Res 192:110327, PMID: , 10.1016/j.envres.2020.110327. [DOI] [PubMed] [Google Scholar]
- 15.Zeng W, Zhao H, Liu R, Yan W, Qiu Y, Yang F, et al. 2020. Association between NO2 cumulative exposure and influenza prevalence in mountainous regions: a case study from southwest China. Environ Res 189:109926, PMID: , 10.1016/j.envres.2020.109926. [DOI] [PMC free article] [PubMed] [Google Scholar]
- 16.Su W, Wu X, Geng X, Zhao X, Liu Q, Liu T. 2019. The short-term effects of air pollutants on influenza-like illness in Jinan, China. BMC Public Health 19(1):1319, PMID: , 10.1186/s12889-019-7607-2. [DOI] [PMC free article] [PubMed] [Google Scholar]
- 17.Liu XX, Li Y, Qin G, Zhu Y, Li X, Zhang J, et al. 2019. Effects of air pollutants on occurrences of influenza-like illness and laboratory-confirmed influenza in Hefei, China. Int J Biometeorol 63(1):51–60, PMID: , 10.1007/s00484-018-1633-0. [DOI] [PubMed] [Google Scholar]
- 18.Wang L, Wang Y, Jin S, Wu Z, Chin DP, Koplan JP, et al. 2008. Emergence and control of infectious diseases in China. Lancet 372(9649):1598–1605, PMID: , 10.1016/S0140-6736(08)61365-3. [DOI] [PMC free article] [PubMed] [Google Scholar]
- 19.Ministry of Ecology and Environment of the People’s Republic of China. 2016. Technical Regulation on Ambient Air Quality Index. https://www.mee.gov.cn/ywgz/fgbz/bz/bzwb/jcffbz/201203/t20120302_224166.shtml [accessed 1 January 2023].
- 20.China Meteorological Data Service Center. 2023. Temperature. https://data.cma.cn/article/getLeft/id/300/keyIndex/3.html [accessed 1 January 2023].
- 21.China Meteorological Data Service Center. 2023. Relative Humidity. https://data.cma.cn/article/getLeft/id/302/keyIndex/3.html [accessed 1 January 2023].
- 22.Gasparrini A. 2011. Distributed lag linear and non-linear models in R: the package dlnm. J Stat Soft 43(8):1–20, PMID: , 10.18637/jss.v043.i08. [DOI] [PMC free article] [PubMed] [Google Scholar]
- 23.Liu C, Chen R, Sera F, Vicedo-Cabrera AM, Guo Y, Tong S, et al. 2019. Ambient particulate air pollution and daily mortality in 652 cities. N Engl J Med 381(8):705–715, PMID: , 10.1056/NEJMoa1817364. [DOI] [PMC free article] [PubMed] [Google Scholar]
- 24.Chen G, Zhang Y, Zhang W, Li S, Williams G, Marks GB, et al. 2017. Attributable risks of emergency hospital visits due to air pollutants in China: a multi-city study. Environ Pollut 228:43–49, PMID: , 10.1016/j.envpol.2017.05.026. [DOI] [PubMed] [Google Scholar]
- 25.Imai C, Armstrong B, Chalabi Z, Mangtani P, Hashizume M. 2015. Time series regression model for infectious disease and weather. Environ Res 142:319–327, PMID: , 10.1016/j.envres.2015.06.040. [DOI] [PubMed] [Google Scholar]
- 26.Partlett C, Riley RD. 2017. Random effects meta-analysis: coverage performance of 95% confidence and prediction intervals following REML estimation. Stat Med 36(2):301–317, PMID: , 10.1002/sim.7140. [DOI] [PMC free article] [PubMed] [Google Scholar]
- 27.Gasparrini A, Leone M. 2014. Attributable risk from distributed lag models. BMC Med Res Methodol 14:55, PMID: , 10.1186/1471-2288-14-55. [DOI] [PMC free article] [PubMed] [Google Scholar]
- 28.Cowling BJ, Fang VJ, Riley S, Malik Peiris JS, Leung GM. 2009. Estimation of the serial interval of influenza. Epidemiology 20(3):344–347, PMID: , 10.1097/EDE.0b013e31819d1092. [DOI] [PMC free article] [PubMed] [Google Scholar]
- 29.Yang J, Yang Z, Qi L, Li M, Liu D, Liu X, et al. 2023. Influence of air pollution on influenza-like illness in China: a nationwide time-series analysis. EBioMedicine 87:104421, PMID: , 10.1016/j.ebiom.2022.104421. [DOI] [PMC free article] [PubMed] [Google Scholar]
- 30.Tang S, Yan Q, Shi W, Wang X, Sun X, Yu P, et al. 2018. Measuring the impact of air pollution on respiratory infection risk in China. Environ Pollut 232:477–486, PMID: , 10.1016/j.envpol.2017.09.071. [DOI] [PubMed] [Google Scholar]
- 31.Ciencewicki J, Jaspers I. 2007. Air pollution and respiratory viral infection. Inhal Toxicol 19(14):1135–1146, PMID: , 10.1080/08958370701665434. [DOI] [PubMed] [Google Scholar]
- 32.Mishra R, Krishnamoorthy P, Gangamma S, Raut AA, Kumar H. 2020. Particulate matter (PM10) enhances RNA virus infection through modulation of innate immune responses. Environ Pollut 266(pt 1):115148, PMID: , 10.1016/j.envpol.2020.115148. [DOI] [PMC free article] [PubMed] [Google Scholar]
- 33.Loaiza-Ceballos MC, Marin-Palma D, Zapata W, Hernandez JC. 2022. Viral respiratory infections and air pollutants. Air Qual Atmos Health 15(1):105–114, PMID: , 10.1007/s11869-021-01088-6. [DOI] [PMC free article] [PubMed] [Google Scholar]
- 34.Sandström T, Stjernberg N, Eklund A, Ledin MC, Bjermer L, Kolmodin-Hedman B, et al. 1991. Inflammatory cell response in bronchoalveolar lavage fluid after nitrogen dioxide exposure of healthy subjects: a dose-response study. Eur Respir J 4(3):332–339, PMID: , 10.1183/09031936.93.04030332. [DOI] [PubMed] [Google Scholar]
- 35.Tunnicliffe WS, Burge PS, Ayres JG. 1994. Effect of domestic concentrations of nitrogen dioxide on airway responses to inhaled allergen in asthmatic patients. Lancet 344(8939–8940):1733–1736, PMID: , 10.1016/s0140-6736(94)92886-x. [DOI] [PubMed] [Google Scholar]
- 36.Zhang R, Meng Y, Song H, Niu R, Wang Y, Li Y, et al. 2021. The modification effect of temperature on the relationship between air pollutants and daily incidence of influenza in Ningbo, China. Respir Res 22(1):153, PMID: , 10.1186/s12931-021-01744-6. [DOI] [PMC free article] [PubMed] [Google Scholar]
- 37.Li X, Xu J, Wang W, Liang JJ, Deng ZH, Du J, et al. 2021. Air pollutants and outpatient visits for influenza-like illness in Beijing, China. PeerJ 9:e11397, PMID: , 10.7717/peerj.11397. [DOI] [PMC free article] [PubMed] [Google Scholar]
- 38.Mccurdy T, Graham SE. 2003. Using human activity data in exposure models: analysis of discriminating factors. J Expo Anal Environ Epidemiol 13(4):294–317, PMID: , 10.1038/sj.jea.7500281. [DOI] [PubMed] [Google Scholar]
- 39.Selgrade MK, Illing JW, Starnes DM, Stead AG, Ménache MG, Stevens MA. 1988. Evaluation of effects of ozone exposure on influenza infection in mice using several indicators of susceptibility. Fundam Appl Toxicol 11(1):169–180, PMID: , 10.1016/0272-0590(88)90280-1. [DOI] [PubMed] [Google Scholar]
- 40.Ye T, Guo Y, Chen G, Yue X, Xu R, Coêlho M, et al. 2021. Risk and burden of hospital admissions associated with wildfire-related PM2.5 in Brazil, 2000-15: a nationwide time-series study. Lancet Planet Health 5(9):e599–e607, PMID: , 10.1016/S2542-5196(21)00173-X. [DOI] [PubMed] [Google Scholar]
- 41.Zhang J, Mu Q. 2018. Air pollution and defensive expenditures: evidence from particulate-filtering facemasks. J Environ Econ Manage 92:517–536, 10.1016/j.jeem.2017.07.006. [DOI] [Google Scholar]
- 42.Chen R, Zhou B, Kan H, Zhao B. 2013. Associations of particulate air pollution and daily mortality in 16 Chinese cities: an improved effect estimate after accounting for the indoor exposure to particles of outdoor origin. Environ Pollut 182:278–282, PMID: , 10.1016/j.envpol.2013.07.024. [DOI] [PubMed] [Google Scholar]
- 43.Chen R, Yin P, Meng X, Wang L, Liu C, Niu Y, et al. 2019. Associations between coarse particulate matter air pollution and cause-specific mortality: a nationwide analysis in 272 Chinese cities. Environ Health Perspect 127(1):17008, PMID: , 10.1289/EHP2711. [DOI] [PMC free article] [PubMed] [Google Scholar]
- 44.Barnett AG, Williams GM, Schwartz J, Neller AH, Best TL, Petroeschevsky AL, et al. 2005. Air pollution and child respiratory health: a case-crossover study in Australia and New Zealand. Am J Respir Crit Care Med 171(11):1272–1278, PMID: , 10.1164/rccm.200411-1586OC. [DOI] [PubMed] [Google Scholar]
- 45.Mäkinen TM, Juvonen R, Jokelainen J, Harju TH, Peitso A, Bloigu A, et al. 2009. Cold temperature and low humidity are associated with increased occurrence of respiratory tract infections. Respir Med 103(3):456–462, PMID: , 10.1016/j.rmed.2008.09.011. [DOI] [PubMed] [Google Scholar]
- 46.Zhang R, Lai KY, Liu W, Liu Y, Lu J, Tian L, et al. 2022. Community-level ambient fine particulate matter and seasonal influenza among children in Guangzhou, China: a Bayesian spatiotemporal analysis. Sci Total Environ 826:154135, PMID: , 10.1016/j.scitotenv.2022.154135. [DOI] [PubMed] [Google Scholar]
- 47.Qin K, Zhang Y, Zhang P, L Y, Ma J. 2019. Comparing the timelines of three types of influenza surveillance data in mainland China. Chin J Dis Control Prev 23(04):387–391, 10.16462/j.cnki.zhjbkz.2019.04.004. [DOI] [Google Scholar]
- 48.Wang Q, Yue N, Zheng M, Wang D, Duan C, Yu X, et al. 2018. Influenza vaccination coverage of population and the factors influencing influenza vaccination in mainland China: a meta-analysis. Vaccine 36(48):7262–7269, PMID: , 10.1016/j.vaccine.2018.10.045. [DOI] [PubMed] [Google Scholar]
- 49.Daellenbach KR, Uzu G, Jiang J, Cassagnes LE, Leni Z, Vlachou A, et al. 2020. Sources of particulate-matter air pollution and its oxidative potential in Europe. Nature 587(7834):414–419, PMID: , 10.1038/s41586-020-2902-8. [DOI] [PubMed] [Google Scholar]
- 50.Chen G, Li S, Zhang Y, Zhang W, Li D, Wei X, et al. 2017. Effects of ambient PM1 air pollution on daily emergency hospital visits in China: an epidemiological study. Lancet Planet Health 1(6):e221–e229, PMID: , 10.1016/S2542-5196(17)30100-6. [DOI] [PubMed] [Google Scholar]
- 51.Wang H, Zhang Y, Zhao H, Lu X, Zhang Y, Zhu W, et al. 2017. Trade-driven relocation of air pollution and health impacts in China. Nat Commun 8(1):738, PMID: , 10.1038/s41467-017-00918-5. [DOI] [PMC free article] [PubMed] [Google Scholar]
- 52.Lobell DB, Di Tommaso S, Burney JA. 2022. Globally ubiquitous negative effects of nitrogen dioxide on crop growth. Sci Adv 8(22):eabm9909, PMID: , 10.1126/sciadv.abm9909. [DOI] [PMC free article] [PubMed] [Google Scholar]
- 53.Lovett GM, Tear TH, Evers DC, Findlay SE, Cosby BJ, Dunscomb JK, et al. 2009. Effects of air pollution on ecosystems and biological diversity in the Eastern United States. Ann NY Acad Sci 1162:99–135, PMID: , 10.1111/j.1749-6632.2009.04153.x. [DOI] [PubMed] [Google Scholar]
Associated Data
This section collects any data citations, data availability statements, or supplementary materials included in this article.