

Abstract
The state-of-the-art in two new ambient ionization methods for mass spectrometry, desorption electrospray ionization (DESI) and paper spray (PS), is described and their utility is illustrated with new studies on tissue imaging and biofluid analysis. DESI is an ambient ionization method that can be performed on untreated histological sections of biological tissue in the open lab environment to image lipids, fatty acids, hormones and other compounds. Paper spray is performed in the open lab too; it involves electrospraying dry blood spots or biofluid deposits from a porous medium. PS is characterized by extreme simplicity and speed: a spot of whole blood or other biofluid is analyzed directly from paper, simply by applying a high voltage to the moist paper.
Both methods are being developed for use in diagnostics as a means to inform therapy. DESI imaging is applied to create molecular maps of tissue sections without prior labeling or other sample preparation. Like other methods of mass spectrometry imaging (MSI), it combines the chemical speciation of multiple analytes with information on spatial distributions. DESI imaging provides valuable information which correlates with the disease state of tissue as determined by standard histochemical methods. Positive-ion data are presented which complement previously reported negative-ion data on paired human bladder cancerous and adjacent normal tissue sections from 20 patients. These data add to the evidence already in the literature demonstrating that differences in the distributions of particular lipids contain disease-diagnostic information. Multivariate statistical analysis using principal component analysis (PCA) is used to analyze the imaging MS data, and so confirm differences between the lipid profiles of diseased and healthy tissue types. As more such data is acquired, DESI imaging has the potential to be a diagnostic tool for future cancer detection in situ; this suggests a potential role in guiding therapy in parallel with standard histochemical and immunohistological methods.
The PS methodology is aimed at high-throughput clinical measurement of quantitative levels of particular therapeutic agents in blood and other biofluids. The experiment allows individual drugs to be quantified at therapeutic levels and data is presented showing quantitative drug analysis from mixtures of therapeutic drugs in whole blood. Data on cholesterol sulfate, a new possible prostate biomarker seen at elevated levels in diseased prostate tissue, but not in healthy prostate tissue in serum are reported using paper spray ionization.
1. General introduction
This study covers the implications for disease diagnostics of two new mass spectrometry experiments, both of which employ ambient ionization, i.e. ionization of samples in their native state in the open environment. One method, DESI, is used in the imaging mode to characterize the distribution of small molecules—especially fatty acids and phospholipids—in tissue sections. DESI imaging studies presented here focus on the detection of positively charged ions, a measurement that provides complementary information to that obtained from the more conventional negative-ion data.
The second method, paper spray ionization, is used to examine biofluids rapidly and quantitatively. Quantitation relies on the ability to add an internal standard to the sample, or more realistically to the solvent used in the experiment or the paper substrate itself. The capabilities of the methodology are tested in the case of mixtures of therapeutic drugs in blood.
Current types of mass spectrometers are not optimized for high-throughput clinical measurements of therapeutics and/or endogenous compounds in blood and other biofluids, so smaller purpose-built instrumentation is needed. The current capabilities of hand-held mass spectrometers are therefore briefly described in the last section of the paper which also deals with their adaptation to high-throughput clinical applications. These instruments, after further adaptation to improve ion transport through air from the sampling point to the (distant) mass spectrometer, also have the potential to allow real-time in situ analysis of tissue during surgery to provide diagnostic information that will guide the surgeon.
2. Desorption electrospray ionization imaging and disease diagnosis
2.1. Introduction to DESI imaging for disease diagnosis
Mass spectrometry imaging (MSI) is a well established technique for surface analysis which combines chemical speciation of multiple analytes with information on their spatial distribution. After the entire surface is scanned, specific compounds can be selected from the set of mass spectra collected and their spatial distribution visualized by the creation of chemical images.1,2 Traditional methods for MSI, such as secondary-ion mass spectrometry (SIMS) and matrix-assisted laser desorption/ionization (MALDI), require a high vacuum and the addition of matrices to the sample. However, new ambient ionization technologies have been introduced in which sampling and ionization are performed outside of the mass spectrometer at atmospheric pressure without the requirement of application of a matrix or any other sample pre-treatment.3–6
In desorption electrospray ionization (DESI), a stream of charged droplets hits the surface creating a thin film that dissolves the analytes. Subsequent droplets splash into this film forming secondary microdroplets. The secondary microdroplets containing the analytes follow the conventional desolvation processes of electrospray ionization as they move into the mass spectrometer. This DESI mechanism known as “droplet pick-up”3 is supported by simulations and a range of experimental evidence. DESI imaging capabilities have been demonstrated for different types of samples and surfaces.7 For instance, the direct analysis of illicit drugs on latent fingerprints and the characterization of inks in documents of questionable provenance have been reported.8,9 Analysis of lipids of many classes in rat brain was demonstrated after partial separation by thin-layer chromatography.10 Recent applications to biological tissues include three-dimensional visualization of mouse brain structure by lipid analysis;11 investigation of catecholamines in adrenal glands;12 and analysis and imaging of rat spinal cord cross-sections.13,14
The application of DESI imaging for discrimination between healthy and diseased tissue using their distinct glycerophospholipid (GP) profiles has been demonstrated and the encouraging reported results indicate that DESI imaging has the potential to become a powerful tool in molecular pathology. DESI-MS is advantageous because it provides histopathological information without the requirement of sample preparation such as staining or labeling as normally used in histochemical protocols. Alterations in the composition of polar lipids, such as glycerophospholipids, are known to occur in certain malignant diseases.14–16 There are many un-met needs in disease diagnosis and management including that for improved methods to accurately diagnose and stage a disease and to define tumor margins. It has been previously established that the lipid profile of tissues changes during disease and these changes provide information on the underlying biology of cancer that have the potential to be useful in disease diagnosis and management.14,17–19 As medicine advances towards more personalized forms, lipids are likely to provide increasingly important information on the state of individual health.
DESI-MS imaging of biological tissue samples was initially applied systematically to studies of animal tissues, although the very first application was achieved in a human liver sample.20 In this case, the GP profiles allowed discrimination between healthy and diseased tissues as well as the location of the border region.20 While the potential for DESI-MS imaging to distinguish cancerous from normal tissues was clear, additional studies with a larger and more diverse cohort were needed to validate these capabilities. DESI-MS imaging has also been applied to canine bladder cancerous and adjacent normal tissues and successfully distinguished tumor from normal tissue on the basis of multiple marker lipids.21 Following these initial studies in dog bladder transitional cell carcinoma, experiments were conducted using human bladder cancerous tissues. Tissue samples from 20 different patients encompassing tumor and adjacent normal tissue from each patient were imaged using DESI-MS.22 Hand-selected ion images were created show-casing the differences between the tissue types as observed by the absolute and relative intensities of particular GP species recorded in the negative ion mode. These GP distributions function as molecular markers of disease and allow for a clear visual distinction between cancerous and normal tissues. Validation of DESI-MS diagnostic results was obtained by pathological examination of serial tissue sections stained with hematoxylin and eosin (H&E).
Multivariate statistical analyses were used to visualize and create a diagnosis rule for the tissue sections, using the methods of principal component analysis (PCA) and partial-least-squares discriminate analysis (PLS-DA). The statistical methods rely on the entire collection of mass spectral data acquired, not simply on selected ion images. The DESI-MS ion images correlate with the statistically generated images, which correlate in turn with the pathological diagnosis in over 80% of the cases in this one small study.22 Human prostate cancer tissue specimens were also examined by DESI-MS imaging in the negative-ion mode. When examining prostate tissues from 34 different patients the GP profiles of the tissue sections did not provide a means by which to classify the tissue samples. Nevertheless, in this case a unique single molecule, cholesterol sulfate (CS), was found to be over expressed in precancerous lesions or cancerous tissue and undetected in normal tissue, providing a simpler approach to diagnosis.23 Many biological roles for CS in prostate cancer progression have been hypothesized, including its ability to influence cell signaling, cellular differentiation and apoptosis.24–26
2.2. Methods
2.2.1. Biological sample preparation and cryosectioning.
All tissue samples were handled in accordance with approved institutional review board (IRB) protocols at Indiana University School of Medicine. They were flash frozen in liquid nitrogen and stored at −80 °C until sliced into 15 μm thick sections and thaw mounted onto glass slides. The slides were stored at −80 °C; prior to analysis they were allowed to come to room temperature and then dried under nitrogen in a dessicator for approximately 20 min. Serial sections were formalin fixed and subsequently stained using H&E for pathological examination.
2.2.2. DESI-MS 2D imaging and statistical analysis.
The DESI ion source used in our experiments was a lab-built prototype, configured as described previously.27 Optimization involved obtaining a small and uniform spray spot on the sample surface. The spray solvent used for MS acquisition was methanol–water (50 : 50) with a 5 kV spray voltage applied. Acetonitrile was purchased from Sigma-Alrich (St. Louis, MO, USA) and water (18.2 MΩ cm) was from a PureLab ultra system by Elga LabWater (High Wycombe, UK). The nitrogen gas pressure was 150 psi and the solvent flow rate was 1.5 μL min−1. In the imaging experiments, the tissues were scanned using a 2D moving stage in horizontal rows separated by a 250 μm vertical step until the entire sample surface had been assayed. The surface moving stage included an XYZ integrated linear stage (Newport, Richmond, CA) and a rotary stage (Parker Automation, Irwin, PA). All experiments were carried out using a LTQ linear-ion-trap mass spectrometer controlled by XCalibur 2.0 software (Thermo Fisher Scientific, San Jose, CA, USA). An in-house program allowed the conversion of the XCalibur 2.0 mass spectra files (.raw) into a format compatible with the Biomap software (freeware, http://www.maldo-msi.org). Spatially accurate images were assembled using the BioMap software. The color scale is normalized to the most intense (100% relative intensity) peak in the mass spectra.
For statistical method development, these 20 tissue pairs were randomly divided in half with 10 samples in the training set, and with the other 10 samples in the validation set used to test the accuracy of the statistical method. For this statistical analysis, 10 representative, individual spectra were acquired from both known tumor and normal regions of the 10 samples in the training set, excluding background regions of glass slide. The validation set used the full mass spectral imaging data, with no manual manipulation, for each sample to construct synthetic images. Data were processed as described below in Matlab 2008a, The MathWorks (Natick, MA, USA).
2.3. Results and discussion
While the focus of previous work on human cancer tissue imaging using DESI has involved negative-ion mode data, mass spectrometric analysis can also be conducted in the positive-ion mode. Multiple marker lipids observed in the positive-ion mode were found to distinguish canine bladder cancerous tissue from adjacent normal tissue.21 By imaging in the positive-ion mode important lipid species, such as glycerophosphocholines and sphingolipids are more readily detected by DESI-MS. By performing positive- and negative-mode analysis the total number of species that can be detected greatly increases, as does the confidence of the diagnosis by relying on multi-modal pattern recognition.
Paired human bladder cancer and adjacent normal tissue sections from 20 patients (40 tissues total) were imaged in the positive-ion mode using DESI-MS. By using paired tissue samples differences inherent within different patients are minimized. A series of DESI-MS ion images, showing the distribution of one particular m/z value across the sample, were hand selected to visualize the differences in relative abundances between cancerous and normal tissue. While a few ions were selected for convenience of visualization, the mass spectrum obtained for each pixel shows that the absolute intensity of a variety of ions changes between the cancerous and normal tissues. This showcases the need for multivariate statistical methods in order to base the diagnosis on all species present in the spectra. Fig. 1(a) and (b) shows representative positive-ion mass spectra for cancerous and normal tissue, respectively. While it is not necessary to chemically identify each species contributing to the diagnostic pattern in the mass spectrum, the main GPs observed were identified based on collision induced dissociation (CID) tandem MS experiments and comparison of the generated product ion spectra with the literature.28–30 The analyses reported here focus on glycerophosphocholines (PC) and their adducts, and while additional compounds are labeled in the spectra featured in Fig. 1, only a few selected ion images are shown. These images are compared to serial tissue sections which were stained with H&E and examined by a certified pathologist for diagnosis.
Fig. 1.
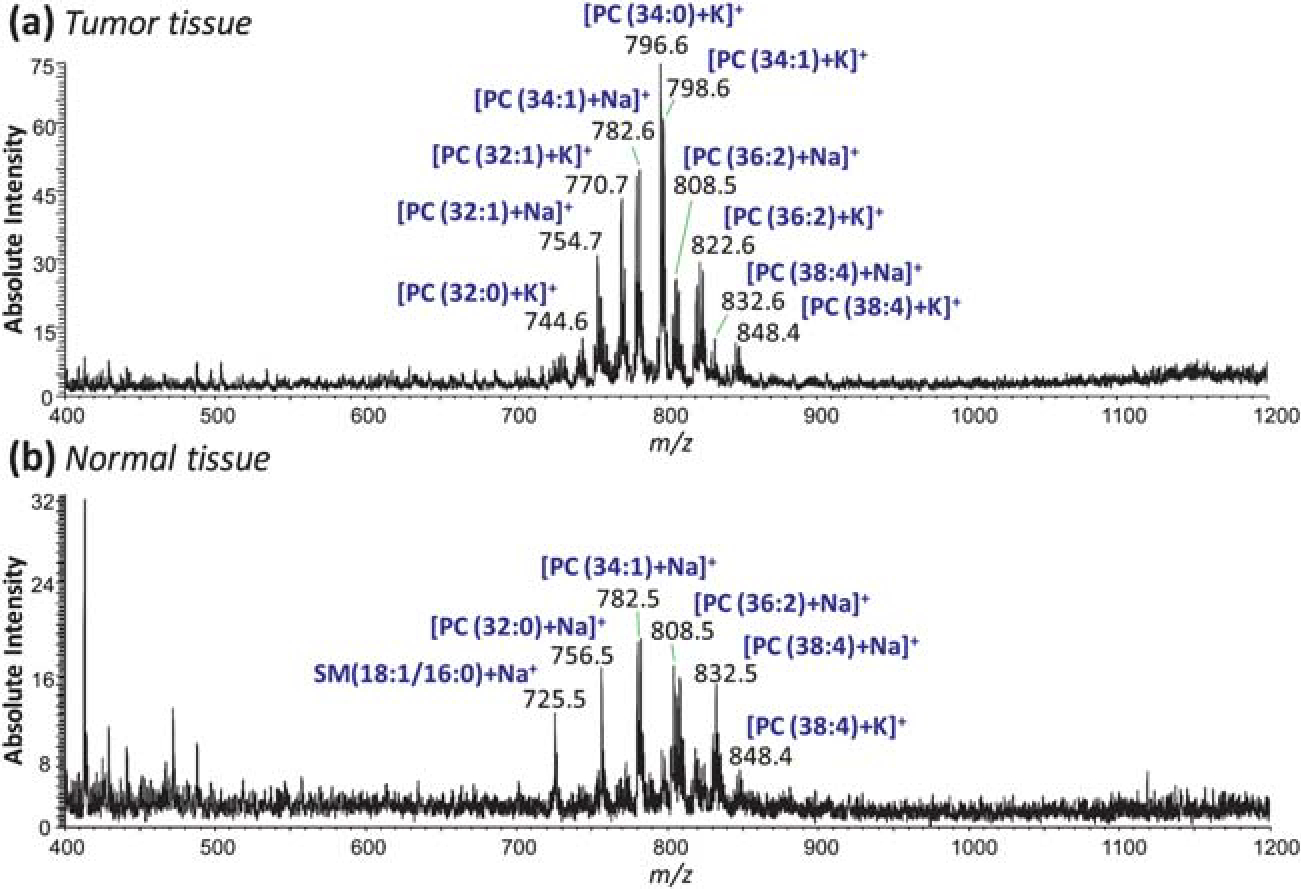
Typical positive-ion mode mass spectra of human bladder (a) tumor tissue and (b) adjacent normal tissue in the m/z range 400–1200.
Principal component analysis (PCA) was employed as a visualization approach to the description of the disease state of the tissue. PCA is a simple unsupervised data dimensionality reduction method. In this case it is used to reduce a large library of mass spectra to small set of principal components, or linear, orthogonal combinations of DESI peaks. Spectra are acquired from known tumor and normal regions from patient samples and partitioned into a training and validation set. Each set then includes tumor and normal spectra from half the set of patients. Example average tumor and normal spectra belonging to a training set are shown in Fig. 2(a). These data originate from positive-ion mode bladder cancer section analysis, as previously described. After normalization to the median area under the curve (AUC), PCA is run on the whole training set. Typically, the first principal component [PC1, Fig. 2(b)] is found to separate tumor and normal regions of tissue, as shown in the PC1/PC2 score plot [Fig. 2(c)]. This vector is the weighted set of DESI peaks which indicate the existence of tumor. The validation set may then be projected onto the principal components to confirm the separation along the PC1 coordinate [Fig. 2(d)]. After the set of principal components is generated, full images belonging to the validation set are projected onto the training set of principal components. The projection, or loadings, of each pixel along the PC1 coordinate are plotted on an x,y cartesian coordinate system identical to that used when rastering in the DESI imaging procedure. The pixel loadings are color coded linearly from blue to red. Red pixels are then regions of tissue whose mass spectra are predicted to be tumor, based on the high contribution of the PC1 coordinate. The result is a simple but powerful visual approach for the determination of likely regions of tumor on a surface in an unsupervised fashion. This method has now been applied to a variety of samples, including canine and human bladder, prostate and kidney in both negative- and positive-ion modes.
Fig. 2.
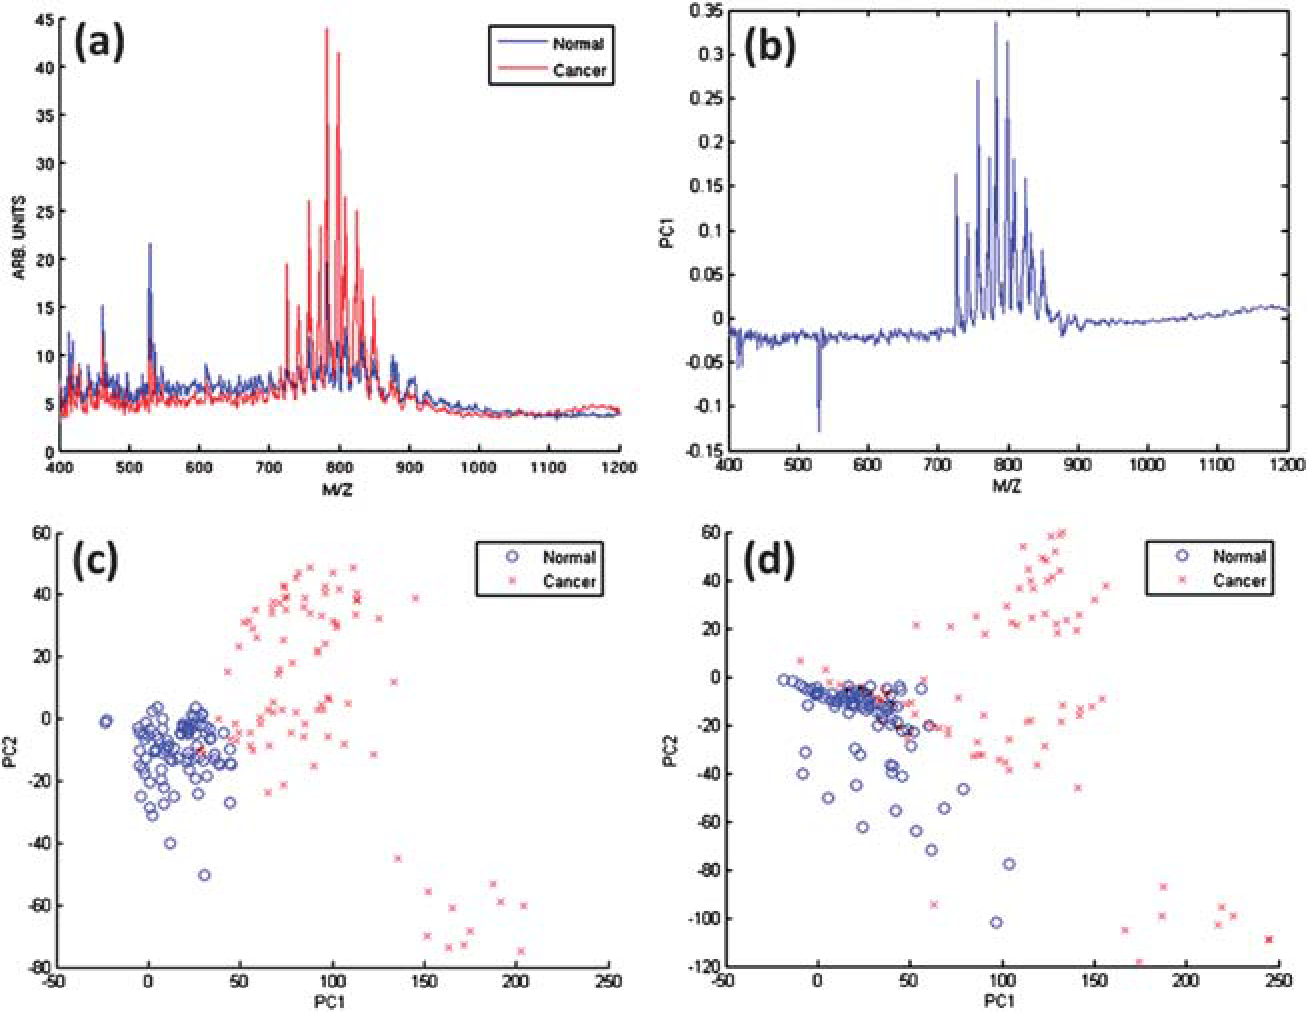
Principal component analysis results. (a) Average tumor and normal spectra from the training set that were used as inputs for PCA. The spectra are resampled to unit resolution, background-corrected, and scaled to the median area under the curve for all spectra. (b) PC1 eigenvector. PC1/PC2 score plot for (c) training data set and for (d) validation data set projected onto the training set principal component eigenvectors.
The DESI-MS ion images along with the optically scanned H&E stained tissue section and the synthetic PCA images for two bladder tissue pairs, UH00010–19 and UH0105–26, are shown in Fig. 3. The selected-ion images for both tissue samples show increased intensities in the tumor tissue for the ions at m/z 770.6 (PC(32 : 1) + K+), m/z 782.6 (PC(34 : 1) + Na+) and m/z 798.6 (PC(34 : 1) + K+), Fig. 3(a)–(c) and (f)–(h). This correlates with the diagnosis obtained from the H&E stained tissue sections. The synthetic PCA image is shown in Fig. 3(e) for UH0010–19 and in Fig. 3(j) for UH0105–26. These PCA images also correlate with the DESI-MS ion images and the H&E stained tissue. This presentation method has advantages over hand-selected ion images and also increases the confidence of diagnosis by relying on more ion species. Interestingly these results are in line with what has been reported previously in canine bladder cancer.21 Some of the same lipid species present at increased levels here in human bladder cancer were also found to be increased in canine bladder cancer, including PC(34 : 1) + Na+, and PC(34 : 1) + K+. This is not unexpected considering the similarities between canine and human bladder cancer.31
Fig. 3.
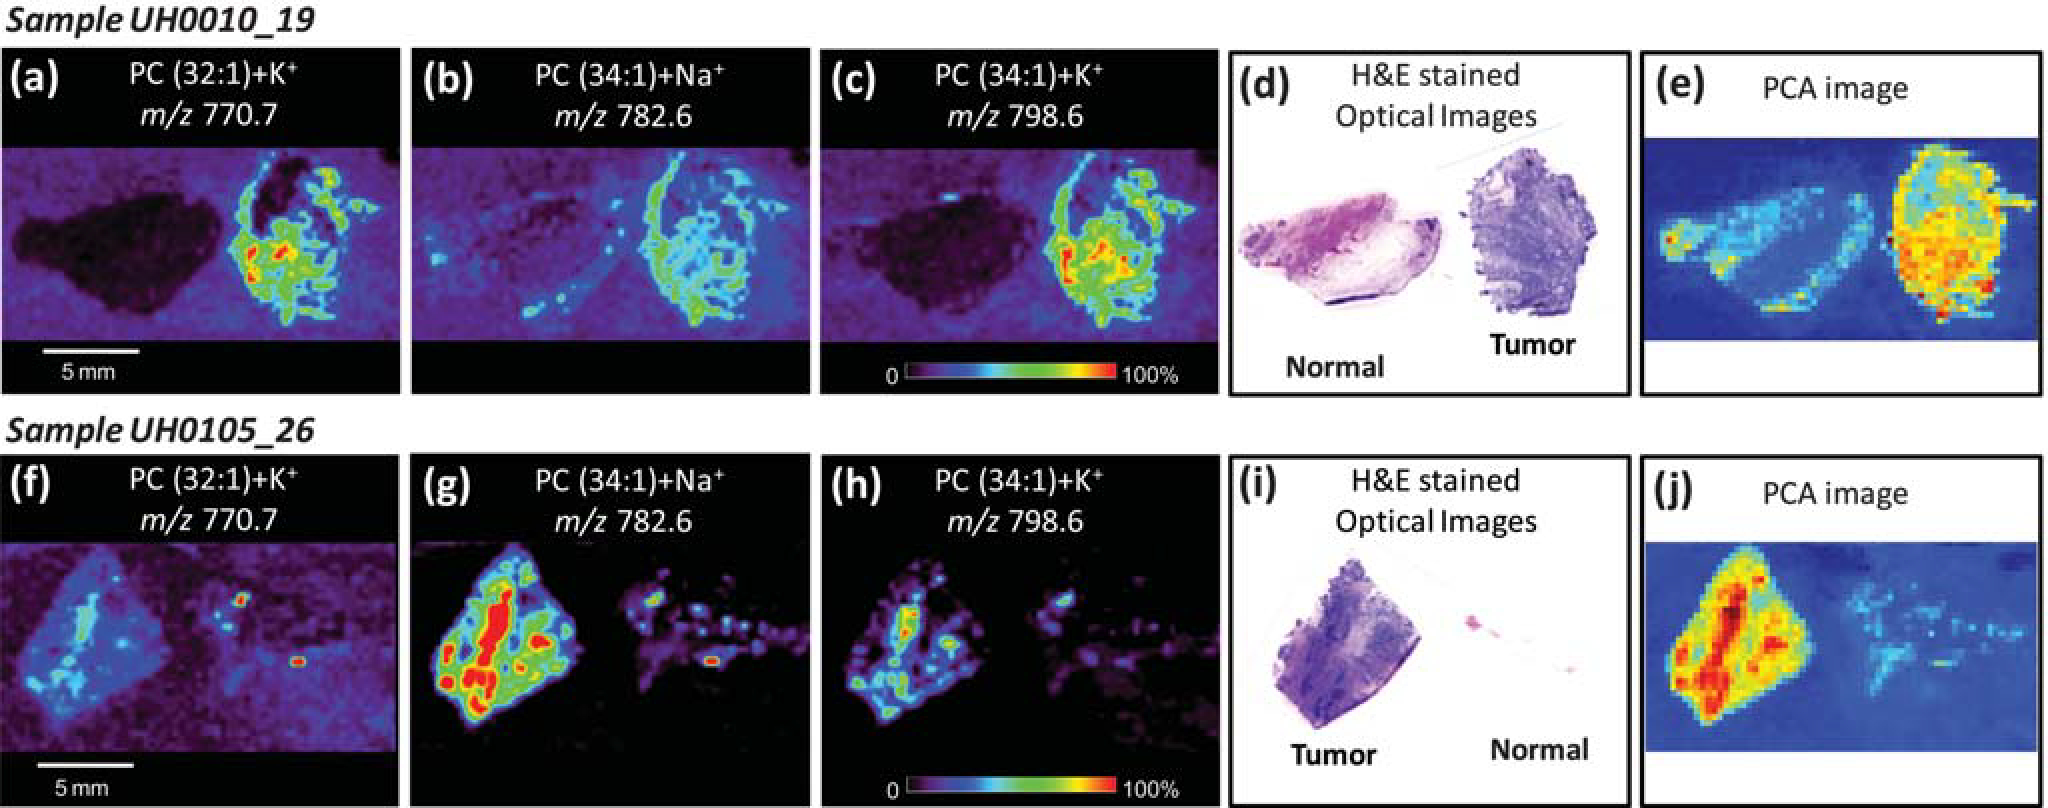
Positive-ion mode tissue imaging of human bladder tissues samples including areas of cancer and adjacent normal tissue. Ion images obtained for sample UH0010_19 (tumor tissue on right and normal tissue on left) showing the distribution (a) PC(32 : 1) + K+, m/z 770.7; (b) PC(34 : 1) + Na+, m/z 782.6 and (c) PC(34 : 1) + K+, m/z 798.6. Optical images of H&E stained adjacent sections and the PCA-based synthetic image obtained from the DESI-MS imaging data are shown in (d) and (e), respectively. Ion images obtained for sample UH0105_26 (normal tissue on right and tumor tissue on left) showing the distribution (f) PC(32 : 1) + K+, m/z 770.7; (g) PC(34 : 1) + Na+, m/z 782.6 and (h) PC(34 : 1) + K+, m/z 798.6. Optical images of H&E stained adjacent sections and the PCA-based synthetic image obtained from the DESI-MS imaging data are shown in (i) and (j), respectively. Both samples are from the validation set, illustrating the performance of the method on future samples.
DESI-MS imaging is clearly a promising technique for obtaining pathological molecular information. It allows the analysis to be conducted in the ambient environment with little sample preparation and without the use of special stains or labels. DESI-MS can be used to discriminate cancerous from normal tissue in multiple human cancers in the negative-ion mode22,23 as well as in the positive-ion mode, as shown here. The strength of the diagnosis is demonstrated through the use of multiple marker lipids and multivariate statistical analysis.
2.4. Future of DESI imaging
The use of DESI-MSI as a disease diagnostic tool can be further improved. On the analytical side, reagents can be added to the spray solvent to cause specific reactions with the molecules of interest creating products that are easier to detect. This analytical variant on the ionization method is called “reactive-DESI”.32 One example is the detection and mapping of cholesterol in the brain and adrenal glands.12,32 Cholesterol has low proton affinity and it is not detected by DESI using the common methanol/water solvent conditions. The addition of betaine aldehyde to the solvent makes the detection of cholesterol possible by the formation of a hemicetal.12,32 Reactive DESI is a promising variation of DESI that should be further explored since it increases the sensitivity and selectivity of the diagnosis by DESI-MSI.
On the clinical side, before the technique can be available to the medical community for disease diagnosis and staging, clinical protocols are necessary to investigate important variables such as sex, race, age and the stage of the disease. All these variables can affect the sensitivity and the selectivity of the technique and should be evaluated. These studies are normally conducted with a large number of individuals and preferentially at more than one medical center or clinic. The advantages of multicenter trials include the ability to compare results among subpopulations with different demographic factors such as environmental, cultural and genetics factors.
3. Paper spray for bioanalysis
3.1. Introduction to paper spray capabilities
Paper spray ionization is an electrospray related method in which a sample (solution or solid) is first loaded onto paper or another porous substrate. A jet of charged droplets (i.e. electrospray) is formed via the application of solvent and high voltage, provided the tip of the substrate is cut to a sharp point to increase the strength of the electric field. The method can be applied to a number of analytical problems, although the focus thus far has been for the quantitation of small molecule drugs from blood dried on paper. We anticipate that this simple method, which could be implemented using a disposable cartridge, could be coupled with a low-cost mass spectrometer for routine clinical monitoring of therapeutic drugs in blood or other body fluids.
The successful administration of a drug depends on managing the appropriate dosing guidelines for achievement of a safe and effective outcome. This guideline is established during clinical trials where the pharmacokinetics (PK) and pharmacodynamics (PD) of the drug are studied. Clinical trials use PK-PD studies to establish a standard dose, which may be fixed or adjusted according formulae using variables like body mass, body surface area, etc. However, the drug exposure, i.e. the amount of drug circulating over time, is influenced by a number of factors that vary from patient to patient. For example, an individuals’ metabolic rate, the type and level of plasma proteins, and pre-existing conditions all play a role in affecting the exposure of the drug in vivo.33 Furthermore, administration of a drug in combination with other medications may also affect exposure. As a result, it is often difficult to predict and prescribe an optimum regimen of drug administration for particular patients. To address these concerns, therapeutic drug monitoring (TDM) can be employed. TDM is the measurement of active drug levels in the body followed by adjustment of drug dosing or schedules to increase efficacy and/or decrease toxicity. TDM is indicated when the variability in the pharmacokinetics of a drug is large relative to the therapeutic window, and where there is an established relationship between drug exposure and efficacy and/or toxicity.
Another requirement for TDM is that a sufficiently precise and accurate assay for the active ingredient must be available at a reasonable cost. Immunoassays and high-performance liquid chromatography (HPLC) with detection by ultraviolet–visible (UV–vis) spectroscopy or mass spectrometry (MS) are the most commonly used methods for TDM. HPLC-MS is the most flexible and powerful approach for TDM, but is labor intensive and time consuming. Due to the cost of the equipment and the training required to operate it, TDM by HPLC-MS is typically carried out in central laboratories that receive samples from numerous hospitals and specialize in such tests. Samples must therefore be shipped after collection to the central laboratory where they are prepared and analyzed. The drawbacks of this approach include the difficulty in controlling the conditions used in storage and shipment and the high costs and long turnaround times (two weeks) involved; these have been significant barriers towards widespread use of TDM as a tool in personalized medicine. A suitable device capable of TDM at the point of care would reduce the cost of clinical trials and the overall costs of drug development, and it would facilitate the practice of personalized medicine by dose optimization of drug regimen on an individual case-by-case basis. This would improve clinical outcomes and decrease drug toxicity for chemotherapeutic agents, immunosuppressive drugs, and others.
Paper spray (PS) allows mass analysis of complex mixtures without sample preparation or separation [Fig. 4(a)]. A piece of paper is cut into a triangular shape; ions are generated with the addition of a small amount (~10 μL) of solvent and application of a high voltage (3–5 kV) which generates a strong electric field at the tip of the paper, and a cone-jet of charged droplets is produced at the sharp tip [Fig. 4(b)]. The sample can be contained in the solvent or pre-deposited on the paper, for example as a dried blood spot (DBS). Observation of the spray plume together with inspection of paper spray spectra suggest that ion formation in paper spray is analogous to ESI, with some additional contributions from other mechanisms in some circumstances.
Fig. 4.
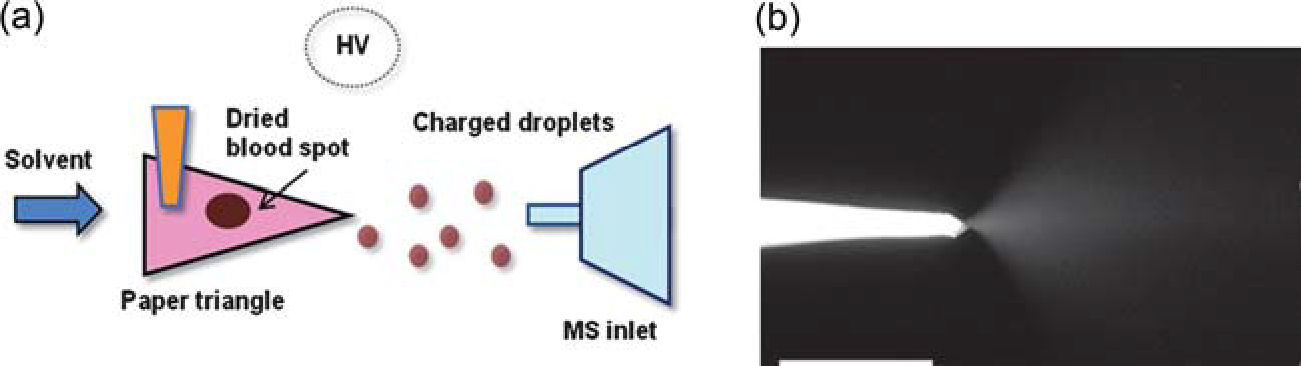
(a) Schematic of paper spray ionization. (b) Photograph of a paper tip, showing the spray plume generated after application of solvent and high voltage. Adapted from the original figure by Wang et al.(2010) reproduced with permission from Wiley-VCH, copyright 2010.
Paper spray is advantageous for the analysis of small molecules from blood for a number of reasons. First, paper is an important medium for biological fluid collection and storage. Drugs in DBSs are more stable compared with drugs in the liquid phase because enzyme enhanced hydrolysis is one of the most common reasons for drug degradation.34,35 Also, the storage and shipment of DBS is more convenient since there is no need of a freezer or dry ice. Finally, small sample volumes are required for analysis (less than 50 μL compared to 500 μL or more for typical analyses). These numerous advantages to using paper for blood collection and collection has spurred interest in the pharmaceutical industry, with one major company using dried blood spot collection for all of its PK-PD studies in new small molecule oral drugs.36 Paper spray uses the paper as the ionization source, whereas in the normal method, drugs are extracted from the DBS using liquid extraction and analyzed by HPLC-MS. The use of paper spray instead means that biological samples can be analyzed immediately after sampling or after storage of the dried spot. Paper spray can be used to directly ionize analytes in complex samples, such as blood, urine and other biological fluids. Moreover, paper spray has the capability to allow sample analysis to be performed without pneumatic assistance, which makes this method more convenient and applicable for the purpose of portable or point-of-care analysis, such as the coupling with a miniature MS. The solvent flow is driven by capillary action, eliminating the need for a syringe pump. Another advantage of paper spray is that clogging, a serious problem for conventional nanoelectrospray ion sources, is unlikely due to its multi-porous characteristics.
In our studies, drugs in various biological samples, including blood, urine and tissues, were examined by PS-MS.37,38 After collecting the blood sample and spotting it onto paper, solvent is applied onto the paper, and an electrically charged solvent spray is generated upon application of high voltage. Fig. 5 shows the results for the analysis of dried blood containing imatinib, a therapeutic drug for leukemia, using PS-MS. The peak corresponding to the drug cannot be observed above the baseline noise in the full mass spectrum. However, upon isolating a narrow mass window and performing CID of the precursor ion, the diagnostic fragment ion at m/z 394 can be observed [Fig. 5(a)]. By using a deuterated analog as an internal standard (IS), the response of imatinib is linear from 50 ng mL−1 to at least 5 μg mL−1, covering the entire therapeutic window of the drug [Fig. 5(b)]. In this experiment, the IS was spiked into the blood and thoroughly mixed. More realistically, the IS must be incorporated in some other way because it is not feasible to add it into the liquid blood at the point of collection. We found that acceptable precision was obtained by either pre-treating the paper with the IS or adding the IS to the dried blood spot after the blood had dried,39 with a relative standard deviation of less than 8% for replicate measurements.
Fig. 5.
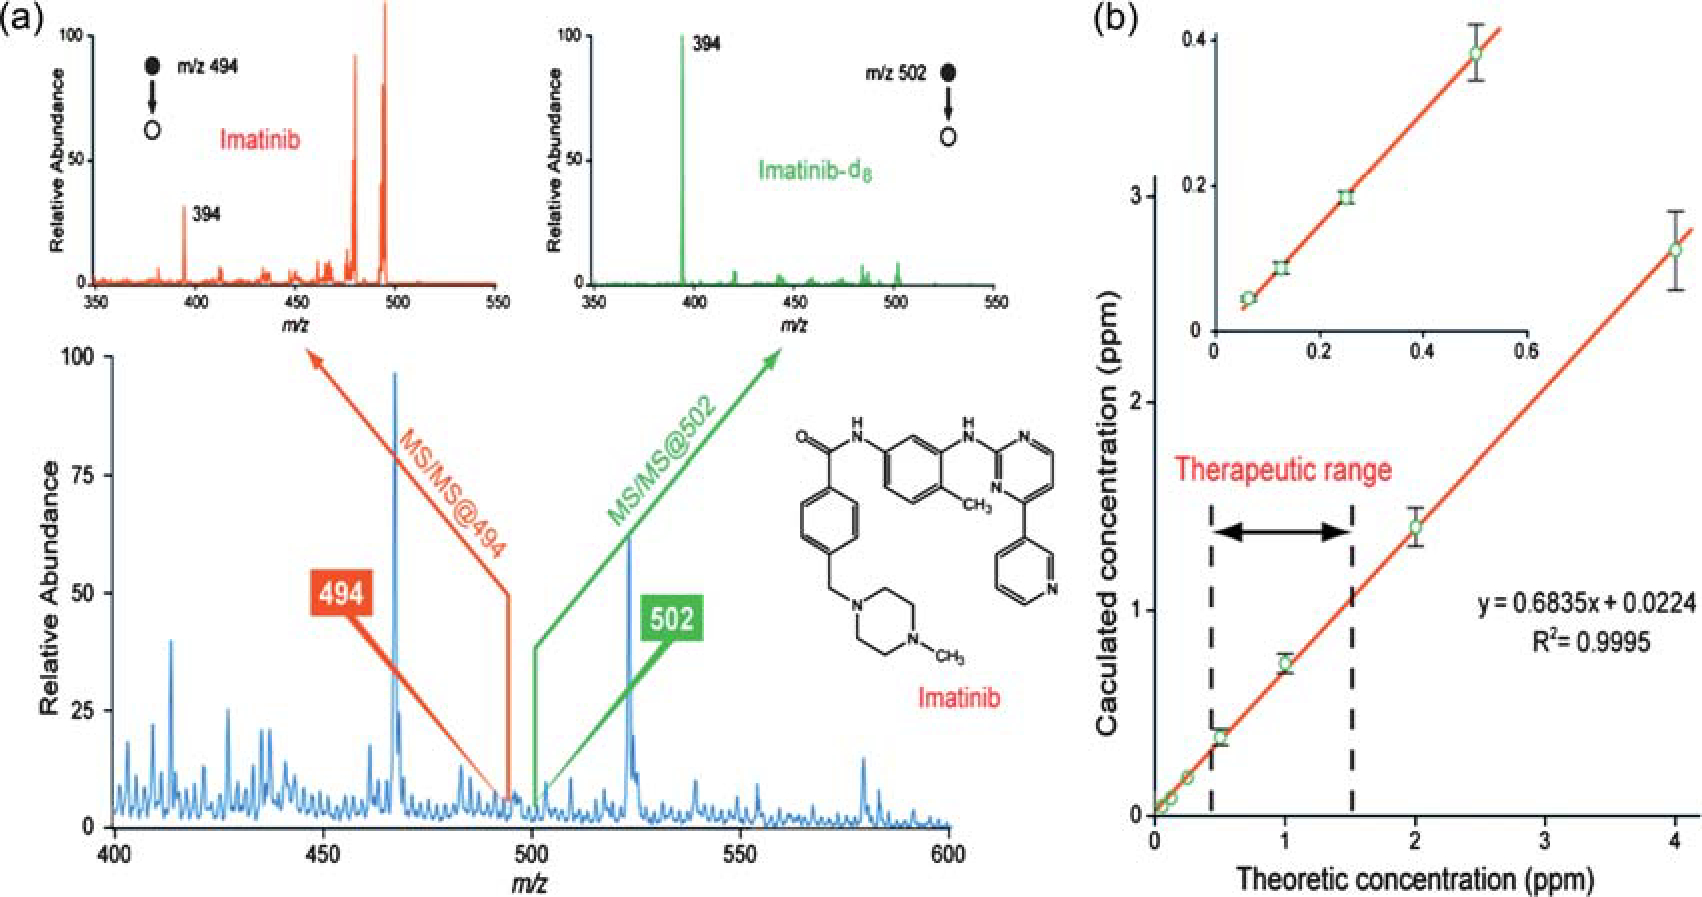
(a) Full mass spectrum (bottom) and tandem mass spectra of 500 ng mL−1 imatinib and imatinib d8 in blood. (b) Calibration curve for imatinib in blood with the therapeutic range set by dashed lines. Adapted from the original figure by Wang et al.(2010) reproduced with permission from Wiley-VCH, copyright 2010.
In this section, we will describe some recent progress in paper spray ionization. Detection limits for a small set of representative drugs were determined to evaluate the general applicability of paper spray for TDM. Also, new capabilities of paper spray are reported: the ability to measure therapeutic drugs and endogenous compounds from tissue and the use of electron emission from the paper substrate to analyze compounds with high electron affinity.
3.2. Methods
3.2.1. Application of paper spray to drug monitoring.
All experiments were performed on a TSQ Quantum Access Max (Thermo Scientific, San Jose, CA) in the selected reaction monitoring (SRM) mode. The SRM parameters were as follows: Propranolol: m/z 260 → 183; tube lens: 108 V; Q2 offset (collision energy): 27 V/atenolol: m/z 267 → 145; tube lens: 93 V; Q2 offset: 18 V/lidocaine: m/z 235 → 86; tube lens: 94 V; Q2 offset: 18 V/amitriptyline: m/z 278 → 233; tube lens: 113 V; Q2 offset: 17 v/verapamil: m/z 455 → 165; tube lens: 150 V; Q2 offset: 27 V/imatinib: m/z 494 → 294; tube lens: 148 V; Q2 offset: 27 V.
Drug standards were a gift from AstraZeneca. Blood samples were prepared by diluting 100× stock solutions of the drug standards (Innovative Research, Novi, MI) for final concentrations of 0 ng, 250 ng, 500 ng, and 1000 ng per mL of blood. The IS used at a constant concentration of 500 ng mL−1. For propranolol, amitriptyline, and lidocaine, atenolol was used as the internal standard. For verapamil, IS was imatinib. For atenolol, the IS was propranolol. Blood was spotted as 0.5 μL aliquots onto Whatman Grade 1 Chromatography paper (VWR). For each drug and concentration level, 7 replicate experiments were performed (separate blood spots, same blood sample).
For paper spray ionization, the paper was cut into a triangle of approximately 10 mm base width × 10 mm height. A pipette was used to add 10 μL of 90% methanol: 10% water (v:v) was added to the and the spray voltage was then set to 4000 V. Data was collected until the spray solvent was depleted by the spray process and evaporation (about 30 s).
For data analysis, the area under the curve (AUC) for the analyte was normalized against the AUC for the IS. This ratio was corrected by subtraction of the average blank signal, and the data was fit to a line by linear regression. The limit of detection was calculated using the formula 3sB/m, where sB is the standard deviation of the blank (N = 7) and m is the analytical sensitivity.
3.2.2. Direct tissue analysis by paper spray.
For endogenous lipid profiling, porcine adrenal gland was purchased from Pel-Freez (Rogers, AR). A metal needle was used to remove 1 mm3 of tissue from the bulk tissue and place them onto the surface of paper triangles for PS-MS experiments. Methanol–water (1 : 1 v:v; 10 μL) was added to the paper as solvent and then 4.5 kV positive DC voltage was applied to produce the spray.
For TDM from tissue, mouse liver tissue homogenate was prepared using a wheaten tissue grinder (VWR). Atenolol was spiked into tissue homogenate, and 0.5 μL of the tissue homogenate was applied on the paper surface to form a dried spot. Ten μL of methanol–water (1 : 1 v:v) was added to the surface of the paper as solvent and then 4.5 kV positive DC voltage was applied to produce the spray.
3.2.3. Electron attachment using paper spray.
Paper spray was operated in the negative-ion mode by applying −3.5 kV and 1 : 1 (v:v) methanol–water. C60 was introduced to the mass spectrometer by placing 50 ng of C60 powder 5 mm away from the paper spray tip and also 5 mm away from the mass spectrometer inlet. A fast heating film was used to increase the temperature of the C60 from room temperature to above 350 °C in about 4 s.
3.3. Results and discussion
3.3.1. Application of paper spray to drug monitoring in blood.
A method for monitoring therapeutic drugs must fulfill several requirements. The drug must be detectable over the required concentration range, which varies depending on the drug, dose, method of administration, etc. It must be specific so that the drug can be distinguished from interfering species, including other drugs and drug metabolites. The measurement must meet some acceptable level of accuracy and precision, which could be set at a constant level for all drugs, although a better approach would be to tailor the acceptable amount of inaccuracy and imprecision to the therapeutic window; 20% of the therapeutic window has been previously suggested.40 In this section, we consider the limits of detection obtained for a set of small molecule drugs (Scheme 1). This set of drugs, consisting of atenolol, propranolol, verapamil, amitriptyline, and lidocaine, have similar pKas but differ widely in their other molecular properties, making them a fairly representative set of small molecule drugs (Table 1). The limit of detection was calculated from the average signal intensity and standard deviation of blank blood samples and the analytical sensitivity from a three point calibration curve. A typical result is shown in Fig. 6, displaying the extracted ion chromatograms for the analyte (amitriptyline, in this case) and the internal standard (atenolol) for one concentration level [Fig. 6(a)]and the calibration curve obtained for this drug [Fig. 6(b)].
Scheme 1.
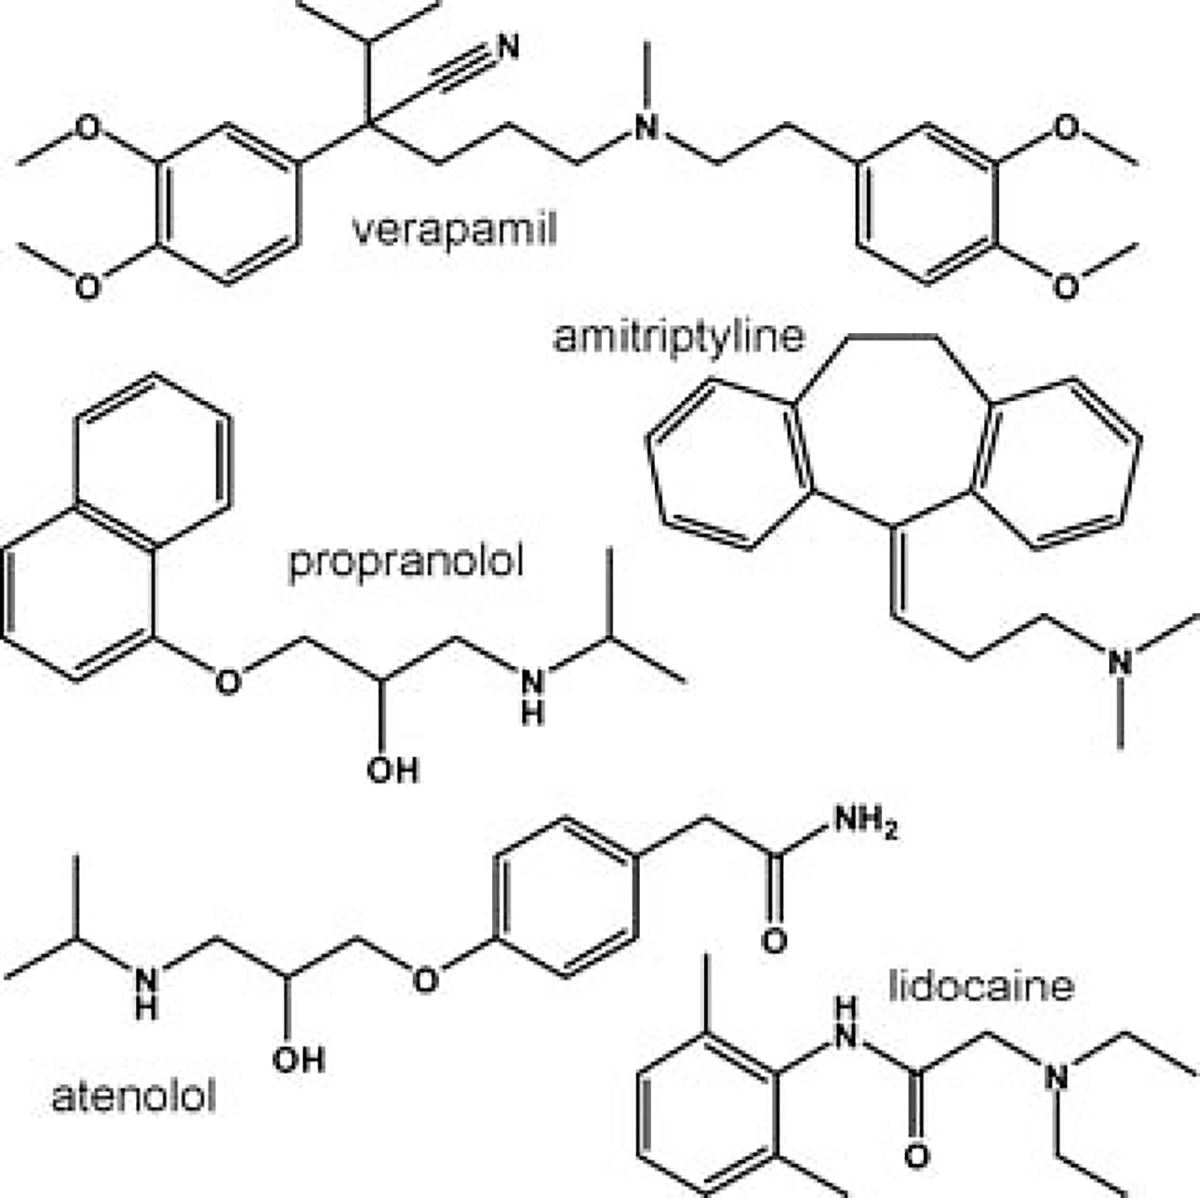
The set of drugs used in paper spray experiments, consisting of atenolol, propranolol, verapamil, amitriptyline, and lidocaine
Table 1.
Some molecular properties of drugs analyzed using PS-MS
| Drug | MW/g mol−1 | CLogPa | tPSA/Å2 | CMR/cm3 mo1−1 | H-Bond donorsb | H-bond acceptorsc |
|---|---|---|---|---|---|---|
|
| ||||||
| lidocaine | 234.5 | 2.41 | 32.34 | 73.9 | 1 | 3 |
| propranolol | 259.34 | 3.35 | 41.49 | 78.3 | 2 | 3 |
| verapamil | 454.6 | 5.69 | 63.95 | 135.1 | 0 | 6 |
| amitriptyline | 277.4 | 4.63 | 3.24 | 93.4 | 0 | 1 |
| atenolol | 266.34 | 0.22 | 84.58 | 74.6 | 3 | 5 |
CLopP, Topological Polar Surface Area (tPSA), and the calculate molar refractivity (CMR) were calculated in ChemDraw Ultra, which uses Crippen’s fragmentation and Viswanadhan’s fragmentation methods to calculate CLogP and the tPSA and Joback’s fragmentation method to calculate molar refractivity.
The sum of all NH and OH.
The sum of all N and O.
Fig. 6.
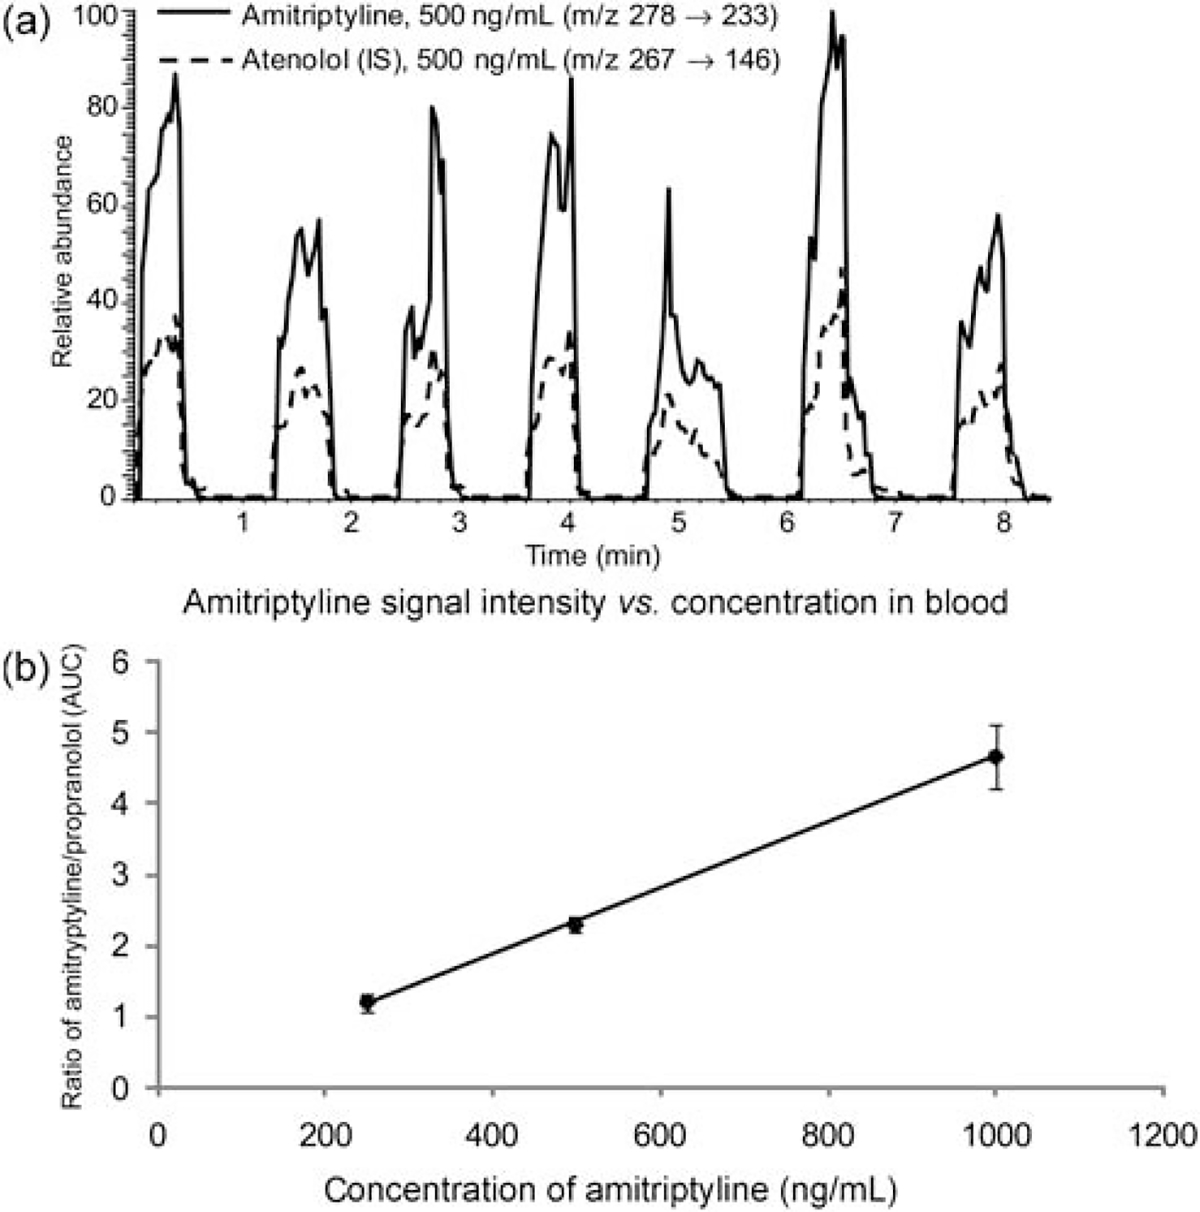
(a) Total ion chromatograms for replicate measurements of 500 ng mL−1 amitriptyline and 500 ng mL−1 of the internal standard atenolol in blood. (b) AUC of amitriptyline, normalized against the AUC of the internal standard, vs. amitriptyline concentration in blood.
The results, summarized in Table 2, show that the detection limits for these drugs vary from 3 ng mL−1 for verapamil to 106 ng mL−1 for propranolol, but are generally in the low ng mL−1 range. These limits of detection lie below the therapeutic range for all of the drugs studied except for propranolol (Table 2). The approximately 20-fold difference in the limit of detection measured for the samples in this set stems from differences in both the analytical sensitivity (i.e. the slope of the calibration curve) and the standard deviation of the blank, which in turn is a function of the magnitude of the blank signal intensity because the standard deviation generally increases as the magnitude of the blank signal increases. The differences in the magnitude of the blank signal stem from the fact that blood is complex chemical mixture and, although some components are retained on the paper, a number of background chemicals from the blood or the paper itself are ionized and may overlap with the analytes. While tandem mass spectrometry further decreases interference in the spectrum, chemical noise is still present. In the case of propranolol, for example, an overlapping peak exists in the blank blood at the m/z 260 → 183 transition, which increases the magnitude, and therefore the standard deviation, of the blank.
Table 2.
Sensitivity, average and standard deviation of the blank signal, and limit of detection for several drugs analyzed using PS-MS
| Drug | Internal standard | Sensitivity (m)/mLng−1× 10−1) | xb ± sBb | LOD/ng mL−1 | Therapeutic rangea/ng mL−1 |
|---|---|---|---|---|---|
|
| |||||
| propranolol | atenolol | 3.4 | 0.4 ± 0.2 | 106 | 20–300 |
| atenolol | propranolol | 1.5 | 0.06 ± 0.02 | 34 | 100–1000 |
| verapamil | imatinib | 6.3 | 0.031 ± 0.005 | 3 | 50–250 |
| lidocaine | atenolol | 18 | 0.06 ± 0.02 | 4 | 1000–6000 |
| amitriptyline | atenolol | 4.6 | 0.013 ± 0.009 | 6 | 50–200 |
Therapeutic range given is in serum or plasma, which may differ from the concentration in whole blood.
xB = average signal of the blank, sB = standard deviation of the blank.
Differences in the analytical sensitivity for each drug also contribute to the range obtained for the limits of detection. The sensitivity is affected by a variety of factors: the proton affinity of the analyte, its solubility in the spray solvent and its surface activity, and interactions with the porous substrate. Among this set of drugs, for example, atenolol and propranolol have the lowest analytical sensitivities at 0.0014 and 0.0034 mL ng−1, respectively. This may be because the site of protonation in atenolol and propranolol is a secondary amine, whereas the protonation site in the other three drugs is a tertiary amine. In the gas phase, tertiary amines are stronger bases than secondary amines due the presence of more electron donating groups around the charged site. Also, propranolol and atenolol have two and three hydrogen-bond donating groups, respectively, whereas the other three drugs have either none (verapamil and amitriptyline) or just one (lidocaine). An increased ability to hydrogen bond could increase a drug’s affinity for the paper substrate, and therefore decrease recovery. The set of drugs explored here is both too small and too structurally complex to precisely extrapolate general rules for predicting sensitivity.
In general, it seems reasonable to conclude that paper spray has adequate detection limits to detect many, but not all drugs at their therapeutic levels. High-potency drugs, including hormones, cytotoxic drugs, and some immunosuppressives will be difficult to detect at relevant levels. Other drugs will pose a challenge because of poor ionization efficiency. Since the detection of compounds by mass spectrometry requires ionization, drugs that do not have an easily ionized functional group or do not form adducts with counter ions easily will not be detected as sensitively. Efforts have been made previously to improve the detection of poorly ionizable compounds using on-paper derivatization, such as the use of betaine aldehyde to add charge to cholesterol.32,41 Finally, highly polar drugs may pose a challenge because they have increased affinity for the paper and/or reduced surface activity, which is known to decrease sensitivity in electrospray ionization.
3.3.2. Direct tissue analysis by PS-MS.
Rapid analysis of tissue by mass spectrometry is of interest for the diagnostic sciences. While this analysis can certainly be performed using the typical MS workflow of extraction followed by chromatography, paper spray is potentially a simpler alternative for some applications. In this experiment, a portion of tissue obtained from a surgical biopsy or from a needle aspiration biopsy is applied to the paper substrate, and chemicals from the tissue are extracted from the tissue and ionized by the application of solvent and high voltage. This method, as with the TDM of dried blood spots already presented, has the advantage of being fast and simple because of the lack of sample preparation. It has the disadvantage, naturally, of not supplying as much chemical information as can be obtained from tissue homogenization, extraction, and chromatography. This method is therefore suited for targeted analyses of a relatively small number of analytes, such as therapeutic drugs or known markers of disease state.
The pharmacological effects of a drug occur at the target tissue, not in the blood. The drug concentration in blood or plasma, which is more often measured because it is less invasive than performing a tissue biopsy, is assumed to correlate with the concentration of the drug at the active site. Variability in the drug uptake by the target tissue from patient to patient can lead to poor correlation between the plasma concentration and tissue concentration. As a result, the plasma drug concentration may correlate well with toxicity, but not with efficacy.42 One study, for example, found that the extent of tumor perfusion had a strong effect on drug uptake by the tumor, but found no correlation between drug concentration in the plasma and in the tumor.43 To demonstrate the feasibility of performing TDM from a needle aspiration biopsy, the drug atenolol was spiked into mouse liver homogenate, which was then applied to the paper and allowed to dry. The full mass spectrum and tandem mass spectrum shown in Fig. 7(a) demonstrate that the drug can be detected at less than 500 ng mL−1 concentration.
Fig. 7.
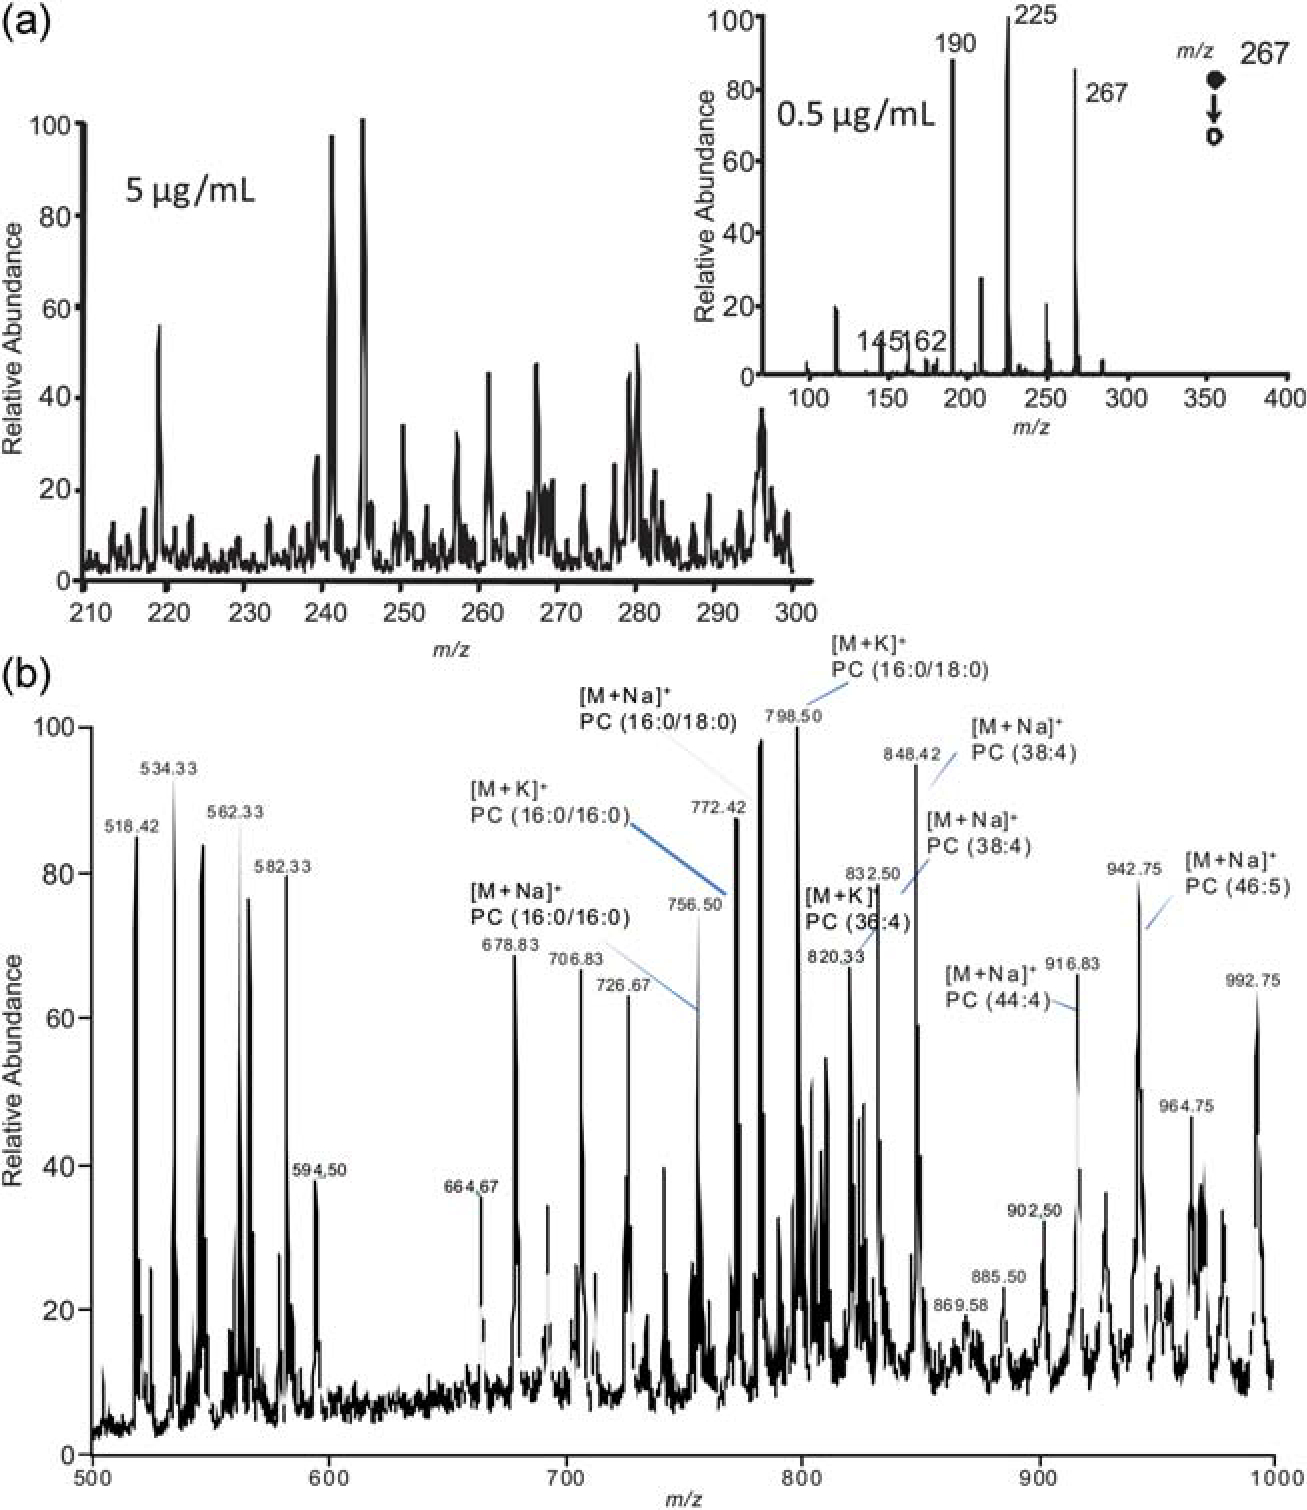
(a) Analysis of atenolol spiked into mouse liver homogenate by PS-MS. (b) Phospholipids from porcine adrenal gland analyzed by PS-MS. Phospholipids such as phosphatidylcholine (PC) are identified in the spectra.
Endogenous compounds can also be detected from tissue using PS-MS. Fig. 7(b) shows the mass spectrum obtained after analyzing a section of porcine adrenal tissue in the positive-ion mode. A high number of glycerophosphocholine lipids are detected in the mass range shown, primarily as sodium and potassium adducts, although protonated species are also observed. The presumptive molecular identity of the peaks are indicated on the spectrum, but, due to the enormous complexity of the spectra obtained from such analyses, it is likely that many of the peaks actually represent two or more isobaric species. It is possible that PS-MS could be useful as a profiling tool to detect changes in the polar lipid composition at the tumor border. Another study, for example, detected different glycerophosphocholine lipid species in normal versus tumor prostate tissue.44 Further study will be necessary to establish if paper spray can used to address this problem.
3.3.3. Electron attachment using PS-MS.
All of the experiments presented thus far were performed in the positive-ion mode, with a spray voltage of 3.5 to 4.5 kV with methanol–water in some proportion as the solvent. When PS-MS is conducted under similar conditions in the negative-ion mode, for example −3.5 kV spray voltage with 1 : 1 methanol–water, the spray current is significantly higher (10 s of microamps versus less than 1 microamp in the positive mode). We have attributed this to the emission of a large number of electrons from the paper tip, concomitantly with the spray droplet formation. The electron emission might be a result of field emission or droplets carrying electrons during spraying. The presence of electrons was confirmed by the experiment shown in Fig. 8, in which 9–10-anthraquinone and Cl-9–10-anthraquinone vapors were introduced between the paper spray source and the mass spectrometer. Peaks identified as the [M•]− ions of both species were observed. This suggests that electrons are passing from the paper to the ground mass spectrometer, resulting in electron attachment to the neutral molecules to form negative ions.
Fig. 8.
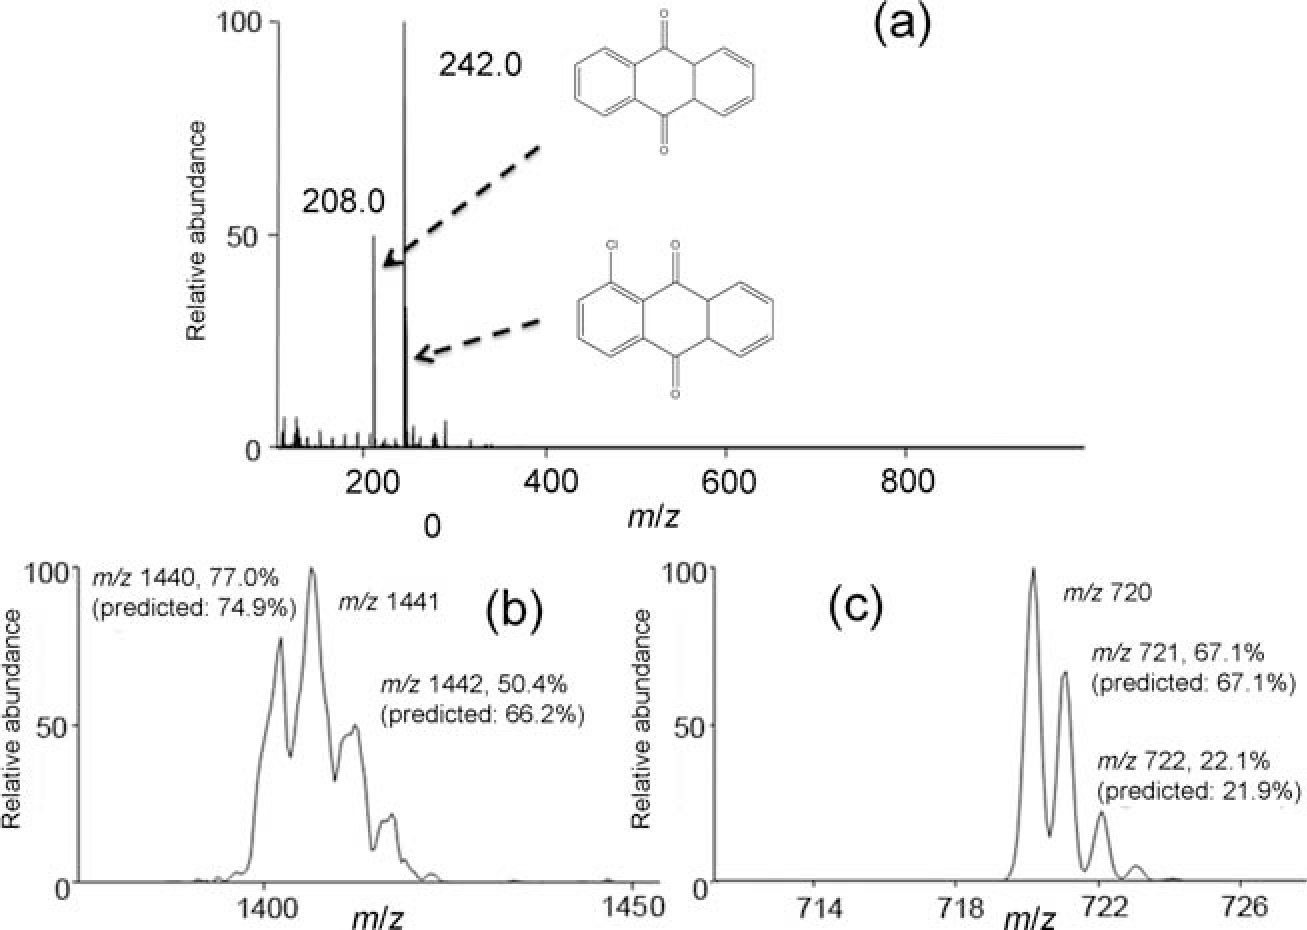
(a) Electron attachment spectra of 9–10-anthraquinone and Cl-9–10-anthraquinone obtained using paper spray as the electron source. Electron attachment spectra of C60: dimer (b), monomer (c).
C60 is representative of another group of compounds with high electron affinity. C60 vapor was introduced between the paper spray ionization source and the mass spectrometer by using a fast heating film to vaporize the fullerene. Ions representing the radical anion of C60 were observed at m/z ~720, and the isotopic ratio was consistent with C60, confirming the molecular identity of the peak [Fig. 8(b)]. Not only was the monomer observed, but also the electron-bound dimer whose isotopic peaks supported the identification as C120 [Fig. 8(c)]. This experiment further proved the presence of electrons during paper spray negative mode, and provides the possibility of dimer creation due to electron attachment.
In conclusion, paper spray in the negative mode can provide electrons under ambient conditions, which can be attached to either neutral molecules or charged species. This phenomenon could be useful in diagnostics for ionizing volatile chemicals expelled in the breath, for example.
3.4. Future of paper spray ionization
Paper spray ionization has shown early potential for the quantitation of small molecule pharmaceuticals. It has also shown potential in detecting endogenous compounds from serum samples, specifically detecting cholesterol sulfate, which was seen in tissue as a marker for pre-cancerous and cancerous prostate tissue.23 A cholesterol sulfate standard compound can be detected [Fig. 9(a)] and fragmented [Fig. 9(b)] in the negative-ion mode using paper spray [Fig. 9(c)]. When applied to a serum sample from a prostate cancer patient, cholesterol sulfate was detected by PS-MS by monitoring the major fragment ion at m/z 97 from the parent ion at m/z 465 [Fig. 9(d)]. Paper-spray MS is a promising method for detection of endogenous compounds with the ability to be translated readily into a clinical setting.
Fig. 9.
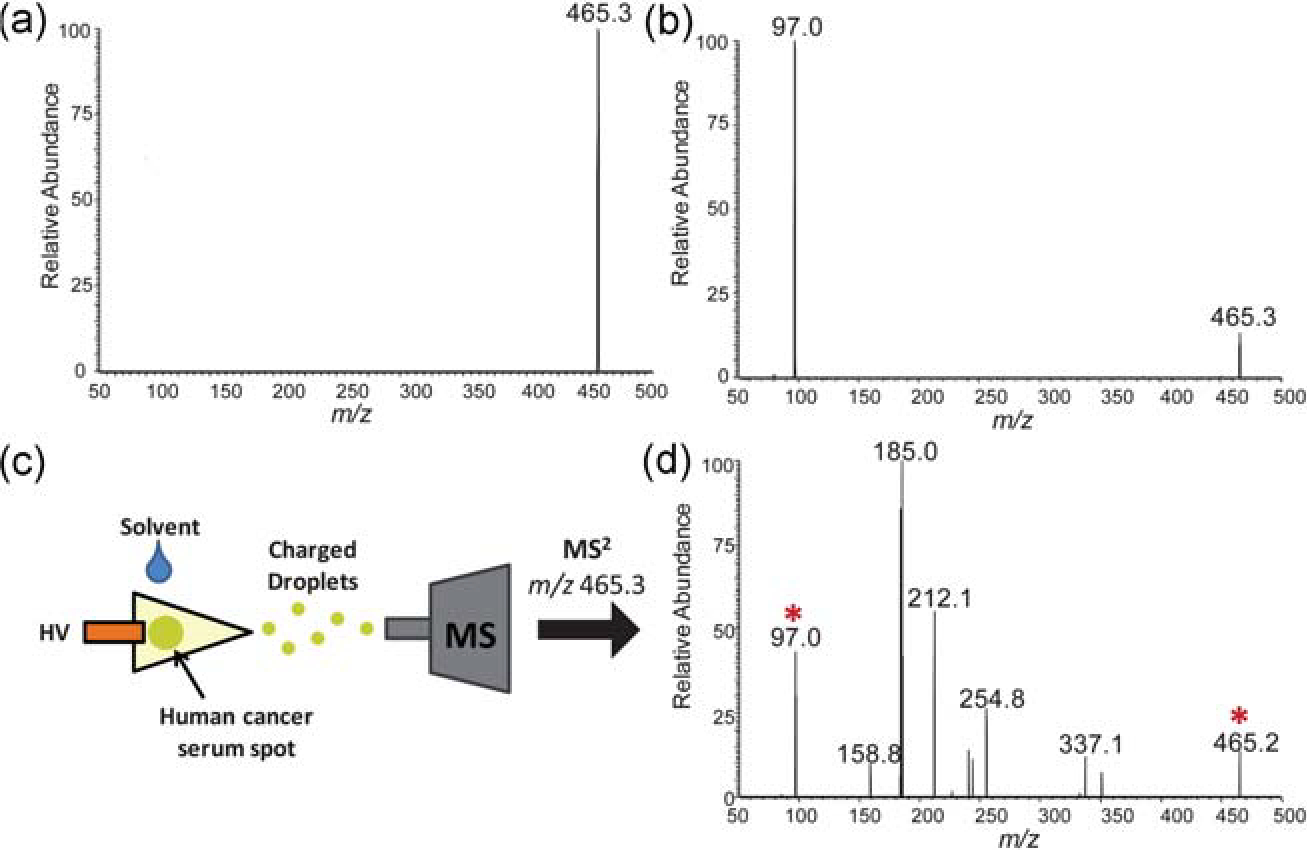
(a) Mass spectrum of standard cholesterol sulfate, m/z 465.3, analyzed by negative-mode PS-MS. (b) Tandem MS (MS2) of m/z 465.3 showing its single characteristic fragment ion m/z 97.0. (c) Scheme of paper spray analyses of human cancer serum and (d) MS2 of m/z 465.3 from serum sample, showing parent ion and fragment ion (marked with asterisks) amongst chemical noise peaks.
The performance of the PS method is quite remarkable, considering how simple it is, consisting of only a piece of filter paper from which an electrospray plume is generated. Further development by the addition of selective methods for trapping and pre-concentrating the analyte in the substrate is anticipated to further decrease the limits of detection. This is needed for at least two reasons. First, although this method is capable of detecting drug levels below the therapeutic range for many drugs, it is likely that still lower detection limits will be required for the method to find broad applicability. It is unlikely that this method will be able successfully monitor all therapeutic drugs, but the larger the fraction of drugs that paper spray can successfully analyze, the more likely this method will successfully penetrate into clinical laboratories and have an impact on patient care. Improving the detection limit is first step in this process. Second, preconcentration and trapping the analyte(s) as it is extracted from the blood spot should decrease sources of irreproducibility introduced by the blood sample by separating the analyte from interfering chemicals in the blood. To this end, all experiments have been done on uniform blood samples. Blood collected from different individuals will naturally have different chemical content, for example in the amount of lipids or the presence of other drugs. The error introduced by the varied chemical background is partially offset by the presence of an internal standard; separation of the analyte from interfering chemicals should further reduce irreproducibility and error.
Pre-concentration of the analyte could be performed on the paper in any number of ways by borrowing from current knowledge of separations. For example, a hydrophobic or ion-exchange trapping region could be added to the paper downstream of the dried blood spot. The analyte could be extracted from the blood spot and concentrated on the trapping region and then eluted with the application of a second solvent. This method could both separate at least some matrix molecules from the analyte and to serve as a method of pre-concentrating analyte molecules from a large volume of dried blood. It is important to note, however, that any method to pre-concentrate the analyte could also increase the concentration of the contaminants by an equal factor. Some additional selectivity, whether achieved through hydrophobicity, ion exchange, or another method, is needed so that the analyte can be preferentially concentrated.
The experiments described thus far have used the paper for sample collection, storage, and analysis. The use of paper or another porous substrate is also of use as a simple electrospray emitter. Typical nanospray tips suffer from problems with clogging to the small size of the capillary opening. A porous substrate, such as paper, is not subject to clogging and may be useful for coupling with microfluidic platforms with mass spectrometry. With the fast development of paper-based microfluidic devices,45–47 paper spray is foreseen to play a major role in the integration of future microfluidic-MS systems of compact sizes.48
4. Miniature mass spectrometers and the future of biomedical and clinical mass spectrometry
4.1. State-of-the art in miniature mass spectrometer systems
The smallest fully functional autonomous mass spectrometer is an ion-trap-based system built at Purdue.49,50 This wireless-controlled miniature rectilinear ion-trap MS system, weighs 5.0 kg (with batteries), consumes less than 35 W of power, and has dimensions of 22 cm in length by 12 cm in width by 18 cm in height. It is capable of tandem mass spectrometry which is essential for complex mixture analysis and has modest but adequate performance (unit mass resolution and mass range up to m/z 800, m/z 1500 in extended mass range mode). The instrument is compatible with various types of ionization sources including a glow-discharge electron impact ionization (GDEI) source for internal ionization and various atmospheric pressure ionization sources which are external to the vacuum system and connected to it through the use of a discontinuous atmospheric pressure interface (DAPI).51,52 This interface was developed to match the rate of sample introduction to the limited pumping capacity of the miniature MS. These external sources include ESI and DESI, for solution and solids analysis, respectively. Performance characteristics of these handheld mass spectrometers have been reported.53
4.2. Adaptation to point-of-care drug monitoring and intrasurgical diagnostics
The availability of miniature mass spectrometers and ambient sampling ionization methods has significant potential in terms of the application of mass spectrometers in clinical point-of-care analysis and in providing real-time diagnostic information to guide surgery. The paper spray method has already been adapted to miniature mass spectrometers.37 The next step in the development of a point-of-care clinical system will be the optimization of a disposable device in which the paper substrate is pre-mounted (and pre-supplied with appropriate internal standards and solvent). Addition of a finger prick blood spot will then be followed by ionization and recording of a mass spectrum using a miniature mass spectrometer. Miniature MS analysis systems with direct sampling ionization and tandem MS capabilities have potential as valuable new tools in high throughput point-of-care clinical analysis. These same systems should also see wide use as generally applicable, high sensitive analytical methods for applications in food safety, forensics and public safety, environmental monitoring and quality control.
The combination of a small mass spectrometer with efficient ion transfer capabilities allows one to consider the possibility that an ambient ionization source might be built into a surgeon’s scalpel to provide real-time diagnostic information before tissue is excised. The geometry-independent DESI configuration54 with coaxial charged droplet delivery and secondary droplet transport tubes is one possible configuration. The main technical problem is not the passage of ions over long distances at atmospheric pressure. This has been demonstrated for both DESI and for plasma-based ionization methods.55,56 Rather it is maximizing the efficiency of this process when performing the experiment with a small mass spectrometer.
Acknowledgements
The authors acknowledge funding and other support from the Alfred Mann Institute for Biomedical Development at Purdue University (MIPurdue) for development of some of the technology presented in this paper. Support from the NIH (Grant 1 R21 EB009459–01) and the NSF (CHE 0848650 and 0847205) as well as support from Thermo Fisher is gratefully acknowledged.
References
- 1.McDonnell LA and Heeren RMA, Mass Spectrom. Rev, 2007, 26, 606–643. [DOI] [PubMed] [Google Scholar]
- 2.Pacholski ML and Winograd N, Chem. Rev, 1999, 99, 2977. [DOI] [PubMed] [Google Scholar]
- 3.Cooks RG, Ouyang Z, Takats Z and Wiseman JM, Science, 2006, 311, 1566–1570. [DOI] [PubMed] [Google Scholar]
- 4.Harris GA, Nyadong L and Fernandez FM, Analyst, 2008, 133, 1297–1301. [DOI] [PubMed] [Google Scholar]
- 5.Van Berkel GJ, Pasilis SP and Ovchinnikova O, J. Mass Spectrom, 2008, 43, 1161–1180. [DOI] [PubMed] [Google Scholar]
- 6.Venter A, Nefliu M and Cooks RG, TrAC, Trends Anal. Chem, 2008, 27, 284–290. [Google Scholar]
- 7.Ifa DR, Wiseman JM, Song QY and Cooks RG, Int. J. Mass Spectrom, 2007, 259, 8–15. [Google Scholar]
- 8.Ifa DR, Gumaelius L, Eberlin LS, Manicke N and Cooks RG, Analyst, 2007, 132, 461–467. [DOI] [PubMed] [Google Scholar]
- 9.Ifa DR, Manicke NE, Dill AL and Cooks G, Science, 2008, 321, 805–805. [DOI] [PubMed] [Google Scholar]
- 10.Paglia G, Ifa DR, Wu CP, Corso G and Cooks RG, Anal. Chem, 2010, 82, 1744–1750. [DOI] [PMC free article] [PubMed] [Google Scholar]
- 11.Eberlin LS, Ifa DR, Wu C and Cooks RG, Angew. Chem., Int. Ed, 2010, 49, 873–876. [DOI] [PMC free article] [PubMed] [Google Scholar]
- 12.Wu CP, Ifa DR, Manicke NE and Cooks RG, Analyst, 2010, 135, 28–32. [DOI] [PubMed] [Google Scholar]
- 13.Girod M, Shi Y, Cheng J-X and Cooks RG, J. Am. Soc. Mass Spectrom, 2010, 21, 1177–1189. [DOI] [PubMed] [Google Scholar]
- 14.Shimma S, Sugiura Y, Hayasaka T, Hoshikawa Y, Noda T and Setou M, J. Chromatogr., B: Anal. Technol. Biomed. Life Sci., 2007, 855, 98–103. [DOI] [PubMed] [Google Scholar]
- 15.Szachowicz-Petelska B, Sulkowski S and Figaszewski ZA, Mol. Cell. Biochem, 2007, 294, 237–242. [DOI] [PubMed] [Google Scholar]
- 16.Utsugi T, Schroit AJ, Connor J, Bucana CD and Fidler IJ, Cancer Res, 1991, 51, 3062–3066. [PubMed] [Google Scholar]
- 17.Aboagye EO and Bhujwalla ZM, Cancer Res, 1999, 59, 80–84. [PubMed] [Google Scholar]
- 18.Alonso T, Morgan RO, Marvizon JC, Zarbl H and Santos E, 1988, pp. 4271–4275. [DOI] [PMC free article] [PubMed] [Google Scholar]
- 19.Valitutti S, Cucchi P, Colletta G, Di Filippo C and Corda D, Cell. Signalling, 1991, 3, 321–332. [DOI] [PubMed] [Google Scholar]
- 20.Wiseman JM, Puolitaival SM, Takats Z, Cooks RG and Caprioli R, Angew. Chem., Int. Ed, 2005, 44, 7094–7097. [DOI] [PubMed] [Google Scholar]
- 21.Dill AL, Ifa DR, Manicke NE, Costa AB, Ramos-Vara JA, Knapp DW and Cooks RG, Anal. Chem, 2009, 81, 8758–8764. [DOI] [PMC free article] [PubMed] [Google Scholar]
- 22.Dill AL, Eberlin LS, Costa AB, Zheng C, Ifa DR, Cheng L, Masterson T, Koch M, Vitek O and Cooks RG, 2010, submitted. [DOI] [PMC free article] [PubMed] [Google Scholar]
- 23.Eberlin LS, Dill AL, Costa AB, Ifa DR, Cheng L, Masterson T, Koch M, Ratliff TL and Cooks RG, Anal. Chem, 2010, 82, 3430–3434. [DOI] [PMC free article] [PubMed] [Google Scholar]
- 24.C. A. Strott and Y. Higashi, J. Lipid Res, 2003, 44, 1268–1278. [DOI] [PubMed] [Google Scholar]
- 25.Rearick JI, Stoner GD, George MA and Jetten AM, Cancer Res, 1988, 48, 5289–5295. [PubMed] [Google Scholar]
- 26.Kuroki T, Ikuta T, Kashiwagi M, Kawabe S, Ohba M, Huh N, Mizuno K, Ohno S, Yamada E and Chida K, Mutat. Res., Rev. Mutat. Res., 2000, 462, 189–195. [DOI] [PubMed] [Google Scholar]
- 27.Manicke NE, Kistler T, Ifa DR, Cooks RG and Ouyang Z, J. Am. Soc. Mass Spectrom, 2009, 20, 321–325. [DOI] [PubMed] [Google Scholar]
- 28.Manicke NE, Wiseman JM, Ifa DR and Cooks RG, J. Am. Soc. Mass Spectrom, 2008, 19, 531–543. [DOI] [PubMed] [Google Scholar]
- 29.Pulfer M and Murphy RC, Mass Spectrom. Rev, 2003, 22, 332–364. [DOI] [PubMed] [Google Scholar]
- 30.Hsu FF and Turk J, J. Am. Soc. Mass Spectrom, 2003, 14, 352–363. [DOI] [PubMed] [Google Scholar]
- 31.Knapp DW, Glickman NW, DeNicola DB, Bonney PL, Lin TL and Glickman LT, Urol. Oncol, 2000, 5, 47–59. [DOI] [PubMed] [Google Scholar]
- 32.Wu C, Ifa DR, Manicke NE and Cooks RG, Anal. Chem, 2009, 81, 7618–7624. [DOI] [PMC free article] [PubMed] [Google Scholar]
- 33.Wilkinson GR, Engl N. J. Med, 2005, 352, 2211–2221. [DOI] [PubMed] [Google Scholar]
- 34.Waterman KC and Adami RC, Int. J. Pharm, 2005, 293, 101–125. [DOI] [PubMed] [Google Scholar]
- 35.Alfazil AA and Anderson RA, J. Anal. Toxicol, 2008, 32, 511–515. [DOI] [PubMed] [Google Scholar]
- 36.Spooner N, Lad R and Barfield M, Anal. Chem, 2009, 81, 1557–1563. [DOI] [PubMed] [Google Scholar]
- 37.Liu JJ, Wang H, Manicke NE, Lin JM, Cooks RG and Ouyang Z, Anal. Chem, 2010, 82, 2463–2471. [DOI] [PubMed] [Google Scholar]
- 38.Wang H, Liu JJ, Cooks RG and Ouyang Z, Angew. Chem., Int. Ed, 2010, 49, 877–880. [DOI] [PubMed] [Google Scholar]
- 39.Manicke NE, Yang Q, Wang H, Oradu S, Ouyang Z and Cooks RG, Int. J. Mass Spectrom, 2010, DOI: 10.1016/j.ijms.2010.06.037. [DOI] [PMC free article] [PubMed] [Google Scholar]
- 40.Glick JH, Clin. Chem, 1976, 22, 475–483. [PubMed] [Google Scholar]
- 41.Saleem A, Harte RJ, Matthews JC, Osman S, Brady F, Luthra SK, Brown GD, Bleehen N, Conners T, Jones T, Price PM and Aboagye EO, J. Clin. Oncol, 2001, 19, 1421–1429. [DOI] [PubMed] [Google Scholar]
- 42.Saleem A and Price PM, Clin. Cancer Res, 2008, 14, 8184–8190. [DOI] [PMC free article] [PubMed] [Google Scholar]
- 43.Martinez AW, Phillips ST and Whitesides GM, Proc. Natl. Acad. Sci. U. S. A, 2008, 105, 19606–19611. [DOI] [PMC free article] [PubMed] [Google Scholar]
- 44.Wang H, Manicke NE, Cooks RG and Ouyang Z, Proceedings of the 58th ASMS Conference on Mass Spectrometry and Allied Topics, 2010. [Google Scholar]
- 45.Abe K, Suzuki K and Citterio D, Anal. Chem, 2008, 80, 6928–6934. [DOI] [PubMed] [Google Scholar]
- 46.Li X, Tian JF, Nguyen T and Shen W, Anal. Chem, 2008, 80, 9131–9134. [DOI] [PubMed] [Google Scholar]
- 47.Ouyang Z and Cooks RG, Annu. Rev. Anal. Chem, 2009, 2, 187–214. [DOI] [PubMed] [Google Scholar]
- 48.Regenthal R, Krueger M, Koeppel C and Preiss R, J. Clin. Monit. Comput, 1999, 15, 529–544. [DOI] [PubMed] [Google Scholar]
- 49.Ouyang Z, Noll RJ and Cooks RG, Anal. Chem, 2009, 81, 2421–2425. [DOI] [PubMed] [Google Scholar]
- 50.Gao L, Sugiarto A, Harper JD, Cooks RG and Ouyang Z, Anal. Chem, 2008, 80, 7198–7205. [DOI] [PubMed] [Google Scholar]
- 51.Gao L, Cooks RG and Ouyang Z, Anal. Chem, 2008, 80, 4026–4032. [DOI] [PubMed] [Google Scholar]
- 52.Gao L, Li GT, Nie ZX, Duncan J, Ouyang Z and Cooks RG, Int. J. Mass Spectrom, 2009, 283, 30–34. [Google Scholar]
- 53.Sanders NL, Sokol E, Perry RH, Huang G, Noll RJ, Duncan JS and Cooks RG, Eur. J. Mass Spectrom, 2010, 16, 11–20. [DOI] [PubMed] [Google Scholar]
- 54.Venter A and Cooks RG, Anal. Chem, 2007, 79, 6398–6403. [DOI] [PubMed] [Google Scholar]
- 55.Takáts Z, Wiseman JM and Cooks RG, J. Mass Spectrom, 2005, 40, 1261–1275. [DOI] [PubMed] [Google Scholar]
- 56.Cotte-Rodríguez I and Cooks RG, Chem. Commun, 2006, 2968–2970. [DOI] [PubMed] [Google Scholar]