

Abstract
Desorption electrospray ionization mass spectrometry (DESI-MS) has been successfully used to discriminate between normal and cancerous human tissue from different anatomical sites. On the basis of this, DESI-MS imaging was used to characterize human seminoma and adjacent normal tissue. Seminoma and adjacent normal paired human tissue sections (40 tissues) from 15 patients undergoing radical orchiectomy were flash frozen in liquid nitrogen and sectioned to 15 μm thickness and thaw mounted to glass slides. The entire sample was two-dimensionally analyzed by the charged solvent spray to form a molecular image of the biological tissue. DESI-MS images were compared with formalin-fixed, hematoxylin and eosin (H&E) stained slides of the same material. Increased signal intensity was detected for two seminolipids [seminolipid (16:0/16:0) and seminolipid (30:0)] in the normal tubule testis tissue; these compounds were undetectable in seminoma tissue, as well as from the surrounding fat, muscle, and blood vessels. A glycerophosphoinositol [PI(18:0/20:4)] was also found at increased intensity in the normal testes tubule tissue when compared with seminoma tissue. Ascorbic acid (i.e., vitamin C) was found at increased amounts in seminoma tissue when compared with normal tissue. DESI-MS analysis was successfully used to visualize the location of several types of molecules across human seminoma and normal tissues. Discrimination between seminoma and adjacent normal testes tubules was achieved on the basis of the spatial distributions and varying intensities of particular lipid species as well as ascorbic acid. The increased presence of ascorbic acid within seminoma compared with normal seminiferous tubules was previously unknown.
Keywords: Diagnosis, Germ cell tumor, Imaging, Lipids, Mass spectrometry, Seminoma
Introduction
Seminolipids are members of a family of sulfoglycolipids that are found in the mammalian testis, and make up more than 90% of the total glycolipid content. These lipids are synthesized in primary spermatocytes and are stable throughout spermatogenesis, performing important roles in germ cell differentiation as well as in interactions with other cell types [1, 2]. Both animal and human studies analyzing the distribution of multiple seminolipid species within the testis have demonstrated that the total lipid and seminolipid content changes as a function of age, with the highest seminolipid content being observed in adults, therefore relating function to spermatogenesis [3, 4]. Studies using methods such as thin layer chromatography and gas chromatography have shown that while seminolipids were found in normal tissue, they were undetected in cancerous tissue [5]. Although seminoma originates from the seminolipid rich epithelium of seminiferous tubules, its undifferentiated nature and immature state is consistent with the absence of seminolipid species abundantly observed in the mature testis [5].
In such fields as lipidomics and clinical diagnostics, mass spectrometry (MS) is a powerful analytical tool that can be used to characterize and identify molecules based on their mass to charge ratio. By operating in an imaging mode, the chemical sensitivity is combined with spatial information, allowing ion images to be created showing a map of the distribution of multiple species throughout the sample. Given these advantages, imaging MS has been used in a variety of fields, such as biological, pharmaceutical, forensic, and material sciences. Desorption electrospray ionization (DESI) is one of many ambient ionization methods used in mass spectrometry (MS) [6–8]. DESI-MS utilizes a stream of highly charged droplets, produced through a pneumatically assisted electrospray, to collide with a sample surface [9]. DESI-MS imaging has previously been applied to analyze several types of canine and human cancers with the goal of discriminating tumor from normal tissue or discriminating tumor grades [10–15]. In addition, it may prove useful in the identification of novel tumor markers through screening of cellular glycerophospholipid profiles in human cancers. Most recently, studies of human prostate cancer have uncovered a compound, cholesterol sulfate, which is found in high relative intensities in cancerous and precancerous tissue but was absent or gave low signals from adjacent normal tissue [12]. DESI-MS imaging appears also to assist in discriminating tumor grades as is the case for subtypes of human gliomas [15].
The encouraging results using DESI-MS imaging in these previous studies aimed at disease classification and tissue discrimination led us to expand our enquiry into the value of this technology by examining additional tumor types. In the current study, we employed DESI-MS to correctly diagnosis human seminoma, using ascorbic acid, and to diagnose adjacent normal testicular tissues, using seminolipids.
Materials and Methods
Biological Sample Preparation and Cryosectioning
All human tissue samples were handled in accordance with approved institutional review board (IRB) protocols at Indiana University School of Medicine. A total of 40 human tissue sections, encompassing tumor and adjacent normal tissue from 15 seminoma patients undergoing radical orchiectomy were obtained from the Indiana University Tumor Procurement Laboratory for analysis. The tissue sections from both tumor and adjacent normal tissues were flash frozen at the time of resection in liquid nitrogen and stored at −80 °C until sliced into 15 μm thick sections and thaw mounted onto glass slides. The slides were then stored at −80 °C. Prior to analysis, they were allowed to come to room temperature and then dried under nitrogen in a dessiccator for approximately 15 min. Serial sections were formalin fixed and subsequently stained using H&E for pathologic examination.
DESI-MS 2D Imaging
The DESI ion source used was a lab-built prototype, configured as described previously [16]. Optimization involved obtaining a small and uniform spray spot on the sample surface [17]. The spray solvent used for MS acquisition was acetonitrile:water (50:50) with a 5 kV spray voltage applied in the negative ion mode. Acetonitrile was purchased from Sigma-Aldrich (St. Louis, MO, USA) and water (18.2 MΩ-cm) was obtained from a PureLab ultra system by Elga LabWater (High Wycombe, UK). The nitrogen gas pressure was 150 psi and the solvent flow rate was 1.5 μL/min. In the imaging experiments, the tissues were scanned using a 2D moving stage in horizontal rows separated by 250 μm vertical steps until the entire sample surface had been assayed. The surface moving stage included an XYZ integrated linear stage (Newport, Richmond, CA, USA) and a rotary stage (Parker Automation, Irwin, PA, USA). Although each tissue sample pair varied in size, each sample (approximate size 10 mm×10 mm) could be imaged in approximately 40 min. All experiments were carried out using a LTQ linear ion trapmassspectrometercontrolledbyXCalibur2.0 software (Thermo Fisher Scientific, San Jose, CA, USA). An in-house program allowed the conversion of the XCalibur 2.0 mass spectra files (.raw) into a format compatible with the BioMap software (freeware, http://www.maldi-msi.org). Spatially accurate images were assembled using the BioMap software, interpolated images rather than pixilated images are shown. In the BIOMAP images the same color scale was used within a set of ion images for a particular sample. Therefore, the 100% color shows the highest intensity for the most intense peak in the spectrum and other peaks are color scaled according to their intensity relative to the most intense peak in the spectrum. This allows for comparison of relative levels of species within one pixel as well as their relative intensities between multiple pixels within the tissue sections. While there is no gross heterogeneity present in this set of samples, imaging experiments were performed since this fact was not known prior to sample analysis and in past experiments sample heterogeneity did exist [12, 18].
In the mass spectra obtained, the ions of interest include the fatty acids in the mass range m/z 150 to 350, and the glycerophospholipids (GP) and seminolipids in the mass range m/z 600 to 900. The GPs include glycerophosphoinositols (PI) and glycerophosphoserines (PS) species. The peaks observed at high intensities (GPs and ascorbic acid) within the spectra were identified through collision induced dissociation (CID) tandem MS experiments and by comparison of the generated product ion spectra with literature data [19–21]. It is important to note that peak assignments were made on the basis of the MS/MS spectrum of the most abundance species at a particular m/z value. In the case of natural lipids, large numbers of isomeric species may be present and the assignment of the individual compounds can be uncertain. The fatty acid species were identified based on the mass of the deprotonated molecular anion, [M – H]−. While the intensity of any of the species present in the mass spectra can be plotted as a function of x,y position to create an ion image, particular species were selected for visualization based on their biological importance and ability to distinguish between healthy and diseased tissue. The serial sections stained with H&E were subjected to pathologic examination, and all diagnostic labels were determined from subsequent histologic examination of this stained tissue.
Results and Discussion
In this study, we investigated the utility of DESI-MS imaging to discriminate human seminoma from adjacent normal tissue using standard H&E stain pathologic examination as the reference method. A total of 40 human tissue sections, encompassing tumor and adjacent normal tissue from 15 seminoma patients undergoing radical orchiectomy, were imaged using DESI-MS. Each pixel in the image corresponds to an individual mass spectrum acquired at that point, with a pixel to pixel separation of 250 μm. Representative spectra and ion images from the cancerous and normal tissues are shown in Figures 1 and 2, respectively. The images show the intensity of a particular species plotted in a false color scale with the scale being normalized to the base peak in the spectrum and red representing the most intense signal. While DESI-MS imaging is not yet a quantitative technique, the signal intensities observed for particular species have been shown to correlate with absolute amounts present in the tissues; both for endogenous lipids in human lens tissue and for exogenous drug metabolites in animal tissues [22, 23]. The species shown in the ion images are seminolipid(16:0/16:0) at m/z 795.4, seminolipid(30:0) at m/z 767.3, PI(18:0/20:4) at m/z 885.4, ascorbic acid at m/z 175.2, and the optical image of the H&E stained tissue section. Confirmation of lipid assignments was achieved by tandem MS (MS/MS) experiments and the resulting spectra were compared with existing MS/MS spectra from the literature [19–21, 24]. However as noted isomeric lipid species can occur, and in these experiments only the most abundant lipid present at a specific m/z was identified and is reported here. An MS/MS product ion spectrum for the seminolipid(16:0/16:0) at m/z 795.4 is shown as an inset in Figure 1(a) [24]. An MS/MS product ion spectrum for ascorbic acid at m/z 175.2 is shown as an inset in Figure 1(b); its identity was confirmed through comparison of the generated product ion spectrum to that of an authentic standard [21].
Figure 1.
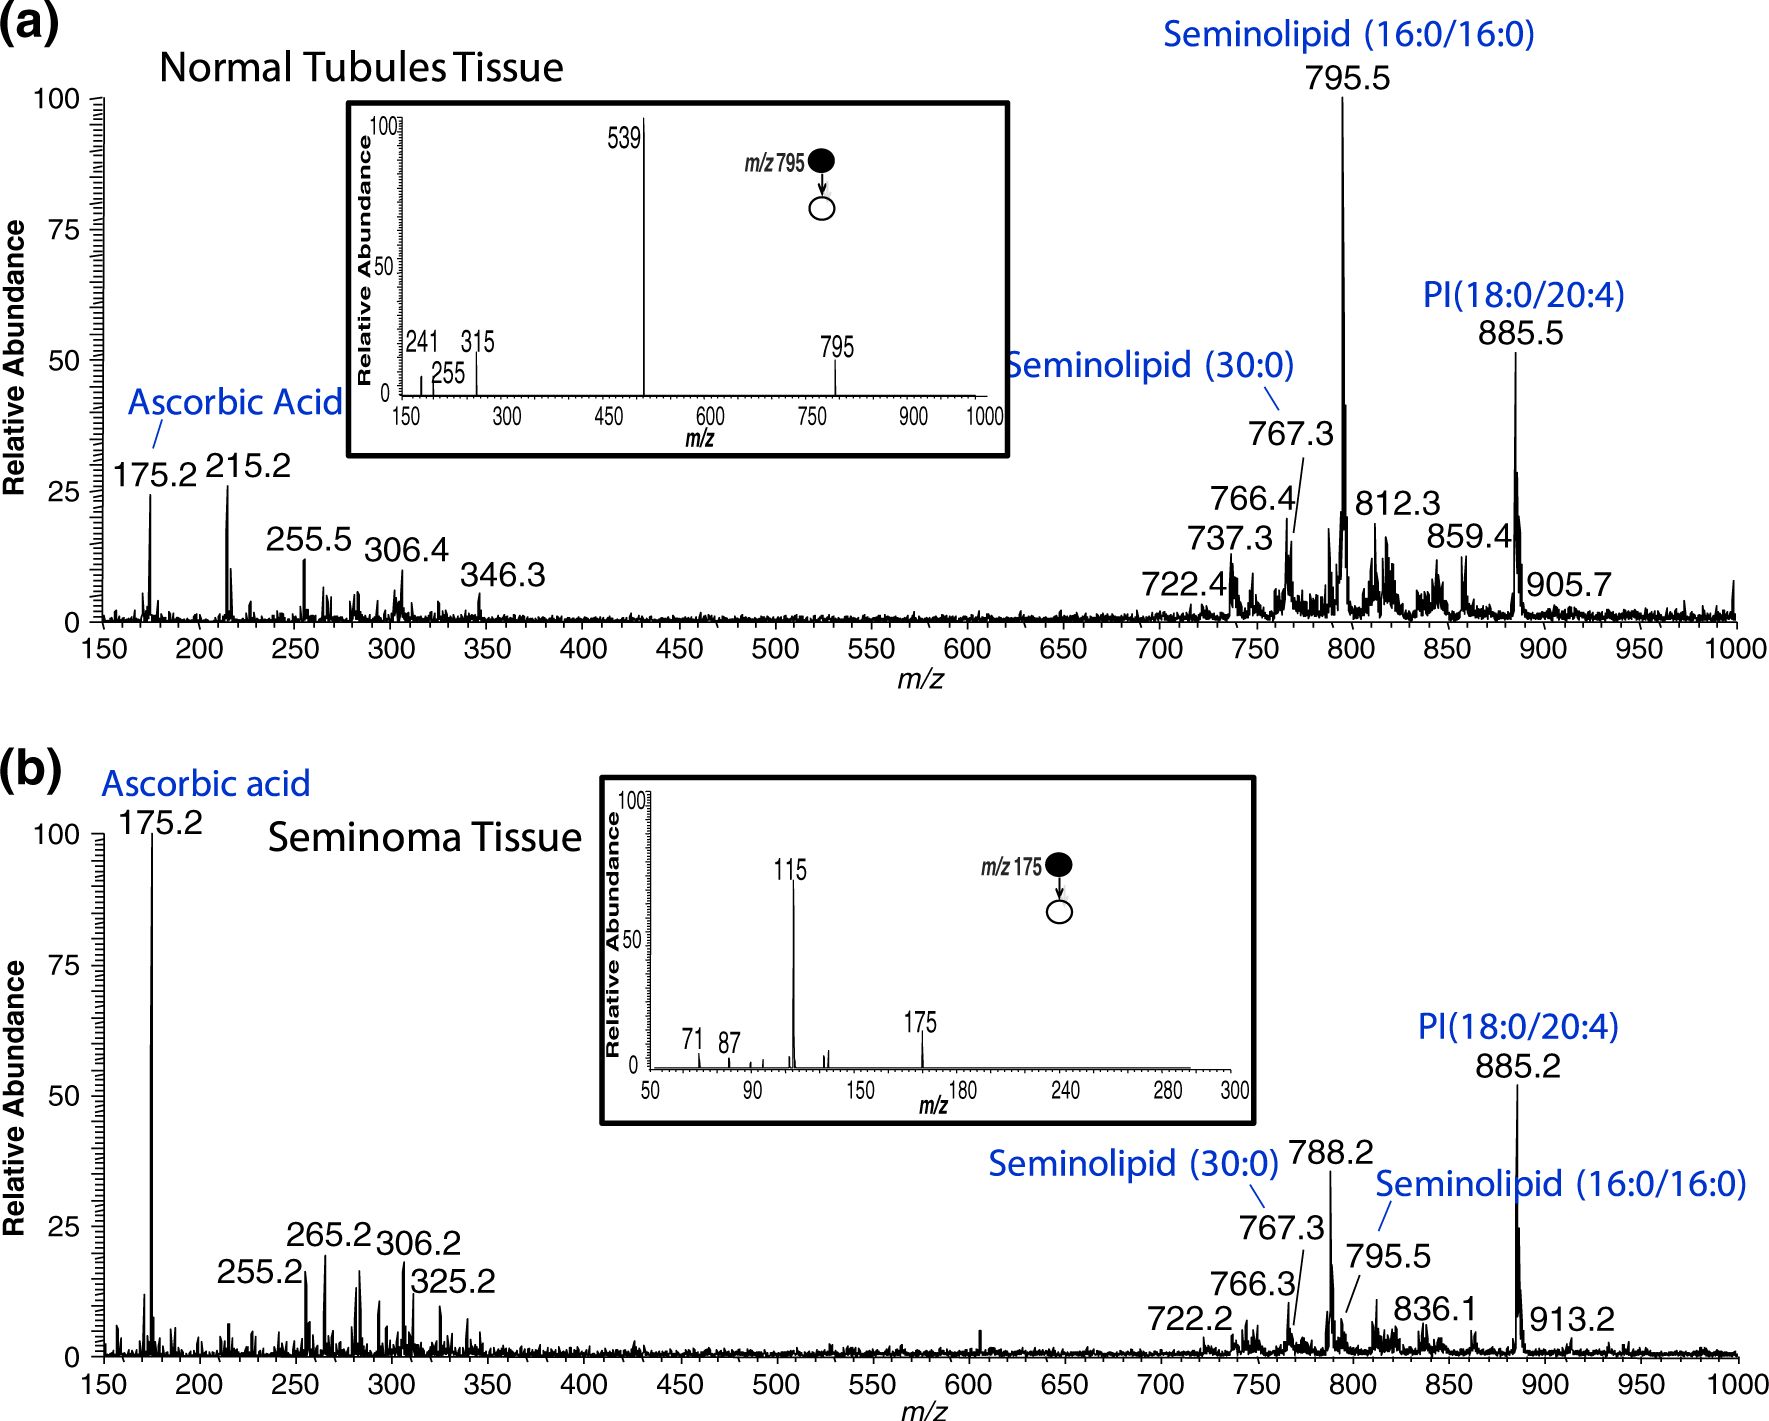
Representative negative ion mode full scan mass spectra of seminoma and adjacent normal tissues in the range of m/z 150 to m/z 1000. (a) Negative ion mode mass spectrum of the seminoma region of tissue sample UH0001–02. Inset is the MS/MS spectrum for the seminolipid (16:0/16:0), precursor ion m/z 795.4. (b) Negative ion mode mass spectrum of the normal region of the tissue sample UH0001–02. Inset is the MS/MS product ion spectrum for ascorbic acid, precursor ion m/z 175.2
Figure 2.
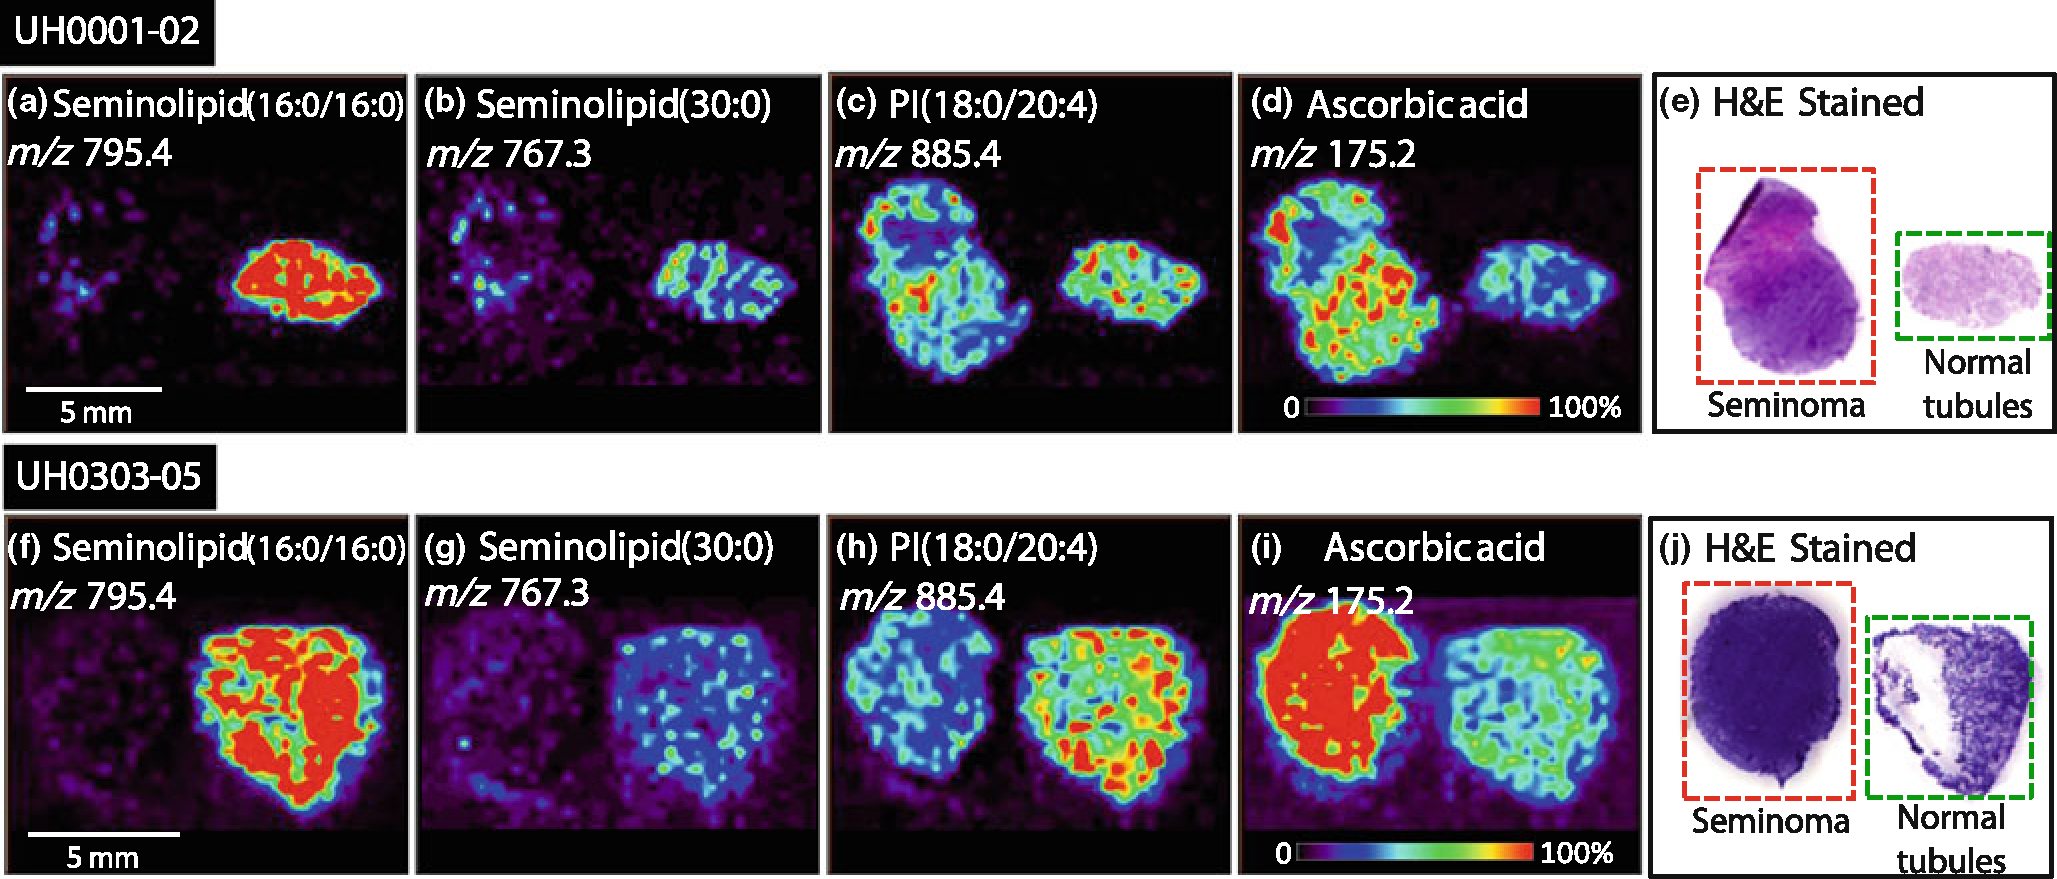
Negative ion mode tissue imaging of seminoma and adjacent normal tissue; (a) UH0001–02 ion image of m/z 795.4, seminolipid (16:0/16:0,) (b) UH0001–02 ion image of m/z 767.3, seminolipid (30:0), (c) UH0001–02 ion image of m/z 885.4, PI (18:0/20:4), (d) UH0001–02 ion image of m/z 175.2, ascorbic acid, (e) UH0001–02 H&E stained tissue sections of seminoma and normal tissue, (f) UH0303–05 ion image of m/z 795.4, seminolipid (16:0/16:0), (g) UH0303–05 ion image of m/z 767.3, seminolipid (30:0), (h) UH0303–05 ion image of m/z 885.4, PI(18:0/20:4), (i) UH0303–05 ion image of m/z 175.2, ascorbic acid, (j) UH0303–05 H&E stained tissue sections of seminoma and normal tissue
As seen in Figure 2, the seminolipids at m/z 795.4 [seminolipid(16:0/16:0)] and at m/z 767.3 [seminolipid (30:0)] appear at high intensities in the normal testis tissue and are undetectable within the tumor. This is in agreement with previous literature reports involving lipid extraction followed by thin lay chromatography separation, which shows the seminolipids to be absent from seminoma tissue [5]. The seminolipids are also not seen in tissue containing fat, muscle tissue, or blood vessels, confirming their localization in the normal tubules of testes tissue [24]. The species at m/z 885.4, PI(18:0/20:4) is slightly increased in normal testis tubule tissue compared with the seminoma tissue, but the absolute intensity is much lower than that of the seminolipids. In contrast, ascorbic acid at m/z 175.2 is increased in most seminoma tissues, specifically in 85% of the cases discussed here, while undetected in tissue containing fat, muscle tissue or blood vessels. The ratio of the absolute intensity of ascorbic acid in tumor tissue compared with its absolute intensity in normal tissue was compared for each sample pair. The ratio was greater than one for 17 out of 20 samples, showing an increase of ascorbic acid in tumor tissue as compared with normal tissue in 85% of the cases, see Table 1. Images showing similar trends were created for all 20 paired tissue samples.
Table 1.
Ratio of Tumor to Normal Ascorbic Acid Absolute Intensities
| Sample | Ratio of tumor to normal of ascorbic acid (m/z 175) |
|---|---|
|
| |
| MH0209-33 | 1.16 |
| UH0201-20 (original) | 14.00 |
| UH0201-20 (duplicate) | 17.07 |
| UH0206-08 (original) | 1.32 |
| UH0206-08 (duplicate) | 1.03 |
| UH0010-40 (original) | 2.86 |
| UH0010-40 (duplicate) | 1.17 |
| UH0101-35 (original) | 1.76 |
| UH0101-35 (duplicate) | 1.34 |
| UH0201-09 (original) | 2.32 |
| UH0201-09 (duplicate) | 2.39 |
| UH0303-05 | 2.17 |
| UH0310-56 | 2.12 |
| UH0810-35 | 11.43 |
| UH0408-40 | 3.51 |
| UH0001-02 | 1.54 |
| UH0108-13 | 1.27 |
| Total of 17 samples ratio > 1 | |
| UH0711-36 | 0.92 |
| UH0503-08 | 0.86 |
| UH0604-49 | 0.31 |
| Total of 3 samples ratio < 1 | |
The absence of seminolipid in seminoma was originally reported in 1974 by Ishizuka and Yamakawa [5]. In their study using thin layer chromatography on testicular seminoma tissues from three patients, seminolipid was unable to be detected in any of the cancerous sections. This is in contrast to the relative abundance seen within the normal seminiferous tubules of postpubertal males where seminolipid was the predominant glycolipid within these tissues. These same researchers later correlated the presence of increasing amounts of seminolipid seen within normal seminiferous tubules with sexual maturity and spermatogenesis, while failing to identify this same molecule in the testis of boys nine years of age or younger. They hypothesized that the absence of seminolipid in seminoma was due to the immature cellular state of the cancerous cells. In our experiments using DESI-MS, we were able to corroborate these findings in a series of 15 patients. Additionally, this is the first study to report the increased presence of ascorbic acid in human seminoma.
Ascorbic acid has been proposed to have anti-neoplastic effects and has many biological functions. For example, ascorbic acid is required for the synthesis of carnitine from lysine, neurotransmitter synthesis, cholesterol metabolism, as well as being an important antioxidant [25, 26]. Tumor cells are known to have increased requirements for glucose to meet their metabolic demands and increase the number of facilitative glucose transporters (GLUTs) to accommodate [27]. Ascorbic acid, which has some similarities to glucose in its molecular structure, can be transported into tumor cells through these same molecular transporters found within the cell wall [26]. The biological significance of increased uptake of ascorbic acid observed in the seminoma tissues by DESI-MS analysis remains largely unknown and hypothesis-generating only. However, this preferential co-transport of ascorbate with glucose into cancer cells has been proposed as a possible therapeutic avenue in the treatment of various malignancies. The administration of high levels of vitamin C has been shown to enhance the cytotoxicity of fluorouracil (5-FU) in a dose-dependent manner when treating mouse lymphoma [28]. Even more relevant in seminoma, high doses of antioxidants like ascorbic acid may improve the efficacy of radiation therapy through growth inhibition of cancer cells [29].
The reproducibility of DESI-MS imaging in terms of biological and analytical variability was also investigated. Duplicate tissue samples from the same orchiectomy procedure, obtained for five different patients from the tissue bank at different time points, were analyzed by DESI-MS and used to investigate biological variability. The results for one of the five cases, UH0201–09, are shown in Figure 3. DESI-MS ion images obtained for the duplicate tissues are in good qualitative agreement showing, for both the seminolipids and for PI(18:0/20:4), increased intensity in the normal tissue, increased ascorbic acid intensity in the seminoma tissue, and equal intensity PS(18:0/18:1) in both seminoma and normal tissue. All five cases of duplicate samples showed excellent agreement between the sets in the DESI-MS ion images generated as well as the ion intensities as they relate to tissue type. Reproducibility was accessed by calculating the ratio between the absolute intensity of the two main peaks (excluding the seminolipid m/z 795.4, which could not be used in the ratio as it was not present in all normal tissue from the five tissue pairs) observed in the averaged mass spectra, m/z 788.2 and 885.4. The ratios within each duplicate tissue pair obtained from each of the tumor and normal tissue sections were in good agreement with percent relative standard deviation (%RSD) values of 2%–12%, see Table 2. The ratios between different tissue pairs confer no information since each normal tissue section did not contain the same type of tissue, i.e., normal tubules, fat, or muscle tissue.
Figure 3.
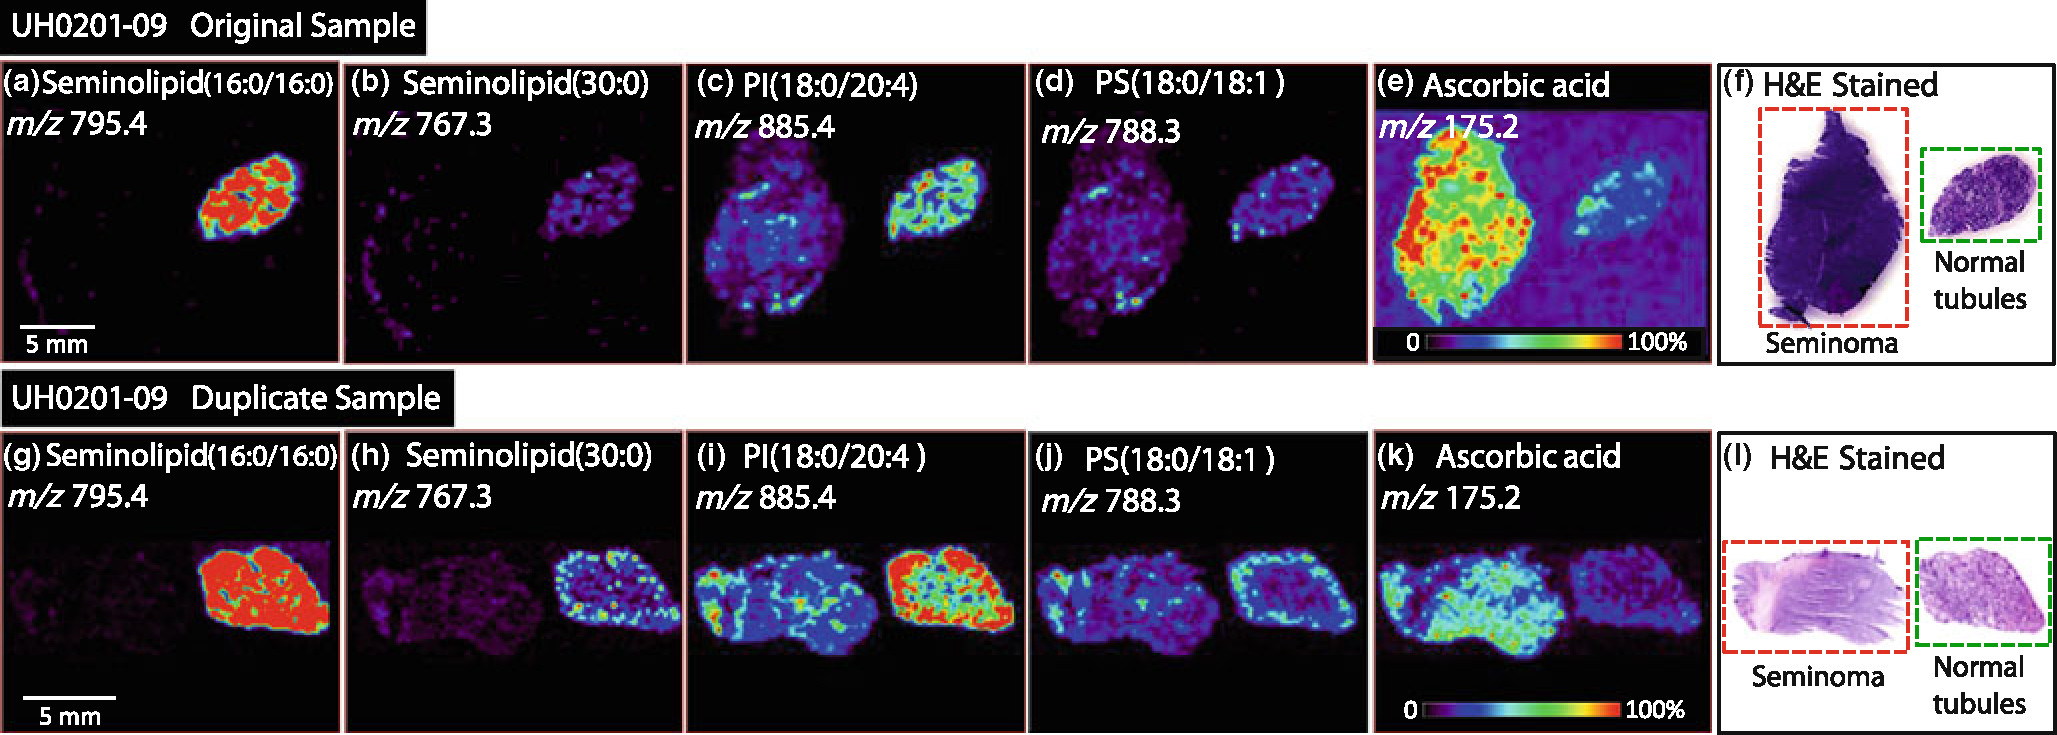
Negative ion mode tissue imaging of seminoma and adjacent normal tissue of duplicate tissue samples; (a)–(f) original tissue sections of UH0201–49, (a) ion image of m/z 795.4, seminolipid (16:0/16:0), (b) ion image of m/z 767.3, seminolipid (30:0), (c) ion image of m/z 885.4, PI(18:0/20:4), (d) ion image of m/z 788.3 (PS[18:0/18:1]), (e) ion image of m/z 175.2, ascorbic acid, (f) H&E stained tissue sections of seminoma and normal tissue. (g)–(I) Duplicate tissue sections of UH0201–49, (g) ion image of m/z 795.4, seminolipid (16:0/16:0), (j) ion image of m/z 767.3, seminolipid (30:0), (i) ion image of m/z 885.4, PI(18:0/20:4), (j) ion image of m/z 788.3 (PS[18:0/18:1]), (k) ion image of m/z 175.2, ascorbic acid, (l) H&E stained tissue sections of seminoma and normal tissue
Table 2.
Biological Variability
| Sample | Tumor tissue | Normal tissue | |
|---|---|---|---|
|
|
|||
| Ratio m/z 788 to m/z 885 | |||
|
| |||
| UH0201-20 | Original | 0.70 | 1.48 |
| Duplicate | 0.73 | 1.44 | |
| Average | 0.72 | 1.46 | |
| %RSD | 2.97 | 1.94 | |
| UH0206-08 | Original | 0.98 | 0.95 |
| Duplicate | 0.94 | 0.92 | |
| Average | 0.96 | 0.94 | |
| %RSD | 2.95 | 2.27 | |
| UH0101-35 | Original | 0.79 | 0.28 |
| Duplicate | 0.75 | 0.24 | |
| Average | 0.77 | 0.26 | |
| %RSD | 3.67 | 10.88 | |
| UH0201-09 | Original | 0.74 | 0.38 |
| Duplicate | 0.70 | 0.32 | |
| Average | 0.72 | 0.35 | |
| %RSD | 3.93 | 12.12 | |
| UH0001-40 | Original | 1.38 | 2.38 |
| Duplicate | 1.51 | 2.58 | |
| Average | 1.44 | 2.48 | |
| %RSD | 6.58 | 5.67 | |
Analytical variability was assessed through the sequential analysis of five serial tissue sections from sample UH0303–05. As shown in Figure 4, the five replicates compare well with each other in terms of the distribution and intensities of m/z 788.2 PS(18:0/18:1), m/z 885.4 PI(18:0/20:4), and m/z 795.4, seminolipid(16:0/16:0). Some variation between serial sections can be expected and could account for the slight intensity differences between the replicates, but the overall pattern of ion intensities remained consistent from sample to sample. Reproducibility was accessed by calculating the ratio between the absolute intensity of the two main peaks observed in the averaged mass spectra, m/z 788.2 and 885.4 for the tumor tissue and m/z 795.4 and 885.4 for the normal tissue. The average ratio value obtained from the five tissue sections was 1.17 with a %RSD of 1.23% for the tumor tissue and 4.17 with a %RSD of 8.79% for the normal tissue, see Table 3.
Figure 4.
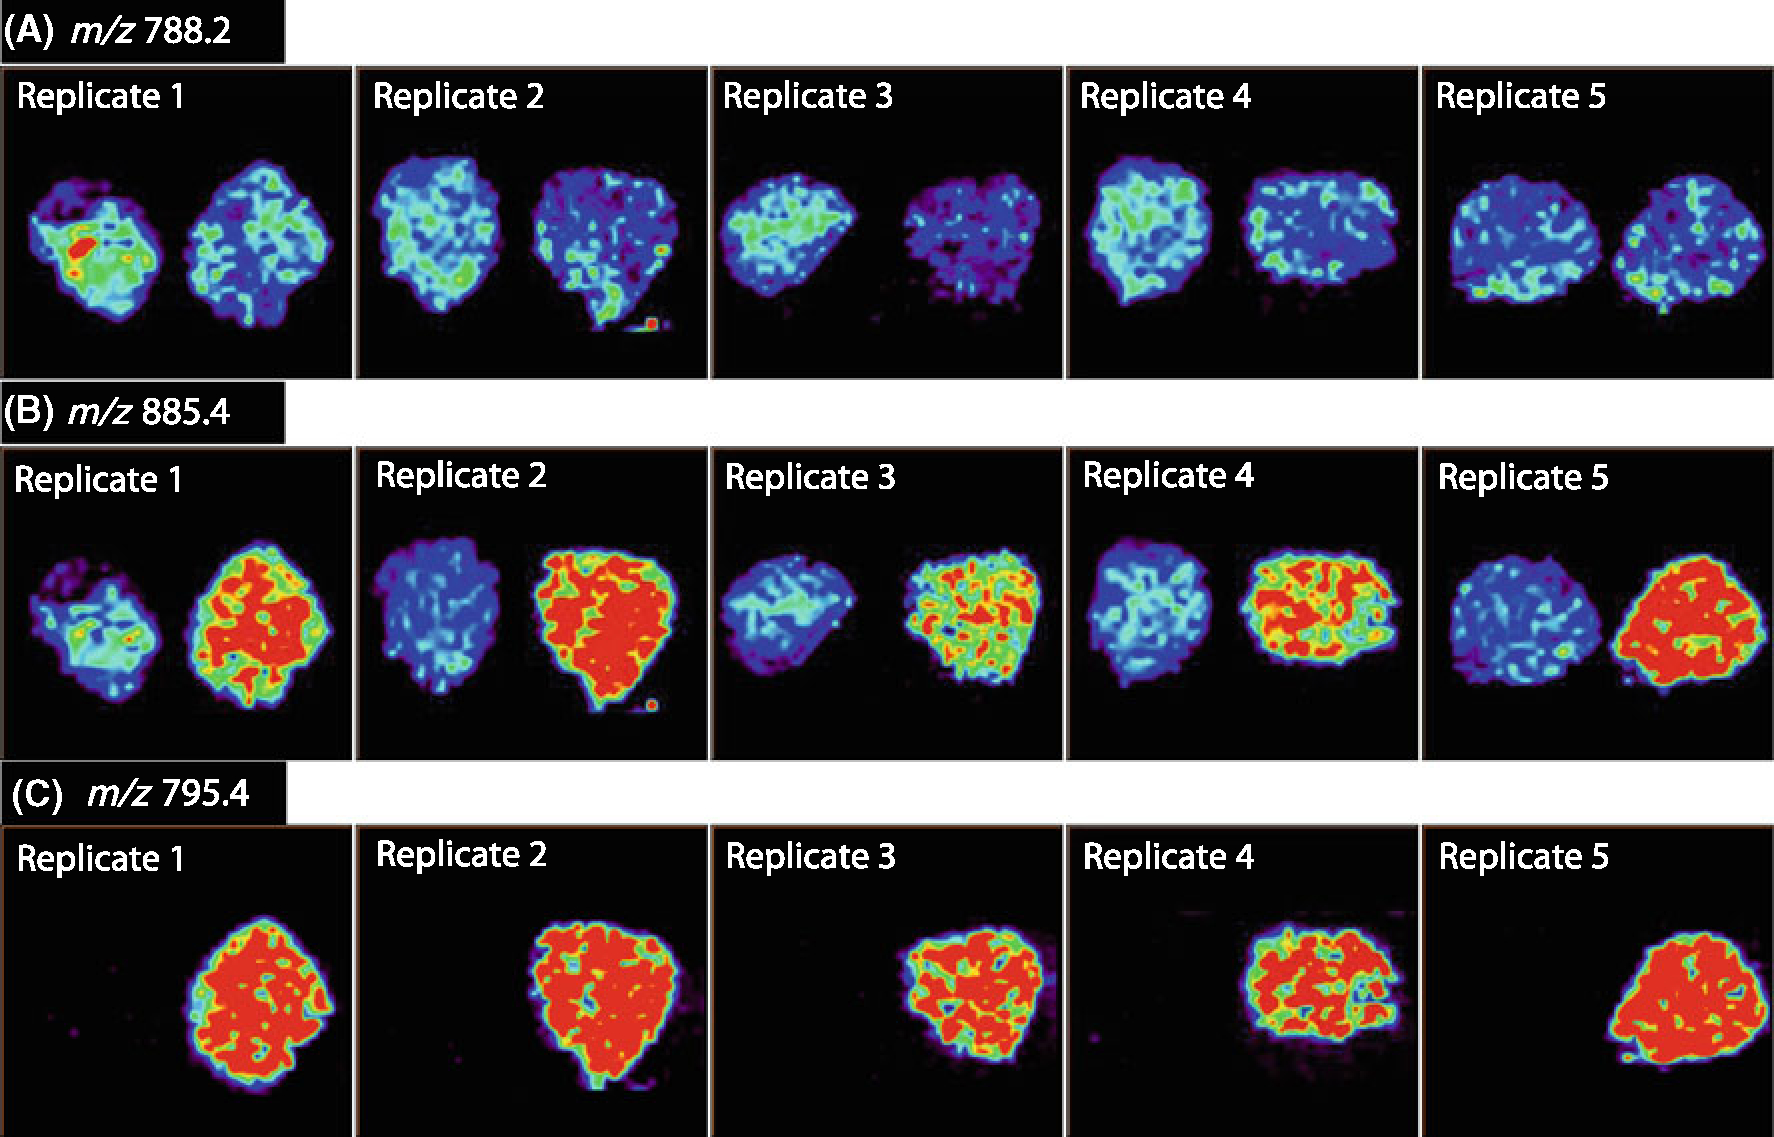
Negative ion mode imaging of seminoma and adjacent normal tissue of five replicate samples of UH0303–05. (A) Ion images of m/z 788.2 PS(18:0/18:1), (B) ion images of m/z 885.4, PI(18:0/20:4), (C) ion images of m/z 795.4, seminolipid (16:0/16:0)
Table 3.
Analytical Variability
| Sample | Tumor Tissue | Normal Tissue |
|---|---|---|
|
| ||
| UH0303-05 | Ratio (m/z) | |
|
|
||
| 788/885 | 795/885 | |
|
| ||
| Rep 1 | 1.17 | 4.04 |
| Rep 2 | 1.20 | 4.74 |
| Rep 3 | 1.18 | 3.74 |
| Rep 4 | 1.18 | 4.24 |
| Rep 5 | 1.16 | 4.09 |
| Average | 1.17 | 4.17 |
| Std dev | 0.01 | 0.37 |
| %RSD | 1.25 | 8.79 |
Conclusion
DESI-MS has the potential to be a valuable tool in molecular pathology due to its specificity and relative ease of use with no further sample preparation after tissue sectioning. It simultaneously provides detailed chemical information from tissue sections, allowing for the examination of multiple marker compounds on which a diagnosis can be based. DESI-MS analysis also has the advantage of being conducted in the ambient environment facilitating the potential transition into a clinical setting for applications such as intrasurgical disease diagnosis and tumor margin delineation.
In the human seminoma cases, DESI-MS analysis allowed for easy visualization of the normal tissue by the intensity of the seminolipids as well as for the cancerous tissue by the ascorbic acid intensity. Furthermore, while the detection of seminolipids only discriminates normal tissue from all other types, cancerous tissue can be discriminated from tissue containing fat, muscle tissue, or blood vessels by DESI-MS analysis, as ascorbic acid is observed only in seminoma tissues. The absence of seminolipids in seminoma was corroborated, while the presence of ascorbic acid within these tumors compared with normal seminiferous tubules was newly identified. Additional studies to determine the biological significance of these findings will be required.
Acknowledgments
The authors acknowledge support for this work by the National Institutes of Health (grant 1 R21 EB00 9459–01).
References
- 1.Attar M, Kates M, Khalil MB, Carrier D, Wong PTT, Tanphaichitr NA: Fourier-transform infrared study of the interaction between germ-cell specific sulfogalactosylglycerolipid and dimyristoyl-glycerophosphocholine. Chem. Phys. Lipids 106, 101–114 (2000) [DOI] [PubMed] [Google Scholar]
- 2.Hakomori S: Cell adhesion/recognition and signal transduction through glycosphingolipid microdomain. Glycoconj. J. 17, 143–151 (2000) [DOI] [PubMed] [Google Scholar]
- 3.Ueno K, Ishizuka I, Yamakawa T: Glycolipid composition of human testis at different ages and stereochemical configuration of seminolipid. Biochim. Biophys. Acta 487, 61–73 (1977) [PubMed] [Google Scholar]
- 4.Goto-Inoue N, Hayasaka T, Zaima N, Setou M: The specific localization of seminolipid molecular species on mouse testis during testicular maturation revealed by imaging mass spectrometry. Glycobiology 19, 950–957 (2009) [DOI] [PubMed] [Google Scholar]
- 5.Ishizuka I, Yamakawa T: Absence of seminolipid in seminoma tissue with concomitant increase of sphingoglycolipids. J. Biochem. 76, 221–223 (1974) [DOI] [PubMed] [Google Scholar]
- 6.Nemes P, Woods AS, Vertes A: Simultaneous imaging of small metabolites and lipids in rat brain tissues at atmospheric pressure by laser ablation electrospray ionization mass spectrometry. Anal. Chem. 82, 982–988 (2010) [DOI] [PMC free article] [PubMed] [Google Scholar]
- 7.Schafer KC, Denes J, Albrecht K, Szaniszlo T, Balog J, Skoumal R, Katona M, Toth M, Balogh L, Takats Z: In vivo, in situ tissue analysis using rapid evaporative ionization mass spectrometry. Angew. Chem. Int. Ed. 48, 8240–8242 (2009) [DOI] [PubMed] [Google Scholar]
- 8.Shelley JT, Ray SJ, Hieftje GM: Laser ablation coupled to a flowing atmospheric pressure afterglow for ambient mass spectral imaging. Anal. Chem. 80, 8308–8313 (2008) [DOI] [PubMed] [Google Scholar]
- 9.Takats Z, Wiseman JM, Gologan B, Cooks RG: Mass spectrometry sampling under ambient conditions with desorption electrospray ionization. Science 306, 471–473 (2004) [DOI] [PubMed] [Google Scholar]
- 10.Dill AL, Eberlin LS, Costa AB, Zheng C, Ifa DR, Cheng L, Masterson TA, Koch MO, Vitek O, Cooks RG Multivariate statistical classification of human bladder carcinomas using ambient ionization imaging mass spectrometry. Chem. Eur. J. 17, 2897–2902 (2011) [DOI] [PMC free article] [PubMed] [Google Scholar]
- 11.Wiseman JM, Puolitaival SM, Takats Z, Cooks RG, Caprioli R: Mass spectrometric profiling of intact biological tissue by using desorption electrospray ionization. Angew. Chem. Int. Edit. 44, 7094–7097 (2005) [DOI] [PubMed] [Google Scholar]
- 12.Eberlin LS, Dill AL, Costa AB, Ifa DR, Cheng L, Masterson T, Koch M, Ratliff TL, Cooks RG: Cholesterol sulfate imaging in human prostate cancer tissue by desorption electrospray ionization mass spectrometry. Anal. Chem. 82, 3430–3434 (2010) [DOI] [PMC free article] [PubMed] [Google Scholar]
- 13.Dill AL, Ifa DR, Manicke NE, Costa AB, Ramos-Vara JA, Knapp DW, Cooks RG: Lipid profiles of canine invasive transitional cell carcinoma of the urinary bladder and adjacent normal tissue by desorption electrospray ionization imaging mass spectrometry. Anal. Chem. 81, 8758–8764 (2009) [DOI] [PMC free article] [PubMed] [Google Scholar]
- 14.Dill A, Eberlin L, Zheng C, Costa A, Ifa D, Cheng L, Masterson T, Koch M, Vitek O, Cooks R: Multivariate statistical differentiation of renal cell carcinomas based on lipidomic analysis by ambient ionization imaging mass spectrometry. Anal. Bioanal. Chem. 398, 2969–2978 (2010) [DOI] [PMC free article] [PubMed] [Google Scholar]
- 15.Eberlin LS, Dill AL, Golby AJ, Ligon KL, Wiseman JM, Cooks RG, Agar NYR: Discrimination of human astrocytoma subtypes by lipid analysis using desorption electrospray ionization imaging mass spectrometry. Angew. Chem. Int. Edit. 49, 5953–5956 (2010) [DOI] [PMC free article] [PubMed] [Google Scholar]
- 16.Manicke NE, Kistler T, Ifa DR, Cooks RG, Ouyang Z: High-throughput quantitative analysis by desorption electrospray ionization mass spectrometry. J. Am. Soc. Mass Spectrom. 20, 321–325 (2009) [DOI] [PubMed] [Google Scholar]
- 17.Eberlin LS, Ifa DR, Wu C, Cooks RG: Three-dimensional visualization of mouse brain by lipid analysis using ambient ionization mass spectrometry. Angew. Chem. Int. Edit. 49, 873–876 (2010) [DOI] [PMC free article] [PubMed] [Google Scholar]
- 18.Dill AL, Ifa DR, Manicke NE, Costa AB, Ramos-Vara JA, Knapp DW, Cooks RG: Lipid profiles of canine invasive transitional cell carcinoma of the urinary bladder and adjacent normal tissue by desorption electrospray ionization imaging mass spectrometry. Anal. Chem. 81, 8758–8764 (2009) [DOI] [PMC free article] [PubMed] [Google Scholar]
- 19.Manicke NE, Wiseman JM, Ifa DR, Cooks RG: Desorption electrospray ionization (DESI) mass spectrometry and tandem mass spectrometry (MS/MS) of phospholipids and sphingolipids: Ionization, adduct formation, and fragmentation. J. Am. Soc. Mass Spectrom. 19, 531–543 (2008) [DOI] [PubMed] [Google Scholar]
- 20.Pulfer M, Murphy RC: Electrospray mass spectrometry of phospholipids. Mass Spectrom. Rev. 22, 332–364 (2003) [DOI] [PubMed] [Google Scholar]
- 21.Wu CP, Ifa DR, Manicke NE, Cooks RG: Molecular imaging of adrenal gland by desorption electrospray ionization mass spectrometry. Analyst 135, 28–32 (2010) [DOI] [PubMed] [Google Scholar]
- 22.Wiseman JM, Ifa DR, Zhu YX, Kissinger CB, Manicke NE, Kissinger PT, Cooks RG: Desorption electrospray ionization mass spectrometry: Imaging drugs and metabolites in tissues. Proc. Natl. Acad. Sci. U.S.A. 105, 18120–18125 (2008) [DOI] [PMC free article] [PubMed] [Google Scholar]
- 23.Ellis SR, Wu CP, Deeley JM, Zhu XJ, Truscott RJW, Panhuis MIH, Cooks RG, Mitchell TW, Blanksby SJ: Imaging of human lens lipids by desorption electrospray ionization mass spectrometry. J. Am. Soc. Mass Spectrom. 21, 2095–2104 (2010) [DOI] [PubMed] [Google Scholar]
- 24.Goto-Inoue N, Hayasaka T, Zaima N, Setou M: The specific localization of seminolipid molecular species on mouse testis during testicular maturation revealed by imaging mass spectrometry. Glycobiology 19, 950–957 (2009) [DOI] [PubMed] [Google Scholar]
- 25.Cameron E, Pauling L, Leibovitz B: Ascorbic-acid and cancer—review. Cancer Res. 39, 663–681 (1979) [PubMed] [Google Scholar]
- 26.Gonzalez MJ, Miranda-Massari JR, Mora EM, Guzman A, Riordan NH, Riordan HD, Casciari JJ, Jackson JA, Roman-Franco A: Orthomolecular oncology review: Ascorbic acid and cancer 25 years later. Integr. Cancer Ther. 4, 32–44 (2005) [DOI] [PubMed] [Google Scholar]
- 27.Warburg O: Origin of cancer cells. Science 123, 309–314 (1956) [DOI] [PubMed] [Google Scholar]
- 28.Nagy B, Mucsi I, Molnar J, Varga A, Thurzo L: Chemosensitizing effect of vitamin C in combination with 5-fluorouracil in vitro. In Vivo 17, 289–292 (2003) [PubMed] [Google Scholar]
- 29.Prasad KN, Cole WC, Kumar B, Prasad KC: Pros and cons of antioxidant use during radiation therapy. Cancer Treat. Rev. 28, 79–91 (2002) [DOI] [PubMed] [Google Scholar]