Abstract
The dysregulation of some solute carrier (SLC) proteins has been linked to a variety of diseases, including diabetes and chronic kidney disease. However, SLC-related genes (SLCs) has not been extensively studied in acute myocardial infarction (AMI). The GSE66360 and GSE60993 datasets, and SLCs geneset were enrolled in this study. Differentially expressed SLCs (DE-SLCs) were screened by overlapping DEGs between the AMI and control groups and SLCs. Next, functional enrichment analysis was carried out to research the function of DE-SLCs. Consistent clustering of samples from the GSE66360 dataset was accomplished based on DE-SLCs selected. Next, the gene set enrichment analysis (GSEA) was performed on the DEGs-cluster (cluster 1 vs cluster 2). Three machine learning models were performed to obtain key genes. Subsequently, biomarkers were obtained through receiver operating characteristic (ROC) curves and expression analysis. Then, the immune infiltration analysis was performed. Afterwards, single-gene GSEA was carried out, and the biomarker-drug network was established. Finally, quantitative real-time fluorescence PCR (qRT-PCR) was performed to verify the expression levels of biomarkers. In this study, 13 DE-SLCs were filtered by overlapping 366 SLCs and 448 DEGs. The functional enrichment results indicated that the genes were implicated with amino acid transport and TNF signaling pathway. After the consistency clustering analysis, the samples were classified into cluster 1 and cluster 2 subtypes. The functional enrichment results showed that DEGs-cluster were implicated with chemokine signaling pathway and so on. Further, SLC11A1 and SLC2A3 were identified as SLC-related biomarkers, which had the strongest negative relationship with resting memory CD4 T cells and the strongest positive association with activated mast cells. In addition, the single-gene GSEA results showed that cytosolic ribosome was enriched by the biomarkers. Five drugs targeting SLC2A3 were predicted as well. Lastly, the experimental results showed that the biomarkers expression trends were consistent with public database. In this study, 2 SLC-related biomarkers (SLC11A1 and SLC2A3) were screened and drug predictions were carried out to explore the prediction and treatment of AMI.
Keywords: acute myocardial infarction, biomarkers, clustering analysis, solute carrier family-related genes
1. Introduction
Acute myocardial infarction (AMI) is the sudden reduction or interruption of coronary blood flow, resulting in irreversible damage to the myocardial tissue, including ST-elevation myocardial infarction and non-ST-elevation myocardial infarction.[1] AMI is one of the main causes of disability and death from cardiovascular diseases in the world, which seriously threatens human health.[2] The number of patients diagnosed with AMI each year exceeds 7 million.[3] Approximately one-third of patients with cardiovascular disease die of AMI.[4] Early rapid and accurate diagnosis of AMI is essential in treating AMI patients. AMI is currently diagnosed using a series of biomarkers, such as cardiac troponin I, cardiac troponin T, and the MB isoenzyme of creatine kinase.[5] However, it cannot be identified early and effectively due to the limitations of specificity and high sensitivity.[6] In addition, AMI recognized risk factors can also affect early diagnosis, including hypertension, smoking, abnormal lipid metabolism, diabetes, obesity, etc.[3] The etiology of AMI is complex and affected by many factors. Therefore, it is very important to find new diagnostic markers that can accurately identify AMI.
The solute carrier (SLC) super-family encodes the second largest membrane transporter group after the G protein-coupled receptor, including 65 families, and more than 400 SLC transporters have been reported.[7–9] Proteins are mainly found in the membranes of cells and organelles, where they promote the exchange of various molecular substrates in order to maintain the homeostasis of the cell.[10,11] SLC transporters transport a variety of substrates, including glucose, amino acids, vitamins, nucleotides, neurotransmitters, and drugs, depending on the electrochemical gradient or ion gradient.[12,13] Studies have found that SLC transporters are also involved in many important physiological functions, such as nutrients, energy metabolism, tissue development, oxidative stress, host defense, and neurotransmitter regulation.[14,15] In addition, the disorder of the SLC protein is associated with a variety of diseases, including diabetes, hypertension, asthma, skin diseases, cancer, mental disorders, and so on.[16,17] At present, the research of the SLC family on AMI is rarely reported. Therefore, the study of potential key genes related to the SLC family in AMI is expected to provide a new reference for the diagnosis and treatment of AMI.
In this study, 2 biomarkers were screened out by using the transcriptome and clinical data of AMI from the Gene Expression Omnibus database, and the regulatory network of biomarkers in patients with AMI based on solute carrier family-related genes and the target small molecule drugs for biomarkers was constructed. Afterward, we performed quantitative real-time fluorescence PCR (qRT-PCR) on peripheral blood samples, and the results were consistent with our initial predictions. It provides a basis and a new reference for the diagnosis of AMI and also provides a basis for new therapeutic targets for AMI.
2. Materials and methods
2.1. Data sources
The GSE66360 and GSE60993 datasets were sourced from the Gene Expression Omnibus database (https://www.ncbi.nlm.nih.gov/geo/). The GSE66360 dataset (GPL570) including the RNA-seq data of whole blood from 49 AMI samples and 50 control samples, was used as a training cohort. The GSE60993 dataset (GPL6884), including the RNA-seq data of blood from 7 control samples and 17 AMI cohorts, was regarded as an external validation cohort. In addition, the SLC family was used as a keyword to obtain 366 SLC family-related genes (SLCs) with score > 15 through the Genecards database (https://www.genecards.org/).
2.2. Identification of DEGs
DEGs between the AMI and control groups were chosen via the limma package (v 3.50.1) in the GSE66360 dataset with P value < .05 and |log2FC| > 1.[18] The results of the differential analysis were illustrated by volcano map plotted by the ggplot2 package (v 3.3.5).[19] Then, the expression heat map was carried out to show the top 10 up- and down-regulated DEGs.
2.3. Screening and enrichment analysis of differentially expressed SLCs (DE-SLCs)
DE-SLCs were screened by overlapping DEGs and SLCs. Gene Ontology (GO) and the Kyoto Encyclopedia of Genes and Genomes (KEGG) enrichment analyses of DE-SLCs was executed via clusterProfiler package (adjusted P value < .05).[20]
2.4. Ingenuity pathway analysis (IPA)
The IPA functional enrichment analysis was carried out on the DE-SLCs. Of these, a z score > 0 denotes that the pathway was enabled and a z-score < 0 denotes that the pathway was suppressed.
2.5. Consistency clustering analysis
The consistency clustering analysis was performed on the GSE66360 dataset utilizing the ConsensusClusterPlus package (v 1.58.0) on the basis of DE-SLCs.[21]
2.6. Screening for DEGs between subtypes (DEGs-cluster) and gene set enrichment analysis (GSEA) analysis
DEGs-cluster between the subtypes were selected via the limma package (v 3.50.1) with P < .05 and |log2FC| > 1.[18] Then, GSEA analysis was performed between subtypes. The top 5 most significant results for GO and KEGG were visualized separately.
2.7. Immune microenvironment analysis
The proportions of 22 immune cell subtypes for each sample in the GSE66360 dataset were computed via the CIBERSORT algorithm (v 1.03).[22] Differences in the abundance of each immune cell between subtypes were next evaluated using the Wilcoxon test.
2.8. Machine learning screening and performance evaluation of key genes
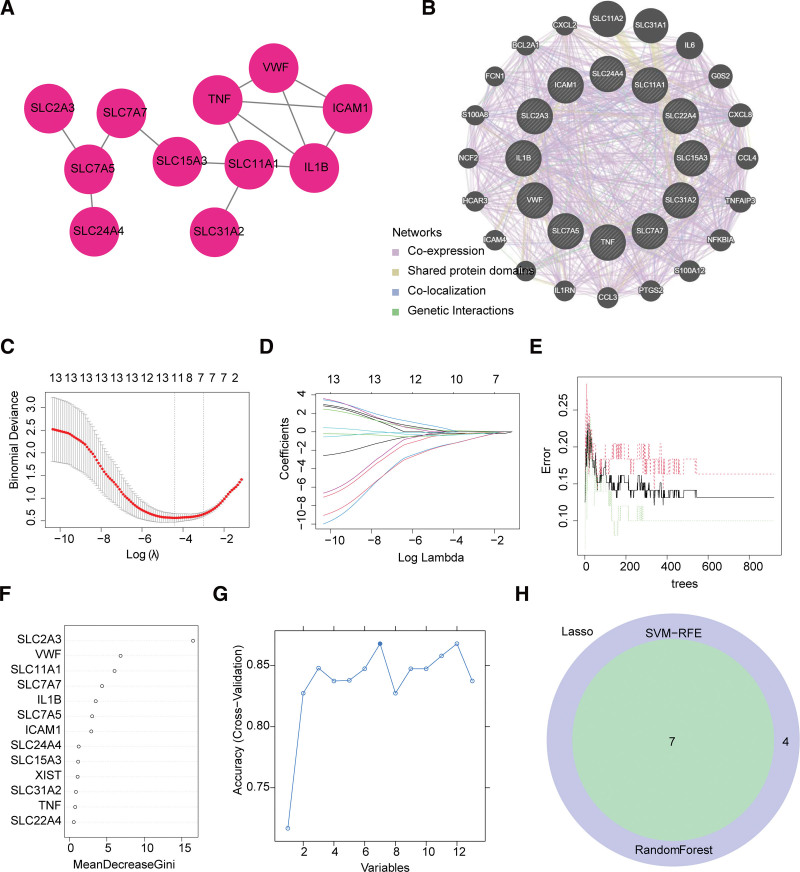
Firstly, the protein-protein interactions (PPI) network was created based on DE-SLCs via the STRING database. Then, the DE-SLCs were imported into the GeneMANIA database to construct the protein interaction network. Three machine learning models were constructed based on DE-SLCs by the least absolute shrinkage and selection operator (LASSO), random forest (RF), and support vector machine recursive feature elimination (SVM-RFE) algorithms to screen feature genes separately. LASSO regression profiling was carried out using the glmnet package (version 4.1-2) to obtain LASSO-feature genes.[23] RF analysis was performed based on DE-SLCs, and genes with Gini coefficient greater than or equal to the median were used as RF-feature genes. Next, SVM analysis was performed. Finally, the genes included in the portfolio with the highest accuracy rate were selected as SVM-RFE-feature genes. The key genes were screened by overlapping LASSO-feature genes, RF-feature genes and SVM-RFE-feature genes.
2.9. Receiver operating characteristic (ROC) curves and expression analysis
The pROC package (v 1.18.0) was utilized to compute AUC values of ROC curves to assess the predictive accuracy of the key genes.[24] And then, the key genes were verified with GSE60993 dataset. The expression analysis of key genes was also performed in the GSE66360 and GSE60993 datasets, and box plots of expression were plotted. The genes validated by ROC curves and expression at the same time were utilized as biomarkers for this study.
2.10. Single-gene GSEA analysis
In this study, single-gene GSEA analysis (GO and KEGG) of biomarkers was carried out. The top 5 most significant results for each biomarker were visualized separately.
2.11. Immuno-infiltration analysis
The CIBERSORT algorithm (v 1.03) was utilized to compute the abundance of immune infiltrating cells for all samples in the GSE66360 dataset.[22] The Wilcoxon test was utilized to compare the difference in abundance of each immune cell between the AMI and control groups. Subsequently, the association between differential immune cells was analyzed. Finally, the correlation between biomarkers and differential immune cells was analyzed, and the results were presented by lollipop plots.
2.12. Construction of Transcription factors (TF)-mRNA-miRNA network
In this study, miRNet and StarBase databases were utilized to predict the targeting miRNAs of biomarkers. The co-miRNAs were obtained by intersecting the predicted miRNAs targeting biomarkers in the 2 databases. The TFs of biomarkers was retrieved using the ChEA3 and JASPAR databases. Similarly, co-TFs could be obtained by fetching the intersection of the predicted TFs. Lastly, the network was visualized using Cytoscape software (v 3.9.1).[25]
2.13. Construction of mRNA-drug interaction network
In order to find potential therapeutic small molecule drugs acting on biomarkers, we performed drug prediction. Medicines targeting biomarkers were forecasted through the DrugBank database. A mRNA-drug network was constructed based on the predicted results.
2.14. RNA isolation and qRT-PCR
This study was approved by the Medical Ethics Committee of Chongqing Municipal General Hospital (Ethical Batch No.: KY S2022-085-01), in line with the “Helsinki Declaration”. And then all subjects signed a written informed consent. Twenty blood samples (10 AMI samples and 10 control samples) were collected. AMI is diagnosed according to the diagnostic criteria for AMI.[26] Afterwards, the samples were lysed with TRIzol reagent to extract total RNA. The concentration of RNA was measured with a NanoPhotometer N50. Afterwards, RNA was reverse transcribed into cDNA using the SureScript First strand cDNA synthesis kit (Servicebio, Wuhan, China). The qRT-PCR reaction consisted of 3 µL of reverse transcription product, 5 µL of 2xUniversal Blue SYBR Green qPCR Master Mix, and 1 µL each of forward and reverse primer. All primer sequence information were shown in Table 1. The relative gene expression was measured by the 2-ΔΔCT method using the β-actin gene as an internal reference.[27] Graphpad Prism 5 was used to make the graph and compute the P value.
Table 1.
The primer informations in the qRT-PCR.
| Gene | Primer sequences |
|---|---|
| SLC11A1 F | CCTCCACGACTACGCCAAGA |
| SLC11A1 R | AAGCCCTCCATCACGAACTG |
| SLC2A3 F | GCACATAGCTATCAAGTGTGCTT |
| SLC2A3 R | AGTGAGAAATGGGACCCTGC |
| β-actin F | CTCCATCCTGGCCTCGCTGT |
| β-actin R | GCTGTCACCTTCACCGTTCC |
2.15. Statistical analysis
All bioinformatics analyses were carried out in R language. Differences between groups were compared by Wilcoxon test. Graphpad Prism 5 was used to compute the statistical differences of biomarkers expressions between clinical AMI and control blood samples through unpaired t test. If not specified, P value < .05 denoted statistical significance.
3. Results
3.1. Screening and functional enrichment of DE-SLCs
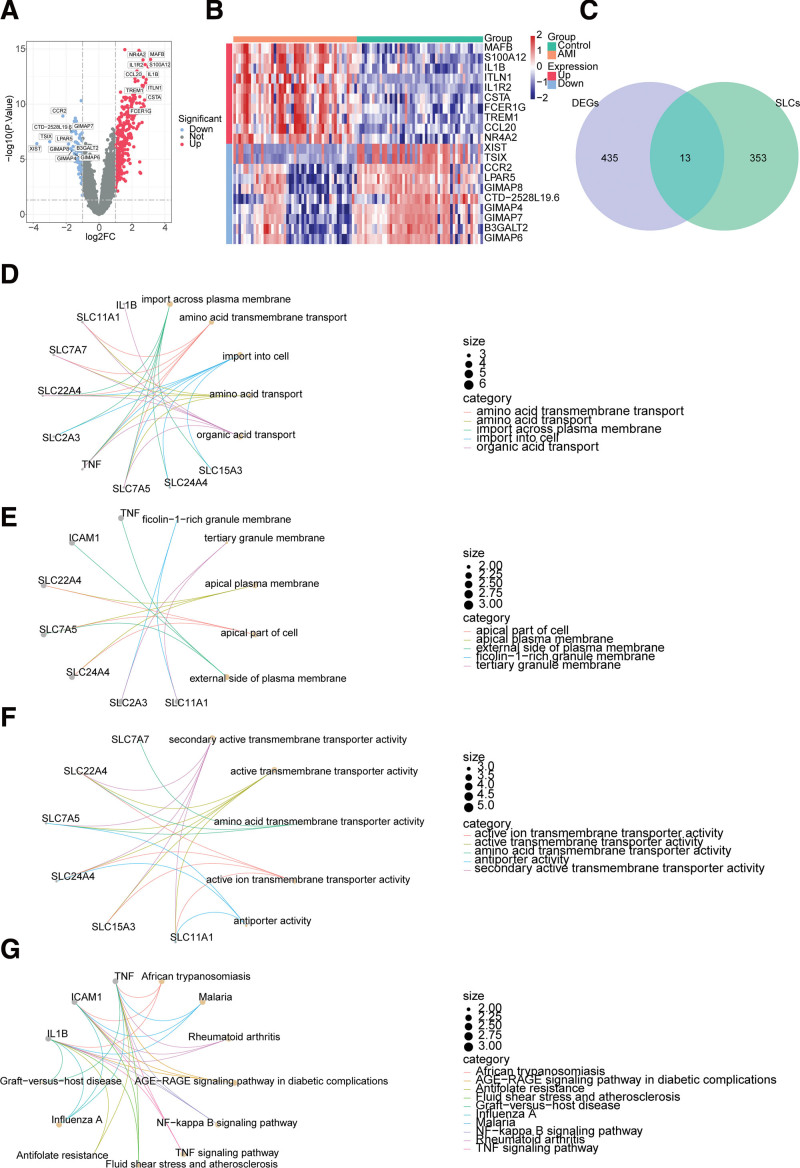
In total, 448 DEGs between the AMI and control groups were gained, of which 337 genes were high-expressed and 111 genes were low-expressed (Fig. 1A, Table S1, http://links.lww.com/MD/K964). The top 10 up- and down-regulated DEGs were displayed in the heatmap (Fig. 1B). It was evident that there was a significant difference in gene expression between the AMI and control groups. The 13 DE-SLCs (IL1B, SLC7A7, ICAM1, SLC11A1, VWF, SLC15A3, SLC24A4, SLC7A5, XIST, TNF, SLC2A3, SLC31A2, and SLC22A4) were acquired after taking intersections of the DEGs and SLCs (Fig. 1C). The results of the enrichment analysis suggested that the DE-SLCs implicated 522 GO entries and 34 KEGG pathways. The GO-BP mainly included organic acid transport, amino acid transport and so on; GO-CC mainly involved apical part of cell and so on; GO-MF mainly involved active ion transmembrane transporter activity and so on (Fig. 1D–F, Table S2, http://links.lww.com/MD/K965). KEGG enrichment results included TNF signaling pathway, NF-kappa B signaling pathway, etc. (Fig. 1G, Table S3, http://links.lww.com/MD/K966).
Figure 1.
Identification and analysis of differentially expressed solute carrier-related genes (DE-SLCs) in AMI. (A) Volcano plot and (B) Heatmap of 448 differentially expressed genes (DEGs) between the AMI and control groups in GSE66360. (C) Venn diagrams for 13 DE-SLCs shared by DEGs and SLC-related genes (SLCs). (D–F) The Gene Ontology (GO) analysis for 13 DE-SLCs, including biological process (BP) (D), cellular component (CC) (E), and molecular function (MF) (F). (G) The most enriched Kyoto Encyclopedia of Genes and Genomes (KEGG) terms of 13 DE-SLCs. AMI = acute myocardial infarction.
3.2. IPA Analysis of 13 DE-SLCs
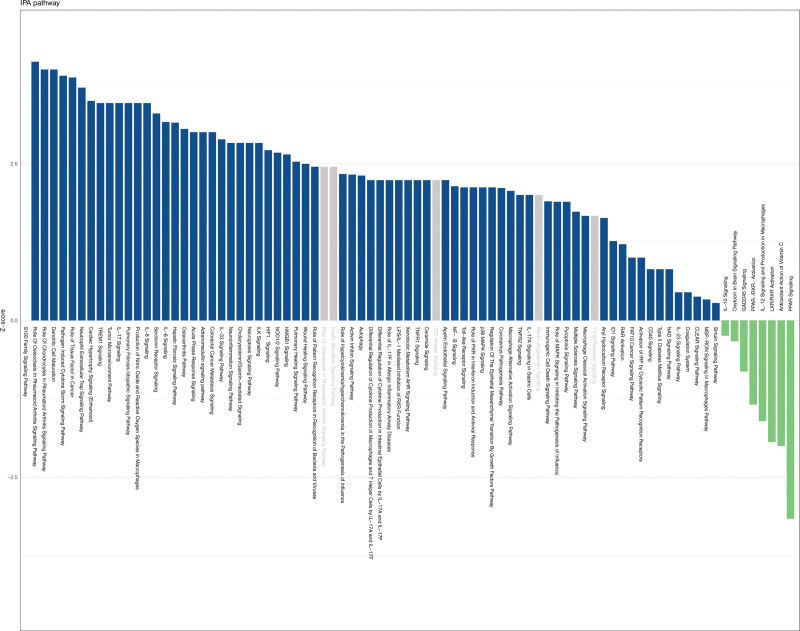
The IPA analysis was carried out to further elucidate the functions of these 13 genes. Results of IPA revealed that DE-SLCs were enriched for a total of 83 pathways, of which 78 were significant. A total of 8 pathways (antioxidant action of Vitamin C, LXR/RXR activation and so on) were inhibited, 70 pathways (dendritic cell maturation, S100 family signaling pathway, etc) were activated, and 5 pathways were not significant. (Fig. 2).
Figure 2.
Ingenuity pathway analysis (IPA) of 13 DE-SLCs was exhibited using a bar chart. The vertical coordinate is the Z-score, blue indicates pathway activation, green indicates pathway inhibition, and gray indicates that this pathway is not significant.
3.3. Identification of subtypes based on 13 DE-SLCs and enrichment analysis
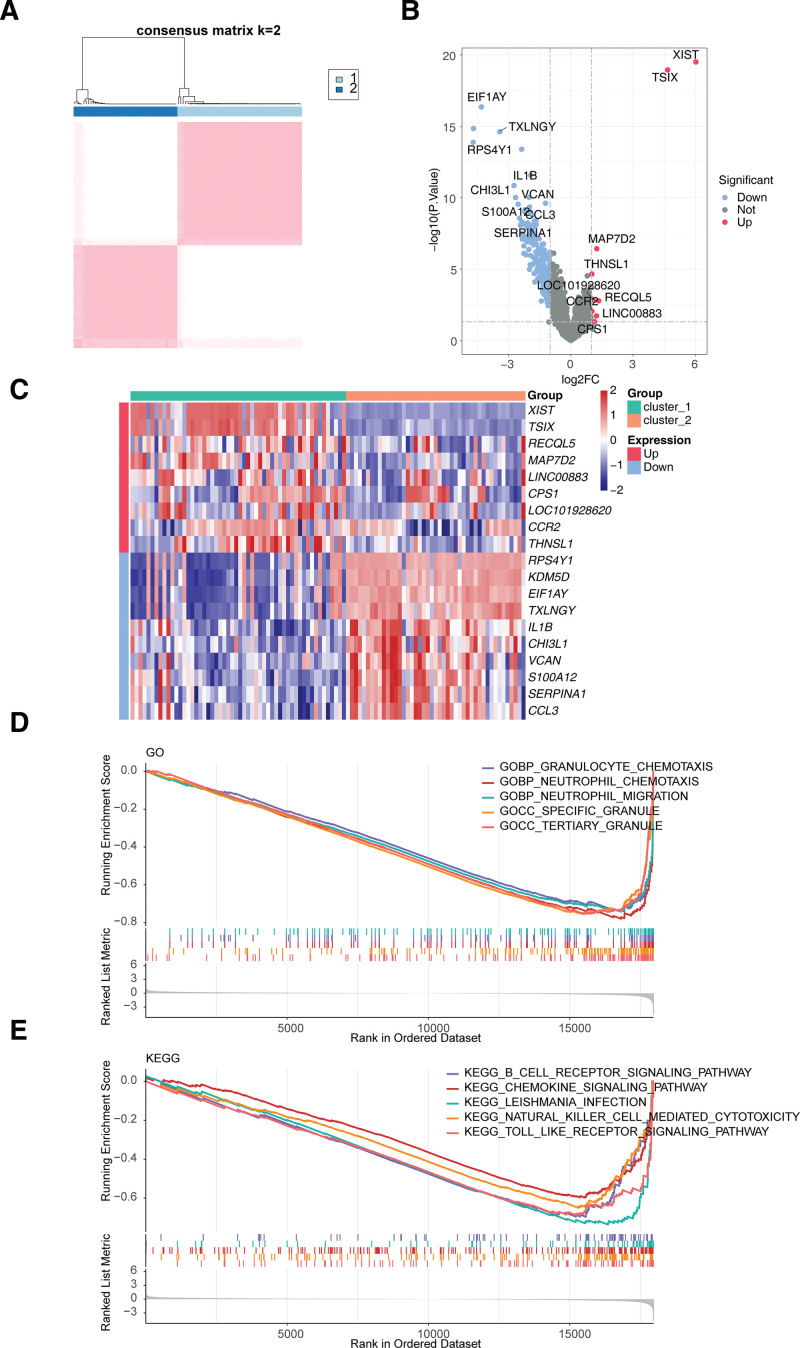
The consistency clustering results revealed that the samples were clustered into 2 subtypes (cluster 1 and cluster 2), which had the discrimination between subtypes (Fig. 3A, Figure S1, http://links.lww.com/MD/K973). A total of 247 DEGs between cluster 1 and cluster 2 were obtained, of which only 9 genes were up-regulated in cluster 1 (Fig. 3B). The up-regulated genes were XIST, TSIX, RECQL5, MAP7D2, LINC00883, CPS1, LOC101928620, CCR2, and THNSL1, and the top 10 down-regulated genes were RPS4Y1, KDM5D, EIF1AY, TXLNGY, IL1B, CHI3L1, VCAN, S100A12, SERPINA1, and CCL3 (Fig. 3C). The GSEA results indicated that cluster 1 was mainly enriched in GO entries the granulocyte chemotaxis, neutrophil chemotaxis and so on; cluster 2 was mainly enriched in GO entries the negative regulation of synaptic transmission glutamatergic, detection of mechanical stimulus involved in sensory perception of sound and so on (Fig. 3D, Table S4, http://links.lww.com/MD/K967). The KEGG pathway, such as leishmania infection, toll like receptor signaling pathway, etc, was mainly enriched by cluster 1; olfactory transduction was mainly enriched by cluster 2 (Fig. 3E, Table S5, http://links.lww.com/MD/K968).
Figure 3.
Consistency clustering analysis to obtain 2 SLC-related subtypes. (A) Clustering matrix for AMI cohorts in GSE66360 when k = 2. (B) Volcano plot and (C) Heatmap of 247 DEGs between cluster 1 and cluster 2. (D, E) Gene set enrichment analysis (GSEA) results of 247 DEGs based on the (D) GO and (E) KEGG gene sets. AMI = acute myocardial infarction. DEGs = differentially expressed genes, KEGG = Kyoto Encyclopedia of Genes and Genomes.
3.4. Immune analysis between 2 subtypes
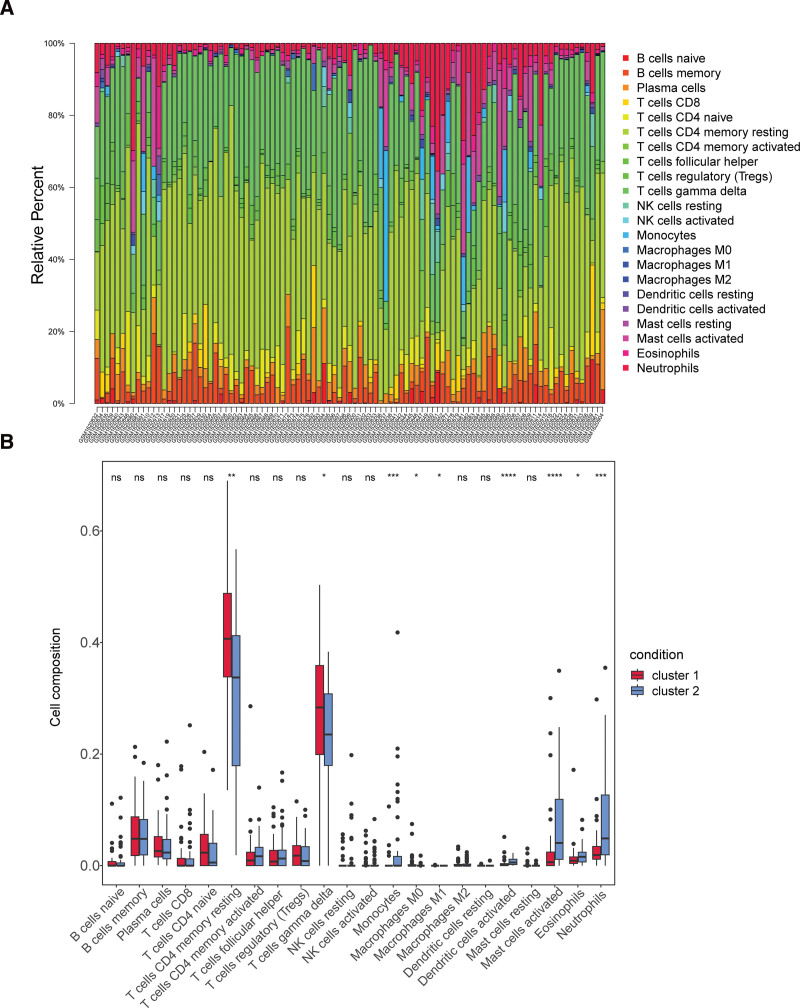
The bars showed the proportion of 22 immune cells in each sample (Fig. 4A). Of these, gamma delta T cells and resting memory CD4 T cells were the most predominant. The box-plot indicated significant differences in the abundance of 9 immune cell types (activated mast cells, activated dendritic cells, etc) (Fig. 4B) between 2 subtypes. The abundance values of M0 Macrophages and M1 Macrophages were 0 in the majority of samples, so they could not be considered as differential immune cells.
Figure 4.
Immune infiltration analysis between 2 clusters. (A) Histogram and (B) boxplot for 22 immune cells proportions in 2 clusters (Wilcoxon Test) of GSE66360. ns: not significant, *P < .05, **P < .01, ***P < .001, ****P < .0001.
3.5. Screening and performance evaluation of key genes
To understand the association of these 13 genes, we constructed a PPI network. The PPI network had 11 nodes and 14 edges (Fig. 5A). SLC22A4 and XIST in DE-SLCs were not associated with the remaining 11 genes. The protein interaction network constructed using the GeneMANIA database revealed that XIST did not interact with the remaining genes, while 20 genes co-expressed with DE-SLCs were found, sharing protein structural domain genes, genetic interaction genes and co-localization genes (Fig. 5B). A total of 11 LASSO-feature genes (IL1B, SLC7A7, ICAM1, SLC11A1, VWF, SLC24A4, SLC7A5, XIST, TNF, SLC2A3, and SLC22A4) were screened by LASSO regression analysis (Fig. 5C and D). As shown in Figure 5E, it can be seen that the error within the model is basically stable at around 800, and the number of model decision trees is finally chosen to be 800. The Gini coefficient algorithm was then applied to the 13 genes in the RF algorithm. 7 genes (SLC2A3, VWF, SLC11A1, SLC7A7, ICAM1, IL1B, and SLC7A5) with Gini coefficients greater than or equal to above the median were selected (Fig. 5F). The accuracy rate was computed and found that the SVM model had the highest accuracy rate when it contained 7 genes (Fig. 5G). Therefore, these 7 genes were selected as SVM-RFE-feature genes (SLC2A3, VWF, SLC11A1, IL1B, ICAM1, SLC7A7, and SLC7A5) for further analysis. Hence, a total of 7 key genes (SLC2A3, VWF, SLC11A1, IL1B, ICAM1, SLC7A7, and SLC7A5) were screened by overlapping LASSO-feature genes, RF-feature genes and SVM-RFE-feature genes (Fig. 5H).
Figure 5.
Screening of 7 key genes in AMI. (A) Protein-protein interaction (PPI) networks of 13 DE-SLCs using STRING. (B) PPI networks of 13 DE-SLCs using GeneMANIA. (C) Cross-validation for tuning parameter selection in the least absolute shrinkage and selection operator (LASSO) model. (D) LASSO coefficients diagram to select 11 feature genes. (E) The measurement error rate with different number of decision tree within RandomForest (RF). (F) The Mean Decrease in Gini of 13 DE-SLCs in the RF model. (G) The classification accuracy rates with different feature selection in support vector machine recursive feature elimination (SVM-RFE). (H) Seven shared key genes were screened in a venn diagram. AMI = acute myocardial infarction.
3.6. Screening for biomarkers
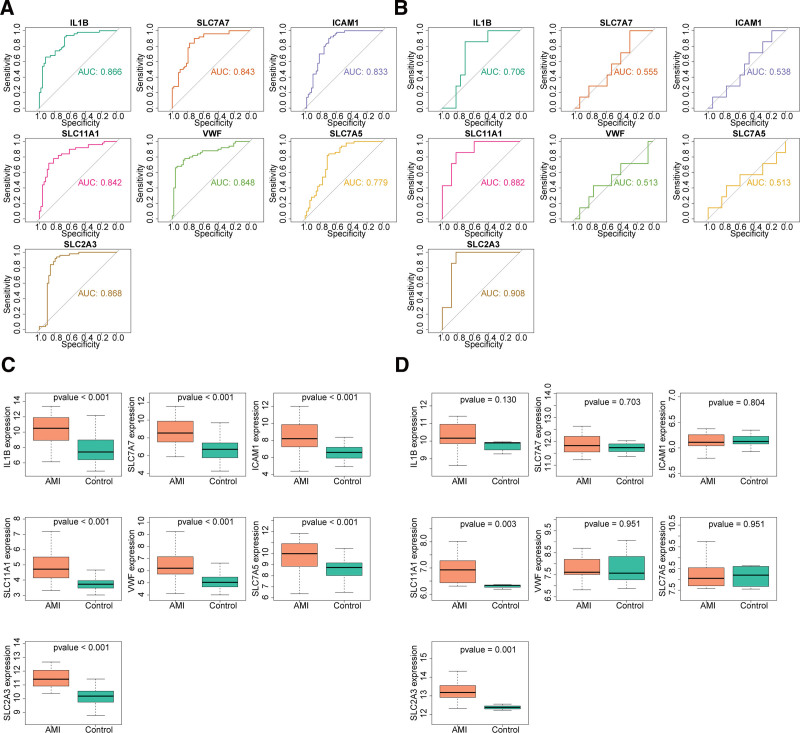
To verify the judgmental value of each hub gene, ROC curves were plotted for the 7 hub genes screened in the previous section. The AUC values for key genes in the GSE66360 dataset were all >0.7 and had diagnostic value (Fig. 6A). In the GSE60993 dataset, the AUC values for IL1B, SLC11A1 and SLC2A3 were >0.7, with higher diagnostic accuracy (Fig. 6B). In the GSE66360 and GSE60993 datasets, the expression analysis revealed that SLC11A1 and SLC2A3 were expressed in both datasets with consistent trends and significant differences (Fig. 6C and D). Therefore, SLC11A1 and SLC2A3 were utilized as biomarkers for follow-up analysis in this study.
Figure 6.
Two out of 7 key genes were screened as diagnostic genes. Receiver operating characteristic (ROC) curves of 7 key genes in the (A) GSE66360 and (B) GSE60993 datasets. Boxplots for the expressions levels of 7 key genes in the (C) GSE66360 and (D) GSE60993 datasets.
3.7. Single-gene GSEA analysis of biomarkers
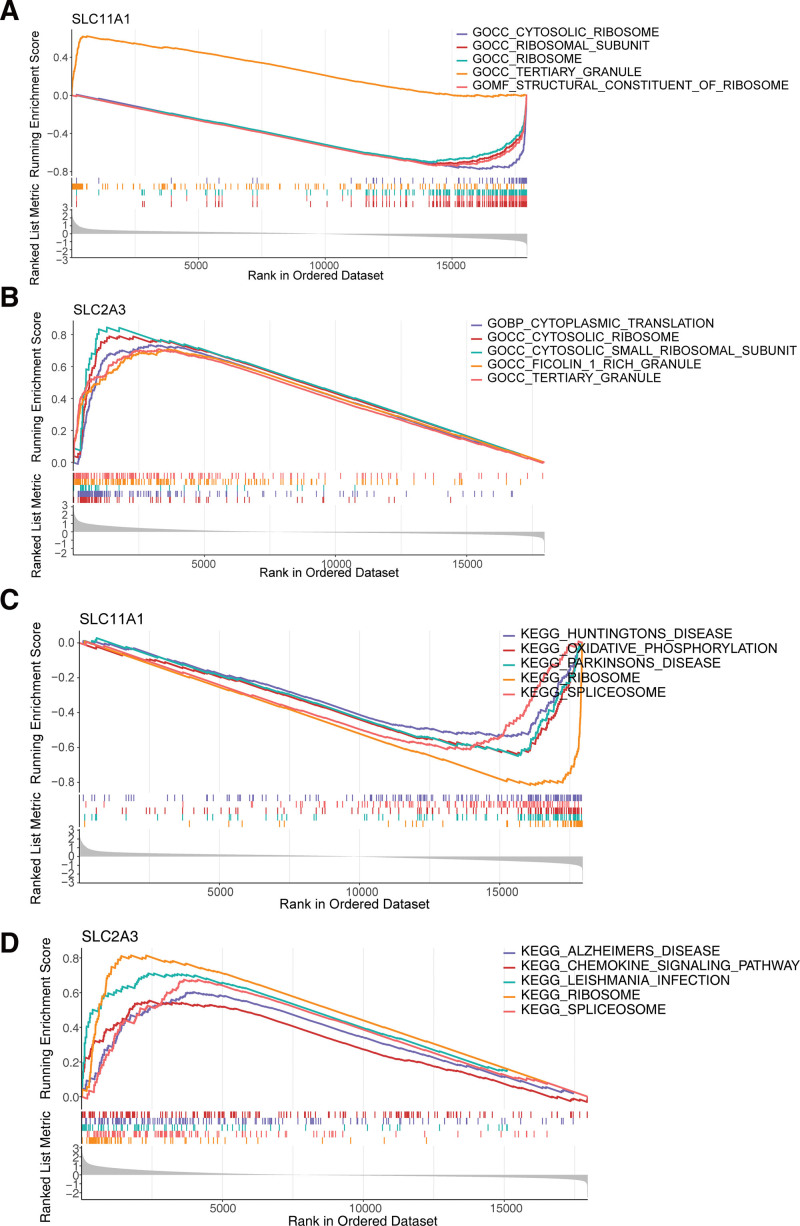
In quick succession, single-gene GSEA was performed to explore the enriched regulatory pathways and molecular functions of each biomarkers. SLC11A1 and SLC2A3 were mainly enriched to GO terms such as cytosolic ribosome, tertiary granule, etc (Fig. 7A and B, Table S6 and 7, http://links.lww.com/MD/K969, http://links.lww.com/MD/K970). KEGG pathways such as ribosome, spliceosome were enriched by SLC11A1 and SLC2A3 (Fig. 7C and D, Table S8 and 9, http://links.lww.com/MD/K971, http://links.lww.com/MD/K972).
Figure 7.
GSEA results based on the diagnostic genes expression. (A) SLC11A1-GO. (B) SLC2A3-GO. (C) SLC11A1-KEGG. (D) SLC2A3-KEGG. GSEA = gene set enrichment analysis. KEGG = Kyoto Encyclopedia of Genes and Genomes.
3.8. Immune analysis between AMI and control groups
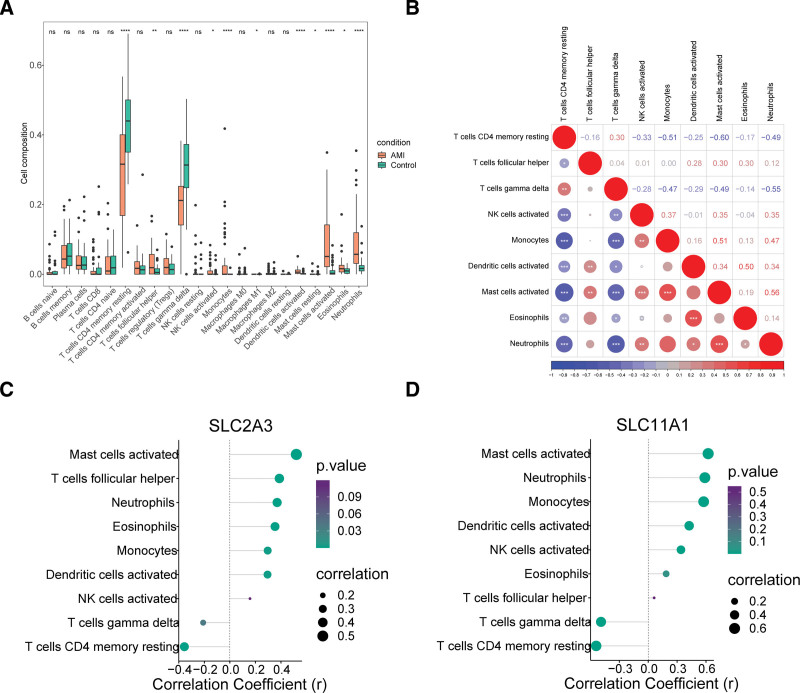
The results showed that the abundance of 11 immune infiltration cells was significantly different from the control samples based on disease (Fig. 8A), but the abundance values of resting mast cells and M1 Macrophages were 0 in the majority of samples, so they could not be considered as differential immune cells. The correlation between the abundance values of the 9 differential immune cells is shown in Figure 8B. The correlation analysis revealed that activated mast cells had the strongest positive correlation with neutrophils and the strongest negative association with resting memory CD4 T cells. Immediately after, the correlation between the 9 differential immune infiltrating cells and the diagnostic genes was then analyzed based on the immune infiltrating cell abundance values and the expression matrices of the 2 diagnostic genes. The results showed that the biomarkers had the strongest negative association with resting memory CD4 T cells and the strongest positive relationship with activated mast cells (Fig. 8C and D).
Figure 8.
Immune related analyses of diagnostic genes in AMI. (A) The boxplot for 22 immune cells proportions between the AMI and control samples (Wilcoxon Test) of GSE66360. ns: not significant, * P < .05, ** P < .01, **** P < .0001. (B) Pearson correlation heatmap among 9 differential immune cells in AMI. (C, D) Pearson correlation lollipops between diagnostic genes and 9 differential immune cells, including (C) SLC2A3 and (D) SLC11A1. AMI = acute myocardial infarction.
3.9. The TF-mRNA-miRNA and mRNA-drug network of biomarkers
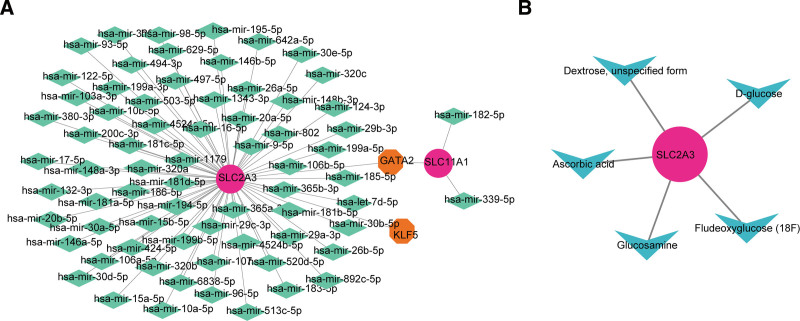
The miRNAs of the 2 diagnostic genes were predicted by the online miRNet and StarBase databases. 265 miRNAs were predicted by the StarBase database and 142 miRNAs were predicted by the miRNet database, and the intersection of the 2 databases yielded 70 miRNAs. The JASPAR and ChEA databases of the NetworkAnalyst platform were used to predict the TF of the 2 diagnostic genes, in which 11 TFs were predicted by the JASPAR database and 54 TFs were predicted by the ChEA database, and the intersection of the predictions of the 2 databases yielded 2 TFs (GATA2 and KLF5) (Fig. 9A). Among them, more miRNAs and TFs were predicted by SLC2A3. The specific mRNA-miRNA pairs were SLC2A3-hsa-mir-497-5p, etc, and the mRNA-TFs pairs were SLC2A3-KLF5 and so on. Through DrugBank database, 1 biomarker (SLC2A3) were found to be the target of 5 therapeutic drugs (Fludeoxyglucose (18F), Dextrose, unspecified form, D-glucose, Ascorbic acid, and Glucosamine) (Fig. 9B).
Figure 9.
The regulatory network prediction for diagnostic genes. (A) Transcription factors (TF)-mRNA-miRNA network of 2 diagnostic genes. Orange represent TFs, green represent miRNA, and pink represent diagnostic genes. (B) Drug prediction network targeting SLC2A3. Blue represent drugs targets, and pink represent diagnostic genes.
3.10. Expression analysis of biomarkers
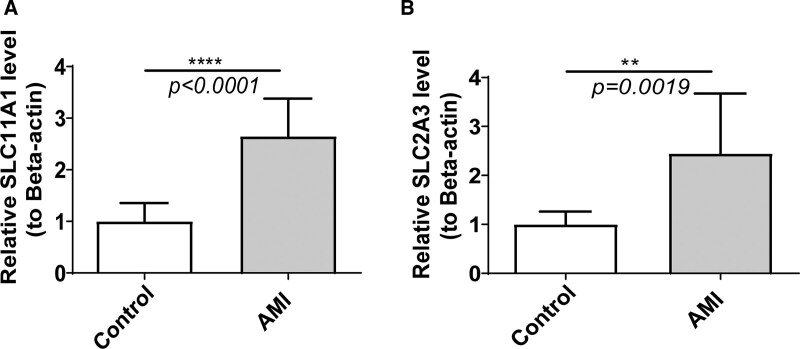
To validate the expression of biomarkers, 10 pairs of AMI and control blood samples were gathered and qRT-PCR was performed to elucidate the changes in expression of biomarkers in the AMI and control groups. The expression levels of SLC11A1 and SLC2A3 were significantly lower in control samples than in AMI groups, which was consistent with results from public database (Fig. 10A and B).
Figure 10.
Verifying the mRNA levels of 2 diagnostic genes using quantitative real-time PCR (qRT-PCR). (A) SLC11A1, (B) SLC2A3. **P < .01, ****P < .0001.
4. Discussion
Despite the continuous improvement of medical standards, coronary artery disease (CAD) is still an important cause of human death worldwide, especially in patients with AMI.[1] There has been a substantial amount of research conducted in recent years on screening related biomarkers to improve the early diagnosis of AMI. The SLC transporter family is the second-largest membrane protein involved in the physiological functions of many cells,[14] including cardiomyocytes, suggesting its potential as the diagnostic biomarker. We combined bioinformatics analysis with machine learning to screen out 2 SLC-related biomarkers (SLC11A1 and SLC2A3) and predict drugs.
SLC2A3, also known as glucose transporter 3 (GLUT3), promotes the diffusion of glucose through the cell membrane and is highly expressed in cardiomyocytes.[28,29] Some studies suggest that abnormal glucose metabolism may affect cardiac growth and development. Studies have found that high expression of SLC2A3 cells are highly sensitive to glucose absorption, and increased glucose metabolism can lead to rapid cell growth.[30] It was found that hypoxia can promote the expression and activity of hypoxia-inducible factor (HIF-1), thereby up-regulating the expression of the SLC2A3 gene to promote glucose utilization.[31,32] These previous studies have shown that hypoxia may promote the expression and activity of HIF-1, up-regulate SLC2A3 gene expression, and promote the utilization of glucose during the onset of AMI. This suggests that SLC2A3 plays a very important role in providing energy for the heart. In addition, SLC2A3 gene mutation and duplication may also accelerate the progression of AMI. The results of SLC2A3 gene mutation, deletion, and duplication are not the same. SLC2A3 mutations have been found to be associated with congenital heart disease, including Turner syndrome (TS) and 22q11.2 deletion syndrome.[33,34] Ma et al showed that the mutation of the SLC2A3 gene was associated with increased susceptibility to coronary heart disease.[35] Mlynarski et al found that the presence of SLC2A3 duplication and 22q11.2 deletion increased the risk of coronary heart disease.[33] Through the above studies, we speculate that the expression of SLC2A3 is closely related to the development of cardiovascular disease. Therefore, SLC2A3 may have the potential and ability to diagnosis AMI early.
The SLC family 11 member a1 protein (SLC11A1) has been the subject of several cardiovascular disease-related studies in recent years. In order to predict cardiovascular disease, some scholars have used genes including SLC11A1 to construct prognostic models. In a study, Zhang et al found that iron metabolism-related genes (HBB, SLC25A37, SLC11A1, and HMOX1) were involved in the immune response and used the differential expressed iron metabolism-related genes (HIF1A, SLC25A37) of septic myocardium and blood monocytes to construct a sepsis prognosis model to better help diagnose septic cardiomyopathy.[36] In the study of key biomarkers and immune infiltration in acute thoracic aortic dissection (TAAD) based on bioinformatics, Luo et al found that the expression of a key biomarker (SLC11A1) may aggravate the inflammatory injury of TAAD by promoting the infiltration of neutrophils and macrophages.[37] This study suggests that SLC11A1 may be involved in the immune inflammatory response to AMI. In addition, a meta-study found that SLC11A1 plays an important role in anti-neutrophil cytoplasmic antibody-associated vasculitis.[38] However, little is known about the role of SLC11A1 in AMI. This study found that the expression of SLC11A1 in the peripheral blood of patients with AMI was up-regulated. The over-expression of SLC11A1 may suggest that the inflammatory injury of AMI is caused by promoting the infiltration of neutrophils and macrophages, which needs further study. We will continue to pay attention to its mechanism, which is also our future research direction.
In this study, we analyzed the relationship between SLC11A1, SLC2A3, and their expression levels in public datasets and clinical parameters. We found that SLC11A1 and SLC2A3 were expressed in the training set and the validation set, and the performance of the training set was more prominent. The ROC curve of the 2 biomarkers had good diagnostic value for AMI (AUC value > 0.7). The results of single-gene GSEA analysis showed that SLC11A1 and SLC2A3 were mainly enriched in GO terms such as cytoplasmic ribosomes and tertiary granules. SLC11A1 is highly expressed in the lysosomes of macrophages and the tertiary granules of neutrophils and plays an important role in resisting intracellular microbial infection.[39] KEGG pathways such as oxidative phosphorylation and glucose metabolism were enriched by SLC11A1 and SLC2A3. Pyruvate is oxidized and phosphorylated to produce adenosine triphosphate (ATP), and SLC is involved in the regulation of energy metabolism.[40] Chen et al found that the MAPK signaling pathway is involved in the miR-129-5p/SLC2A3 axis, thereby regulating cell glucose metabolism and growth.[41] In addition, phosphorylation-activated MAPK14 during starvation increased the expression levels of SLC2A3 mRNA, resulting in higher intracellular glucose utilization.[42] Previous studies have shown that SLC2A3 can regulate glucose utilization through the MAPK signaling pathway, thereby reducing myocardial injury. Therefore, we speculate that SLC2A3 regulates the progression of AMI by regulating glucose metabolism through the MAPK signaling pathway.
In order to further explore the correlation between the 2 biomarkers and immunity we performed a correlation analysis. The results revealed the presence of 9 differential immune cells between the AMI and control groups, and correlation analyses showed that the biomarkers were positively correlated with activated mast cells, monocytes, neutrophils, etc. Studies have found that SLC11A1 is involved in the coding of endosomal multi-channel membrane proteins and is expressed in macrophages and neutrophils.[43] Another study also confirmed that the expression of the SLC11A1 gene in macrophages of patients with atherosclerosis was much higher than that in macrophages of control patients.[44] Macrophages and neutrophils are also expressed in other diseases, including arthritis, colitis, and anti-neutrophil cytoplasmic antibody-associated vasculitis.[38,45,46] Based on the above research, we speculate that the SLC11A1 and SLC2A3 genes could promote the treatment of AMI by changing the immune inflammatory response of AMI. However, further research is needed to confirm this.
In addition, the mRNA-drug network results predicted that SLC2A3 might be an AMI drug target for Fludeoxyglucose (18F), Dextrose, unspecified form, D-glucose, Ascorbic acid, and Glucosamine. Fludeoxyglucose 18F (FDG) is a glucose analogue that can identify left ventricular myocardium with residual glucose metabolism, observe atherosclerosis caused by macrophage accumulation, and evaluate left ventricular function during myocardial perfusion imaging.[47] Ascorbic acid is transported across the cell membrane through sodium vitamin C cotransporters and glucose transporters.[48] Rodrigo et al found that intravenous infusion of ascorbic acid before PCI in patients with AMI can reduce the production of cardiac injury biomarkers, inflammatory biomarkers, and reactive oxygen species, thereby improving the clinical outcome events of patients.[49] Combined with the results of this study, we speculate that multiple targeted drugs of SLC2A3 can be used for preoperative diagnosis of AMI, evaluation of disease severity, and improvement of prognosis. Therefore, these 5 drugs can be used as candidate drugs for the treatment of AMI.
There are some limitations in this study. Firstly, SLC11A1 and SLC2A3 are less frequently reported in cardiovascular diseases. Therefore, their mechanism of action in AMI needs further study. Secondly, there is no way to completely eliminate the batch effect between data sets. In addition, the clinical sample size may not be large enough. Finally, the research data are from the public database. This study only verified the expression of these genes by PCR, and more specific mechanisms need to be further verified in vitro or in vivo to explore their function.
5. Conclusions
In this study, LASSO, SVM-RFE, and RF algorithms were used to identify SLC11A1 and SLC2A3 as potential biomarkers for AMI, relying on high sensitivity and accuracy to predict the risk of AMI. The results of qRT-PCR showed the potential association between AMI and infiltrating immune cells, which provided a new research idea for their role in AMI. At the same time, it was worth noting that the results of single-gene GSEA analysis showed that SLC2A3 was regulated by MAPK signaling pathway and had an effect on AMI. It is speculated that the high expression of SLC11A1 and SLC2A3 in AMI is related to immune inflammatory response and energy metabolism. In addition, we also look for potential therapeutic small-molecule drugs for diagnostic genes. These findings may have implications for the diagnosis and treatment of AMI patients.
Acknowledgments
Thanks to the work platform provided by the North Sichuan Medical College Innovation Center for Science and Technology.
Author contributions
Conceptualization: Zhirui Qi.
Project administration: Zhirui Qi, Boli Ran.
Writing – original draft: Zhirui Qi.
Writing – review & editing: Zhirui Qi, Yunfei Pu.
Funding acquisition: Yunfei Pu.
Methodology: Yunfei Pu, Boli Ran.
Supervision: Yunfei Pu, Haiyang Guo.
Validation: Yunfei Pu, Wenwu Tang.
Investigation: Haiyang Guo, Yilin Xiong.
Software: Haiyang Guo, Wenwu Tang.
Visualization: Haiyang Guo.
Resources: Wenwu Tang, Yilin Xiong.
Data curation: Yilin Xiong.
Supplementary Material
Abbreviations:
- AMI
- acute myocardial infarction
- AUC
- area under the curve
- DEGs
- differentially expressed genes
- DEGs-cluster
- DEGs between subtypes
- DE-SLCs
- differentially expressed SLCs
- GO
- Gene Ontology
- GSEA
- gene set enrichment analysis
- IPA
- ingenuity pathway analysis
- KEGG
- Kyoto Encyclopedia of Genes and Genomes
- LASSO
- least absolute shrinkage and selection operator
- PPI
- protein-protein interactions
- RF
- random forest
- ROC
- receiver operating characteristic
- RT-qPCR
- reverse transcription quantitative PCR
- SLC
- solute carrier
- SLCs
- SLC family-related genes
- SVM-RFE
- support vector machine recursive feature elimination
- TF
- transcription factor.
The study was conducted in accordance with the Declaration of Helsinki, and approved by the Medical Ethics Committee of Chongqing Municipal General Hospital (Ethical Batch No.: KY S2022-085-01).
Informed consent was obtained from all subjects involved in the study. Written informed consent has been obtained from the patients to publish this paper.
This study was supported by the Natural Science Foundation of Chongqing (CSTB2022NSCQ-MSX1563).
The authors have no conflicts of interest to disclose.
The datasets generated during and/or analyzed during the current study are available from the corresponding author on reasonable request.
Supplemental Digital Content is available for this article.
How to cite this article: Qi Z, Pu Y, Guo H, Tang W, Xiong Y, Ran B. Identification and subtype analysis of biomarkers associated with the solute carrier family in acute myocardial infarction. Medicine 2023;102:49(e36515).
Contributor Information
Zhirui Qi, Email: qizhirui2021@163.com.
Yunfei Pu, Email: 12944048@qq.com.
Haiyang Guo, Email: 864356919@qq.com.
Wenwu Tang, Email: tww-2-17@163.com.
Yilin Xiong, Email: 2320508848@qq.com.
References
- [1].Xue J, Chen L, Cheng H, et al. The identification and validation of hub genes associated with acute myocardial infarction using weighted gene co-expression network analysis. J Cardiovasc Dev Dis. 2022;9:30. [DOI] [PMC free article] [PubMed] [Google Scholar]
- [2].Guo J, Liu HB, Sun C, et al. MicroRNA-155 promotes myocardial infarction-induced apoptosis by targeting RNA-binding protein QKI. Oxid Med Cell Longev. 2019;2019:4579806. [DOI] [PMC free article] [PubMed] [Google Scholar]
- [3].Tsao CW, Aday AW, Almarzooq ZI, et al. Heart disease and stroke statistics-2023 update: a report from the American Heart Association. Circulation. 2023;147:e93–e621. [DOI] [PubMed] [Google Scholar]
- [4].Roth GA, Huffman MD, Moran AE, et al. Global and regional patterns in cardiovascular mortality from 1990 to 2013. Circulation. 2015;132:1667–78. [DOI] [PubMed] [Google Scholar]
- [5].Hartikainen T, Westermann D. Advances in rapid diagnostic tests for myocardial infarction patients. Expert Rev Mol Diagn. 2023;23:391–403. [DOI] [PubMed] [Google Scholar]
- [6].Braunwald E. Unstable angina and non-ST elevation myocardial infarction. Am J Respir Crit Care Med. 2012;185:924–32. [DOI] [PubMed] [Google Scholar]
- [7].Schlessinger A, Matsson P, Shima JE, et al. Comparison of human solute carriers. Protein Sci. 2010;19:412–28. [DOI] [PMC free article] [PubMed] [Google Scholar]
- [8].Schumann T, König J, Henke C, et al. Solute carrier transporters as potential targets for the treatment of metabolic disease. Pharmacol Rev. 2020;72:343–79. [DOI] [PubMed] [Google Scholar]
- [9].Pizzagalli MD, Bensimon A, Superti-Furga G. A guide to plasma membrane solute carrier proteins. FEBS J. 2021;288:2784–835. [DOI] [PMC free article] [PubMed] [Google Scholar]
- [10].Fredriksson R, Nordström KJ, Stephansson O, et al. The solute carrier (SLC) complement of the human genome: phylogenetic classification reveals four major families. FEBS Lett. 2008;582:3811–6. [DOI] [PubMed] [Google Scholar]
- [11].Panda S, Banerjee N, Chatterjee S. Solute carrier proteins and c-Myc: a strong connection in cancer progression. Drug Discov Today. 2020;25:891–900. [DOI] [PubMed] [Google Scholar]
- [12].Hediger MA, Clémençon B, Burrier RE, et al. The ABCs of membrane transporters in health and disease (SLC series): introduction. Mol Aspects Med. 2013;34:95–107. [DOI] [PMC free article] [PubMed] [Google Scholar]
- [13].Ferrada E, Superti-Furga G. A structure and evolutionary-based classification of solute carriers. iScience. 2022;25:105096. [DOI] [PMC free article] [PubMed] [Google Scholar]
- [14].César-Razquin A, Snijder B, Frappier-Brinton T, et al. A call for systematic research on solute carriers. Cell. 2015;162:478–87. [DOI] [PubMed] [Google Scholar]
- [15].Ayka A, Şehirli A. The role of the SLC transporters protein in the neurodegenerative disorders. Clin Psychopharmacol Neurosci. 2020;18:174–87. [DOI] [PMC free article] [PubMed] [Google Scholar]
- [16].Hediger MA, Romero MF, Peng JB, et al. The ABCs of solute carriers: physiological, pathological and therapeutic implications of human membrane transport proteinsIntroduction. Pflugers Arch. 2004;447:465–8. [DOI] [PubMed] [Google Scholar]
- [17].Giacomini KM, Huang SM, Tweedie DJ, et al. Membrane transporters in drug development. Nat Rev Drug Discov. 2010;9:215–36. [DOI] [PMC free article] [PubMed] [Google Scholar]
- [18].Ritchie ME, Phipson B, Wu D, et al. limma powers differential expression analyses for RNA-sequencing and microarray studies. Nucleic Acids Res. 2015;43:e47. [DOI] [PMC free article] [PubMed] [Google Scholar]
- [19].Ito K, Murphy D. Application of ggplot2 to Pharmacometric Graphics. CPT Pharmacometrics Syst Pharmacol. 2013;2:e79. [DOI] [PMC free article] [PubMed] [Google Scholar]
- [20].Wu T, Hu E, Xu S, et al. clusterProfiler 40: a universal enrichment tool for interpreting omics data. Innovation (Camb). 2021;2:100141. [DOI] [PMC free article] [PubMed] [Google Scholar]
- [21].Wilkerson MD, Hayes DN. ConsensusClusterPlus: a class discovery tool with confidence assessments and item tracking. Bioinformatics. 2010;26:1572–3. [DOI] [PMC free article] [PubMed] [Google Scholar]
- [22].Newman AM, Liu CL, Green MR, et al. Robust enumeration of cell subsets from tissue expression profiles. Nat Methods. 2015;12:453–7. [DOI] [PMC free article] [PubMed] [Google Scholar]
- [23].Friedman J, Hastie T, Tibshirani R. Regularization paths for generalized linear models via coordinate descent. J Stat Softw. 2010;33:1–22. [PMC free article] [PubMed] [Google Scholar]
- [24].Robin X, Turck N, Hainard A, et al. pROC: an open-source package for R and S+ to analyze and compare ROC curves. BMC Bioinf. 2011;12:77. [DOI] [PMC free article] [PubMed] [Google Scholar]
- [25].Su G, Morris JH, Demchak B, et al. Biological network exploration with Cytoscape 3. Curr Protoc Bioinformatics. 2014;47:8.13.11–24. [DOI] [PMC free article] [PubMed] [Google Scholar]
- [26].Thygesen K, Alpert JS, Jaffe AS, et al. Fourth universal definition of myocardial infarction (2018). Circulation. 2018;138:e618–51. [DOI] [PubMed] [Google Scholar]
- [27].Livak KJ, Schmittgen TD. Analysis of relative gene expression data using real-time quantitative PCR and the 2(-Delta Delta C(T)) method. Methods. 2001;25:402–8. [DOI] [PubMed] [Google Scholar]
- [28].Ziegler GC, Almos P, McNeill RV, et al. Cellular effects and clinical implications of SLC2A3 copy number variation. J Cell Physiol. 2020;235:9021–36. [DOI] [PubMed] [Google Scholar]
- [29].Men L, Hui W, Guan X, et al. Cardiac transcriptome analysis reveals Nr4a1 mediated glucose metabolism dysregulation in response to high-fat diet. Genes (Basel). 2020;11:720. [DOI] [PMC free article] [PubMed] [Google Scholar]
- [30].Yao X, He Z, Qin C, et al. SLC2A3 promotes macrophage infiltration by glycolysis reprogramming in gastric cancer. Cancer Cell Int. 2020;20:503. [DOI] [PMC free article] [PubMed] [Google Scholar]
- [31].Zhang FJ, Luo W, Lei GH. Role of HIF-1α and HIF-2α in osteoarthritis. Joint Bone Spine. 2015;82:144–7. [DOI] [PubMed] [Google Scholar]
- [32].Lauer V, Grampp S, Platt J, et al. Hypoxia drives glucose transporter 3 expression through hypoxia-inducible transcription factor (HIF)-mediated induction of the long noncoding RNA NICI. J Biol Chem. 2020;295:4065–78. [DOI] [PMC free article] [PubMed] [Google Scholar]
- [33].Mlynarski EE, Sheridan MB, Xie M, et al. Copy-number variation of the glucose transporter gene SLC2A3 and congenital heart defects in the 22q112 deletion syndrome. Am J Hum Genet. 2015;96:753–64. [DOI] [PMC free article] [PubMed] [Google Scholar]
- [34].Prakash SK, Bondy CA, Maslen CL, et al. Autosomal and X chromosome structural variants are associated with congenital heart defects in Turner syndrome: the NHLBI GenTAC registry. Am J Med Genet A. 2016;170:3157–64. [DOI] [PMC free article] [PubMed] [Google Scholar]
- [35].Ma L, Xu J, Tang Q, et al. SLC2A3 variants in familial and sporadic congenital heart diseases in a Chinese Yunnan population. J Clin Lab Anal. 2022;36:e24456. [DOI] [PMC free article] [PubMed] [Google Scholar]
- [36].Zhang R, Di C, Gao H, et al. Identification of iron metabolism-related genes in the circulation and myocardium of patients with sepsis via applied bioinformatics analysis. Front Cardiovasc Med. 2023;10:1018422. [DOI] [PMC free article] [PubMed] [Google Scholar]
- [37].Luo J, Shi H, Ran H, et al. Identification of key biomarkers and immune infiltration in the thoracic acute aortic dissection by bioinformatics analysis. BMC Cardiovasc Disord. 2023;23:75. [DOI] [PMC free article] [PubMed] [Google Scholar]
- [38].Friedman MA, Choi D, Planck SR, et al. Gene expression pathways across multiple tissues in antineutrophil cytoplasmic antibody-associated vasculitis reveal core pathways of disease pathology. J Rheumatol. 2019;46:609–15. [DOI] [PMC free article] [PubMed] [Google Scholar]
- [39].Montalbetti N, Simonin A, Kovacs G, et al. Mammalian iron transporters: families SLC11 and SLC40. Mol Aspects Med. 2013;34:270–87. [DOI] [PubMed] [Google Scholar]
- [40].Ruiz-Iglesias A, Mañes S. The importance of mitochondrial pyruvate carrier in cancer cell metabolism and tumorigenesis. Cancers (Basel). 2021;13:1488. [DOI] [PMC free article] [PubMed] [Google Scholar]
- [41].Chen D, Wang H, Chen J, et al. MicroRNA-129-5p regulates glycolysis and cell proliferation by targeting the glucose transporter SLC2A3 in gastric cancer cells. Front Pharmacol. 2018;9:502. [DOI] [PMC free article] [PubMed] [Google Scholar]
- [42].Desideri E, Vegliante R, Cardaci S, et al. MAPK14/p38α-dependent modulation of glucose metabolism affects ROS levels and autophagy during starvation. Autophagy. 2014;10:1652–65. [DOI] [PMC free article] [PubMed] [Google Scholar]
- [43].Hu L, Zhao T, Sun Y, et al. Bioinformatic identification of hub genes and key pathways in neutrophils of patients with acute respiratory distress syndrome. Medicine (Baltim). 2020;99:e19820. [DOI] [PMC free article] [PubMed] [Google Scholar]
- [44].Hägg DA, Jernås M, Wiklund O, et al. Expression profiling of macrophages from subjects with atherosclerosis to identify novel susceptibility genes. Int J Mol Med. 2008;21:697–704. [PubMed] [Google Scholar]
- [45].De Franco M, Peters LC, Correa MA, et al. Pristane-induced arthritis loci interact with the Slc11a1 gene to determine susceptibility in mice selected for high inflammation. PLoS One. 2014;9:e88302. [DOI] [PMC free article] [PubMed] [Google Scholar]
- [46].Valdez Y, Grassl GA, Guttman JA, et al. Nramp1 drives an accelerated inflammatory response during Salmonella-induced colitis in mice. Cell Microbiol. 2009;11:351–62. [DOI] [PubMed] [Google Scholar]
- [47].Ashraf MA, Goyal A. Fludeoxyglucose (18F) [Updated 2023 Aug 28]. In: StatPearls [Internet]. Treasure Island (FL): StatPearls Publishing; 2023. [PubMed] [Google Scholar]
- [48].Liu J, Hong J, Han H, et al. Decreased vitamin C uptake mediated by SLC2A3 promotes leukaemia progression and impedes TET2 restoration. Br J Cancer. 2020;122:1445–52. [DOI] [PMC free article] [PubMed] [Google Scholar]
- [49].Rodrigo R, Prieto JC, Aguayo R, et al. Joint cardioprotective effect of vitamin C and other antioxidants against reperfusion injury in patients with acute myocardial infarction undergoing percutaneous coronary intervention. Molecules. 2021;26:5702. [DOI] [PMC free article] [PubMed] [Google Scholar]
Associated Data
This section collects any data citations, data availability statements, or supplementary materials included in this article.


