Abstract
Given the lack of therapeutic targets, the conventional approach for managing triple-negative breast cancer (TNBC) involves the utilization of cytotoxic chemotherapeutic agents. However, most TNBCs acquire resistance to chemotherapy, thereby lowering the therapeutic outcome. In addition to oncogenic mutations in TNBC, microenvironment-induced mechanisms render chemoresistance more complex and robust in vivo. Here, we aimed to analyze whether depletion of Munc18-1 interacting protein 3 (Mint3), which activates hypoxia-inducible factor 1 (HIF-1) during normoxia, sensitizes TNBC to chemotherapy. We found that Mint3 promotes the chemoresistance of TNBC in vivo. Mint3 depletion did not affect the sensitivity of human TNBC cell lines to doxorubicin and paclitaxel in vitro but sensitized tumors of these cells to chemotherapy in vivo. Transcriptome analyses revealed that the Mint3–HIF-1 axis enhanced heat shock protein 70 (HSP70) expression in tumors of TNBC cells. Administering an HSP70 inhibitor enhanced the antitumor activity of doxorubicin in TNBC tumors, similar to Mint3 depletion. Mint3 expression was also correlated with HSP70 expression in human TNBC specimens. Mechanistically, Mint3 depletion induces glycolytic maladaptation to the tumor microenvironment in TNBC tumors, resulting in energy stress. This energy stress by Mint3 depletion inactivated heat shock factor 1 (HSF-1), the master regulator of HSP expression, via the AMP-activated protein kinase/mechanistic target of the rapamycin pathway following attenuated HSP70 expression. In conclusion, Mint3 is a unique regulator of TNBC chemoresistance in vivo via metabolic adaptation to the tumor microenvironment, and a combination of Mint3 inhibition and chemotherapy may be a good strategy for TNBC treatment.
Subject terms: Breast cancer, Chemotherapy
Introduction
In 2020, breast cancer, one of the most prevalent malignancies in women, resulted in 2.3 million new diagnoses and 685,000 fatalities worldwide. Breast cancers are classified into four subtypes depending on the expression levels of human epidermal growth factor receptor-2 and hormone receptors, including estrogen receptors and progesterone receptors: luminal A, luminal B, epidermal growth factor receptor-2 positive, and triple-negative subtypes [1]. Triple-negative breast cancer (TNBC) is a subtype of breast cancer that lacks estrogen and progesterone receptors and epidermal growth factor receptor-2 and comprises ~15–20% of all breast cancers. Due to the lack of therapeutic targets, chemotherapy with cytotoxic drugs is usually used for TNBC treatment. However, most TNBCs acquire resistance to chemotherapy, and the therapeutic outcome of TNBC after chemotherapy remains low.
Oncogenic mutations confer chemoresistance to cancer cells in various ways. Oncogene-induced or genetically amplified ATP-binding cassette transporters eject cytotoxic drugs from cancer cells, resulting in multidrug resistance [2]. Cell survival signals and increased expression of anti-apoptotic molecules increase the survival of cancer cells after chemotherapy [3]. Heat shock factor (HSF) and its target heat shock proteins (HSPs) also maintain proteostasis against cytotoxic reagents, thereby increasing the survival of cancer cells [4–6]. These chemoresistance traits in cancer cells are well-reconstituted in vitro. However, the sensitivity to chemotherapy in vitro does not always reflect that in vivo. Microenvironment-induced mechanisms, such as epigenetic regulation adapting to the tumor microenvironment, tumor-stroma interaction, and physical barriers of the extracellular matrix, make chemoresistance more complex and robust in vivo [7]. Hypoxia is a major cause of microenvironment-dependent chemoresistance. Under hypoxic conditions, hypoxia-inducible factor 1 (HIF-1), an essential transcription factor for hypoxic responses, is activated and promotes the adaptation of its target genes to hypoxic conditions [8–10]. Among the HIF-1 target genes, glycolysis-related genes, such as SLC2A1, HK2, PKM, and LDHA contribute to switching the energy production machinery in cells from mitochondrial respiration to glycolysis. Glycolytic enzymes and metabolites have been reported to promote chemoresistance in various cancer types [11–14]. Interestingly, cancer cells upregulate glycolysis even during normoxia. This phenomenon is known as the Warburg effect [15–18]. HIF-1 is usually suppressed under normoxic conditions, but oncogenic signaling pathways, such as the Ras signaling pathway and the PI3K/AKT signaling pathway, enhance HIF-1 expression even during normoxia [8–10].
In addition to oncogenic signaling pathways, Munc18-1-interacting protein 3 (Mint3; also known as amyloid precursor protein-binding family A member 3) activates the transcriptional activity of HIF-1 during normoxia in cancer cells [19–24]. Mint3 suppresses oxygen-dependent HIF-1 inhibitory hydroxylase, factor-inhibiting HIF-1 (FIH-1), by binding to it. Mint3 depletion attenuates the Warburg effect in various cancer cells, including the TNBC cell line MDA-MB-231, in vitro [21]. Mint3 depletion also attenuates tumor growth and reduces angiogenesis in mouse xenograft models [19–21, 24, 25]. Furthermore, Mint3 depletion attenuated the chemoresistance of pancreatic cancer cells both in vitro and in vivo [19]. This mechanism depends on S-phase kinase-associated protein 2 expression via the Mint3-HIF-1 axis and is specific to pancreatic cancer. Mint3 depletion did not affect S-phase kinase-associated protein 2 expression in the human TNBC cell line MDA-MB-231. Interestingly, the administration of naphthofluorescein, which inhibits Mint3-mediated HIF-1 activation, enhanced the antitumor effects of gemcitabine and doxorubicin in pancreatic cancer and TNBC tumors, respectively, in mouse xenograft models [26]. These results indicate that Mint3 may also contribute to the chemoresistance of TNBC, at least in vivo. However, the mechanism by which Mint3 promotes chemoresistance in TNBC remains unclear. To address this, we analyzed whether Mint3 depletion sensitizes TNBC to chemotherapy in both in vitro and in vivo experiments.
Results
Mint3 depletion does not affect chemoresistance in vitro in TNBC cell lines
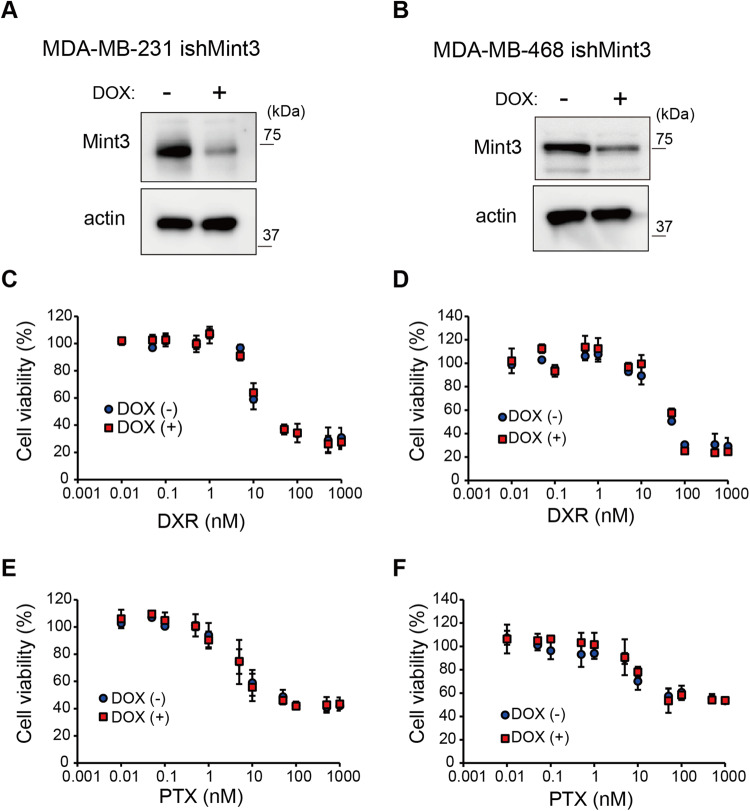
Based on the molecular classification of breast cancer, TNBC encompasses the basal and claudin-low subtypes, exhibiting varying degrees of chemotherapy sensitivity [27, 28]. Thus, we first chose human TNBC MDA-MB-231 cells with the claudin-low subtype and MDA-MB-468 cells with the basal subtype, and established cells that express shRNA against Mint3 in a doxycycline (DOX)-inducible manner (ishMint3) (Fig. 1A, B) using these TNBC cell lines. Subsequently, the effect of Mint3 depletion on TNBC cell sensitivity to doxorubicin (DXR) and paclitaxel (PTX) was examined in vitro. Cytotoxicity assays showed no difference in sensitivity to DXR and PTX between the control (DOX−) and Mint3-depleted (DOX+) TNBC cells (Fig. 1C‒F). Thus, Mint3 is not involved in the chemoresistance of TNBC cells, at least in vitro.
Fig. 1. Mint3 depletion does not affect chemoresistance in vitro in TNBC cell lines.
A, B Expression of Mint3 in MDA-MB-231 (A) and MDA-MB-468 cells (B) expressing doxycycline-inducible shRNAs against Mint3 (ishMint3) treated with doxycycline (1 μg/ml) for 3 days. C, D Cytotoxicity assay of control (DOX(−)) and doxycycline-pre-treated (DOX (+)) MDA-MB-231 (C) and MDA-MB-468 (D) ishMint3 cells in the presence of doxorubicin (DXR) for 24 h at the indicated concentration. E, F Cytotoxicity assay of control (DOX(−)) and doxycycline-pre-treated (DOX(+)) MDA-MB-231 (E) and MDA-MB-468 (F) ishMint3 cells in the presence of paclitaxel (PTX) for 24 h at the indicated concentration. In C–F, the data represent the mean ± SD (n = 3).
Mint3 depletion sensitizes TNBC cell lines to chemotherapy in vivo
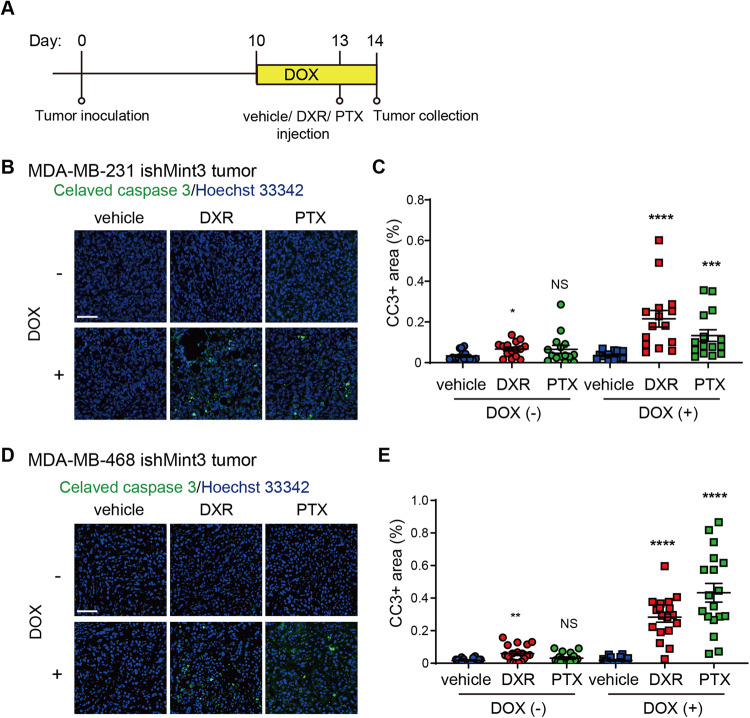
We next examined whether Mint3 depletion affects the chemoresistance of TNBC cells in vivo. To address this, MDA-MB-231 and MDA-MB-468 ishMint3 cells were inoculated into immunodeficient mice, and Mint3 expression in TNBC tumors was suppressed by DOX administration before chemotherapy (Fig. 2A). Intriguingly, DOX administration significantly increased the number of apoptotic cells in the tumors of MDA-MB-231 and MDA-MB-468 ishMint3 cells one day after DXR and PTX (Fig. 2B‒E and Supplementary Fig. S1A, B). DOX administration also increased the number of apoptotic cells in tumors of DOX-inducible Mint3 knockdown MDA-MB-231 cells with different shRNA sequences from ishMint3 (ishMint3#2) but not in those of control MDA-MB-231 (ishCTR) cells (Supplementary Fig. S1C‒H), indicating that Mint3 depletion increases apoptosis in TNBC tumors. These results prompted us to examine the combination therapy of Mint3 depletion and chemotherapy in the tumor growth of TNBC xenografts (Fig. 3A). DXR or PTX alone did not affect the tumor growth of MDA-MB-231 cells, whereas DOX-induced Mint3 depletion attenuated it, similar to the results of stably Mint3-depleted cells [21, 24] (Fig. 3B, C). Interestingly, the administration of DXR and PTX significantly attenuated the tumor growth of Mint3-depleted MDA-MB-231 ishMint3 cells (Fig. 3B, C). MDA-MB-468 cells were more sensitive to DXR and PTX than MDA-MB-231 cells, indicating that the basal subtype of breast cancer is more sensitive to chemotherapy than the claudin-low subtype [27, 28], and the combination of Mint3 depletion and chemotherapy strikingly reduced tumor volumes in these cells (Fig. 3D, E). Taken together, these results indicate that Mint3 depletion sensitizes TNBC cells to chemotherapy in vivo.
Fig. 2. Mint3 depletion sensitizes TNBC cell lines to chemotherapy in vivo.
A Schematic illustration of the chemotherapy-induced tumor apoptosis experiments. B–E Immunostaining for cleaved caspase-3 in tumors from control (DOX (−)) and Mint3-depleted (DOX (+)) MDA-MB-231 (B, C) and MDA-MB-468 (D, E) cells 24 h after chemotherapy. B, D Representative images are shown. Bar = 50 µm. C, E Cleaved caspase-3-positive areas were counted in tumor sections. n = 18 from six tumors per group. The data are presented as the mean ± SEM and were analyzed using the Mann–Whitney U-test. *p < 0.05, **p < 0.01, ****p < 0.0001. NS not significant.
Fig. 3. A combination of Mint3 depletion and chemotherapy suppresses tumor growth in TNBC cell lines.
A Schematic illustration of the tumor growth assay. B–E Tumor growth of MDA-MB-231 ishMint3 (B, C) and MDA-MB-468 ishMint3 (D, E) cells in immunodeficient mice treated with or without doxycycline (DOX; 2 mg/mL in tap water) and vehicle, doxorubicin (DXR; 2 mg/kg bw), or paclitaxel (PTX; 20 mg/kg bw). B, D Images of tumors on day 28. Bar = 1 cm. C, E Tumor volume. n = 6 per group. The data are presented as the mean ± SEM and were analyzed using the Mann–Whitney U-test. *p < 0.05. NS not significant.
Mint3 promotes HSP70 expression in TNBC in an in vivo-specific manner
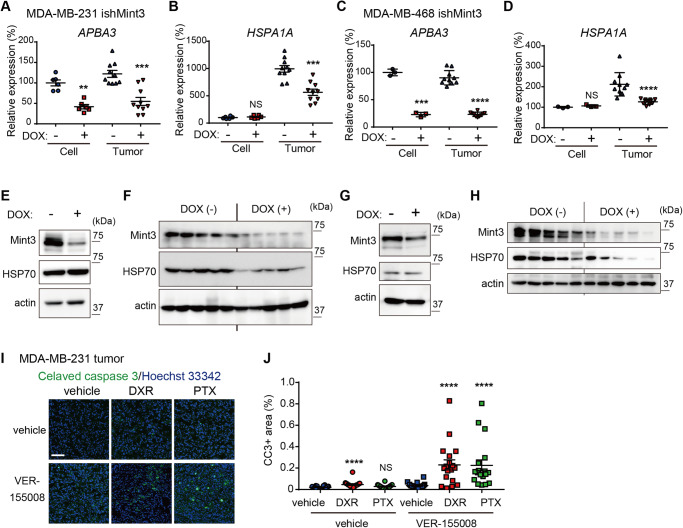
Mint3 depletion did not affect the chemoresistance of TNBC cells in vitro but attenuated it in vivo. Thus, we next addressed how Mint3 specifically promotes the chemoresistance of TNBC cells in vivo by analyzing the transcriptome of tumors from control and Mint3-depleted MDA-MB-231 cells (Supplementary Fig. S2A). We selected more than 1.5-fold overrepresented/underrepresented genes in the tumors of Mint3-depleted MDA-MB-231 cells as candidates that may be involved in Mint3-dependent chemoresistance. Under these criteria, eight genes were underrepresented and nine were overrepresented in tumors of Mint3-depleted MDA-MB-231 cells (Supplementary Fig. S2B, C). Among the underrepresented genes, we focused on HSPA1A which encodes HSP70 and has been reported to enhance chemoresistance [29–31]. We re-evaluated the mRNA levels of APBA3, which encodes Mint3, and HSPA1A in cultured cells and tumors of control and Mint3-depleted MDA-MB-231 and MDA-MB-468 cells. HSAPA1A mRNA levels were decreased by Mint3 depletion, specifically in the tumors of MDA-MB-231 and MDA-MB-468 cells (Fig. 4A‒D). In parallel to mRNA levels, HSP70 protein expression was also decreased by Mint3 depletion, specifically in the tumors of MDA-MB-231 and MDA-MB-468 cells (Fig. 4E‒H). The specificity of Mint3-mediated HSP70 expression in the tumors of MDA-MB-231 cells was also confirmed using control shRNA and another shRNA against Mint3 (Supplementary Fig. S2D, E). In addition, administration of naphthofluorescein, which inhibits Mint3-mediated HIF-1 activation, decreased HSP70 expression in the tumors of MDA-MB-231 cells (Supplementary Fig. S2F), reflecting a previous report that naphthofluorescein administration enhanced the antitumor effects of doxorubicin in tumors of MDA-MB-231 cells [26]. Subsequently, we examined whether HSP70 inhibition sensitized the tumors of MDA-MB-231 cells to the same extent as Mint3 depletion did in our experimental models. VER-15508 sensitized MDA-MB-231 cells to both DXR and PTX in vitro (Supplementary Fig. S3A, B). Furthermore, the concurrent administration of VER-155008, an HSP70 inhibitor, alongside DXR or PTX increased the number of apoptotic cells in MDA-MB-231 tumors when compared with chemotherapy alone (Fig. 4I). Conversely, exogenously expressed HSP70 in Mint3 knockdown induced chemoresistance to DXR and PTX both in vitro and in vivo (Supplementary Fig. 3C‒H). In summation, although HSP70 contributes to chemoresistance both in vitro and in vivo, it is noteworthy that Mint3 depletion decreases HSP70 expression and sensitizes TNBC cells to chemotherapy in an in vivo-specific manner.
Fig. 4. Mint3 promotes HSP70 expression in TNBC in an in vivo-specific manner.
A–D mRNA levels of APBA3 (encoding Mint3) (A, C) and HSPA1A (encoding HSP70) (B, D) in MDA-MB-231 (A, B) and MDA-MB-468 (C, D) ishMint3 cells and tumors treated with or without doxycycline (DOX). Data are presented as mean ± SEM and were analyzed using the Mann–Whitney U-test for MDA-MB-231 cells and MDA-MB-231 and MDA-MB-468 tumors, or the Welch’s t-test for MDA-MB-468 cells. **p < 0.01, ***p < 0.001, ****p < 0.0001. NS: not significant. E, F Protein levels of Mint3 and HSP70 in MDA-MB-231 ishMint3 cells (E) and tumors of these cells (n = 5 per group) (F) treated with or without doxycycline (DOX). G, H Protein levels of Mint3 and HSP70 in MDA-MB-468 ishMint3 cells (G) and tumors of these cells (n = 5 per group) (H) treated with or without doxycycline (DOX). I, J Immunostaining for cleaved caspase-3 in tumors from MDA-MB-231 cells 24 h after one-shot chemotherapy with the vehicle, DXR, or PTX in combination with the HSP70 inhibitor VER 155008 (25 mg/kg bw). I Representative images. J Cleaved caspase-3-positive areas were counted in the tumor sections. n = 18 from six tumors per group. The data are presented as the mean ± SEM and were analyzed using the Mann–Whitney U-test. ****p < 0.0001. NS not significant.
HIF-1 promotes HSP70 expression in TNBC in an in vivo-specific manner
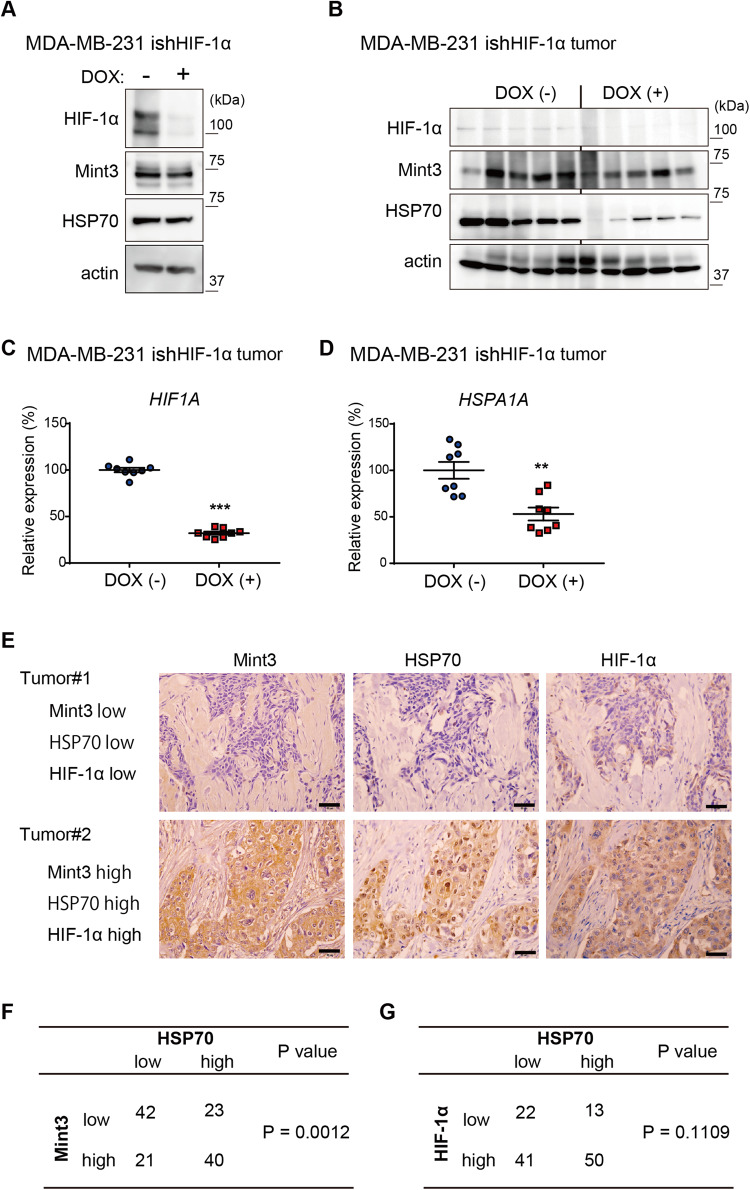
Mint3 activates HIF-1 transcriptional activity by suppressing FIH-1 [22, 23]. Thus, next, we evaluated whether HIF-1α depletion decreased HSP70 expression in MDA-MB-231 tumors, similar to Mint3 depletion. To address this, we established DOX-inducible HIF-1α knockdown MDA-MB-231 cells (ishHIF-1α) (Fig. 5A) and evaluated HSP70 expression in cultured cells and tumors. HIF-1α depletion did not affect Mint3 expression in either cultured cells or tumors of MDA-MB-231 cells, whereas HSP70 protein levels decreased in the tumors of MDA-MB-231 cells when HIF-1α was depleted (Fig. 5A, B). mRNA levels of HSPA1A also decreased in the tumors of HIF-1α-depleted MDA-MB-231 cells (Fig. 5C, D). Thus, HIF-1 also promoted HSP70 expression in an in vivo-specific manner in MDA-MB-231 cells. Next, we examined whether the Mint3-HIF-1 axis promotes HSP70 expression in clinical TNBC specimens. Immunostaining analysis of TNBC tissue microarrays showed that Mint3 expression was positively correlated with HSP70 expression, whereas there was no significant correlation between HIF-1α and HSP70 expression in TNBC specimens (Fig. 5E‒G). These results suggest that HIF-1 expression is a prerequisite, but Mint3-mediated activation of HIF-1 is essential for HSP70 induction in TNBC.
Fig. 5. HIF-1 promotes HSP70 expression in TNBC in an in vivo-specific manner.
A Protein level of HIF-1α, Mint3, and HSP70 in MDA-MB-231-expressing doxycycline-inducible shRNAs against HIF-1α (ishHIF-1α) cells treated with or without doxycycline (DOX; 1 μg/ml) for three days. B Protein levels of HIF-1α, Mint3, and HSP70 in MDA-MB-231 ishHIF-1α tumors administered with or without DOX (2 mg/mL in tap water) for 3 days. n = 5 per group. C, D mRNA levels of HSPA1A (C) and HIF1A (D) in MDA-MB-231 ishHIF-1α tumors administered with or without doxycycline for 3 days. n = 8 per group. Data represent mean ± SEM and were analyzed using the Mann–Whitney U-test. **p < 0.01, ***p < 0.001. E–G Immunostaining for Mint3, HIF-1α, and HSP70 in TNBC specimens (n = 126). E Representative immunostaining images. Bar = 50 µm. F The correlation between Mint3 and HSP70 protein expression was statistically analyzed using the chi-square test. G The correlation between HIF-1α and HSP70 protein expression was statistically analyzed using Fisher’s exact test.
Mint3 activates HSF-1 via the mechanistic target of the rapamycin (mTOR) signaling pathway in TNBC tumors
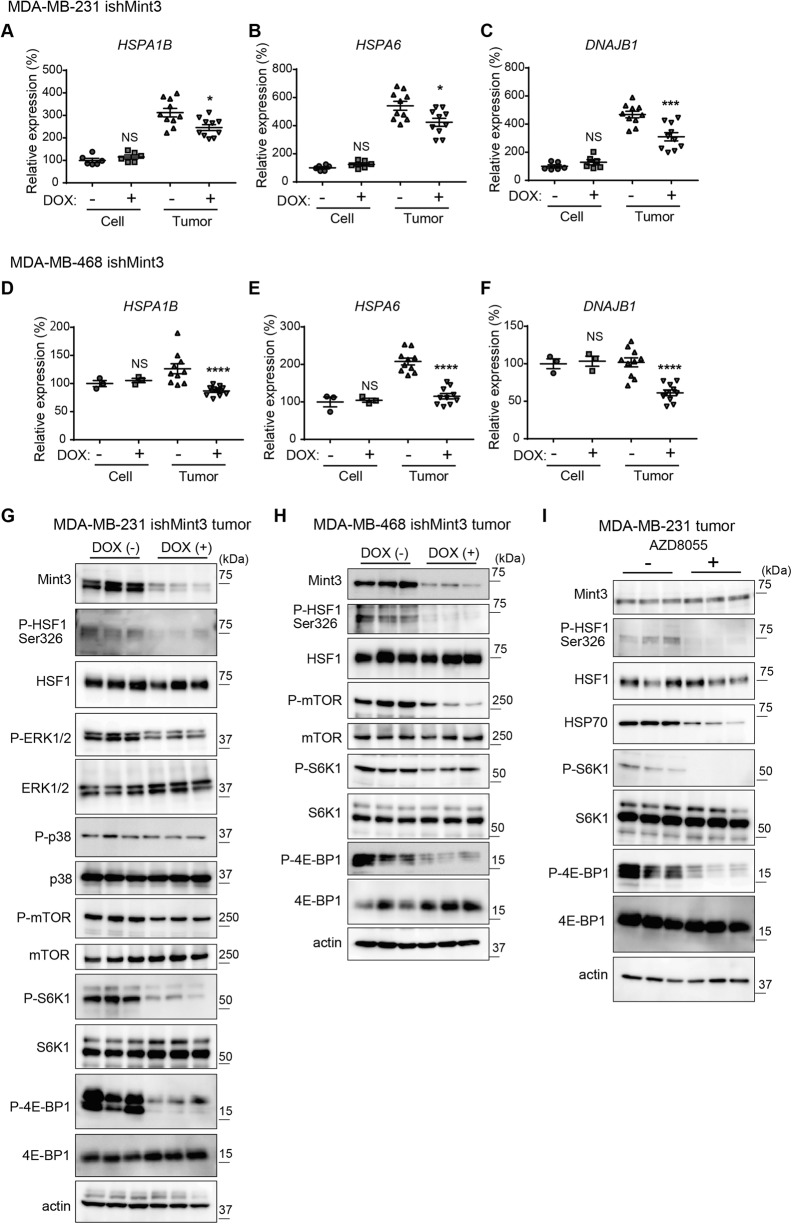
Subsequently, we addressed the mechanisms of how the Mint3–HIF-1 axis induces HSP70 expression in an in vivo-specific manner in TNBC. We first hypothesized that hypoxic conditions observed in tumors may trigger HSP70 induction via the Mint3–HIF-1 axis in TNBC. However, hypoxia alone could not recapitulate the in vivo-specific HSP70 induction by the Mint3–HIF-1 axis in MDA-MB-231 cells (Supplementary Fig. S4A, B). The JASPAR CORE database (https://jaspar.genereg.net/) showed a hypoxia response element ~448–444 bp upstream of the transcription-stating site of HSPA1A. However, chromatin immunoprecipitation assays using anti-HIF-1α antibodies showed that HIF-1 accumulated at the locus of known HIF-1 target genes, but not at the HSPA1A locus (Supplementary Fig. S4C), indicating that HSPA1A was not a direct target of HIF-1, even in MDA-MB-231 cells. HSF1 is a master transcription factor for heat shock proteins, including HSP70 [4, 5, 32]. We could not identify HSF-1 target genes, except HSPA1A in the RNA-seq analyses of tumors of Mint3-depleted MDA-MB-231 cells, probably because of the small sample size and great variation in expression levels (Supplementary Fig. S2B, C). However, we re-evaluated the mRNA levels of HSF1 target genes such as HSPA1B, HSPA6, and DNAJB1 in cultured cells and tumors of MDA-MB-231 and MDA-MB-468 cells using RT-qPCR. Mint3 depletion decreased mRNA levels of HSF1 target genes in tumors but not in cultured MDA-MB-231 and MDA-MB-468 cells, although the decrease in expression levels was moderate compared to that of HSPA1A (Fig. 6A‒F). HIF-1α depletion also decreased the mRNA levels of HSF1 target genes in MDA-MB-231 cells (Supplementary Fig. S5A‒C). These results prompted us to analyze how Mint3 controls HSF1 expression in TNBC. HSF1 activity is regulated by various post-translational modifications, among which, phosphorylation at the Ser326 residue of HSF1 stands as a well-established and extensively characterized post-translational modification for its activation [4, 5, 32]. Thus, we examined the levels of HSF1 phosphorylation at Ser326 (p-HSF1 Ser326) in the tumors of MDA-MB-231 cells. Surprisingly, Mint3 depletion attenuated p-HSF1 Ser326 levels in tumors of MDA-MB-231 cells. Extracellular signal-regulated kinase, p38, and mTOR phosphorylate HSF1 Ser326 [4, 5]. Mint3 depletion slightly decreased the phosphorylation of extracellular signal-regulated kinase 1/2 and mTOR Ser2448, but not p38, in MDA-MB-231 tumors (Fig. 6G). Interestingly, the phosphorylation levels of two representative mTOR targets, S6K1 and 4E-BP1, were strikingly attenuated in tumors of Mint3-depleted MDA-MB-231 cells (Fig. 6G), indicating that mTOR activity was suppressed in tumors of such cells. Similar to MDA-MB-231 cells, Mint3-depleted MDA-MB-468 tumors showed decreased levels of p-HSF1 Ser326 and mTOR activity (Fig. 6H). We then examined whether decreased mTOR activity indeed attenuated p-HSF1 Ser326 levels and HSP70 expression in MDA-MB-231 tumors. Administration of the mTOR inhibitor AZD8055 attenuated mTOR activity, p-HSF1 Ser326 levels, and HSP70 expression in MDA-MB-231 tumors (Fig. 6I). Thus, Mint3-depletion-mediated mTOR inactivation attenuates HSF1 activity, resulting in the decreased expression of HSF1 target genes, including HSP70, in TNBC tumors.
Fig. 6. Mint3 activates HSF-1 via the mTOR signaling pathway in TNBC tumors.
A–F mRNA levels of HSF1 target genes (HSPA1B, HSPA6, and DNAJB1) in MDA-MB-231 (A–C) and MDA-MB-468 (D–F) ishMint3 cells and tumors treated with or without doxycycline (DOX). Data are presented as mean ± SEM and were analyzed using the Mann–Whitney U-test for MDA-MB-231 cells and MDA-MB-231 and MDA-MB-468 tumors, or the Welch’s t-test for MDA-MB-468 cells. *p < 0.05, ***p < 0.001, ****p < 0.0001. NS: not significant. G Immunoblotting of HSF-1 and its upstream signaling-related proteins in MDA-MB-231 ishMint3 tumors treated with or without DOX for three days. n = 3 per group. H Immunoblotting of HSF-1 and mTOR signaling-related proteins in MDA-MB-468 ishMint3 tumors treated with or without DOX for 3 days. n = 3 per group. I Immunoblotting of Mint3, HSF-1, and mTOR signaling-related proteins in MDA-MB-231 tumors treated with or without the mTOR inhibitor AZD8055 (10 mg/kg) for 3 days. n = 3 per group.
Mint3 depletion induces energy stress and thereby attenuates HSF-1 activity in TNBC tumors
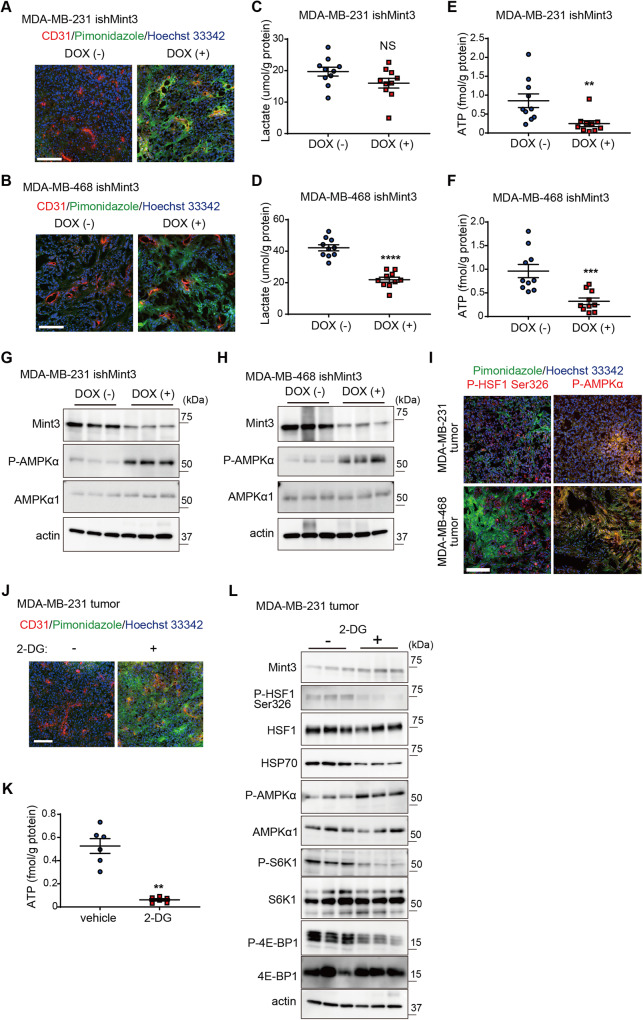
Finally, we addressed how Mint3 depletion attenuates mTOR activity in TNBC tumors. Mint3 activates HIF-1, thereby enhancing glycolytic activity even during normoxia in cancer cells [21, 23]. Enhanced glycolytic activity in cancer cells is known as the Warburg effect [15]. The Warburg effect is thought to provide cancer cells with advantages such as rapid ATP production via glycolysis and metabolic by-products used for cell proliferation [16–18, 33]. Under tumor conditions, the Warburg effect is also proposed to reduce oxygen consumption via mitochondrial ATP production, thereby avoiding severe hypoxia [16]. Thus, we examined hypoxic areas in control and Mint3-depleted TNBC tumors using pimonidazole, whose adducts can be detected in areas with severe hypoxia (pO2 < 10 mm Hg) [34]. Surprisingly, Mint3 depletion caused severe hypoxia, even in the blood vessel-rich areas of MDA-MB-231 and MDA-MB-468 tumors (Fig. 7A, B) but not in vitro (Supplementary Fig. S6A, B). Despite more hypoxic areas, lactate levels were not elevated in Mint3-depleted MDA-MB-231 tumors (Fig. 7C) but were decreased in Mint3-depleted MDA-MB-468 tumors (Fig. 7D). Reflecting this metabolic maladaptation to hypoxic conditions, ATP levels were significantly decreased in the tumors of Mint3-depleted TNBC cells (Fig. 7E, F). Decreased ATP levels activate adenosine monophosphate-activated protein kinase α (AMPKα), which suppresses mTOR activity [35, 36]. Corresponding to decreased ATP levels, Mint3 depletion promoted phosphorylation of AMPKα, indicating AMPKα activity in tumors of MDA-MB-231 and MDA-MB-468 cells (Fig. 7G, H). The administration of metformin, an AMPK activator, also reduced HSP-1 expression. This was accompanied by a decrease in the phosphorylation levels of S6K1, 4E-BP1, and HSF-1 Ser326 within the tumors of MDA-MB-231 cells, mirroring the effects observed with Mint3 depletion (Supplementary Fig. S7A). Notably, the phosphorylation levels of AMPK1 were elevated in response to Mint3 depletion, despite the reduction in HSP-70, even in the context of TNBC tumors grown within the mammary fat pad (Supplementary Fig. S7B, C). However, it is crucial to underline that this Mint3 depletion-mediated AMPK activation was not evident in vitro (Supplementary Figs. S7D and E). Immunostaining showed that p-HSF1 Ser326-positive cells existed mainly in non-hypoxic areas, whereas phosphorylated AMPKα-positive cells existed mainly in hypoxic areas (Fig. 7I), indicating that hypoxia activates AMPK activity and inactivates HSF1 activity in TNBC tumors. Finally, we examined whether glycolysis inhibition phenocopies Mint3 depletion in MDA-MB-231 tumors. Administration of the glycolysis inhibitor 2-deoxy-d-glucose (2-DG) induced hypoxia in the blood vessel-rich areas of MDA-MB-231 tumors (Fig. 7J). In addition, 2-DG administration decreased ATP levels, activated AMPK1, inactivated mTOR, and decreased p-HSF1 Ser326 and HSP70 in MDA-MB-231 tumors, similar to Mint3 depletion (Fig. 7K, L). In turn, 2-DG partially decreased the ATP production in MDA-MB-231 cells in vitro, resulting in comparable AMPK phosphorylation and HSP70 expression levels in 2-DG-treated cells (Supplementary Fig. S8A, B). Thus, defects in glycolysis induce energy stress and thereby attenuate HSF-1 activity in Mint3-depleted TNBC tumors.
Fig. 7. Mint3 depletion induces energy stress and thereby attenuates HSF-1 activity in TNBC tumors.
A, B Immunostaining of hypoxic markers pimonidazole (green) and endothelial cell marker CD31 (red) in MDA-MB-231 (A) and MDA-MB-468 (B) ishMint3 tumors administered with or without doxycycline (DOX) for 3 days. Nuclei were counterstained with Hoechst 33342 (blue). C, D Lactate levels in MDA-MB-231 (C) and MDA-MB-468 (D) ishMint3 tumors administered with or without DOX for three days. n = 10 per group. E, F ATP levels in MDA-MB-231 (E) and MDA-MB-468 (F) ishMint3 tumors administered with or without DOX for 3 days. n = 10 per group. G, H Phosphorylation levels of AMPK1α in MDA-MB-231 (G) and MDA-MB-468 (H) ishMint3 tumors administered with or without DOX for 3 days. n = 3 per group. I Immunostaining of hypoxic marker pimonidazole (green) and phospho-AMPK1α or phospho-HSF-1 Ser326 (red) in MDA-MB-231 and MDA-MB-468 tumors. Nuclei were counterstained with Hoechst 33342 (blue). J Immunostaining of hypoxic marker pimonidazole (green) and endothelial cell marker CD31 (red) in MDA-MB-231 tumors administered with or without a glycolysis inhibitor 2-deoxyglucose (2-DG; 500 mg/kg b.w.) for 3 days. Nuclei were counterstained with Hoechst 33342 (blue). K ATP levels in MDA-MB-231 tumors were administered with or without 2-DG for 3 days. n = 6 per group. L Immunoblotting of Mint3, HSF-1, HSP70, and mTOR signaling-related proteins in MDA-MB-231 tumors administered with or without 2-DG for 3 days. n = 3 per group. In C–F and K, the data represent the mean ± SEM and were analyzed using the Mann–Whitney U-test. **p < 0.01, ***p < 0.001, ****p < 0.0001. NS not significant.
Discussion
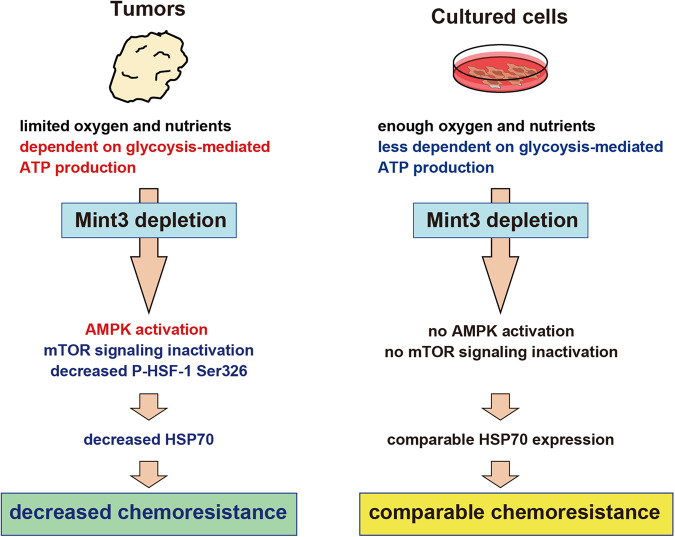
Although the detailed mechanisms of chemoresistance have been extensively studied in cultured cells, the mechanism by which TNBC resists chemotherapy in vivo remains unclear. Here, we showed that metabolic adaptation to the tumor microenvironment via Mint3 contributes to chemoresistance in TNBC. The Mint3–HIF-1 axis activates glycolysis and energy production, activating mTOR. Activated mTOR phosphorylates HSF-1 at Ser326, thereby activating HSF-1. Activated HSF-1 promoted HSP70 expression, which contributed to chemoresistance in TNBC (Fig. 8). It is well documented in the scientific literature that both 2-DG and metformin sensitize tumors to chemotherapy [37–43]. These results collectively suggest a possible link between HSP70 expression, facilitated via glycolysis-mediated ATP production regulated by Mint3 in tumors, and the previously reported chemosensitizing effects of 2-DG and metformin, at least in part. Although administration of the HSP70 inhibitor VER-155008 enhanced the efficacy of doxorubicin and paclitaxel in MDA-MB-231 and MDA-MB-468 tumors, we cannot exclude the possibility that other HSF-1 target genes also contribute to the chemoresistance of TNBC in vivo. Furthermore, while Mint3 depletion sensitized cancer cells to chemotherapy via HSP70 reduction, other mechanisms such as reduced VEGFA production [21, 25] and physical characteristics such as reduced tumor size may further contribute to the enhanced efficacy of chemotherapy in Mint3-depleted tumors.
Fig. 8. Illustration of the role of Mint3 in promoting chemoresistance in TNBC tumors.
TNBC predominantly relies on glycolysis-mediated ATP production in tumors with limited oxygen and nutrients. Remarkably, Mint3 depletion affects glycolysis-mediated ATP production and activates AMPK, resulting in decreased HSF-1 Ser326 phosphorylation and HSP70 expression. The ensuing reduction in HSP70 levels sensitizes TNBC tumors to chemotherapy. Conversely, TNBC cells cultured under conditions of ample oxygen and nutrient availability exhibit a reduced dependency on glycolysis-mediated ATP production. Consequently, Mint3 depletion fails to exert an impact on AMPK activity or HSP70 expression, resulting in comparable chemoresistance in TNBC cells.
Elevated glycolysis in cancer cells during normoxia is known as the Warburg effect [15]. Many studies have shown that depleting elevated glycolytic enzymes can attenuate tumor growth in various types of cancer [11–14]. Indeed, the Warburg effect must be involved in these phenotypes. However, the depletion of glycolysis-related genes affects not only the Warburg effect but also the Pasteur effect, which elevates glycolysis during hypoxia [33]. Thus, the precise role of the Warburg effect in vivo remains unclear. Mint3 activates HIF-1 during normoxia by inhibiting the oxygen-dependent HIF-1 suppressor, FIH-1 [22, 23]. Knockdown experiments using siRNA showed that Mint3 depletion attenuated lactate production in various cancer cell lines during normoxia but not during hypoxia [21], indicating the Warburg-effect-specific Mint3 contribution. Thus, attenuation of tumor growth and chemoresistance in TNBC tumors by Mint3 depletion might shed light on the role of the Warburg effect in vivo.
Here, we focused on the chemoresistance of TNBC and showed that Mint3 promotes the chemoresistance of TNBC tumors by activating HSF-1 and inducing HSP70 expression. HSF-1 is a master regulator of heat shock proteins. However, independent of the heat shock response, HSF-1 has been reported to support malignant features such as cell cycle regulation, signaling, metabolism, adhesion, and translation in various cancers including breast cancer [32]. Thus, Mint3-mediated HSF-1 activation may also contribute to various malignant features independent of the heat shock response in TNBC. Although both HSF-1 and HIF-1 are essential transcription factors for stress responses, a limited number of studies have reported that HSF family proteins, HSF2 and HSF4, promote transcription of HIF-1α and result in VEGFA expression in several cancer cell lines [44]. Our findings provide novel crosstalk between HIF-1 and HSF-1 mediated by Mint3 in tumor microenvironments and shed light on the strategy whereby TNBC resists chemotherapy by integrating multiple stress responses. Although Mint3 can activate HIF-1 both in vitro and in vivo, HSF-1 inactivation and attenuation of chemoresistance by Mint3 depletion were observed only in vivo. One of the reasons for this is that attenuated glycolysis by Mint3 depletion did not have a significant impact on the energy production of cancer cells under nutrient-rich culture conditions. In addition, various stress-induced post-translational modifications are necessary for HSF-1 to be fully activated [4, 5]. Normal cell culture conditions do not seem to match such stressful conditions sufficiently to activate HSF-1. Taken together, Mint3 depletion did not affect HSP70 expression or chemoresistance in TNBC under culture conditions. It is imperative to acknowledge a certain limitation of our study. We conducted an analysis of whole tumor gene expression via RNA-seq and RT-qPCR, revealing only modest alterations induced by Mint3 depletion. Considering that local oxygen concentration can impact the consequences of Mint3 depletion, we posit that the utilization of single-cell RNA-seq analysis may reveal the impact of Mint3 depletion in tumors more clearly than bulk RNA-seq analysis.
In summary, Mint3 depletion induces metabolic inadaptation to the tumor microenvironment, thereby sensitizing TNBC to chemotherapy in vivo. The combination of Mint3 inhibition and chemotherapy may be a good strategy for TNBC treatment.
Materials and methods
Detailed information on material and methods is available in Supplementary Information and Supplementary Tables 1 and 2. Full-length, uncropped original western blots are available in the Supplementary File.
Supplementary information
Acknowledgements
We thank Tomoko Ando, Miho Ishiura, Mai Nakayama, and Ayaka Ohta for their technical support. This work was supported by a Grant-in-Aid for Scientific Research (C) (19K07659) from MEXT; a P-CREATE (Project for Cancer Research and Therapeutic Evolution) grant (JP21cm0106211) from The Japan Agency for Medical Research and Development; a grant from the Kobayashi Foundation for Cancer Research; the Project Mirai Cancer Research Grants from the Japan Cancer Society; Kansai Medical University Molecular Imaging Center of Diseases; and partly by the Extramural Collaborative Research Grant of the Cancer Research Institute, Kanazawa University and by a grant from the International Joint Usage/Research Center, the Institute of Medical Science, the University of Tokyo (to TS).
Author contributions
TS designed the study; NT, KY, MS, DM, and TS wrote the manuscript; NT, HO, and TS performed the cell and mouse experiments; DM performed tissue microarray analyses; MS and YS performed RNA-seq analyses; KY and YF analyzed RNA-seq data using DESeq2 and performed ChIP-seq analyses; and NG, TY, JI, and SK supervised the study. All the authors approved the final manuscript.
Funding
This work was also supported by "the Strategic Project for Proofreading and Submission Support of International Academic Papers" by Kansai Medical University.
Data availability
Data supporting the findings of this study are included in the figures and supporting files.
Competing interests
The authors declare no competing interests.
Ethics
All animal experiments were approved by the Animal Care and Use Committees of the Institute of Medical Science, University of Tokyo, the Institute of Medical, Pharmaceutical, and Health Sciences, Kanazawa University, and Kansai Medical University. They were also conducted following the institutional ethical guidelines for animal experiments and the safety guidelines for gene manipulation experiments.
Footnotes
Edited by Rami Aqeilan
Publisher’s note Springer Nature remains neutral with regard to jurisdictional claims in published maps and institutional affiliations.
These authors contributed equally: Noritaka Tanaka, Hikari Okada.
Supplementary information
The online version contains supplementary material available at 10.1038/s41419-023-06352-4.
References
- 1.Li Y, Zhang H, Merkher Y, Chen L, Liu N, Leonov S, et al. Recent advances in therapeutic strategies for triple-negative breast cancer. J Hematol Oncol. 2022;15:121. doi: 10.1186/s13045-022-01341-0. [DOI] [PMC free article] [PubMed] [Google Scholar]
- 2.Robey RW, Pluchino KM, Hall MD, Fojo AT, Bates SE, Gottesman MM. Revisiting the role of ABC transporters in multidrug-resistant cancer. Nat Rev Cancer. 2018;18:452–64. doi: 10.1038/s41568-018-0005-8. [DOI] [PMC free article] [PubMed] [Google Scholar]
- 3.Maji S, Panda S, Samal SK, Shriwas O, Rath R, Pellecchia M, et al. Bcl-2 antiapoptotic family proteins and chemoresistance in cancer. Adv Cancer Res. 2018;137:37–75. doi: 10.1016/bs.acr.2017.11.001. [DOI] [PubMed] [Google Scholar]
- 4.Akerfelt M, Morimoto RI, Sistonen L. Heat shock factors: integrators of cell stress, development and lifespan. Nat Rev Mol Cell Biol. 2010;11:545–55. doi: 10.1038/nrm2938. [DOI] [PMC free article] [PubMed] [Google Scholar]
- 5.Dayalan Naidu S, Dinkova-Kostova AT. Regulation of the mammalian heat shock factor 1. FEBS J. 2017;284:1606–27. doi: 10.1111/febs.13999. [DOI] [PubMed] [Google Scholar]
- 6.Rodina A, Wang T, Yan P, Gomes ED, Dunphy MP, Pillarsetty N, et al. The epichaperome is an integrated chaperome network that facilitates tumour survival. Nature. 2016;538:397–401. doi: 10.1038/nature19807. [DOI] [PMC free article] [PubMed] [Google Scholar]
- 7.Vasan N, Baselga J, Hyman DM. A view on drug resistance in cancer. Nature. 2019;575:299–309. doi: 10.1038/s41586-019-1730-1. [DOI] [PMC free article] [PubMed] [Google Scholar]
- 8.Keith B, Johnson RS, Simon MC. HIF1alpha and HIF2alpha: sibling rivalry in hypoxic tumour growth and progression. Nat Rev Cancer. 2011;12:9–22. doi: 10.1038/nrc3183. [DOI] [PMC free article] [PubMed] [Google Scholar]
- 9.Lee P, Chandel NS, Simon MC. Cellular adaptation to hypoxia through hypoxia inducible factors and beyond. Nat Rev Mol Cell Biol. 2020;21:268–83. doi: 10.1038/s41580-020-0227-y. [DOI] [PMC free article] [PubMed] [Google Scholar]
- 10.Majmundar AJ, Wong WJ, Simon MC. Hypoxia-inducible factors and the response to hypoxic stress. Mol Cell. 2010;40:294–309. doi: 10.1016/j.molcel.2010.09.022. [DOI] [PMC free article] [PubMed] [Google Scholar]
- 11.DeWaal D, Nogueira V, Terry AR, Patra KC, Jeon SM, Guzman G, et al. Hexokinase-2 depletion inhibits glycolysis and induces oxidative phosphorylation in hepatocellular carcinoma and sensitizes to metformin. Nat Commun. 2018;9:446. doi: 10.1038/s41467-017-02733-4. [DOI] [PMC free article] [PubMed] [Google Scholar]
- 12.Fantin VR, St-Pierre J, Leder P. Attenuation of LDH-A expression uncovers a link between glycolysis, mitochondrial physiology, and tumor maintenance. Cancer Cell. 2006;9:425–34. doi: 10.1016/j.ccr.2006.04.023. [DOI] [PubMed] [Google Scholar]
- 13.Goldberg MS, Sharp PA. Pyruvate kinase M2-specific siRNA induces apoptosis and tumor regression. J Exp Med. 2012;209:217–24. doi: 10.1084/jem.20111487. [DOI] [PMC free article] [PubMed] [Google Scholar]
- 14.Li FL, Liu JP, Bao RX, Yan G, Feng X, Xu YP, et al. Acetylation accumulates PFKFB3 in cytoplasm to promote glycolysis and protects cells from cisplatin-induced apoptosis. Nat Commun. 2018;9:508. doi: 10.1038/s41467-018-02950-5. [DOI] [PMC free article] [PubMed] [Google Scholar]
- 15.Warburg O. On the origin of cancer cells. Science. 1956;123:309–14. doi: 10.1126/science.123.3191.309. [DOI] [PubMed] [Google Scholar]
- 16.Denko NC. Hypoxia, HIF1 and glucose metabolism in the solid tumour. Nat Rev Cancer. 2008;8:705–13. doi: 10.1038/nrc2468. [DOI] [PubMed] [Google Scholar]
- 17.Vander Heiden MG, Cantley LC, Thompson CB. Understanding the Warburg effect: the metabolic requirements of cell proliferation. Science. 2009;324:1029–33. doi: 10.1126/science.1160809. [DOI] [PMC free article] [PubMed] [Google Scholar]
- 18.Liberti MV, Locasale JW. The Warburg effect: how does it benefit cancer cells? Trends Biochem Sci. 2016;41:211–8. doi: 10.1016/j.tibs.2015.12.001. [DOI] [PMC free article] [PubMed] [Google Scholar]
- 19.Kanamori A, Matsubara D, Saitoh Y, Fukui Y, Gotoh N, Kaneko S, et al. Mint3 depletion restricts tumor malignancy of pancreatic cancer cells by decreasing SKP2 expression via HIF-1. Oncogene. 2020;39:6218–30. doi: 10.1038/s41388-020-01423-8. [DOI] [PMC free article] [PubMed] [Google Scholar]
- 20.Nakaoka HJ, Hara T, Yoshino S, Kanamori A, Matsui Y, Shimamura T, et al. NECAB3 promotes activation of hypoxia-inducible factor-1 during normoxia and enhances tumourigenicity of cancer cells. Sci Rep. 2016;6:22784. doi: 10.1038/srep22784. [DOI] [PMC free article] [PubMed] [Google Scholar]
- 21.Sakamoto T, Niiya D, Seiki M. Targeting the Warburg effect that arises in tumor cells expressing membrane type-1 matrix metalloproteinase. J Biol Chem. 2011;286:14691–704. doi: 10.1074/jbc.M110.188714. [DOI] [PMC free article] [PubMed] [Google Scholar]
- 22.Sakamoto T, Seiki M. Mint3 enhances the activity of hypoxia-inducible factor-1 (HIF-1) in macrophages by suppressing the activity of factor inhibiting HIF-1. J Biol Chem. 2009;284:30350–9. doi: 10.1074/jbc.M109.019216. [DOI] [PMC free article] [PubMed] [Google Scholar]
- 23.Sakamoto T, Seiki M. Integrated functions of membrane-type 1 matrix metalloproteinase in regulating cancer malignancy: beyond a proteinase. Cancer Sci. 2017;108:1095–1100. doi: 10.1111/cas.13231. [DOI] [PMC free article] [PubMed] [Google Scholar]
- 24.Sakamoto T, Weng JS, Hara T, Yoshino S, Kozuka-Hata H, Oyama M, et al. Hypoxia-inducible factor 1 regulation through cross talk between mTOR and MT1-MMP. Mol Cell Biol. 2014;34:30–42. doi: 10.1128/MCB.01169-13. [DOI] [PMC free article] [PubMed] [Google Scholar]
- 25.Ikeda J, Ohe C, Tanaka N, Yoshida T, Saito R, Atsumi N, et al. Hypoxia inducible factor‐1 activator munc‐18‐interacting protein 3 promotes tumour progression in urothelial carcinoma. Clinical and Translational Discovery. 2023;3:e158. doi: 10.1002/ctd2.158. [DOI] [Google Scholar]
- 26.Sakamoto T, Fukui Y, Kondoh Y, Honda K, Shimizu T, Hara T, et al. Pharmacological inhibition of Mint3 attenuates tumour growth, metastasis, and endotoxic shock. Commun Biol. 2021;4:1165. doi: 10.1038/s42003-021-02701-1. [DOI] [PMC free article] [PubMed] [Google Scholar]
- 27.Garrido-Castro AC, Lin NU, Polyak K. Insights into molecular classifications of triple-negative breast cancer: improving patient selection for treatment. Cancer Discov. 2019;9:176–98. doi: 10.1158/2159-8290.CD-18-1177. [DOI] [PMC free article] [PubMed] [Google Scholar]
- 28.Holliday DL, Speirs V. Choosing the right cell line for breast cancer research. Breast Cancer Res. 2011;13:215. doi: 10.1186/bcr2889. [DOI] [PMC free article] [PubMed] [Google Scholar]
- 29.Kabakov AE, Gabai VL. HSP70s in breast cancer: promoters of tumorigenesis and potential targets/tools for therapy. Cells. 2021;10:3446.. doi: 10.3390/cells10123446. [DOI] [PMC free article] [PubMed] [Google Scholar]
- 30.Murphy ME. The HSP70 family and cancer. Carcinogenesis. 2013;34:1181–8. doi: 10.1093/carcin/bgt111. [DOI] [PMC free article] [PubMed] [Google Scholar]
- 31.Vostakolaei MA, Hatami-Baroogh L, Babaei G, Molavi O, Kordi S, Abdolalizadeh J. Hsp70 in cancer: a double agent in the battle between survival and death. J Cell Physiol. 2021;236:3420–44. doi: 10.1002/jcp.30132. [DOI] [PubMed] [Google Scholar]
- 32.Mendillo ML, Santagata S, Koeva M, Bell GW, Hu R, Tamimi RM, et al. HSF1 drives a transcriptional program distinct from heat shock to support highly malignant human cancers. Cell. 2012;150:549–62. doi: 10.1016/j.cell.2012.06.031. [DOI] [PMC free article] [PubMed] [Google Scholar]
- 33.Gatenby RA, Gillies RJ. Why do cancers have high aerobic glycolysis? Nat Rev Cancer. 2004;4:891–9. doi: 10.1038/nrc1478. [DOI] [PubMed] [Google Scholar]
- 34.Varghese AJ, Gulyas S, Mohindra JK. Hypoxia-dependent reduction of 1-(2-nitro-1-imidazolyl)-3-methoxy-2-propanol by Chinese hamster ovary cells and KHT tumor cells in vitro and in vivo. Cancer Res. 1976;36:3761–5. [PubMed] [Google Scholar]
- 35.Liu GY, Sabatini DM. mTOR at the nexus of nutrition, growth, ageing and disease. Nat Rev Mol Cell Biol. 2020;21:183–203. doi: 10.1038/s41580-019-0199-y. [DOI] [PMC free article] [PubMed] [Google Scholar]
- 36.Saxton RA, Sabatini DM. mTOR signaling in growth, metabolism, and disease. Cell. 2017;169:361–71. doi: 10.1016/j.cell.2017.03.035. [DOI] [PubMed] [Google Scholar]
- 37.El-Khayat SM, Abouegylah M, Abdallah D, Geweil AG, Elenbaby AM, Zahra OS. The effect of metformin when combined with neoadjuvant chemotherapy in breast cancer patients. Med Oncol. 2021;39:1. doi: 10.1007/s12032-021-01599-3. [DOI] [PubMed] [Google Scholar]
- 38.Vakili-Ghartavol R, Mehrabian A, Mirzavi F, Rezayat SM, Mashreghi M, Farhoudi L, et al. Docetaxel in combination with metformin enhances antitumour efficacy in metastatic breast carcinoma models: a promising cancer targeting based on PEGylated liposomes. J Pharm Pharmacol. 2022;74:1307–19. doi: 10.1093/jpp/rgac048. [DOI] [PubMed] [Google Scholar]
- 39.Maschek G, Savaraj N, Priebe W, Braunschweiger P, Hamilton K, Tidmarsh GF, et al. 2-deoxy-d-glucose increases the efficacy of adriamycin and paclitaxel in human osteosarcoma and non-small cell lung cancers in vivo. Cancer Res. 2004;64:31–34. doi: 10.1158/0008-5472.CAN-03-3294. [DOI] [PubMed] [Google Scholar]
- 40.Sandulache VC, Skinner HD, Wang Y, Chen Y, Dodge CT, Ow TJ, et al. Glycolytic inhibition alters anaplastic thyroid carcinoma tumor metabolism and improves response to conventional chemotherapy and radiation. Mol Cancer Ther. 2012;11:1373–80. doi: 10.1158/1535-7163.MCT-12-0041. [DOI] [PMC free article] [PubMed] [Google Scholar]
- 41.Varghese E, Samuel SM, Liskova A, Samec M, Kubatka P, Busselberg D. Targeting glucose metabolism to overcome resistance to anticancer chemotherapy in breast cancer. Cancers (Basel) 2020;12:2252.. doi: 10.3390/cancers12082252. [DOI] [PMC free article] [PubMed] [Google Scholar]
- 42.Pelicano H, Martin DS, Xu RH, Huang P. Glycolysis inhibition for anticancer treatment. Oncogene. 2006;25:4633–46. doi: 10.1038/sj.onc.1209597. [DOI] [PubMed] [Google Scholar]
- 43.Iliopoulos D, Hirsch HA, Struhl K. Metformin decreases the dose of chemotherapy for prolonging tumor remission in mouse xenografts involving multiple cancer cell types. Cancer Res. 2011;71:3196–201. doi: 10.1158/0008-5472.CAN-10-3471. [DOI] [PMC free article] [PubMed] [Google Scholar]
- 44.Chen R, Liliental JE, Kowalski PE, Lu Q, Cohen SN. Regulation of transcription of hypoxia-inducible factor-1alpha (HIF-1alpha) by heat shock factors HSF2 and HSF4. Oncogene. 2011;30:2570–80. doi: 10.1038/onc.2010.623. [DOI] [PubMed] [Google Scholar]
Associated Data
This section collects any data citations, data availability statements, or supplementary materials included in this article.
Supplementary Materials
Data Availability Statement
Data supporting the findings of this study are included in the figures and supporting files.


