Abstract
Due to a growing need in visualizing human pluripotent stem cell-derived organoids from recent advancements in the field, an efficient bulk-processing application is necessary to provide preprocessing and image analysis services. In this study, we developed Organalysis, a high-accuracy, multifunctional, and accessible application that meets these needs by providing the functionality of image manipulation and enhancement, organoid area and intensity calculation, fractal analysis, noise removal, and feature importance computation. The image manipulation feature includes brightness and contrast adjustment. The area and intensity calculation computes six values for each image: organoid area, total image area, percentage of the image covered by organoid, the total intensity of organoid, the total intensity of organoid-by-organoid area, and total intensity of organoid by total image area. The fractal analysis function computes the fractal dimension value for each image. The noise removal function removes superfluous marks from the input images, such as bubbles and other unwanted noise. The feature importance function trains a lasso-regularized linear regression machine learning algorithm to identify cardiac growth factors that are the strongest determinants for cell differentiation. The batch processing of this application further builds on existing services like ImageJ to provide a more convenient way to process multiple images. Collectively, the versatility and preciseness of Organalysis demonstrate novelty, since no other current imaging software combines the capability of batch processing and the breadth of feature analysis. Therefore, Organalysis provides unique functions in cardiac organoid research and proves to be invaluable in regenerative medicine.
Impact statement
Image processing tools such as ImageJ that aid in the analysis of microscope-based organoid imaging are widely applied. However, there is currently no application that provides a friendly graphical user interface, allows for efficient bulk processing, and caters specifically to organoid research. “Organalysis,” the software presented in this study, is a groundbreaking application designed to accelerate organoid image preprocessing and analysis for biomedical researchers. Organalysis offers a comprehensive solution with high accuracy, multifunctionality, and easy accessibility. It advances the study of human pluripotent stem cell-derived cardiac organoid development, disease modeling, and drug evaluation by significantly reducing the time and effort required for analysis.
Keywords: graphical user interface, image preprocessing and analysis, cardiac organoid, fractal analysis, feature importance
Introduction
With the recent advancements in human pluripotent stem cell (hPSC)-derived organoids, numerous characterization techniques have been in considerable development for better studying and applying hPSC-derived organoids in disease modeling and regenerative medicine.1 One of the major characterization approaches for visualizing the hPSC-derived organoid is microscopic imaging.
Correspondingly, image-processing techniques are needed for image preprocessing and image analysis. In the area of organoid analysis, image preprocessing is the process of manipulating and enhancing microscopic images before they are analyzed, while image analysis is the process of extracting useful information from microscopic images for examination and comparison to determine scientific results and trends. Image processing of biological samples has become increasingly critical to further extracting extended information from hPSC-derived organoid studies. Currently, various approaches have been applied to analyze organoid formation and growth,2 track organoid circularity and area,3 and in-focus imaging.4
Each of these reports presents a specific solution to a problem; however, they lack other key features of microscopic images, such as overall intensity, average intensity over the area, and fractal dimension (FD) of representing organoid structure. Moreover, there are potential technical shortcomings in downsampling for conserving memory, lack of a simple graphical user interface (GUI), and difficulties in organoid shape fitting. In addition, while the ImageJ (National Institute of Health [NIH]) software supplies a wide array of image processing tools, including fractal analysis,5 brightness/contrast enhancements, and noise removal, it has a very convoluted interface, sometimes requiring repetitive clicks to automate a function.
In fact, ImageJ is suited for small-scale, or image-by-image, processing methods,6 making batch processing with multiple images extremely time-consuming and inconsistent. ImageJ, therefore, is less automated and less efficient for large folders of images collected from high-throughput hPSC-derived organoid studies with multiple controlling factors and various pathophysiological phenotypes. To circumvent these obstacles, a multifunctional, consolidated, and simplified image preprocessing and analysis software is urgently needed in the hPSC-derived organoid research field.
In this study, we established a multifunctional application, named “Organalysis,” for batch preprocessing and analyzing fluorescent images from hPSC-derived cardiac organoids. In Organalysis, users control all the processes at once with fewer clicks through a user-friendly GUI. Currently, there is no automated software that includes such functions, targeted at handling batch processing. In addition, Organalysis consists of the feature importance function, which becomes critical to understanding the effect of differentiation factors on the hPSC-derived cardiac organoid formation.
This novel platform incorporates new algorithms with more efficacy into a consolidated environment, enabling users to employ our application with ease and accuracy. Herein, we primarily use the fluorescence images of hPSC-derived cardiac organoids with the same protocol set up in our recent publication7 to test and evaluate our platform. According to this publication, hPSC-derived cardiac organoids are made up of three main fluorescence-labeled cardiovascular cell types: smooth muscle cells, cardiomyocytes, and endothelial cells, which were live-cell imaged in blue (Cyan Fluorescent Protein [CFP]), green (Green Fluorescent Protein [GFP]), and red/orange (Red Fluorescent Protein/Monomeric Orange Protein [RFP/mOr]), respectively.
Materials and Methods
Platform design
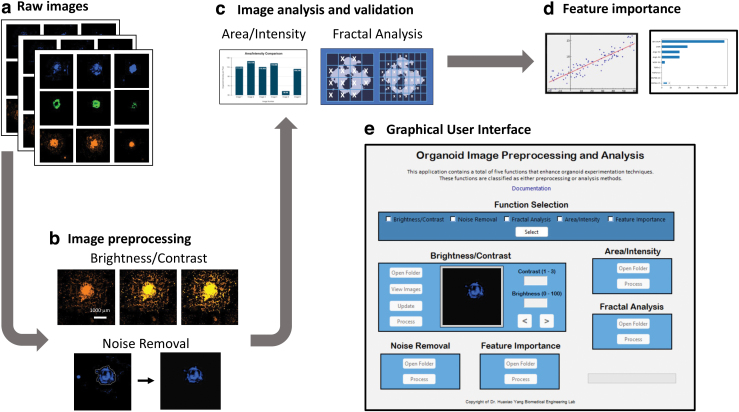
The flowchart, as shown in Figure 1, depicts the process from inputting raw fluorescence microscopic images to image preprocessing, analysis, and validation with the five included functions for hPSC-derived organoids. The Organalysis application, built from Python, is intended to provide a simple, user-handy platform, as shown in Supplementary Figure S1. The design was intuitive, reducing the total number of clicks to the process of designated functions. Each function also runs through multiple images at once, streamlining the human-to-program interaction. The frontend (user interface) and backend (functional operations) are both natively programmed through Python's Tkinter package, a Python extension to the Tk GUI framework.8
FIG. 1.
Roadmap of cardiac organoid image preprocessing and analysis functions from (a) obtaining the raw images; (b) preprocessing those images using the brightness/contrast adjustment and noise removal features; (c) analyzing and validating those images using the area/intensity calculation algorithm and the fractal analysis function; (d) comparing all the results with the feature importance function to understand the organoid intricacies; and (e) representation of GUI with all the functions comprised within the platform. GUI, graphical user interface. Color images are available online.
The GUI framework was then downloaded as standalone software by Python's PyInstaller package. Organalysis comprises a total of five functions in three categories: preprocessing, analysis, and comparison. The preprocessing functions include brightness/contrast adjustments and noise removal. The analysis functions include area/intensity measurements and fractal analysis. The comparison function includes the feature importance function for determining the various conditions seen in the images of organoids. By employing specific algorithms to determine information about the organoid, this software is especially useful in rapid experimentation methods. In our study, the application processed the hPSC-derived cardiac organoid data (CFP, GFP, and RFP/mOr images) and generated an Excel report and/or a folder of updated images depending on the function.
Preprocessing functions
Brightness and contrast adjustment
The brightness and contrast enhancement feature uses OpenCV's convertScaleAbs function9 to supply an interface for adjusting the brightness and contrast of all images in one folder. The interface allows the user to traverse a folder of images and adjust the brightness and contrast of each image. With the first click, the user opens the folder with all the fluorescently colored organoid images. The second click places the images onto the screen, allowing the user to toggle between the images.
When the user finds a raw image, the brightness and contrast values are manipulated to better augment the features: the user enters in decimal-precise numbers for the contrast (alpha) value, which ranges from 1.0 to 3.0, and the brightness (beta) value, which ranges from a 0.0 to 100.0. With the third click, the user visualizes the changes made to the image and determines the best parameters to enter in the text fields. The user can either press “one” to update just that image, or press “all” to update every image in the folder.
Finally, once the necessary images are changed, the user could click “process” to finish the function and download the folder of updated images. This function utilizes alpha, a multiplicative scale factor, and beta, an additive scale factor, parameters to manipulate the brightness and contrast of an image. The formula to update a pixel's value based on the alpha and beta parameters is given below:
Noise removal
The noise removal function uses OpenCV to remove unwanted artifacts and noise from a microscope image of an organoid. First, the function sharpens the image using the OpenCV package in Python. It then uses a threshold on the image to identify the morphology and amplify the features of the image. The function then finds the blobs in the image and employs the contour detection algorithm from OpenCV.10 Next, if specified pixels in the image are identified by the contour, the function retains their values. If specified pixels in the image are not identified, it turns their color to black (zero intensity). This technique turns the noise pixels into black pixels so that only the central organoid is represented. Finally, the modified image with removed noise is saved to a new folder. Each image in the original folder is processed and saved in a comparable way.
Analysis functions
Area and intensity calculations
In this function, pixel-based methods are used to calculate six data types (organoid area, total image area, percentage of the image covered by organoid, total intensity of organoid, total intensity of organoid-by-organoid area, and total intensity of organoid by total image area). The function iterates over the number of images in the original folder and creates a spreadsheet with six columns per image.
For each image, the function standardizes the image based on user input and then applies an Otsu thresholding algorithm with OpenCV.11 The Otsu thresholding algorithm automatically calculates standardized threshold value based on the given image to find the contour of the organoid. It then counts the total number of pixels inside that contour and determines the values for the six datasets. The formulas for the percentage of organoid coverage, the total intensity of organoid-by-organoid area, and the total intensity of organoid by total image area are shown below.
Fractal analysis
The fractal analysis function is developed based on open-source code.12 The function processes a folder of images and outputs the FDs in a spreadsheet. Initially, this function binarizes the image by thresholding and maintaining its minute details. The algorithm then splits the pixel into rectangular bins. Next, it determines the number of bins that have at least one bright pixel. This process is repeated with varying bin scales, where the scale of bins refers to the fineness of image subdivisions. The scale of bins (inversely proportional to the bin size) s and the number of bright bins n are transformed logarithmically. Finally, the function computes the slope of the n versus s line of best fit to find the fractal value for the image. In addition to writing the fractal value to a spreadsheet, the FD (white pixelated) image is also added into the folder.
scale of bins, s, and number of bright bins, n.
Comparison function
Feature importance
The feature importance function in the software is performed based on a lasso-regularized linear regression model that is trained on the provided data. Feature importance values are calculated based on permutation importance values using Scikit-Learn.13
The function requires input data in the form of a Comma-Separated Values (CSV) file. By default, this file represents the treatments applied to a rectangular plate with 48 specimens (6 rows by 8 columns). The input CSV's dimensions follow this format: each row in the CSV represents one column of wells in the organoid plates. Each column of the CSV represents one treatment applied to the organoids. The values in each CSV cell (row and column) reflect whether a particular treatment (specified by the column) was applied to a particular column of wells in the plate (specified by the row). The value in the CSV cell is either a binary (0 or 1), representing either a present or absent treatment, or a decimal number between 0 and 1, representing the quantity or volume of an organoid differentiation factor.
The function outputs the relative importance of each treatment, with higher numbers representing a larger significance of the treatment. The outputs include two formats: a PNG file providing a graphical ranked view of the importance of each treatment, and a CSV file providing the specific feature importance values of each treatment.
Experiments
hPSC-derived cardiac organoid differentiation
All experiments, methods, and protocols for this study were approved by the University of North Texas Institutional Biosafety Committee (IBC). The differentiation protocol of hPSC-derived cardiac organoids followed our recent publication7 with treatments of 6 μM CHIR-99021 (CHIR; Selleck Chemicals) from days 0 to 2 and 5 μM IWR-1 (IWR; Selleck Chemicals) from days 3 to 5 in RPMI + B27 minus insulin culture medium, and then continued differentiation in RPMI + B27 up to day 16.
hPSC-derived cardiac organoid imaging
All the fluorescence organoid images in the range of 256 × 256 to 2048 × 2048 in pixels were taken by the Keyence All-In-One Fluorescence Microscope BZ-X810 with a 10 × objective at GFP, RFP/mOr, and 4′,6-diamidino-2-phenylindole channels.
hPSC-derived cardiac organoid analysis
All image-analysis functions presented in this study were performed using the Organalysis application. The specific parameters measured using Organalysis are thoroughly described in the Materials and Methods section. For comparative reasons, ImageJ was utilized for organoid image analysis in area and intensity calculation and fractal analysis on the same images used in Organalysis.
Results
Brightness and contrast adjustments
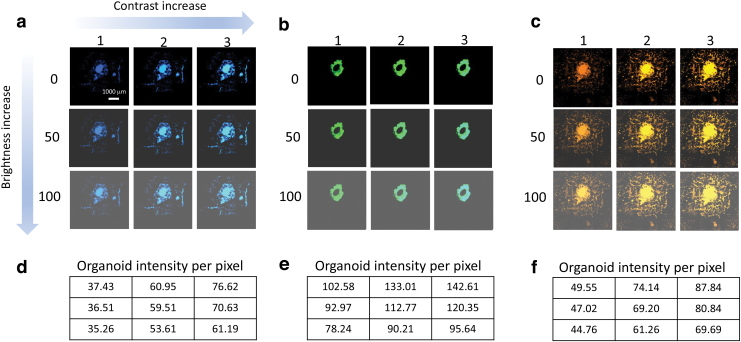
The brightness and contrast function were performed on three channels (blue-CFP, green-GPF, and red/orange-mOr) on the scales of 0.0–100.0 for brightness and 1.0–3.0 for contrast, as shown in Figure 2a–c. After the adjustment of contrast and brightness, the corresponding organoid intensities per pixel were measured and documented in Figure 2d–f. Therefore, our application can process images in bulk, as demonstrated in Supplementary Figure S2, with the same scale of brightness and contrast for further quantified analysis.
FIG. 2.
The function of brightness/contrast adjustment. (a–c) Fluorescence images of three cell types labeled in CFP, GFP, and mOr, respectively, through the brightness and contrast adjustment by tuning the alpha and beta filters from 0 to 100 and 1 to 3, respectively. Scale bar: 1000 μm. (d–f) Corresponding measurements of organoid intensity per pixel upon the brightness and contrast adjustments. CFP, cyan fluorescent protein; GFP, green fluorescent protein; mOr, monomeric orange protein. Color images are available online.
Noise removal
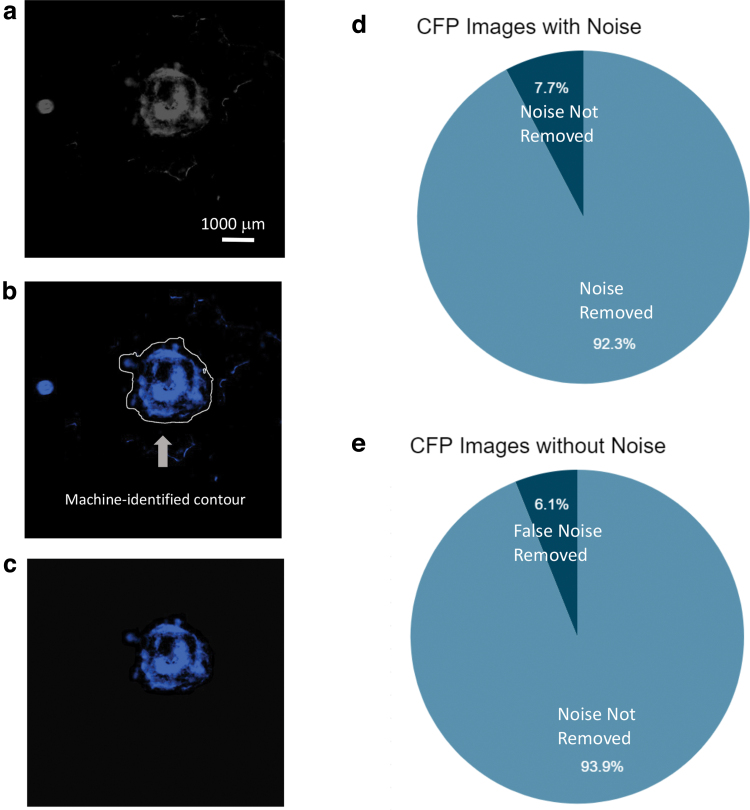
In our study, most organoid images, specifically those characterized by the CFP channel, contained errors that resulted from random objects floating in the culture medium such as air bubbles and small fibers. We ran these images through our noise removal function, which employed a machine-identified contour that recognized the hPSC-derived cardiac organoids and subsequently removed the unnecessary background noise, as shown in Figure 3a–c. More examples can be found in Supplementary Figure S3. On the CFP images that had noise, our algorithm removed that noise almost 92% of the time (Fig. 3d). On the CFP images that did not have noise, our algorithm did not detect any noise around 94% of the time (Fig. 3e).
FIG. 3.
The function of the noise removal feature. (a) The selected image converted to a grayscale image through thresholding. Scale bar: 1000 μm. (b) The image runs through a contour-detection algorithm to identify the edges of the organoid. (c) Every pixel outside the contour set to black (0, 0, 0). (d) Accuracy of the noise removal technique on CFP images with noise displayed. (e) Accuracy of the noise removal technique on CFP images without noise displayed. N = 46 images preprocessed. Color images are available online.
Area and intensity calculations
The area/intensity function calculated six different values (organoid area, total image area, percentage of the image covered by organoid, total intensity of organoid, total intensity of organoid-by-organoid area, and total intensity of organoid by total image area) for each image that ran through the algorithm. Each image was measured and compared between ImageJ and Organalysis. This application calculated the area/intensity values by employing the Otsu thresholding algorithm, which was also used as ImageJ package.
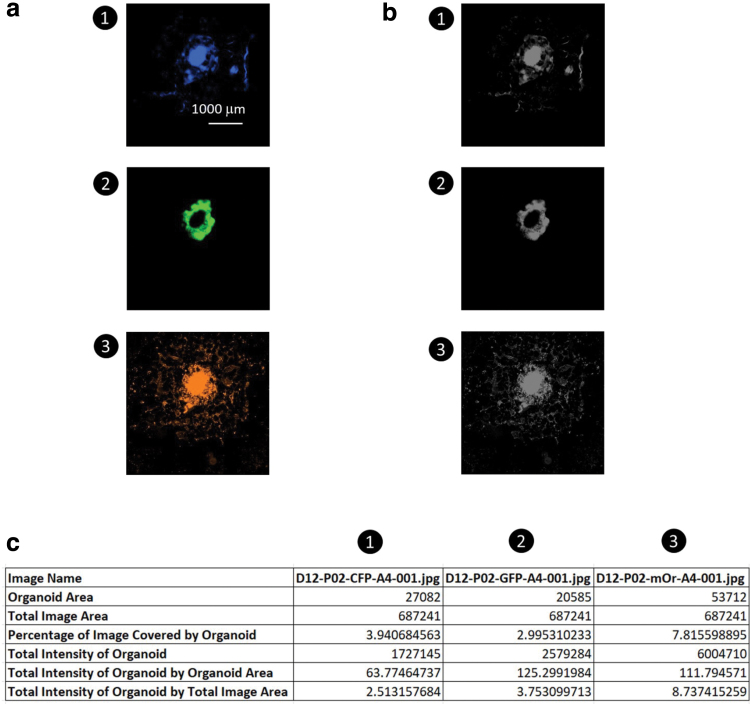
As shown in Figure 4a, we compared the images' “total intensity of organoid-by-organoid area” values by splitting the dataset into green, red, and blue channels. Each channel is processed through a grayscale filter (Fig. 4b) before being applied to the algorithm, which could summarize the data in a spreadsheet (Fig. 4c). Similarly, we measured more hPSC-derived cardiac organoids on days 9 and 13, and the results of the measurement are demonstrated in Supplementary Figure S4a. The percentage errors of the measurements of Organalysis (the ImageJ measurement was taken as the exact value) in the three channels are in the range of 0.03–1.3% (Supplementary Fig. S4b).
FIG. 4.
The function of the area and intensity measurement. (a, b) The function iterates through all images in the folder, thresholding the images to grayscale. The method takes measurements by going left-to-right and top-to-bottom, counting pixel-by-pixel. Scale bar: 1000 μm. (c) Function-performed calculations saved into a spreadsheet with information that can be used for comparison and analysis. Color images are available online.
Fractal analysis
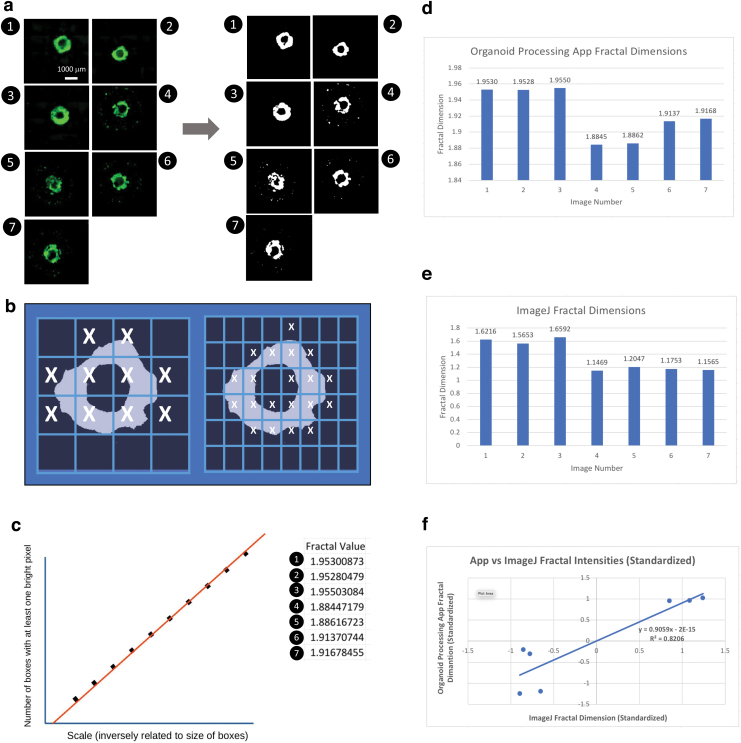
We followed the classical procedures of fractal analysis. First, the algorithm binarized the Red-Green-Blue images (Fig. 5a). Then, logarithmically distributed boxes were created on the image (Fig. 5b), and linear regression was performed on the boxes with at least one non-black pixel (Fig. 5c). Figure 5d shows the FD values of organoid images automatically measured by Organalysis, while Figure 5e shows the FDs of the same organoid images manually measured by the ImageJ plugin FracLac.
FIG. 5.
The function of fractal analysis of hPSC-derived cardiac organoids. (a) GFP images loaded from the folder and converted into binarized images. Scale bar: 1000 μm. (b) Transformed images split up into boxes with 10 logarithmically distributed box sizes. Each box is defined by the number of bright pixels it contains. (c) Linear regression identifying the slope between the number of boxes with at least one bright pixel and the scale of the boxes. Both variables transformed logarithmically. (d) Bar graph representing FD measured by Organalysis. (e) Bar graph representing FD measured by ImageJ plugin FracLac using the same set of images. (f) Correlation of FD measurements by Organalysis and ImageJ. FD, fractal dimension; hPSC, human pluripotent stem cell. Color images are available online.
A linear regression chart comparing ImageJ values to organoid application values was created and is shown in Figure 5f: the R2 value was equal to around 0.8206. This means that the values from ImageJ and Organalysis, respectively, were well correlated and followed a similar best-fit line. On the other hand, the individual fractal values output by ImageJ were slightly higher than those output by the organoid application. This discrepancy can be attributed to a difference in performing the methods to obtain values, that is, a minute variation in the logarithmic threshold, while converting to grayscale. Regardless, the efficiency of Organalysis offsets the contrast in fractal values.
Feature importance
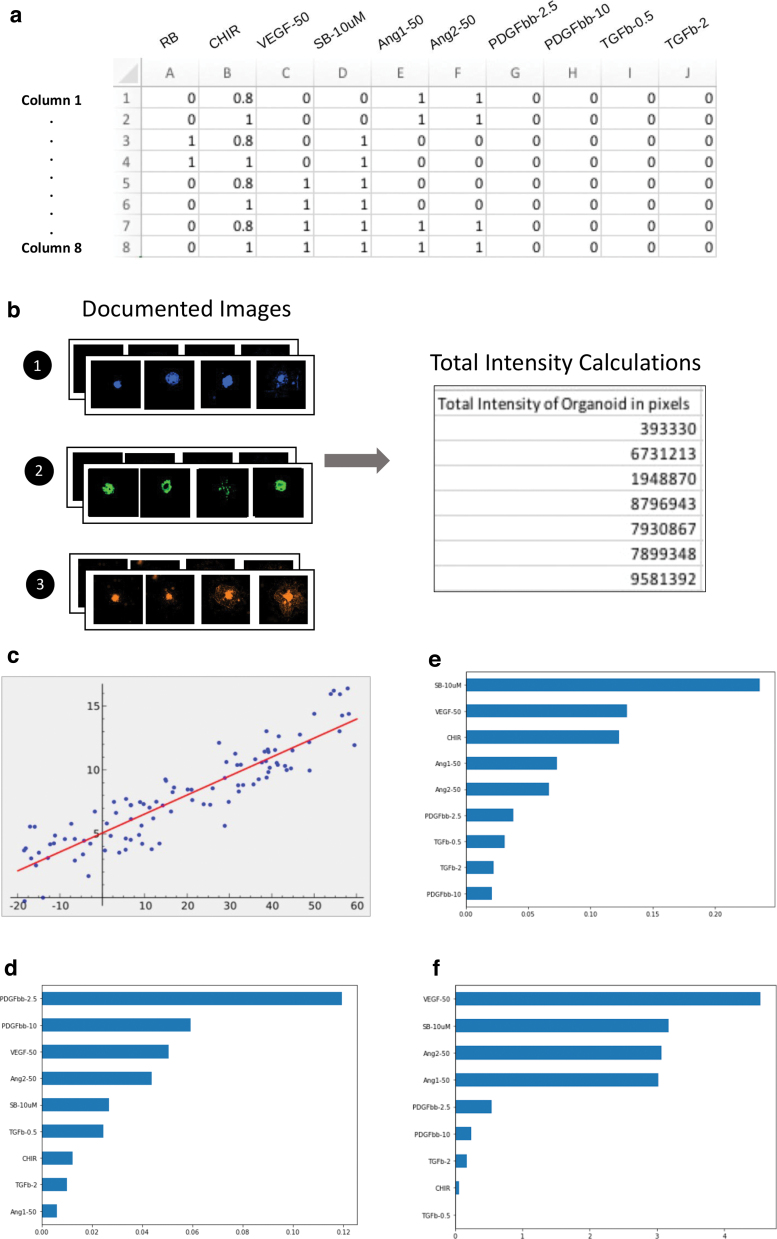
In the feature importance function, a feature spreadsheet was created (Fig. 6a) for various differentiation factors of hPSC-derived cardiac organoids from our recently published results.7 Those differentiation factors include both small molecules and growth factors for deriving the vascularized cardiac organoid from hPSCs. Based on the intensity values for each image in Figure 6b and the input spreadsheet, which contained the respective differentiation treatments and their combinations (1 for with and 0 for without), the Lasso-regularized linear regression (Fig. 6c) machine-learning algorithm was trained to output a chart based on its prediction of the differentiation outcomes.
FIG. 6.
The function of feature importance analysis. (a) The CSV spreadsheet describing the drug treatments as features applied in each column. (b) Images by calculating the intensity of organoid image at each channel (CFP, GPF, and mOr). (c) Lasso-regularized linear regression with each drug treatment as the feature and the intensity of the specimen as the target. (d–f) Feature importance in the bar charts of CFP, GFP, and mOr images with targeted features, respectively. Color images are available online.
Based on the outputted graphs for each color that represents different cell types, the feature importance function primarily identified PDGFbb-2.5 nM, PDGFbb-10 nM, VEGF-50 nM, Ang2–50 nM, and SB-10 mM as the top five determinators for the formation of CFP-TAGLN-SMC in the hPSC-derived cardiac organoids (Fig. 6d), while the SB-10 mM, VEGF-50 nM, CHIR, and Ang1&2–50 nM were more relevant to the GFP-TNNT2-CM differentiation (Fig. 6e). Similarly, these smooth muscle cell-relevant differentiation factors were shared mostly with the endothelial cell-relevant differentiation factors indicated by the mOr-VE-Cadherin reporter (Fig. 6f).
Discussion
In this article, we have developed a GUI-based multifunctional, consolidated, and simplified organoid image preprocessing and analysis software called “Organalysis.” This multifunctional application enables both preprocessing and analysis of fluorescent images from hPSC-derived cardiac organoids with multiple functions by iterating through all images in a folder at once, simplifying the user interface and reducing the number of clicks needed to process images. Currently, there is no automated software that comprises such functions, targeted at handling multiple organoid images at once. Although similar functions have been developed such as structural imaging, noise reduction, and adjustment thresholding,14–16 our novel software incorporates new algorithms with high efficacy into a consolidated environment, enabling its application to hPSC-derived cardiac organoids with ease and accuracy in the functions of brightness and contrast, noise removal, area and intensity measurement, fractal analysis, and feature importance.
Adjusting specific filters within an image allowed for overall enhancements. For example, a darker image with lower contrast would be hard to analyze because it had features that are inadequately represented. On the other hand, a brighter image with higher contrast would be much easier to examine because the features are intensified. Our technique allowed for multiple images to be iterated through at once. Because of the application's simplicity, processing the images through the filters can prove to be invaluable in saving time and creating better data from subsequent image analysis.17
When taking images under a microscope, artifacts such as bubbles in the well plate may induce inconsistency across the images.18 To address this issue, the noise removal tool proved significantly useful in increasing the accuracy of specific measurements. However, image-by-image noise removal is a time-consuming task. Therefore, automated noise removal can make this process much faster and easier. In this application, the automatic noise removal function enhances the quality of the image by employing a contour detection algorithm. This tool processes all the images in a folder at once and requires minimal clicks. This noise removal tool is highly effective in updating images for better results from other functions. Images preprocessed through this tool will be used in further machine-learning analysis and other automated techniques to obtain more accurate measurements of organoid images.19
The brightness and contrast-adjusted and noise-removed images were further measured by the fluorescence area and intensity to quantify different cell groups in the cardiac organoids. The area and intensity measurement tool in Organalysis processes all the images in one folder and finds the corresponding values based on pixel measurements. This tool is especially useful in characterizing the growth of organoids over a certain period. By analyzing the spreadsheet created by this function, it is easier to compare cardiac organoids side-by-side for optimizing organoid differentiation based on various conditions.
This spreadsheet can be further employed in numerous analysis methods concerning the development of cardiac organoids. By understanding the numerical significance of each value, it can become easier to identify the optimal factors for the formation of hPSC-derived cardiac organoids. The area and intensity measurement tool provides a solid and high-throughput method to iterate through all the images in a folder with minimalized clicks, higher accuracy, and greater efficiency.
Moreover, the complexity of hPSC-derived cardiac organoids can be analyzed by fractal analysis. For example, the network of cardiomyocytes in the hPSC-derived cardiac organoids can be analyzed by fractal analysis with FD to indicate the process of cardiac organoid differentiation and development. This complex cardiac structure of hPSC cardiomyocytes could be correlated to certain growth factors applied to the hPSC differentiation.20 Specifically, the FDs can be calculated at once based on the various scales of microscopic organoid images.21 More importantly, our platform shows a highly correlated trend of FD measured by the ImageJ Macro. The FD will increase with the increase of complexity of the structure inside an organoid. By combining these tools, differentiation factors affecting the development of complex organoid formation can be further explored.
To validate the Organalysis performance, we compared the data obtained from Organalysis to the data obtained from the same images from ImageJ. We found high consistency between Organalysis and ImageJ in the measurements of area, intensity, and FD from the same images. Thus, Organanlysis has an equivalent accuracy to ImageJ in organoid image analysis, but increases the efficiency and throughput.
Finally, the relationship between various differentiation factors and hPSC-derived cardiac organoid development was analyzed by the feature importance function, which revealed the features of a model that has the most impact on a target.22 In the application, the features were the differentiation factors applied to differentiate the hPSC-derived vascularized cardiac organoids with targeted cardiovascular cell types. The feature importance function ranked the differentiation factors for each cardiovascular cell type (cardiomyocytes, smooth muscle cells, and endothelial cells) in hPSC-derived vascularized cardiac organoids, which supports our differentiation protocol design and outcomes.7
If necessary, in other research applications, the well plate dimensions (set to six rows by eight columns of wells per plate by default) can be adjusted by modifying some variables in the code; due to the usage of 6 × 8 plates in the laboratory and the tedium of repeatedly entering information, it can be more efficient for users to have the defaults set to 6 × 8 in this feature importance function. Moreover, additional machine learning-relevant features will be included, such as accuracy validation and F1 score output, to further support organoid applications.
Conclusion
Collectively, Organalysis provides an interface for organoid researchers to process bulk image data more efficiently and intuitively. This application provides the preprocessing functions of brightness/contrast adjustment and noise removal, area/intensity computation, fractal analysis for organoid complexity, and feature importance for comparison and identification of major influences on organoid differentiation. The functions of our application are highly aligned with established ImageJ method, delivering accurate measurements with improved efficiency and throughput. Due to its flexibility, the application can work with many other variations of image type and resolution.
In summary, Organalysis scrutinizes developing cardiac organoid images for in-depth quantification results and graphical trend analysis. It also improves the quality of organoid images through processing filters in the application. These efficient methods prove invaluable to further applications of hPSC-derived organoids in disease modeling and regenerative medicine. Organalysis can be employed in image-based organoid research to rapidly amplify inconsistent data and determine essential mechanisms in the organoids.
Supplementary Material
Acknowledgment
Special thanks to Dr. Mark Albert for the valuable suggestions on the machine-learning portion of this project.
Authors' Contributions
H.Y.: Conceptualization (lead); J.P.S. and H.Y.: writing—original draft (lead); J.P.S. and A.K.: formal analysis (lead); Z.M. and A.K.: writing—review and editing (supporting); and R.K.B. and A.H.G.: data validation and analysis (supporting).
Source Code
For complete access, please reach out to (jathinsingaraju@my.unt.edu).
Disclosure Statement
No competing financial interests exist.
Funding Information
This work was supported by the NIH R15HD108720 (H.Y.), start-up from the University of North Texas (UNT) Biomedical Engineering (H.Y.), Research Seed Grants (2021 and 2023) from UNT Research and Innovation Office (H.Y.), NIH G-RISE T32GM136501 (A.H.G.), and UNT Undergraduate Research Scholarship (J.P.S. and A.K.).
Supplementary Material
References
- 1. Lewis-Israeli YR, Wasserman AH, Aguirre A. Heart organoids and engineered heart tissues: Novel tools for modeling human cardiac biology and disease. Biomolecules 2021;11(9):1277; doi: 10.3390/BIOM11091277 [DOI] [PMC free article] [PubMed] [Google Scholar]
- 2. Bian X, Li G, Wang C, et al. A deep learning model for detection and tracking in high-throughput images of organoid. Comput Biol Med 2021;134:104490; doi: 10.1016/J.COMPBIOMED.2021.104490 [DOI] [PubMed] [Google Scholar]
- 3. Lee S, Chang J, Kang SM, et al. High-throughput formation and image-based analysis of basal-in mammary organoids in 384-well plates. Sci Rep 2022 12:1 2022;12(1):1–9; doi: 10.1038/s41598-021-03739-1 [DOI] [PMC free article] [PubMed] [Google Scholar]
- 4. Kassis T, Hernandez-Gordillo V, Langer R, et al. OrgaQuant: Human intestinal organoid localization and quantification using deep convolutional neural networks. Sci Rep 2019;9(1):1–7; doi: 10.1038/s41598-019-48874-y [DOI] [PMC free article] [PubMed] [Google Scholar]
- 5. Anonymous. Fractals and Complexity. n.d. Available from: https://imagej.nih.gov/ij/plugins/fraclac/FLHelp/Fractals.htm [Last accessed: June 4, 2023].
- 6. Anonymous. ImageJ User Guide - IJ 1.46r | User Interface. n.d. Available from: https://imagej.nih.gov/ij/docs/guide/146-Part-IV.html [Last accessed: June 4, 2023].
- 7. Abilez OJ, Yang H, Tian L, et al. Micropatterned organoids enable modeling of the earliest stages of human cardiac vascularization. bioRxiv 2022; doi: 10.1101/2022.07.08.499233 [DOI] [Google Scholar]
- 8. Anonymous. Tkinter—Python Interface to Tcl/Tk—Python 3.11.3 Documentation. n.d. Available from: https://docs.python.org/3/library/tkinter.html [Last accessed: June 4, 2023].
- 9. Anonymous. OpenCV: Operations on Arrays. n.d. Available from: https://docs.opencv.org/3.4/d2/de8/group__core__array.html [Last accessed: June 4, 2023].
- 10. Xie G, Lu W. Image edge detection based on opencv. Int J Electron Electric Eng 2013;1:104–106; doi: 10.12720/ijeee.1.2.104-106 [DOI] [Google Scholar]
- 11. Anonymous. OpenCV: Image Thresholding. n.d. Available from: https://docs.opencv.org/4.x/d7/d4d/tutorial_py_thresholding.html [Last accessed: June 4, 2023].
- 12. Rougier N. Fractal Dimension Computing. n.d. Available from: https://gist.github.com/rougier/e5eafc276a4e54f516ed5559df4242c0 [Last accessed: June 5, 2023].
- 13. Altmann A, Toloşi L, Sander O, et al. Permutation importance: A corrected feature importance measure. Bioinformatics 2010;26(10):1340–1347; doi: 10.1093/BIOINFORMATICS/BTQ134 [DOI] [PubMed] [Google Scholar]
- 14. Dobrucki LW, Sinusas AJ. Imaging of angiogenesis. In: Cardiac PET and PET/CT Imaging. 2007; pp. 394–411; doi: 10.1007/978-0-387-38295-1_26/COVER [DOI] [Google Scholar]
- 15. Hambal AM, Pei Z, Libent Ishabailu F. Image noise reduction and filtering techniques. Int J Sci Res 2017;6(3):2033–2038; doi: 10.21275/25031706 [DOI] [Google Scholar]
- 16. Mehta N, Liu K, Alibhai AY, et al. Impact of binarization thresholding and brightness/contrast adjustment methodology on optical coherence tomography angiography image quantification. Am J Ophthalmol 2019;205:54–65; doi: 10.1016/J.AJO.2019.03.008 [DOI] [PubMed] [Google Scholar]
- 17. Boßelmann S. Simplicity in application development for business Model Design. Lecture Notes in Business Information Processing 2013;150:225–226; doi: 10.1007/978-3-642-39336-5_24/COVER [DOI] [Google Scholar]
- 18. Fei K, Zhang J, Yuan J, et al. Present application and perspectives of organoid imaging technology. Bioengineering 2022;9(3):121; doi: 10.3390/BIOENGINEERING9030121 [DOI] [PMC free article] [PubMed] [Google Scholar]
- 19. Fan X, Dai M, Liu C, et al. Effect of image noise on the classification of skin lesions using deep convolutional neural networks. Tsinghua Sci Technol 2020;25(3):425–434. [Google Scholar]
- 20. Pang JKS, Chia S, Zhang J, et al. Characterizing arrhythmia using machine learning analysis of Ca2+ cycling in human cardiomyocytes. Stem Cell Rep 2022;17(8):1810–1823; doi: 10.1016/J.STEMCR.2022.06.005 [DOI] [PMC free article] [PubMed] [Google Scholar]
- 21. Mandelbrot B. The Fractal Geometry of Nature. W.H. Freeman and Company: San Francisco, USA; 1982. [Google Scholar]
- 22. Zien A, Krämer N, Sonnenburg S, et al. The feature importance ranking measure. Proceedings of the European Conference on Machine Learning and Principles and Practice of Knowledge Discovery in Databases 2009;694–709. [Google Scholar]
Associated Data
This section collects any data citations, data availability statements, or supplementary materials included in this article.


