Figure 4.
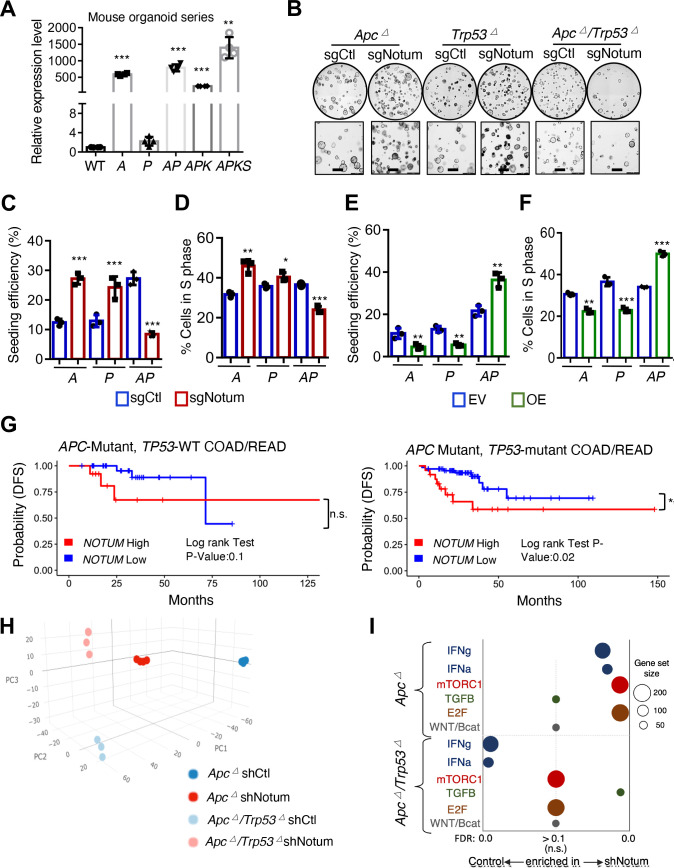
APC and P53 loss synergise to convert NOTUM from a tumour suppressor to an oncoprotein. (A) Relative Notum transcript levels in WT mouse colon organoids, and mouse tumouroids harbouring Apc loss of function (A), Trp53 loss of function (P), both (AP), AP with KrasG12D mutation (APK) and APK with Smad4 loss of function (APKS) (n=3 technical replicates). (B) Brightfield image of A, P and AP mouse tumouroids infected with control sgRNA (sgCtl) or Notum sgRNA (sgNotum) (n=3). Scale bar: 100 µm. (C) Clonal seeding efficiency of A, P and AP cells from (B). (D) S-phase progression (EdU+) assays in A, P and AP tumouroids from (b) (n=3 technical replicates with one representative of three independent experiments shown). (E) Clonal seeding efficiency of A, P and AP cells infected with NOTUM overexpressing lentivirus (OE) or empty vector control (EV) (n=3 technical replicates). (F) S-phase progression (EdU+) assays in A, P and AP tumouroids as in (E). (G) Analysis of disease-free survival (DFS) in human colon and rectal adenocarcinoma patients (COAD, READ) for which gene expression data is available in the Cancer Genome Atlas (TCGA). Left panel shows DFS for APC mutant, TP53 wild-type patients (n=46), binned on highest and lowest quartile of NOTUM expression (Q1 vs Q4). Right panel shows DFS for APC/TP53 double mutant COAD/READ patients (n=93), binned on highest and lowest quartile of NOTUM expression (Q1 vs Q4). (H) Principal component analysis (PCA) of transcriptome profiles from Apc mutant or Apc/Trp53 mutant mouse cultures with or without shRNA-mediated knockdown of Notum (n=4 biological replicates). (I). Gene set enrichment analysis of transcriptome profiles from (H). For all panels: *p<0.05, **p<0.01, ***p<0.001, Student’s t-test. See online supplemental figure 8,9 for validation of driver mutations, shRNA/sgRNA knockdown and overexpression.

