On July 16, 2022 “988” will become the new toll-free dialing code for the National Suicide Prevention Lifeline (the major crisis telephone hotline in the U.S.).1 Lifeline calls are initially routed to crisis centers within the caller’s state. If the call cannot be answered in a reasonable amount of time, it is re-routed to an out-of-state crisis center. Having calls answered in-state is considered a best practice because crisis center staff can more effectively connect callers to local resources. The “in-state answer rate”—defined as the percentage of Lifeline calls originating from a state that are answered in that state—is a Lifeline quality metric, with 90% as the benchmark goal. This Datapoint characterizes variation across states’ in-state answer rates and assesses associations with rates of Lifeline call volume and geographic region.
Methods
State-level 2020 data on in-state answer rates and number of Lifeline calls—excluding calls to the Veteran (state mean= 25.0% of calls) and Spanish language (state mean= 1.4% of calls) Lifelines because callers from these populations are routed to separate Lifelines—were obtained from publicly available Lifeline reports.2 Using data from the U.S. Census Bureau3 and Veterans Administration,4 we estimated the number of non-Veteran residents within each state in 2020. We used these data to calculate a rate of Lifeline calls per 1,000 non-Veteran state residents. This served as a population size-adjusted measure of demand for Lifeline services.
Results
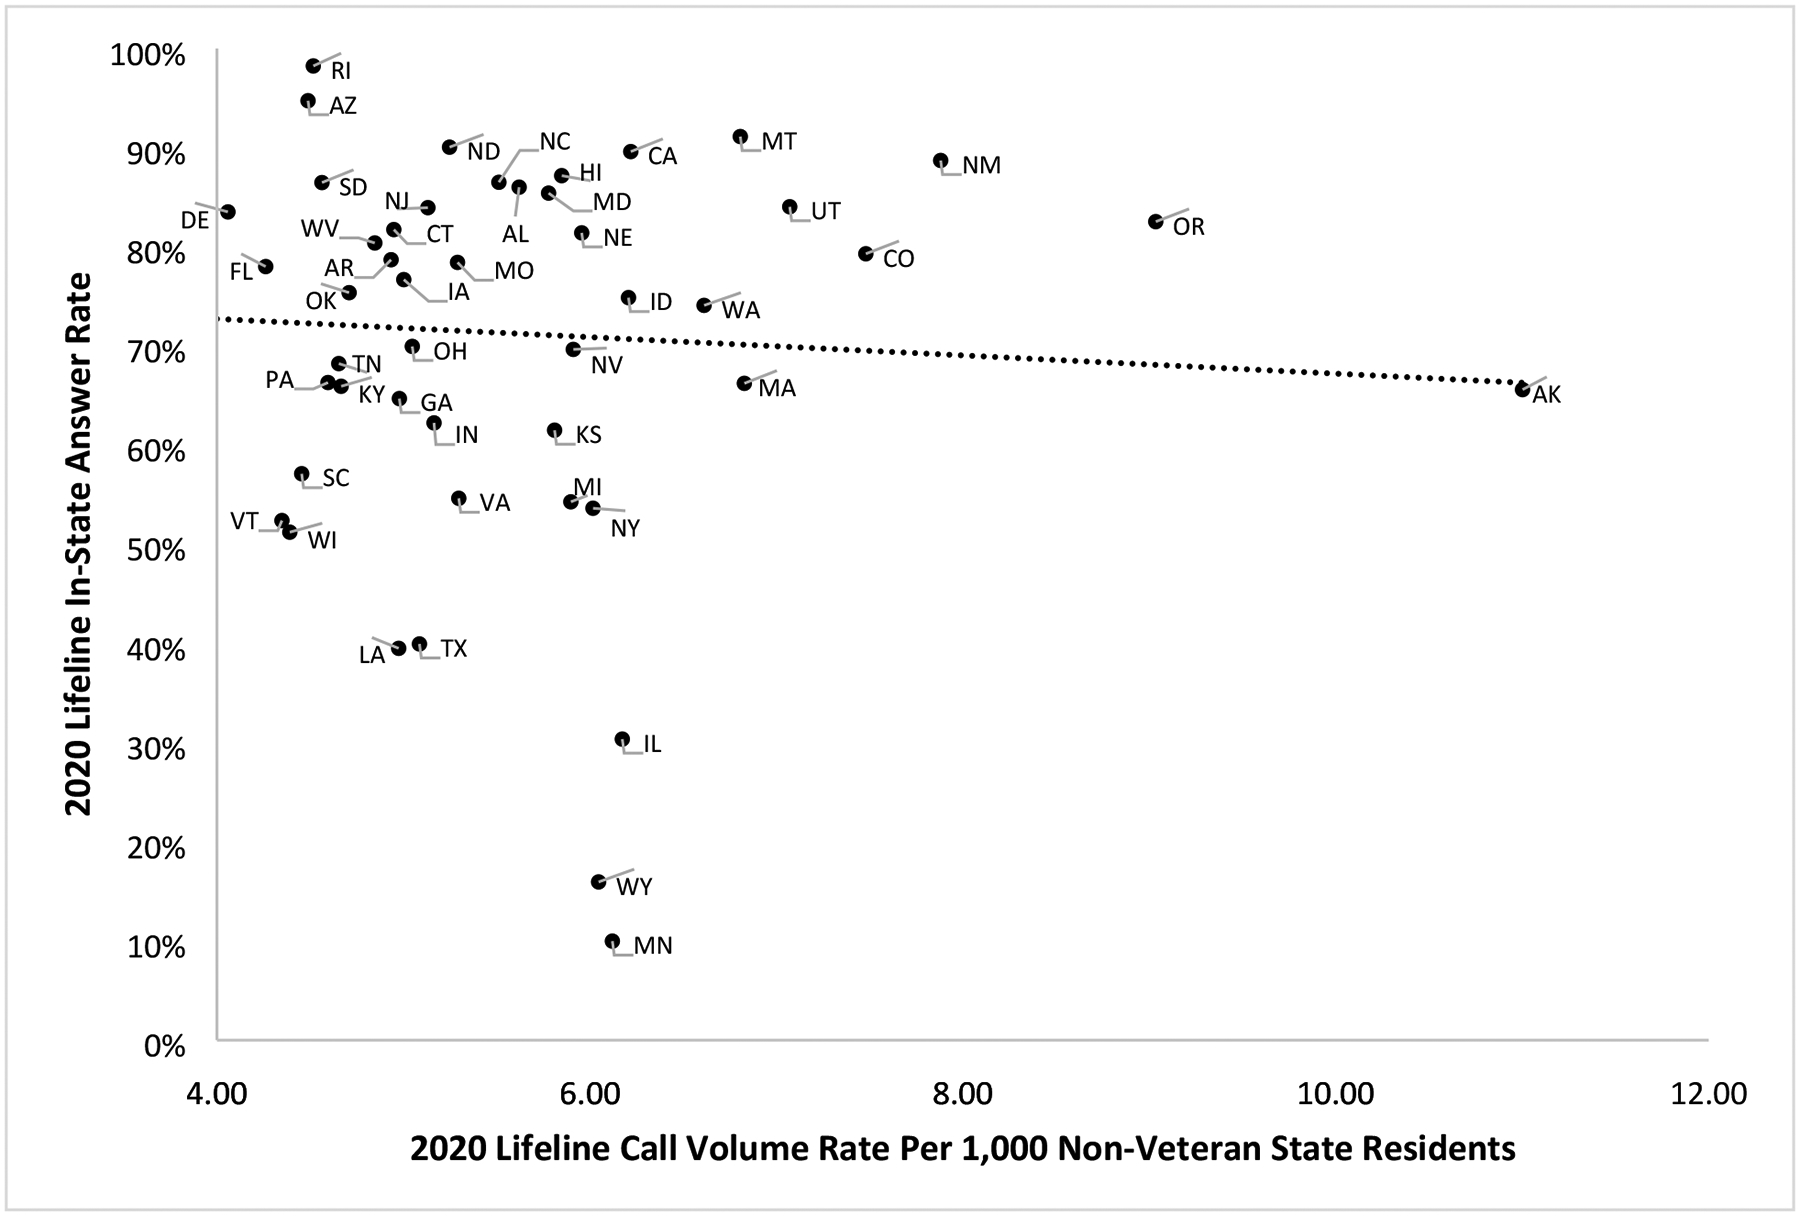
The mean in-state answer rate was 71.3% (SD= 19.5%) and the range was 10.0% (Minnesota) to 98.2% (Rhode Island). Only seven states were at or above 90.0%. Mean in-state answer rates by U.S. Census Region were: Northeast= 76.1%, West= 76.7%, South= 70.6%, Midwest= 62.7% (F= 1.32, p= .28). The mean Lifeline call volume rate per 1,000 non-Veteran state residents was 5.54 (SD= 1.33) and the range was 3.75 (Maine) to 11.00 (Alaska). There was no correlation between a state’s in-state answer rate and its Lifeline call volume rate (Spearman correlation= −.11, p= .44; Pearson correlation= .06, p= .66) (Figure 1).
Figure 1.

National Suicide Prevention Lifeline In-State Answer Rates and Call Volume Rates for U.S. States, 2020
Discussion
There is substantial variation in Lifeline in-state answer rates across states. The absence of a positive correlation between in-state answer rates and call volume rates suggests that low in-state answer rates are not the result of high demand for Lifeline services. Understanding how to improve in-state answer rates is important because Lifeline call volume is projected to potentially triple following the launch of 988.5
Contributor Information
Jonathan Purtle, Department of Public Health Policy & Management, Global Center for Implementation Science, New York University School of Global Public Health.
Michael A. Lindsey, McSilver Institute for Poverty Policy and Research, New York University
Ramesh Raghavan, New York University Silver School of Social Work
Elizabeth A. Stuart, Johns Hopkins Bloomberg School of Public Health
References
- 1.Hogan MF, Goldman ML. New opportunities to improve mental health crisis systems. Psychiatric Services. 2021;72(2):169–173. [DOI] [PubMed] [Google Scholar]
- 2.National Suicide Prevention Lifeline. Lifeline State Reports. Accessed January 8, 2022 from: https://suicidepreventionlifeline.org/lifeline-state-reports/.
- 3.U.S. Census Bureau. State Population Totals: 2010–2020. Accessed January 8, 2022 from: https://www.census.gov/programs-surveys/popest/technicaldocumentation/research/evaluation-estimates/2020-evaluation-estimates/2010s-statetotal.html.
- 4.U.S. Department of Veterans Affairs. National Center for Veterans Analysis and Statistics. Accessed January 8, 2022 from: https://www.va.gov/vetdata/veteran_population.asp.
- 5.Substance Abuse and Mental Health Services Administration. 2021. 988 APPROPRIATIONS REPORT. Available at: https://www.samhsa.gov/sites/default/files/988-appropriations-report.pdf.


