

Abstract
Background:
Several hypotheses may explain the association between substance use, posttraumatic stress disorder (PTSD), and depression. However, few studies have utilized a large multisite dataset to understand this complex relationship. Our study assessed the relationship between alcohol and cannabis use trajectories and PTSD and depression symptoms across three months in recently trauma-exposed civilians.
Methods:
1618 (1037 female) participants provided self-report data on past 30-day alcohol and cannabis use and PTSD and depression symptoms during their emergency department (baseline) visit. We reassessed participant’s substance use and clinical symptoms 2, 8, and 12 weeks posttrauma. Latent class mixture modeling determined alcohol and cannabis use trajectories in the sample. Changes in PTSD and depression symptoms were assessed across alcohol and cannabis use trajectories via a mixed-model repeated-measures analysis of variance.
Results:
Three trajectory classes (low, high, increasing use) provided the best model fit for alcohol and cannabis use. The low alcohol use class exhibited lower PTSD symptoms at baseline than the high use class; the low cannabis use class exhibited lower PTSD and depression symptoms at baseline than the high and increasing use classes; these symptoms greatly increased at week 8 and declined at week 12. Participants who already use alcohol and cannabis exhibited greater PTSD and depression symptoms at baseline that increased at week 8 with a decrease in symptoms at week 12.
Conclusions:
Our findings suggest that alcohol and cannabis use trajectories are associated with the intensity of posttrauma psychopathology. These findings could potentially inform the timing of therapeutic strategies.
1. Introduction
Alcohol, drugs, and tobacco are frequently used to cope with posttraumatic sequelae. Indeed, the prevalence of substance use disorders (SUD) among those with posttraumatic stress disorder (PTSD) is high; national estimates indicate that ~46% of people with PTSD are addicted to substances (Pietrzak, Goldstein, Southwick, & Grant, 2011). Likewise, up to ~20% of individuals who have suffered from major depression in their lifetime have had an alcohol or SUD (Quello, Brady, & Sonne, 2005). Co-occurring SUD and PTSD predict adverse outcomes, including suicide and unemployment (Allan et al., 2019; Blanco et al., 2013). Substances may be used to ameliorate symptom presence and severity--to avoid painful memories, fall asleep, reduce anxiety, elevate mood and enhance pleasure in activities.
Several hypotheses attempt to explain the significance of the relationship between PTSD and SUD. The hypothesis with the most empirical evidence is the self-medication hypothesis (Khantzian, 1997). According to this hypothesis, substance use temporarily relieves posttrauma symptoms (Chilcoat & Breslau, 1998). However, this temporary relief reinforces the use of substances, leading to maladaptive use and, ultimately, symptom exacerbation (Stewart, Pihl, Conrod, & Dongier, 1998). Epidemiological studies support this hypothesis in that PTSD and depression develop first, with subsequent onset of SUD (Abraham & Fava, 1999; Chilcoat & Breslau, 1998; Kessler, Sonnega, Bromet, Hughes, & Nelson, 1995; Ouimette, Read, Wade, & Tirone, 2010; Wojciechowski, 2019). Nevertheless, some studies have also found the opposite sequence of disorder onset (Croughan, Miller, Wagelin, & Whitman, 1982; Mirin, Weiss, Griffin, & Michael, 1991; Rounsaville, Weissman, Crits-Christoph, Wilber, & Kleber, 1982; Testa, Livingston, & Hoffman, 2007), suggesting a bidirectional relationship. Other hypotheses include the mutual maintenance hypothesis, which suggests that PTSD symptoms lead to substance use, and this use then exacerbates PTSD symptoms (Kaysen et al., 2014; Possemato et al., 2015). Lastly, the shared susceptibility hypothesis suggests there are shared factors that contribute to the development of co-occurring PTSD and SUD. Such factors include, but are not limited to, emotion regulation deficits, genetic risk, and behavioral under control (Chilcoat & Breslau, 1998). While correlational studies have shed light on the complex relationship between PTSD, depression, and SUD, longitudinal studies allow for stronger inference about the causal pathway between these comorbid disorders.
Only a few longitudinal studies have explored the temporal onset of the development of posttraumatic sequelae and substance use. PTSD symptoms predicted greater substance use in trauma-exposed adolescents even after controlling for factors such as pre-trauma family environment, substance use, and demographic variables (Haller & Chassin, 2014). New exposures to interpersonal violence were associated with subsequent increases in alcohol and substance use in other longitudinal studies (Berenz et al., 2016; D. Kaysen, Neighbors, Martell, Fossos, & Larimer, 2006; Kilpatrick, Acierno, Resnick, Saunders, & Best, 1997; Kline et al., 2014). Further, PTSD symptoms and coping motives to use alcohol predicted worse alcohol-related consequences in college students (Read, Griffin, Wardell, & Ouimette, 2014). In a sample of recently trauma-exposed adults recruited from the emergency department (ED), increases in anhedonic symptoms of PTSD corresponded with increases in substance use over a six-month period (Fani et al., 2020).
Ecological momentary assessment (EMA) has also been used to measure momentary change and individual level differences that contribute to the relationship between PTSD and substance use. A recent review of EMA studies examining PTSD and alcohol use in particular highlighted that collectively, studies showed support for the self-medication hypothesis (Lane, Waters, & Black, 2019). While EMA methods provide greater granular data on daily fluctuations in psychological symptoms and substance use, there are some limitations to this method including attrition and compliance rates. Nonetheless, these studies suggest posttraumatic sequelae lead to increased substance use. However, no large-scale prospective study has measured how posttraumatic sequelae may differ based on substance use trajectories. In the context of the multisite, longitudinal AURORA (Advancing Understanding of RecOvery afteR traumA) study (McLean et al., 2020), we assessed putative relationships between trajectories of alcohol and cannabis use and PTSD and depression symptoms over time among emergency department (ED) patients who had experienced trauma. Alcohol and cannabis use were examined as they are among the most abused substances in trauma-exposed populations (Bhalla, Stefanovics, & Rosenheck, 2017). Given the previous longitudinal data, we hypothesized that escalating alcohol/cannabis use over time, compared to stable or no/minimal alcohol/cannabis use, would be associated with increased PTSD and depression symptoms. We retrospectively examined PTSD and depression symptom changes 30 days leading up to the trauma and subsequent ED admittance to 3 months after trauma. This period has been frequently highlighted as a time frame during which PTSD symptom resolution or escalation occurs (Blanchard et al., 1995; Pérez Benítez et al., 2013; Schock, Böttche, Rosner, Wenk-Ansohn, & Knaevelsrud, 2016; Warren et al., 2014).
2. Materials and Methods
2.1. Participants
A total of 581 men and 1037 women with a mean age of 35.4 years (SD=13) were recruited as part of a multisite study of PTSD conducted in the EDs of Level 1 trauma centers (MH094757), as described prior (Harnett et al., 2021; Kessler et al., 2021; McLean et al., 2020; Steuber et al., 2021). Eligible patients were approached in the ED after initial medical evaluation, laboratory testing, and medical clearance. Once informed consent was obtained, trained research assistants collected demographic information and administered assessments on prior trauma, substance abuse, current and past PTSD and depression symptoms, and details concerning the presenting trauma. Patients were queried about past and current medical conditions and medications. Participants who had experienced a DSM-5 criterion A trauma in the past 24 hours were eligible for the study but were excluded if they were currently suicidal or had attempted suicide in the last three months, were currently intoxicated, or lost consciousness due to the trauma. PTSD and depression symptoms have been examined previously within this sample, see (Cakmak et al., 2021; Joormann et al., 2022; Lebois et al., 2022; Ziobrowski et al., 2021).
2.2. Clinical Assessments
The investigation described in this manuscript used assessments to measure alcohol and cannabis use and PTSD and depression symptoms across four timepoints, baseline, weeks 2, 8, & 12. During the baseline timepoint, participants responded to assessments during their ED visit in reference to the 30 days leading up to the traumatic event. Each subsequent timepoint referenced the past 30 days (or 14 days for week 2). During the ED visit, demographic information including, biological sex, age, education, marital status, race/ethnicity were gathered. During the follow-up week 2 visit, demographic information including, BMI, employment status, and income were gathered.
The PTSD Checklist for DSM-5 (PCL-5).
The PCL-5 (Blevins, Weathers, Davis, Witte, & Domino, 2015; Weathers, 2013) is a 20-item measure that prompts participants to report the frequency of PTSD symptoms over the respective reference periods. Using a Likert scale ranging from 0 (“not at all”) to 4 (“extremely”), participants rate the degree a specific symptom disrupts their activities. A severity score is calculated as the total across all 20 items, and a score of 31-33 suggests possible PTSD. For the statistical analyses in this study, we reported the overall PCL-5 score. The PCL-5 has been shown to have strong reliability and validity (Blevins et al., 2015). Cronbach’s alpha values for the PCL-5 at each time point were as follows: ED, .94; Week 2, .95, Week 8, .96, and Month 3, .97.
The Patient-Reported Outcomes Measurement Information System (PROMIS).
For this investigation, we used the PROMIS Depression measure only. The PROMIS Depression item bank (Amtmann et al., 2014; Cella et al., 2007; Pilkonis et al., 2011) is a National Institutes of Health (NIH) measure that assesses self-reported negative mood, views of self, social cognition, and decreased positive affect and engagement. Participants’ responses are added to create a raw score and converted to a T-score. The T-score is a standardized score with a mean of 50 and a standard deviation of 10. The higher the T-score, the more severe the depression symptoms. The PROMIS has demonstrated reliability, precision, and construct validity (Cella et al., 2007).
PhenX Toolkit.
Alcohol and cannabis use were assessed using the PhenX Toolkit Alcohol and PhenX Toolkit Substance Use, respectively (Hamilton et al., 2011). For this investigation, we used the frequency of use as our variable of interest for alcohol and cannabis as we did not have a measure for quantity for both alcohol and cannabis use. To assess alcohol use, we asked, “During the ‘reference period,’ how many days did you have at least one drink of any kind of alcohol, not including small tastes or sips?” Our variable of interest was the sum of days the participant consumed alcohol. To assess cannabis use, we similarly asked, “During the ‘reference period,’ how many days did you use marijuana?” Our variable of interest was the sum of days the participant used cannabis.
The Childhood Trauma Questionnaire - Short Form (CTQ-SF).
The CTQ-SF (Bernstein et al., 2003) is a 28-item scale used to examine exposure to traumatic experiences during childhood. Five types of childhood maltreatment types were measured: emotional abuse, physical abuse, sexual abuse, emotional neglect, and physical neglect. A score for each of the five types of maltreatment is calculated by adding each item within the subtype to create a maltreatment subtype score, for a range of 0-12. A total summed score was calculated and used in secondary analyses. Cronbach’s alpha for CTQ-SF was .78.
2.3. Statistical Analyses
Latent class linear mixed model (LCMM) fitted by the maximum likelihood method was used to partition our sample into subgroups based on alcohol or cannabis use. To conduct these analyses, we used the HLME (heterogeneous linear mixed model) function in the LCMM package in R (v3.6.1), identifying clusters of people with common use patterns. In choosing the appropriate LCMM model fit, we referenced the Bayesian information criteria (BIC) values and percent class membership. Low BIC values and percentages of no less than 5% in class membership were considered the best fit for the data (Nagin & Odgers, 2010) (Tables S1 & S2). Given that the week 2 timepoint assessed alcohol and cannabis use within the past 14 days, for these LCMM analyses only, we divided baseline, week 8, and week 12 timepoints by 2 to achieve a more even distribution of the data. Latent class models included measurements at all four timepoints (baseline, weeks 2, 8, & 12). LCMM analyses revealed that the most optimal model for trajectory classes was a 3-class alcohol use model with n=1617 and a 3-class cannabis model with n=1617. Participants reporting alcohol use were categorized into three groups, a consistently low use (n=1239, 76.6%) group, a consistently high use (n=117, 7.2%) group, and a increasing use group that demonstrated increased use from week 2 to week 8, and decreased use from week 8 to week 12 (n=261, 16.1%).. Participants reporting cannabis use were categorized into groups of consistently low use (n=1246, 77.1%), consistently high use (n=262, 16.2%), and increasing use (n=109, 6.7%). Figures 1A & 1B present the graphs of individual and mean trajectories of alcohol and cannabis use models, while Figures 1C & 1D provide visuals of only the mean trajectories.
Figure 1.
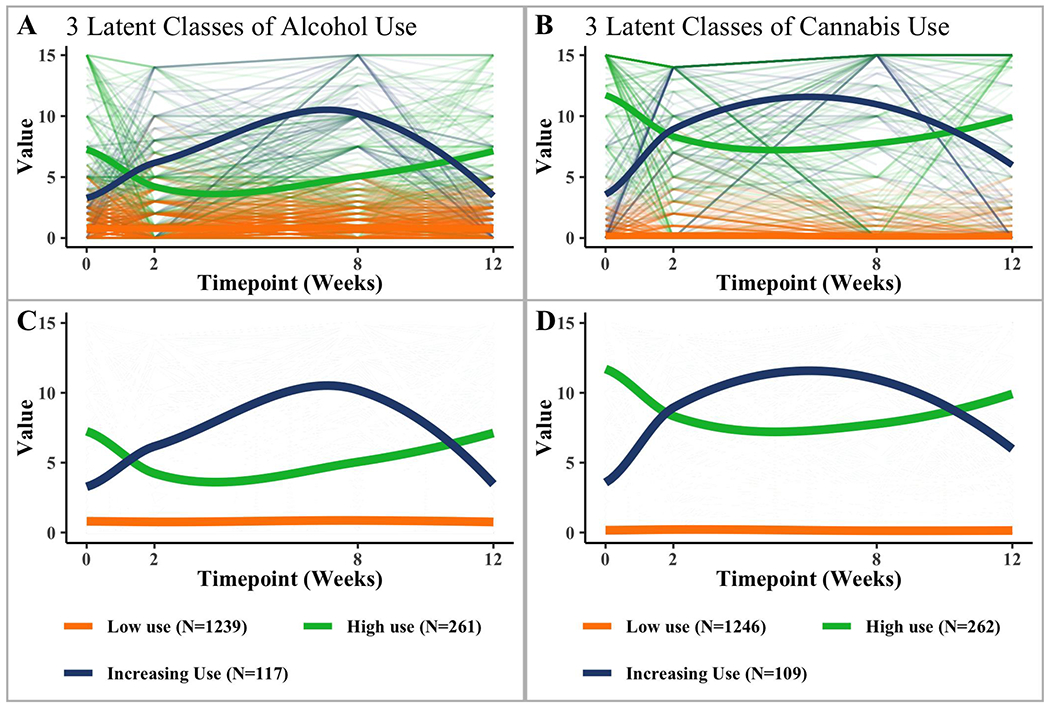
Observed individual (A, B) and mean (C, D) latent trajectories for both alcohol and cannabis use. Individual trajectories determined by measurements at 4 timepoints are represented by the thin lines, while the thick lines are the average trajectories for each designated group. Each class was identified through the chosen latent growth mixture model, based on Bayesian Information Criterion (BIC) values and class membership percentages.
For both alcohol and cannabis use, we used a 3 (Time: baseline, week 8, and 12) by 3 (Trajectory Class) mixed-model repeated-measures analysis of variance (ANOVA) to test the effect of trajectory group on PTSD and depression symptom change over time. Where significant time by trajectory class interactions emerged, we conducted post-hoc analyses (univariate ANOVAs) to explicate these interactions. For these ANOVAs, because we were more interested in examining chronic change in PTSD and depression symptoms than short-term (2 week) reactivity, we examined changes in symptoms collected at baseline, week 8, and 12. Mauchly’s test was used to determine whether the assumption of sphericity was violated. If violated, degrees of freedom were corrected using either Greenhouse-Geiser (ε<0.75) or Huynh-Feldt (ε>0.75) estimates of sphericity. Pairwise deletion was used for missing data.
3. Results
3.1. Participant Characteristics
Sample demographic and clinical characteristics, stratified by alcohol and cannabis use class memberships, are presented in Tables 1 & 2. Given the significant differences found between trajectory classes on demographic and clinical variables, separate follow up sensitivity analyses including biological sex as a between-subjects factor, and age, education, CTQ-SF, BMI, marital status, and race/ethnicity as covariates were conducted and presented in the results section of the supplemental material. Participants reported the following traumatic events that brought them to the ED: motor vehicle collision (1135 [70.1%]), physical assault (140 [8.7%]), sexual assault (14[.9%]), fall>=10 feet (18 [1.1%]), fall<10 feet or from unknown height (51 [3.2%]), incident causing traumatic stress exposure to many people (e.g., plane crash, natural disaster; 3 [.2%]), non-motorized collision (20 [1.2%]), burns (7, [.4%]), animal-related (29 [1.8%]), other (54 [3.3%]), missing (147 [9.1%]).
Table 1.
Demographics and Clinical Characteristics for Alcohol Use Trajectory Classes
| Low Use | High Use | Increasing Use | |||||
|---|---|---|---|---|---|---|---|
|
|
|||||||
| Measure | Mean | SD | Mean | SD | Mean | SD | P-value |
| Age (years) | 35.58 | 13.26 | 35.13 | 12.52 | 33.94 | 11.72 | .40a |
| Education (years) | 14.87 | 2.46 | 15.09 | 2.57 | 14.50 | 2.77 | .10b |
| CTQ-SF Total | 9.48 | 9.86 | 10.12 | 9.59 | 11.66 | 11.30 | .10c |
| BMI | 30.78 | 9.02 | 28.66 | 7.87 | 30.11 | 7.57 | .01d |
| Count | % | Count | % | Count | % | ||
|
| |||||||
| Gender | <.001e | ||||||
| Male | 402 | 32.4 | 127 | 48.7 | 52 | 44.4 | |
| Female | 837 | 67.6 | 134 | 51.3 | 65 | 55.6 | |
| Marital Status | .31f | ||||||
| Married | 260 | 21.1 | 49 | 18.9 | 20 | 17.1 | |
| Separated | 52 | 4.2 | 5 | 1.9 | 2 | 1.7 | |
| Divorced | 146 | 11.9 | 21 | 9.3 | 14 | 12.0 | |
| Annulled | 1 | 0.1 | 1 | 0.4 | 0 | 0 | |
| Widowed | 24 | 2.0 | 5 | 1.9 | 1 | 0.9 | |
| Never been married | 747 | 60.7 | 175 | 67.6 | 80 | 68.4 | |
| Race/Ethnicity | .07g | ||||||
| Hispanic | 157 | 12.7 | 26 | 10.0 | 10 | 8.5 | |
| Non-Hispanic White | 383 | 31.1 | 96 | 36.9 | 34 | 29.1 | |
| Non-Hispanic Black | 642 | 52.1 | 132 | 50.8 | 72 | 61.5 | |
| Non-Hispanic Other | 51 | 4.1 | 6 | 2.3 | 1 | 0.9 | |
| Employment Code | .88h | ||||||
| Employed | 809 | 74.0 | 179 | 76.2 | 76 | 72.4 | |
| Retired | 26 | 2.4 | 8 | 3.4 | 3 | 2.9 | |
| Homemaker | 22 | 2.0 | 3 | 1.3 | 2 | 1.9 | |
| Student | 44 | 4.0 | 12 | 5.1 | 4 | 3.8 | |
| Unemployed, disabled, or other | 192 | 17.6 | 33 | 14.0 | 20 | 19.0 | |
| Income Code | .39i | ||||||
| ≤ $19,000 | 378 | 35.0 | 84 | 36.1 | 38 | 36.2 | |
| $19,001 - $35,000 | 342 | 31.6 | 67 | 28.8 | 29 | 27.6 | |
| $35,001 - $50,000 | 148 | 13.7 | 31 | 13.3 | 17 | 16.2 | |
| $50,001 - $75,000 | 91 | 8.4 | 16 | 6.9 | 7 | 6.7 | |
| $75,001 - $100,000 | 57 | 5.3 | 16 | 6.9 | 11 | 10.5 | |
| > $100,000 | 65 | 6.0 | 19 | 8.2 | 3 | 2.9 | |
Note. Missing data was removed pairwise.
df = (2, 1614)
df = (2, 1608)
df = (2, 1249)
df = (2, 1171)
df = (2, 1617)
df = (2, 1606)
df = (2, 1610)
df = (2, 1433)
df = (2, 1419)
Table 2.
Demographics and Clinical Characteristics for Cannabis Use Trajectory Classes
| Low Use | High Use | Increasing Use | |||||
|---|---|---|---|---|---|---|---|
|
|
|||||||
| Measure | Mean | SD | Mean | SD | Mean | SD | P-value |
| Age (years) | 36.77 | 13.43 | 30.60 | 10.38 | 31.12 | 10.22 | < .001a |
| Education (years) | 15.11 | 2.53 | 14.08 | 2.23 | 14.17 | 2.32 | < .001b |
| CTQ-SF Total | 9.25 | 9.73 | 11.42 | 10.34 | 11.74 | 10.93 | .004c |
| BMI | 31.01 | 8.81 | 28.54 | 8.34 | 27.78 | 8.08 | < .001d |
| Count | % | Count | % | Count | % | ||
|
| |||||||
| Gender | < .001e | ||||||
| Male | 399 | 32.0 | 132 | 50.4 | 50 | 45.9 | |
| Female | 847 | 68.0 | 130 | 49.6 | 59 | 54.1 | |
| Marital Status | < .001f | ||||||
| Married | 290 | 23.4 | 25 | 9.7 | 14 | 12.8 | |
| Separated | 45 | 3.6 | 7 | 2.7 | 7 | 6.4 | |
| Divorced | 152 | 12.3 | 25 | 9.7 | 7 | 6.4 | |
| Annulled | 2 | 0.2 | 0 | 0.0 | 0 | 0.0 | |
| Widowed | 26 | 2.1 | 2 | 0.8 | 2 | 1.8 | |
| Never been married | 724 | 58.4 | 199 | 77.1 | 79 | 72.5 | |
| Race/Ethnicity | .03g | ||||||
| Hispanic | 140 | 11.3 | 34 | 13.1 | 19 | 17.6 | |
| Non-Hispanic White | 417 | 33.5 | 72 | 27.8 | 24 | 22.2 | |
| Non-Hispanic Black | 637 | 51.2 | 145 | 56.0 | 64 | 59.3 | |
| Non-Hispanic Other | 49 | 3.9 | 8 | 3.1 | 1 | 0.9 | |
| Employment Code | .99h | ||||||
| Employed | 816 | 74.2 | 178 | 74.8 | 70 | 73.7 | |
| Retired | 29 | 2.6 | 6 | 2.5 | 2 | 2.1 | |
| Homemaker | 22 | 2.0 | 4 | 1.7 | 1 | 1.1 | |
| Student | 46 | 4.2 | 10 | 4.2 | 4 | 4.2 | |
| Unemployed, disabled, or other | 187 | 17.0 | 40 | 16.8 | 18 | 18.9 | |
| Income Code | .50i | ||||||
| ≤ $19,000 | 374 | 34.3 | 95 | 40.3 | 31 | 33.3 | |
| $19,001 - $35,000 | 340 | 31.2 | 69 | 29.2 | 29 | 31.2 | |
| $35,001 - $50,000 | 156 | 14.3 | 26 | 11.0 | 14 | 15.1 | |
| $59,001 - $75,000 | 85 | 7.8 | 19 | 8.1 | 10 | 10.8 | |
| $75,001 - $100,000 | 67 | 6.1 | 10 | 4.2 | 7 | 7.5 | |
| > $100,000 | 68 | 6.2 | 17 | 7.2 | 2 | 2.2 | |
Note. Missing data was removed pairwise.
df = (2, 1614)
df = (2, 1608)
df = (2, 1249)
df = (2, 1171)
df = (2, 1617)
df = (2, 1606)
df = (2, 1610)
df = (2, 1433)
df = (2, 1419)
3.2. Mixed-Model Repeated Measures ANOVA
Alcohol Use Trajectories and Change in PTSD Symptoms.
A main effect of time, F(2, 1430)=15.37, p<.001, ηp2=.02, and a significant time by alcohol use trajectory class interaction were observed F(3, 1430)=2.83, p=.04, ηp2=.01 (see Table 3 for means and standard deviations). Analyses revealed the low use alcohol trajectory class had lower PTSD symptoms at baseline than the high use alcohol trajectory class, but not the increasing use trajectory class. There were no significant differences between the trajectory classes across other timepoints. For the low use trajectory class participants, their PTSD symptoms increased from baseline to week 8, reflecting moderate and clinically significant PTSD symptom severity; symptoms also decreased from week 8 to week 12 but remained clinically significant at this time. The increasing use trajectory class showed a similar pattern of change in PTSD symptoms compared to the low use trajectory class; however, no statistically significant differences between timepoints were found for this trajectory class. The high use trajectory class exhibited relatively similar PTSD symptoms at each timepoint, all within the moderate PTSD symptom severity range; no statistically significant mean differences were apparent across timepoints for this trajectory class. Figure 2A illustrates the patterns of PTSD symptom change over time for the three alcohol use trajectory classes.
Table 3.
Means and Standard Deviation for Posttraumatic Stress Disorder (PTSD) and Depression Symptoms
| Posttraumatic Stress Symptoms |
||||||
|---|---|---|---|---|---|---|
| Alcohol Use Trajectory | Cannabis Use Trajectory | |||||
|
| ||||||
| Timepoint | Low use Mean (SD) |
High use Mean (SD) |
Increasing use Mean (SD) |
Low use Mean (SD) |
High use Mean (SD) |
Increasing use Mean (SD) |
| Baseline | 20.90 (19.63) | 24.55 (19.80) | 23.69 (21.26) | 19.76 (19.69) | 28.42 (19.11) | 27.56 (18.43) |
| Week 8 | 28.83 (20.06) | 27.95 (18.13) | 31.60 (18.66) | 27.93 (19.45) | 32.05 (20.06) | 32.48 (20.38) |
| Week 12 | 25.14 (18.95) | 27.36 (19.22) | 27.81 (19.70) | 24.55 (18.72) | 30.28 (19.52) | 28.32 (20.22) |
| Depression Symptoms |
||||||
| Alcohol Use Trajectory | Cannabis Use Trajectory | |||||
|
| ||||||
| Timepoint | Low use Mean (SD) |
High use Mean (SD) |
Increasing use Mean (SD) |
Low use Mean (SD) |
High use Mean (SD) |
Increasing use Mean (SD) |
|
| ||||||
| Baseline | 48.65 (10.89) | 51.70 (10.41) | 51.17 (11.25) | 48.41 (10.51) | 52.85 (11.56) | 51.40 (11.75) |
| Week 8 | 54.41 (11.07) | 55.42 (10.37) | 57.75 (10.58) | 54.20 (10.86) | 56.93 (10.64) | 56.95 (11.85) |
| Week 12 | 53.13(11.17) | 53.49 (11.07) | 53.27 (11.15) | 52.92 (11.07) | 56.19 (10.51) | 55.18 (11.22) |
Figure 2.
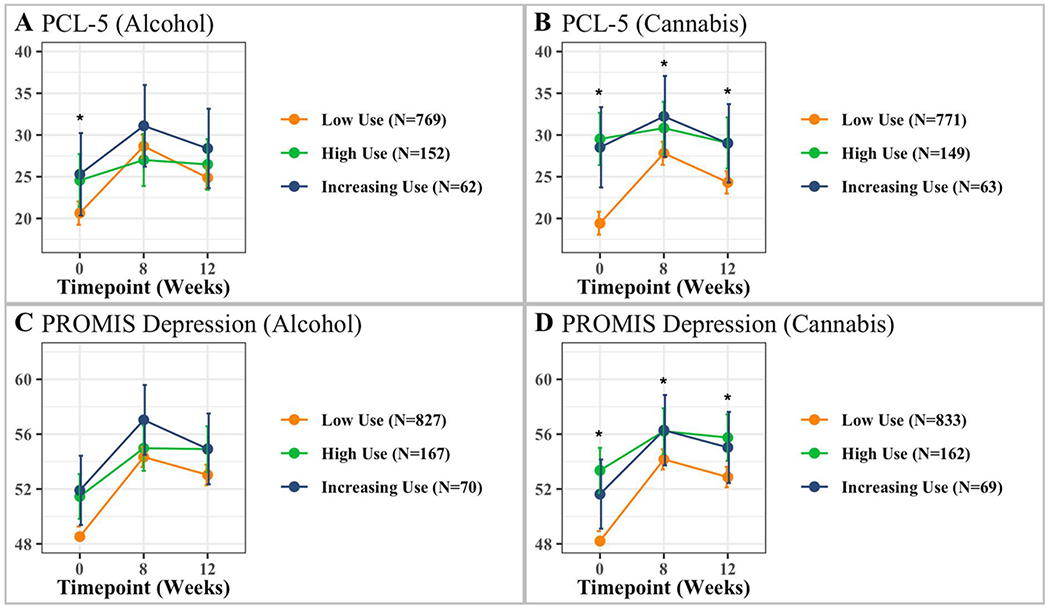
Repeated measures ANOVA examining interactions between levels of use and measures for PTSD (PCL) and depression (PROMIS). Analyses included 3 timepoints – baseline, week 8 and 12. Error bars represent 95% confidence interval; *Denotes significant interaction.
Alcohol Use Trajectories and Change in Depression Symptoms.
A statistically significant main effect of time was observed, F(2, 1807)=53.34, p<.001, ηp2=.05, all trajectory classes had lower depression symptoms at baseline than at other timepoints after the ED visit (see Table 3 for means and standard deviations). A statistically significant main effect of alcohol trajectory class was found F(2, 1061)=4.81, p=.01, ηp2=.01 whereby the low use alcohol trajectory class had lower depression symptoms than the other two trajectory classes at baseline; the high use and increasing use trajectory classes did not differ from each other. No statistically significant time by trajectory class interaction was observed F(3, 1807)=2.14, p=.085. Figure 2C illustrates the patterns of depression symptom change over time for the three alcohol use trajectory classes.
Cannabis Use Trajectories and Change in PTSD Symptoms.
A statistically significant main effect of time, F(2, 1436)=10.72, p<.001, ηp2=.01, and a time by cannabis use class interaction was observed F(3, 1436)=5.45, p=.001, ηp2=.01 (see Table 3 for means and standard deviations). Analyses revealed the low use cannabis trajectory class had lower PTSD symptoms at baseline than the high use and increasing use trajectory classes; the latter two trajectory classes demonstrated high levels of PTSD symptoms across all timepoints. The low use cannabis trajectory class also exhibited lower PTSD symptoms at week 8 than the high use trajectory class, unlike the increasing use trajectory class. The low use cannabis trajectory class also exhibited lower PTSD symptoms at week 12 than the high use trajectory class, unlike the increasing use trajectory class. No statistically significant differences existed between the high and increasing use trajectory classes across other timepoints. For low use trajectory class participants, PTSD symptoms significantly increased from baseline to week 8, with symptoms reaching the clinical threshold for a PTSD diagnosis at week 8, but then decreasing significantly from week 8 to week 12; however, within this trajectory class, week 12 symptoms were still greater than symptoms reported at the baseline visits and remained clinically significant at week 12. The increasing use trajectory class showed a pattern of PTSD similar to the low use trajectory class across time, with symptoms remaining high across these timepoints. No statistically significant differences across time were found within this trajectory class. The high use trajectory class exhibited relatively similar (and high) PTSD symptoms at each timepoint. Figure 2B illustrates the patterns of PTSD symptom change over time for the three cannabis use trajectory classes.
Cannabis Use Trajectories and Change in Depression Symptoms.
A statistically significant main effect of time, F(2, 1811)=46.16, p<.001, ηp2=.04, and a time by cannabis use trajectory class interaction were observed F(3, 1811)=3.68, p=.01, ηp2=.01 (see Table 3 for means and standard deviations). Analyses revealed that the low use cannabis trajectory class had significantly lower depression symptoms at baseline than the high use and increasing use trajectory classes. The low use cannabis trajectory class also showed lower depression symptoms at week 8 compared to the high use trajectory class and increasing use trajectory class. The low use cannabis trajectory class also showed lower depression symptoms at week 12 than the high use trajectory class and increasing use trajectory class. No statistically significant differences existed between the high and increasing use trajectory classes across timepoints. Within the low use trajectory classes, participants’ depression symptoms increased from baseline to week 8 but decreased significantly from week 8 to week 12; however, week 12 symptoms were greater than those reported during the baseline recording. For the high and increasing use trajectory classes participants, depression symptoms significantly increased from baseline to week 8 but were not statistically significantly different between week 8 and week 12. Figure 2D illustrates the patterns of depression symptom change over time for the three cannabis use trajectory classes.
4. Discussion
We examined alcohol and cannabis use trajectories among ED patients who recently suffered trauma and whether these trajectories were associated with changes in overall PTSD and depression symptoms over the three months following that trauma. We found that alcohol and cannabis use exhibited similar, yet functionally different trajectory classes that included low, high, and increasing use trajectory classes. Specifically, the high and increasing cannabis use trajectory classes exhibited similarly high PTSD and depression symptoms at week 8, unlike the low use group. Conversely, only the increasing alcohol use trajectory class exhibited higher PTSD and depression symptoms at week 8. These findings suggest that increasing cannabis intake in the aftermath of trauma may be linked to increased post-trauma sequelae. They also indicate that high cannabis use at the time of trauma may contribute to a vulnerability for developing post-trauma sequelae.
Contrary to our hypothesis, for both alcohol and cannabis, the increasing use trajectory classes did not show a statistically significant increase in PTSD symptoms over the three-month posttrauma period. Instead, we observed the following by trajectory class. For the low use alcohol and cannabis classes: (1) PTSD symptoms were lower than the high use trajectory classes measured at the baseline timepoint collected in the ED; (2) PTSD symptoms increased from baseline to week 8, then decreased from week 8 to week 12; and (3) PTSD symptoms increased overall and reached a clinically significant severity threshold by week 12. The increasing cannabis trajectory classes reported higher PTSD symptoms at baseline that increased slightly to week 8 and decreased slightly from week 8 to week 12. In contrast, the high use alcohol and cannabis trajectory classes maintained similar high, clinically significant levels of PTSD symptoms at each timepoint.
Regarding depression symptoms, our results partly support our hypothesis. The low cannabis use trajectory class had lower depression symptoms recorded at baseline than the other two trajectory classes. Furthermore, all cannabis trajectory classes showed similar patterns of increased depression symptoms from baseline to week 8, yet only the low use trajectory class exhibited decreased symptoms from week 8 to week 12. In contrast, for the alcohol use trajectory classes, there was a statistically significant pattern with depression symptoms related to time over the three-month follow-up period, but no significant interaction. The lack of interaction suggests that the three patterns of alcohol use did not differ in the occurrence of depression symptoms across time.
Our findings reveal two important characteristics of the participants in the low use trajectory classes for alcohol and cannabis use. First, low alcohol and cannabis users exhibited a greater initial increase in clinical symptoms between baseline and week 8 and subsequently a greater decrease from week 8 to week 12. While noteworthy, it is important to highlight that week 12 PTSD, and depression symptoms in the alcohol and cannabis low use trajectory classes were greater than at baseline and that these participants’ symptoms never returned to baseline levels. This latter finding, in part, provides some evidence that individuals who rarely consume substances could also be at risk for trauma and stress-related psychopathology as compared to those who occasionally or frequently use alcohol or cannabis.
Individuals already using alcohol or cannabis exhibited clinically significant PTSD symptoms at baseline that did not significantly change over time. These findings align with other research showing that individuals with substance dependence exhibited greater rates of PTSD than controls (Gielen, Havermans, Tekelenburg, & Jansen, 2012). There could be several explanations for this pattern. The susceptibility hypothesis (Acierno, Resnick, Kilpatrick, Saunders, & Best, 1999; Chilcoat & Breslau, 1998; Cottler, Compton, Mager, Spitznagel, & Janca, 1992) suggests that individuals who use substances might place themselves in more dangerous situations and experience more traumatic events, increasing the likelihood of developing posttraumatic symptoms after trauma. Indeed, research suggests that being subjected to more traumatic events in one’s lifetime could increase PTSD symptoms (Breslau, Peterson, & Schultz, 2008). Such populations show a lifetime prevalence of trauma exposure up to 95% (Dansky, Saladin, Coffey, & Brady, 1997; Farley, Golding, Young, Mulligan, & Minkoff, 2004; Read et al., 2014; Reynolds et al., 2005). Thus, it may be that participants in the alcohol and cannabis high use and increasing groups had been subjected to more traumatic experiences, explaining the high PTSD symptoms reported in the 30 days following the trauma.
Furthermore, alcohol and cannabis use may make an individual more susceptible to developing posttraumatic stress symptoms due to an inability to successfully regulate stress response to a traumatic event. Both alcohol and cannabis use has been associated with dysregulation of hypothalamic-pituitary axis (HPA) function. Alcohol consumption has been associated with excessive cortisol response (Richardson, Lee, O’Dell, Koob, & Rivier, 2008), whereas cannabis users show blunted cortisol reactivity in response to stress (Cservenka, Lahanas, & Dotson-Bossert, 2018). Heavy cannabis use has been associated with increased sympathetic arousal and fluctuations in heart rate variability (reviewed in (Wemm & Sinha, 2019)). While we did not include biomarkers, future studies should examine differences in biological functions to determine whether the changes associated with alcohol and substance use affect biological processes that may make an individual susceptible to developing posttrauma psychopathology.
Alcohol consumption might exacerbate PTSD symptoms (Ouimette, Finney, & Moos, 1999; Volpicelli, Balaraman, Hahn, Wallace, & Bux, 1999), and may explain the greater baseline symptoms in the high use trajectory class than the low use trajectory class at baseline. Indeed, alcohol use might exacerbate posttraumatic stress over time by promoting negative coping strategies (Read et al., 2014). Read and colleagues (Read et al., 2014) used a cross-lagged panel model to test how coping may influence the associations between PTSD symptoms and alcohol use over time in trauma-exposed young adults entering college. Specifically, the authors showed an indirect association between problems caused by alcohol use and PTSD symptoms through negative coping.
Regarding depression symptoms, our study results suggest that for the cannabis trajectory classes, the high and increasing use classes exhibited relatively high symptoms at baseline in the ED that increased by week 8 and remained higher than baseline levels by week 12. One review found a similar association in heavy cannabis use with increasing depression symptoms (Degenhardt, Hall, & Lynskey, 2003). Cannabis use (Hser et al., 2017; Lev-Ran et al., 2014; Moore et al., 2007) and alcohol consumption have been associated with an increased risk for depression (McEachin, Keller, Saunders, & McInnis, 2008; Paljärvi et al., 2009; Sihvola et al., 2008) in some studies, though these findings have not been consistent (Rosenthal et al., 2018).
This study is not without limitations. First, the clinical information acquired was measured on a continuous scale. Therefore, we did not focus on only those who had a clinical diagnosis of PTSD, depression, and alcohol or substance use disorders. Therefore, we cannot generalize the results to samples suffering from the dual clinical diagnosis of PTSD or depression and alcohol or substance use disorder. Though, this also allows the exploration of sub-threshold populations. Second, our clinical measures’ assessment was based only on self-report questionnaires and not clinician-based diagnostic assessments. Thus, the data provided may be a poor representation of the general population. Lastly, for the baseline timepoint, participants were asked to report symptoms in the 30 days before the ED visit, yet these responses were collected immediately after a traumatic event, potentially leading to inaccurate recall ability.
These limitations do not diminish the many strengths of this study. For one, our findings reveal that, shortly after trauma exposure, there appears to be a window of time wherein frequent substance users or those who increase their substance use may be more sensitive to their effects, potentially leading to the development of PTSD and depression symptoms. This is illustrated by the fact that increasing and high use groups had higher PTSD and depression symptoms at baseline, and these symptoms increased and remained clinically significant over time. This points to the value of interventions or educational materials targeted to these sub-groups of trauma-survivors shortly after the event to help prevent an increase in post-trauma sequelae. Furthermore, our data also highlight differences in trajectories and associations between clinical symptoms between substances. For example, while we did not find a significant time by substance use class interaction with depression symptoms for alcohol use, we did for cannabis. This suggests different mechanisms through which substances may negatively affect the development of post-trauma sequelae. Lastly, our data sheds light on the importance of assessing PTSD and depression symptoms in substance-using individuals in the aftermath of trauma. Increasingly, substance use clinicals are incorporating trauma-informed care; this study highlights the importance of measuring trauma exposure and substance use in these clinical settings with the goal of providing more targeted services to patients. Future studies should examine these associations across even longer periods of times using more ecologically valid methods such as EMA.
To conclude, three alcohol and cannabis use trajectory classes demonstrated different relationships with changes in PTSD and depression symptoms across three months posttrauma. Our results illustrate an interaction between alcohol and cannabis use and change in clinical symptoms soon after trauma exposure. The findings highlight the importance of developing and implementing preventive measures for alcohol and cannabis use in recently trauma-exposed individuals to inhibit the development and continuation of severe post-traumatic sequelae.
Supplementary Material
Acknowledgments
The investigators wish to thank the trauma survivors participating in the AURORA Study. Their time and effort during a challenging period of their lives make our efforts to improve recovery for future trauma survivors possible.
Funding Support
This project was supported by NIMH under U01MH110925, the US Army MRMC, One Mind, and The Mayday Fund. The content is solely the responsibility of the authors and does not necessarily represent the official views of any of the funders. Support for title page creation and format was provided by AuthorArranger, a tool developed at the National Cancer Institute. Data and/or research tools used in the preparation of this manuscript were obtained from the National Institute of Mental Health (NIMH) Data Archive (NDA). NDA is a collaborative informatics system created by the National Institutes of Health to provide a national resource to support and accelerate research in mental health. Dataset identifier(s): NIMH Data Archive Digital Object Identifier (DOI) 10.15154/1527790. This manuscript reflects the views of the authors and may not reflect the opinions or views of the NIH or of the Submitters submitting original data to NDA. Dr. Hinojosa reported no biomedical financial interests or potential conflicts of interest. Ms. Liew reported no biomedical financial interests or potential conflicts of interest. Dr. An reported no biomedical financial interests or potential conflicts of interest. Dr. Stevens reported no biomedical financial interests but is a NPP Board Member. Dr. Basu reported no biomedical financial interests or potential conflicts of interest. Dr. van Rooij reported no biomedical financial interests or potential conflicts of interest. Dr. House reported no biomedical financial interests or potential conflicts of interest. Dr. Beaudoin reported no biomedical financial interests or potential conflicts of interest. Dr. Zeng reported no biomedical financial interests or potential conflicts of interest. Dr. Neylan has received research support from NIH, VA, and Rainwater Charitable Foundation, and consulting income from Jazz Pharmaceuticals. In the last three years Dr Clifford has received research funding from the NSF, NIH, Nextsense Inc., LifeBell AI, Otsuka UA, and unrestricted donations from AliveCor Inc, Amazon Research, the Center for Discovery, the Gates Foundation, Google, the Gordon and Betty Moore Foundation, MathWorks, Microsoft Research, One Mind Foundation, the Rett Research Foundation, and Samsung Research. Dr Clifford has financial interest in AliveCor Inc and Nextsense Inc. He also is the CTO of MindChild Medical and CSO of LifeBell AI and has ownership in both companies. These relationships are unconnected to the current work. Dr. Jovanovic has NIH funding (MH111682, MH122867, HD099178). Dr. Linnstaedt reported no biomedical financial interests or potential conflicts of interest. Dr. Germine reported no biomedical financial interests or potential conflicts of interest. Dr. Rauch reports grants from NIH during the conduct of the study; personal fees from SOBP (Society of Biological Psychiatry) paid role as secretary, other from Oxford University Press royalties, other from APP (American Psychiatric Publishing Inc.) royalties, other from VA (Veterans Administration) per diem for oversight committee, and other from Community Psychiatry/Mindpath Health paid board service, including equity outside the submitted work; other from National Association of Behavioral Healthcare for paid Board service; and Leadership roles on Board or Council for SOBP, ADAA (Anxiety and Depression Association of America), and NNDC (National Network of Depression Centers). Dr. Haran reported no biomedical financial interests or potential conflicts of interest. Dr. Storrow reported no biomedical financial interests or potential conflicts of interest. Dr. Lewandowski reported no biomedical financial interests or potential conflicts of interest. Dr. Musey reported no biomedical financial interests or potential conflicts of interest. Dr. Hendry reported no biomedical financial interests or potential conflicts of interest. Dr. Sheikh has received funding from the Florida Medical Malpractice Joint Underwriter’s Association Dr. Alvin E. Smith Safety of Healthcare Services Grant; Allergan Foundation; the NIH/NIA-funded Jacksonville Aging Studies Center (JAX-ASCENT; R33AG05654); and the Substance Abuse and Mental Health Services Administration (1H79TI083101-01); and the Florida Blue Foundation. Dr. Jones has no competing interests related to this work, though he has been an investigator on studies funded by AstraZeneca, Vapotherm, Abbott, and Ophirex. Dr. Punches reported no biomedical financial interests or potential conflicts of interest. Dr. Kurz reported no biomedical financial interests or potential conflicts of interest. Dr. Swor reported no biomedical financial interests or potential conflicts of interest. Dr. Hudak reported no biomedical financial interests or potential conflicts of interest. Dr. Pascual reported no biomedical financial interests or potential conflicts of interest. Dr. Seamon reported no biomedical financial interests or potential conflicts of interest. Dr. Datner serves as Medical Advisor for Cayaba Care. Dr. Chang reported no biomedical financial interests or potential conflicts of interest. Dr. Pearson reported no biomedical financial interests or potential conflicts of interest. Dr. Peak reported no biomedical financial interests or potential conflicts of interest. Dr. Merchant reported no biomedical financial interests or potential conflicts of interest. Dr. Domeier reported no biomedical financial interests or potential conflicts of interest. Dr. Rathlev reported no biomedical financial interests or potential conflicts of interest. Dr. Sergot reported no biomedical financial interests or potential conflicts of interest. Dr. Sánchez reported no biomedical financial interests or potential conflicts of interest. Dr. Bruce reported no biomedical financial interests or potential conflicts of interest. Dr. Miller reported no biomedical financial interests or potential conflicts of interest. Dr. Pietrzak reported no biomedical financial interests or potential conflicts of interest. Dr. Joormann receives consulting payments from Janssen Pharmaceuticals. Over the past 3 years, Dr. Pizzagalli has received consulting fees from Albright Stonebridge Group, Boehringer Ingelheim, Compass Pathways, Concert Pharmaceuticals, Engrail Therapeutics, Neumora Therapeutics (former BlackThorn Therapeutics), Neurocrine Biosciences, Neuroscience Software, Otsuka Pharmaceuticals, and Takeda Pharmaceuticals; honoraria from the Psychonomic Society (for editorial work) and Alkermes, and research funding from NIMH, Dana Foundation, Brain and Behavior Research Foundation, and Millennium Pharmaceuticals. In addition, he has received stock options from Neumora Therapeutics (former BlackThorn Therapeutics), Compass Pathways, Engrail Therapeutics, and Neuroscience Software. Lastly, Dr. Pizzagalli is a NPP Board Member. Dr. Sheridan reported no biomedical financial interests or potential conflicts of interest. Dr. Harte has no competing interests related to this work, though in the last three years he has received research funding from Aptinyx and Arbor Medical Innovations, and consulting payments from Aptinyx, Heron Therapeutics, and Eli Lilly. Dr. Elliott reports support from the National Institutes of Health (NIH) through Grant Numbers R01HD079076 & R03HD094577: Eunice Kennedy Shriver National Institute of Child Health & Human Development; National Center for Medical Rehabilitation Research. He also reports funding from New South Wales Health, Spinal Cord Injury Award (2020-2025) and consulting fees (< $15,000 per annum) from Orofacial Therapeutics, LLC. In the past 3 years, Dr. Kessler was a consultant for Datastat, Inc., Holmusk, RallyPoint Networks, Inc., and Sage Pharmaceuticals. He has stock options in Mirah, PYM, and Roga Sciences. Dr. Koenen’s research has been supported by the Robert Wood Johnson Foundation, the Kaiser Family Foundation, the Harvard Center on the Developing Child, Stanley Center for Psychiatric Research at the Broad Institute of MIT and Harvard, the National Institutes of Health, One Mind, the Anonymous Foundation, and Cohen Veterans Bioscience. She has been a paid consultant for Baker Hostetler, Discovery Vitality, and the Department of Justice. She has been a paid external reviewer for the Chan Zuckerberg Foundation, the University of Cape Town, and Capita Ireland. She has had paid speaking engagements in the last three years with the American Psychological Association, European Central Bank. Sigmund Freud University – Milan, Cambridge Health Alliance, and Coverys. She receives royalties from Guilford Press and Oxford University Press. Dr. McLean reported no biomedical financial interests or potential conflicts of interest. Dr. Ressler has performed scientific consultation for Bioxcel, Bionomics, Acer, Takeda, and Jazz Pharma; serves on Scientific Advisory Boards for Sage and the Brain Research Foundation, and he has received sponsored research support from Takeda, Brainsway and Alto Neuroscience. Lastly, Dr. Ressler is a NPP Board Member. Dr. Fani reported no biomedical financial interests or potential conflicts of interest.
References
- Abraham HD, & Fava M (1999). Order of onset of substance abuse and depression in a sample of depressed outpatients. Comprehensive Psychiatry, 40(1), 44–50. doi: 10.1016/S0010-440X(99)90076-7 [DOI] [PubMed] [Google Scholar]
- Acierno R, Resnick H, Kilpatrick DG, Saunders B, & Best CL (1999). Risk factors for rape, physical assault, and posttraumatic stress disorder in women: Examination of differential multivariate relationships. Journal of Anxiety Disorders, 13(6), 541–563. [DOI] [PubMed] [Google Scholar]
- Allan NP, Ashrafioun L, Kolnogorova K, Raines AM, Hoge CW, & Stecker T (2019). Interactive effects of PTSD and substance use on suicidal ideation and behavior in military personnel: Increased risk from marijuana use. Depression & Anxiety, 36(11), 1072–1079. doi: 10.1002/da.22954 [DOI] [PubMed] [Google Scholar]
- Amtmann D, Kim J, Chung H, Bamer AM, Askew RL, Wu S, … Johnson KL (2014). Comparing CESD-10, PHQ-9, and PROMIS depression instruments in individuals with multiple sclerosis. Rehabilitation Psychology, 59(2), 220–229. doi: 10.1037/a0035919 [DOI] [PMC free article] [PubMed] [Google Scholar]
- Berenz EC, Cho SB, Overstreet C, Kendler K, Amstadter AB, & Dick DM (2016). Longitudinal investigation of interpersonal trauma exposure and alcohol use trajectories. Addictive Behaviors, 53, 67–73. doi: 10.1016/j.addbeh.2015.09.014 [DOI] [PMC free article] [PubMed] [Google Scholar]
- Bernstein DP, Stein JA, Newcomb MD, Walker E, Pogge D, Ahluvalia T, … Zule W (2003). Development and validation of a brief screening version of the Childhood Trauma Questionnaire. Child Abuse & Neglect, 27(2), 169–190. doi: 10.1016/s0145-2134(02)00541-0 [DOI] [PubMed] [Google Scholar]
- Bhalla IP, Stefanovics EA, & Rosenheck RA (2017). Clinical epidemiology of single versus multiple substance use disorders: Polysubstance use disorder. Medical Care, 55 Supplement 9 Supplement 2, S24–s32. doi: 10.1097/mlr.0000000000000731 [DOI] [PubMed] [Google Scholar]
- Blanchard EB, Hickling EJ, Vollmer AJ, Loos WR, Buckley TC, & Jaccard J (1995). Short-term follow-up of post-traumatic stress symptoms in motor vehicle accident victims. Behaviour Reseach and Therapy, 33(4), 369–377. doi: 10.1016/0005-7967(94)00067-t [DOI] [PubMed] [Google Scholar]
- Blanco C, Xu Y, Brady K, Pérez-Fuentes G, Okuda M, & Wang S (2013). Comorbidity of posttraumatic stress disorder with alcohol dependence among US adults: results from National Epidemiological Survey on Alcohol and Related Conditions. Drug and Alcohol Dependence, 132(3), 630–638. doi: 10.1016/j.drugalcdep.2013.04.016 [DOI] [PMC free article] [PubMed] [Google Scholar]
- Blevins CA, Weathers FW, Davis MT, Witte TK, & Domino JL (2015). The posttraumatic stress disorder checklist for DSM-5 (PCL-5): Development and initial psychometric evaluation. Journal of Traumatic Stress, 28(6), 489–498. doi: 10.1002/jts.22059 [DOI] [PubMed] [Google Scholar]
- Breslau N, Peterson EL, & Schultz LR (2008). A second look at prior trauma and the posttraumatic stress disorder effects of subsequent trauma: A Prospective epidemiological study. Archives of General Psychiatry, 65(4), 431–437. doi: 10.1001/archpsyc.65.4.431 [DOI] [PubMed] [Google Scholar]
- Cakmak AS, Alday EAP, Da Poian G, Rad AB, Metzler TJ, Neylan TC, … Clifford GD (2021). Classification and prediction of post-trauma outcomes related to PTSD using circadian rhythm changes measured via wrist-worn research watch in a large longitudinal cohort. Institute of Electrical and Electronics Engineers Journal of Biomedical and Health Informatics, 25(8), 2866–2876. doi: 10.1109/jbhi.2021.3053909 [DOI] [PMC free article] [PubMed] [Google Scholar]
- Cella D, Yount S, Rothrock N, Gershon R, Cook K, Reeve B, … Rose M (2007). The Patient-Reported Outcomes Measurement Information System (PROMIS): progress of an NIH Roadmap cooperative group during its first two years. Medical Care, 45(5 Suppl 1), S3–s11. doi: 10.1097/01.mlr.0000258615.42478.55 [DOI] [PMC free article] [PubMed] [Google Scholar]
- Chilcoat, & Breslau. (1998). Investigations of causal pathways between PTSD and drug use disorders. Addictive Behaviors, 23(6), 827–840. [DOI] [PubMed] [Google Scholar]
- Cottler LB, Compton WM 3rd, Mager D, Spitznagel EL, & Janca A (1992). Posttraumatic stress disorder among substance users from the general population. Americal Journal of Psychiatry, 149(5), 664–670. doi: 10.1176/ajp.149.5.664 [DOI] [PubMed] [Google Scholar]
- Croughan JL, Miller JP, Wagelin D, & Whitman BY (1982). Psychiatric illness in male and female narcotic addicts. Journal of Clincal Psychiatry, 43(6), 225–228. [PubMed] [Google Scholar]
- Cservenka A, Lahanas S, & Dotson-Bossert J (2018). Marijuana use and hypothalamic-pituitary-adrenal axis functioning in humans. Frontiers in Psychiatry, 9, 472. doi: 10.3389/fpsyt.2018.00472 [DOI] [PMC free article] [PubMed] [Google Scholar]
- Dansky BS, Saladin ME, Coffey SF, & Brady KT (1997). Use of self-report measures of crime-related posttraumatic stress disorder with substance use disordered patients. Journal of Subtance Abuse Treatment, 14(5), 431–437. doi: 10.1016/s0740-5472(97)00120-7 [DOI] [PubMed] [Google Scholar]
- Degenhardt L, Hall W, & Lynskey M (2003). Exploring the association between cannabis use and depression. Addiction, 98(11), 1493–1504. doi: 10.1046/j.1360-0443.2003.00437.x [DOI] [PubMed] [Google Scholar]
- Fani N, Jain J, Hudak LA, Rothbaum BO, Ressler KJ, & Michopoulos V (2020). Post-trauma anhedonia is associated with increased substance use in a recently-traumatized population. Journal of Psychiatry Research, 285, 112777. doi: 10.1016/j.psychres.2020.112777 [DOI] [PMC free article] [PubMed] [Google Scholar]
- Farley M, Golding JM, Young G, Mulligan M, & Minkoff JR (2004). Trauma history and relapse probability among patients seeking substance abuse treatment. Journal of Substance Abuse Treatment, 27(2), 161–167. doi: 10.1016/j.jsat.2004.06.006 [DOI] [PubMed] [Google Scholar]
- Gielen N, Havermans RC, Tekelenburg M, & Jansen A (2012). Prevalence of post-traumatic stress disorder among patients with substance use disorder: it is higher than clinicians think it is. European Journal of Psychotraumatology, 3. doi: 10.3402/ejpt.v3i0.17734 [DOI] [PMC free article] [PubMed] [Google Scholar]
- Haller M, & Chassin L (2014). Risk pathways among traumatic stress, posttraumatic stress disorder symptoms, and alcohol and drug problems: a test of four hypotheses. Psychology of Addictive Behaviors, 28(3), 841–851. doi: 10.1037/a0035878 [DOI] [PMC free article] [PubMed] [Google Scholar]
- Hamilton CM, Strader LC, Pratt JG, Maiese D, Hendershot T, Kwok RK, … Haines J (2011). The PhenX Toolkit: get the most from your measures. American Journal of Epidemiology, 174(3), 253–260. doi: 10.1093/aje/kwr193 [DOI] [PMC free article] [PubMed] [Google Scholar]
- Harnett NG, van Rooij SJH, Ely TD, Lebois LAM, Murty VP, Jovanovic T, … Stevens JS (2021). Prognostic neuroimaging biomarkers of trauma-related psychopathology: resting-state fMRI shortly after trauma predicts future PTSD and depression symptoms in the AURORA study. Neuropsychopharmacology, 46(7), 1263–1271. doi: 10.1038/s41386-020-00946-8 [DOI] [PMC free article] [PubMed] [Google Scholar]
- Hser YI, Mooney LJ, Huang D, Zhu Y, Tomko RL, McClure E, … Gray KM (2017). Reductions in cannabis use are associated with improvements in anxiety, depression, and sleep quality, but not quality of life. Journal of Substance Abuse Treatment, 81, 53–58. doi: 10.1016/j.jsat.2017.07.012 [DOI] [PMC free article] [PubMed] [Google Scholar]
- Joormann J, Ziobrowski HN, King AJ, Gildea SM, Lee S, Sampson NA, … Kessler RC (2022). Prior histories of posttraumatic stress disorder and major depression and their onset and course in the three months after a motor vehicle collision in the AURORA study. Depression & Anxiety, 39(1), 56–70. doi: 10.1002/da.23223 [DOI] [PMC free article] [PubMed] [Google Scholar]
- Kaysen, Atkins DC, Simpson TL, Stappenbeck CA, Blayney JA, Lee CM, & Larimer ME (2014). Proximal relationships between PTSD symptoms and drinking among female college students: results from a daily monitoring study. Psychology of Addictive Behaviors, 28(1), 62. [DOI] [PMC free article] [PubMed] [Google Scholar]
- Kaysen D, Neighbors C, Martell J, Fossos N, & Larimer ME (2006). Incapacitated rape and alcohol use: a prospective analysis. Addictive Behaviors, 31(10), 1820–1832. doi: 10.1016/j.addbeh.2005.12.025 [DOI] [PMC free article] [PubMed] [Google Scholar]
- Kessler, Ressler KJ, House SL, Beaudoin FL, An X, Stevens JS, … McLean SA (2021). Socio-demographic and trauma-related predictors of PTSD within 8 weeks of a motor vehicle collision in the AURORA study. Molecular Psychiatry, 26(7), 3108–3121. doi: 10.1038/s41380-020-00911-3 [DOI] [PMC free article] [PubMed] [Google Scholar]
- Kessler, Sonnega A, Bromet E, Hughes M, & Nelson CB (1995). Posttraumatic stress disorder in the National Comorbidity Survey. Archives of General Psychiatry, 52(12), 1048–1060. [DOI] [PubMed] [Google Scholar]
- Khantzian EJ (1997). The self-medication hypothesis of substance use disorders: a reconsideration and recent applications. Harvard Review of Psychiatry, 4(5), 231–244. doi: 10.3109/10673229709030550 [DOI] [PubMed] [Google Scholar]
- Kilpatrick DG, Acierno R, Resnick HS, Saunders BE, & Best CL (1997). A 2-year longitudinal analysis of the relationships between violent assault and substance use in women. Journal of Consulting and Clinical Psychology, 65(5), 834–847. doi: 10.1037//0022-006x.65.5.834 [DOI] [PubMed] [Google Scholar]
- Kline A, Weiner MD, Ciccone DS, Interian A, St Hill L, & Losonczy M (2014). Increased risk of alcohol dependency in a cohort of National Guard troops with PTSD: a longitudinal study. Journal of Psychiatric Research, 50, 18–25. doi: 10.1016/j.jpsychires.2013.11.007 [DOI] [PubMed] [Google Scholar]
- Lane AR, Waters AJ, & Black AC (2019). Ecological momentary assessment studies of comorbid PTSD and alcohol use: A narrative review. Addictive Behaviors Reports, 10, 100205. doi: 10.1016/j.abrep.2019.100205 [DOI] [PMC free article] [PubMed] [Google Scholar]
- Lebois LAM, Harnett NG, van Rooij SJH, Ely TD, Jovanovic T, Bruce SE, … Ressler KJ (2022). Persistent Dissociation and Its Neural Correlates in Predicting Outcomes After Trauma Exposure. American Journal of Psychiatry, appiajp21090911. doi: 10.1176/appi.ajp.21090911 [DOI] [PMC free article] [PubMed] [Google Scholar]
- Lev-Ran S, Roerecke M, Le Foll B, George TP, McKenzie K, & Rehm J (2014). The association between cannabis use and depression: a systematic review and meta-analysis of longitudinal studies. Psychological Medicine, 44(4), 797–810. doi: 10.1017/s0033291713001438 [DOI] [PubMed] [Google Scholar]
- McEachin RC, Keller BJ, Saunders EFH, & McInnis MG (2008). Modeling gene-by-environment interaction in comorbid depression with alcohol use disorders via an integrated bioinformatics approach. BioData Mining, 1(1), 2. doi: 10.1186/1756-0381-1-2 [DOI] [PMC free article] [PubMed] [Google Scholar]
- McLean SA, Ressler K, Koenen KC, Neylan T, Germine L, Jovanovic T, … Kessler R (2020). The AURORA Study: a longitudinal, multimodal library of brain biology and function after traumatic stress exposure. Molecular Psychiatry, 25(2), 283–296. doi: 10.1038/s41380-019-0581-3 [DOI] [PMC free article] [PubMed] [Google Scholar]
- Mirin SM, Weiss RD, Griffin ML, & Michael JL (1991). Psychopathology in drug abusers and their families. Comprehensive Psychiatry, 32(1), 36–51. [DOI] [PubMed] [Google Scholar]
- Moore TH, Zammit S, Lingford-Hughes A, Barnes TR, Jones PB, Burke M, & Lewis G (2007). Cannabis use and risk of psychotic or affective mental health outcomes: a systematic review. Lancet, 370(9584), 319–328. doi: 10.1016/s0140-6736(07)61162-3 [DOI] [PubMed] [Google Scholar]
- Nagin DS, & Odgers CL (2010). Group-based trajectory nodeling (nearly) two decades later. Journal of Quantative Criminology, 26(4), 445–453. doi: 10.1007/s10940-010-9113-7 [DOI] [PMC free article] [PubMed] [Google Scholar]
- Ouimette, Finney JW, & Moos RH (1999). Two-year posttreatment functioning and coping of substance abuse patients with posttraumatic stress disorder. Psychology of Addictive Behaviors, 13(2), 105–114. doi: 10.1037/0893-164X.13.2.105. [DOI] [Google Scholar]
- Ouimette, Read JP, Wade M, & Tirone V (2010). Modeling associations between posttraumatic stress symptoms and substance use. Addictive Behaviors, 35(1), 64–67. doi: 10.1016/j.addbeh.2009.08.009 [DOI] [PMC free article] [PubMed] [Google Scholar]
- Paljärvi T, Koskenvuo M, Poikolainen K, Kauhanen J, Sillanmäki L, & Mäkelä P (2009). Binge drinking and depressive symptoms: a 5-year population-based cohort study. Addiction, 104(7), 1168–1178. doi: 10.1111/j.1360-0443.2009.02577.x [DOI] [PubMed] [Google Scholar]
- Pérez Benítez CI, Zlotnick C, Dyck I, Stout R, Angert E, Weisberg R, & Keller M (2013). Predictors of the long-term course of comorbid PTSD: a naturalistic prospective study. International Journal of Psychiatry Clinical Practice, 17(3), 232–237. doi: 10.3109/13651501.2012.667113 [DOI] [PMC free article] [PubMed] [Google Scholar]
- Pietrzak RH, Goldstein RB, Southwick SM, & Grant BF (2011). Prevalence and Axis I comorbidity of full and partial posttraumatic stress disorder in the United States: results from Wave 2 of the National Epidemiologic Survey on Alcohol and Related Conditions. Journal of Anxiety Disorders, 25(3), 456–465. doi: 10.1016/j.janxdis.2010.11.010 [DOI] [PMC free article] [PubMed] [Google Scholar]
- Pilkonis PA, Choi SW, Reise SP, Stover AM, Riley WT, & Cella D (2011). Item banks for measuring emotional distress from the Patient-Reported Outcomes Measurement Information System (PROMIS®): depression, anxiety, and anger. Assessment, 18(3), 263–283. doi: 10.1177/1073191111411667 [DOI] [PMC free article] [PubMed] [Google Scholar]
- Possemato K, Maisto SA, Wade M, Barrie K, McKenzie S, Lantinga LJ, & Ouimette P (2015). Ecological momentary assessment of PTSD symptoms and alcohol use in combat veterans. Psychology of Addictive Behaviors, 29(4), 894. [DOI] [PubMed] [Google Scholar]
- Quello SB, Brady KT, & Sonne SC (2005). Mood disorders and substance use disorder: a complex comorbidity. Science & Practice Perspectives, 3(1), 13–21. doi: 10.1151/spp053113 [DOI] [PMC free article] [PubMed] [Google Scholar]
- Read, Griffin, Wardell, & Ouimette. (2014). Coping, PTSD symptoms, and alcohol involvement in trauma-exposed college students in the first three years of college. Psychology of Addictive Behaviors, 28(4), 1052–1064. doi: 10.1037/a0038348 [DOI] [PMC free article] [PubMed] [Google Scholar]
- Reynolds M, Mezey G, Chapman M, Wheeler M, Drummond C, & Baldacchino A (2005). Co-morbid post-traumatic stress disorder in a substance misusing clinical population. Drug and Alcohol Dependence, 77(3), 251–258. [DOI] [PubMed] [Google Scholar]
- Richardson HN, Lee SY, O’Dell LE, Koob GF, & Rivier CL (2008). Alcohol self-administration acutely stimulates the hypothalamic-pituitary-adrenal axis, but alcohol dependence leads to a dampened neuroendocrine state. European Journal of Neuroscience, 28(8), 1641–1653. doi: 10.1111/j.1460-9568.2008.06455.x [DOI] [PMC free article] [PubMed] [Google Scholar]
- Rosenthal SR, Clark MA, Marshall BDL, Buka SL, Carey KB, Shepardson RL, & Carey MP (2018). Alcohol consequences, not quantity, predict major depression onset among first-year female college students. Addictive Behavors, 85, 70–76. doi: 10.1016/j.addbeh.2018.05.021 [DOI] [PubMed] [Google Scholar]
- Rounsaville BJ, Weissman MM, Crits-Christoph K, Wilber C, & Kleber H (1982). Diagnosis and symptoms of depression in opiate addicts. Course and relationship to treatment outcome. Archives of General Psychiatry, 39(2), 151–156. doi: 10.1001/archpsyc.1982.04290020021004 [DOI] [PubMed] [Google Scholar]
- Schock K, Böttche M, Rosner R, Wenk-Ansohn M, & Knaevelsrud C (2016). Impact of new traumatic or stressful life events on pre-existing PTSD in traumatized refugees: results of a longitudinal study. European Journal of Psychotraumatology, 7, 32106. doi: 10.3402/ejpt.v7.32106 [DOI] [PMC free article] [PubMed] [Google Scholar]
- Sihvola E, Rose RJ, Dick DM, Pulkkinen L, Marttunen M, & Kaprio J (2008). Early-onset depressive disorders predict the use of addictive substances in adolescence: a prospective study of adolescent Finnish twins. Addiction, 103(12), 2045–2053. doi: 10.1111/j.1360-0443.2008.02363.x [DOI] [PMC free article] [PubMed] [Google Scholar]
- Steuber ER, Seligowski AV, Roeckner AR, Reda M, Lebois LAM, van Rooij SJH, … Stevens JS (2021). Thalamic volume and fear extinction interact to predict acute posttraumatic stress severity. Journal of Psychiatric Research, 141, 325–332. doi: 10.1016/j.jpsychires.2021.07.023 [DOI] [PMC free article] [PubMed] [Google Scholar]
- Stewart SH, Pihl RO, Conrod PJ, & Dongier M (1998). Functional associations among trauma, PTSD, and substance-related disorders. Addictive Behaviors, 23(6), 797–812. [DOI] [PubMed] [Google Scholar]
- Testa M, Livingston JA, & Hoffman JH (2007). Does sexual victimization predict subsequent alcohol consumption? A prospective study among a community sample of women. Addictive Behaviors, 32(12), 2926–2939. doi: 10.1016/j.addbeh.2007.05.017 [DOI] [PMC free article] [PubMed] [Google Scholar]
- Volpicelli J, Balaraman G, Hahn J, Wallace H, & Bux D (1999). The Role of uncontrollable trauma in the development of PTSD and alcohol addiction. Alcohol Research & Health, 23(4), 256. [PMC free article] [PubMed] [Google Scholar]
- Warren AM, Foreman ML, Bennett MM, Petrey LB, Reynolds M, Patel S, & Roden-Foreman K (2014). Posttraumatic stress disorder following traumatic injury at 6 months: associations with alcohol use and depression. Journal of Trauma and Acute Care Surgery, 76(2), 517–522. doi: 10.1097/ta.0000000000000110 [DOI] [PubMed] [Google Scholar]
- Weathers FW, Litz BT, Keane TM, Palmieri PA, Marx BP, & Schnurr PP (2013). The PTSD Checklist for DSM-5 (PCL-5). Scale available from the National Center for PTSD; at www.ptsd.va.gov. [Google Scholar]
- Wemm SE, & Sinha R (2019). Drug-induced stress responses and addiction risk and relapse. Neurobiology of Stress, 10, 100148. [DOI] [PMC free article] [PubMed] [Google Scholar]
- Wojciechowski TW (2019). Developmental trajectories of opioid use among juvenile offenders: An epidemiological examination of group characteristics and criminological risk factors. Substance Use & Misuse, 54(7), 1203–1213. doi: 10.1080/10826084.2019.1573837 [DOI] [PubMed] [Google Scholar]
- Ziobrowski HN, Kennedy CJ, Ustun B, House SL, Beaudoin FL, An X, … van Rooij SJH (2021). Development and validation of a model to predict posttraumatic stress disorder and major depression after a motor vehicle collision. JAMA Psychiatry, 78(11), 1228–1237. doi: 10.1001/jamapsychiatry.2021.2427 [DOI] [PMC free article] [PubMed] [Google Scholar]
Associated Data
This section collects any data citations, data availability statements, or supplementary materials included in this article.