Abstract
We examined whether activity of the nucleus basalis of Meynert (NBM) regulates regional cerebral cortical blood flow (rCBF) in mice, using laser speckle and laser Doppler flowmetry. In anesthetized mice, unilateral focal stimulation, either electrical or chemical, of the NBM increased rCBF of the ipsilateral cerebral cortex in the frontal, parietal and occipital lobes, independent of changes in systemic blood pressure. Most of vasodilative responses to low intensity stimuli (2 times threshold intensity: 2T) were abolished by atropine (a muscarinic cholinergic blocker), whereas responses to higher intensity stimuli (3T) were abolished by atropine and mecamylamine (a nicotinic cholinergic blocker). Blood flow changes were largest when the tip of the electrode was located within the area containing cholinergic neurons shown by choline acetyltransferase-immunocytochemistry. These results suggest that cholinergic projections from basal forebrain neurons in mice cause vasodilation in the ipsilateral cerebral cortex by a combination of muscarinic and nicotinic mechanisms, as previously found in rats and cats.
Keywords: Cerebral blood flow, Cholinergic neural pathways, Basal forebrain, Mouse
Introduction
Regulation of blood flow in the cerebral cortex by intracranial cholinergic nerves originating in the magnocellular nucleus of the basal forebrain [nucleus basalis of Meynert (NBM)] and projecting to the cerebral cortex has been first demonstrated in rats (see reviews in [1, 2]), and later in cats [3]. Properties of the vasodilative response were analyzed in detail in rats, since Biesold et al. [4] originally found it by means of laser Doppler flowmetry. This cholinergic vasodilative system, which operates by increasing extracellular ACh release, relies upon activation of both muscarinic and nicotinic cholinergic receptors in the parenchyma of the cortex. The increase in regional cerebral cortical blood flow (rCBF) elicited by this cholinergic vasodilative system is independent of systemic blood pressure and is not coupled to cortical metabolic rates [1, 2]. Focal stimulation of the unilateral NBM produces rCBF increase in frontal, parietal and occipital cortices ipsilateral to the stimulation site [5–7]. However, in cats, focal stimulation of the NBM increases regional blood flow in a restricted area of cerebral cortex in contrast to rats: focal electrical stimulation of the unilateral basal forebrain increased the rCBF of the ipsilateral primary somatosensory cortex that was increased by stimulation of the contralateral forepaw, without any change in blood pressure [3]. The response was the largest when the tip of the electrode was located within the area known to contain the basal forebrain neurons projecting to the primary somatosensory cortex.
Although similar cholinergic projections exist in the cerebral cortex of mice [8], to date it has not been determined whether they mediate vasodilation. Identification of cholinergic functions in normal mouse forebrain is of particular importance because this species is being used increasingly in studies to investigate the genetic control of normal and abnormal cholinergic system functioning [9–11].
Laser speckle flowmetry is useful to assess non-invasively two-dimensional rCBF in the widespread cortices with high temporal and spatial resolution. It has been shown that laser speckle flowmetry can image the spatiotemporal dynamics of rCBF changes all over the cortical surface in mice through an intact skull [12]. It is important to clarify whether activation of the NBM produces an increase in rCBF in widespread cortices (as observed in rats), or a restricted cortical area (as observed in cats). Therefore, in this study, we examined the effects of stimulation of the basal forebrain on rCBF in the frontal, parietal and occipital cortices in mice by making concurrent measurements using laser speckle, in addition to laser Doppler flowmetry.
Materials and methods
Experiments were performed on 18 adult male mice (C57BL/6NCr, 30–40 g). All animal experiments were conducted according to the Guidelines for Animal Experimentation prepared by the Animal Care and Use Committee of Tokyo Metropolitan Institute of Gerontology. General experimental procedures with regard to anesthesia, maintenance of respiration, body temperature and monitoring of systemic arterial blood pressure were similar to those described previously [13]. Animals were anesthetized with urethane (1.4 g/kg, intraperitoneally); additional doses were given subcutaneously or intravenously as required to maintain the plane of anesthesia, which was confirmed by the absence of withdrawal and corneal reflexes. The animals were artificially ventilated (Model SN-480-7; Shinano, Tokyo; or Minivent, Harvard, USA) via a tracheal cannula. Their rectal temperature was monitored and maintained at around 38°C. Systemic blood pressure was monitored via a cannula that was inserted into a femoral artery and connected to a pressure transducer.
Measurements of regional cerebral cortical blood flow
Animals were mounted in the prone position on a stereotaxic instrument (Narishige, Tokyo, Japan). In 9 mice, rCBF in the unilateral parietal cortex was measured by a laser Doppler flowmeter (ALF 21D; Advance, Tokyo) with a 0.8-mm-diameter probe placed on the surface of the parietal bone, cleared of periosteum, at about 2 mm lateral to the bregma.
In 7 mice, rCBF was measured by laser speckle contrast imaging (Moor Instruments, Devon, UK). The skin over the skull was removed, allowing the visualization of rCBF changes through the bone. The surface of the skull was covered with saline. The laser speckle contrast imaging device was then fixed, and the zoom was adjusted to cover the entire dorsal surface of the brain from the most anterior part of the olfactory bulbs to the most posterior aspect of the occipital cortex, as described previously [14]. The viewing field covered about 108 mm2 (12 × 9 mm) with a matrix of 152 × 113 pixels, giving an approximate resolution of 79 μm per pixel. Video images were displayed at 25 Hz with an exposure time of 4 ms and temporally smoothed with a time constant of 1 s. For later analysis, still images were acquired every 1 s (for electrical stimulation) or 6 s (for chemical stimulation) continuously during individual trials, providing 50 or 100 images over a period of 50 s or 10 min, respectively. The acquired images were then averaged over 5-s or 1-min time bins (5 or 10 images per time bin), leading to 10 averaged images. To quantify temporal rCBF changes (in arbitrary units), time courses were extracted in 6 regions of interest (ROI), including the frontal (AP = +0.5 to +2.0 mm from bregma, L = 0.5–2 mm to the midline according to [15]), parietal (AP = 0 to −1.5 mm, L = 1–2.5 mm), and occipital (AP = −2 to −3.5 mm, L = 1.5–3 mm) cortices bilaterally.
Stimulation of the NBM
An electrode, either monopolar (0.2-mm-diameter varnish-insulated tungsten wire, with an exposed sharp tip of 0.2 mm in length) or coaxial (0.1-mm outer diameter, USK-10; Unique Medical, Tokyo), was inserted into the unilateral NBM, after opening a parietal bone in an area of 1 mm in diameter. A 1-cm bare tungsten wire used as the stimulating “return” for the monopolar electrode was inserted into the temporal muscle. The stimulated area was typically located 0.9–1.0 mm posterior to the bregma, 2.0–2.4 mm lateral to the midline, and 3.5–4.2 mm vertical under the bregma height. Focal electrical stimulation of the NBM was performed by means of a stimulator (SEN-7203; Nihon Kohden, Tokyo) and stimulus isolation unit (SS-202J; Nihon Kohden). DC current (50 μA) was applied for 30–60 s at the end of every experiment to localize the stimulated site.
For chemical stimulation, a small needle (31 gauge) was inserted into the NBM. Through the needle, 5–12.5 nmol of sodium l-glutamate in 10–25 nl (Wako Pure Chemicals, Osaka, Japan) was microinjected for a period of 1 min by means of an infusion pump (KD310 Plus; KD Scientific, USA). The same volume of Evans Blue dye was administered at the end of the experiment to localize the injection site.
Mice were killed by injection of an overdose of pentobarbital. The brains were removed, and histological verification of the tip position of the stimulating electrode was carried out using frozen transverse brain sections, each 30–50 μm thickness. Stimulation sites were identified using a mouse brain atlas [15].
Drugs
Cholinergic receptor antagonists were administered intravenously through a femoral venous catheter. Atropine (atropine sulfate; Sigma, USA) at 10 mg/kg, was administered as a muscarinic cholinergic receptor antagonist. Mecamylamine (mecamylamine hydrochloride; Sigma) at 10–20 mg/kg was used as a nicotinic cholinergic receptor antagonist.
Immunohistochemistry
Two mice without stimulating electrode implants were deeply anesthetized with pentobarbital and perfused transcardially with phosphate-buffered saline (about 20 ml) followed by 4% paraformaldehyde solution (about 50 ml). The brains were removed and post-fixed with the same fixative for 2 h then stored in phosphate-buffered saline over night, at 4°C. Coronal sections of brain were cut at 40 μm using a Vibratome. Two sections about 0.9 mm posterior to the bregma were immunostained in each mouse. After endogenous peroxidase activity was blocked, sections were subsequently incubated with antiserum against choline acetyltransferase (ChAT; 1:1,000, rabbit anti-ChAT polyclonal antibody; Chemicon, USA) for 48–72 h, horseradish peroxidase-conjugated secondary antibody (MAX-PO, Histofine Simple Stain; Nichirei, Japan) for 2 h. The marker enzyme was visualized by incubating sections with diaminobenzidine. In each mouse, a subset of alternate sections was processed with the omission of the primary antiserum as a control immunostain. The immunohistochemical reactions were negative in the control immunostains. Sections were observed under a light microscope equipped with a digital camera.
Statistical analysis
Data are expressed as the mean ± SEM and were analyzed using one-way repeated-measures ANOVA followed by Dunnett’s multiple comparison test, or the Kruskal–Wallis test followed by Dunn’s multiple comparison test. A p value of <0.05 was considered to be statistically significant.
Results
Spatio-temporal changes in cortical blood flow
Focal electrical stimulation (50 μA, 50 Hz, 10 s) of the NBM produced an increase in rCBF in widespread areas of the cerebral cortex, whereas rCBF in the olfactory bulb was not affected, as shown in laser speckle flow images (Fig. 1c, d). Blood flow changes were obvious in the cortices ipsilateral to the site of stimulation, whereas only marginal, transient increases were seen in the contralateral cortices as shown in blood flow traces (Fig. 1e–k). Among the ipsilateral cortices, a predominant change in rCBF was observed in the frontal and parietal cortices, where rCBF usually started to increase within a few seconds after the onset of stimulation and reached a maximum about 10 s later, and then gradually returned to the prestimulus value taking about 20–30 s after the end of stimulation (Fig. 1h, j). Systemic blood pressure was unchanged (Fig. 1m). The responses of rCBF were reproducible in successive trials on the same animal. Similar results were obtained in all 4 mice tested. In those mice, the maximum increase of rCBF in the ipsilateral frontal, parietal and occipital cortices were 24 ± 3, 30 ± 6 and 10 ± 1%, respectively, when measured at 0–5 s after the end of stimulation (Fig. 2d–f). There were no significant differences in the response of rCBF between the frontal and parietal cortices. However, the response in the frontal or parietal cortex was significantly larger than that in the occipital cortex (p < 0.05). The responses in the contralateral side were much smaller than those in the ipsilateral side, in all three cortices (Fig. 2, compare a–c with d–f). Blood pressure was not significantly influenced.
Fig. 1.
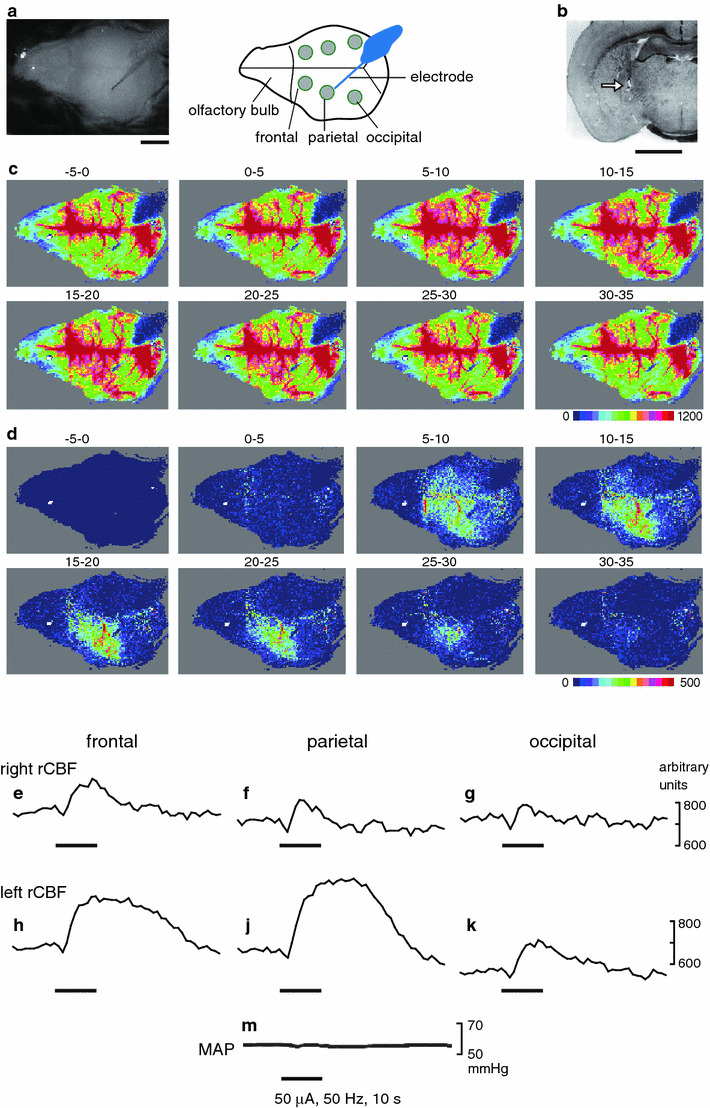
Spatio-temporal changes in rCBF evoked by focal electrical stimulation of the left NBM in an anesthetized mouse obtained by laser speckle flowmetry. Electrical stimulation of the basal forebrain (0.9 mm posterior to the bregma, 2 mm lateral to the midline, 4 mm vertical under the bregma height, as indicated in (b) was carried out at 50 μA, 0.5 ms, 50 Hz, for 10 s. a Normal photo image (left) and diagram (right) of the viewing field, which is the entire dorsal surface of the brain with the olfactory bulb to the left side of each image and the occipital cortex to the right side of each image. b Specimen slice of a coronal section of brain on the left side 0.9 mm posterior to the bregma showing the position of the tip of the stimulating electrode (arrow). Scale bars in (a, b) represent 2 mm. c Averaged flow images over selected periods of 5 s, as indicated above each image (stimulus onset was set as time 0). d Differential signal change subtracting the baseline control signal (−5 to 0 s) from subsequent images. rCBF trace in the frontal (e, h), parietal (f, j) and occipital (g, k) cortices contralateral (e–g) and ipsilateral (h, j, k) to the site of stimulation, extracted from the ROIs indicated by the gray circles in (a). m Mean arterial pressure (MAP) simultaneously recorded
Fig. 2.
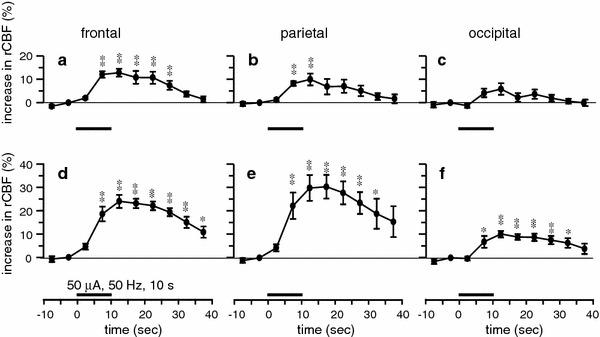
Summary of the responses of rCBF induced by focal electrical stimulation of the unilateral NBM (50 μA, 0.5 ms, 50 Hz, 10 s) obtained by laser speckle flowmetry. rCBF changes during the 50-s trial averaged every 5 s in the frontal (a, d), parietal (b, e) and occipital (c, f) cortices, contralateral (a–c) and ipsilateral (d–f) to the site of stimulation, expressed as the percentage increase from the prestimulus control rCBF (n = 8 in 4 mice). *p < 0.05, **p < 0.01 by one-way repeated-measures ANOVA followed by Dunnett’s multiple comparison test
In the case of the response produced by lower intensity stimuli (10–20 μA, 50 Hz, 10 s, n = 5 trials in 3 rats), there were no significant differences in the response of rCBF between the three different cortices (the maximum increase of rCBF in the ipsilateral frontal, parietal and occipital cortices measured at 5–10 s after the end of stimulation were 12 ± 1, 13 ± 3 and 9 ± 2%, respectively).
Stimulation of the NBM with a microinjection of l-glutamate (5–12.5 nmol/10–25 nl) for 1 min also produced a significant increase in rCBF in widespread areas of the cerebral cortex ipsilateral to the site of stimulation (Fig. 3d–f). However, rCBF in the contralateral side was not significantly affected (Fig. 3a–c). The responses of rCBF were reproducible in successive trials on the same animal. In an individual mouse, rCBF usually started to increase after the end of injection, and was maximal between 3 and 6 min post-injection, and then gradually returned to prestimulation levels after more than 3 min. The maximum increase of rCBF in the ipsilateral frontal, parietal and occipital cortices in 4 mice were 6 ± 2, 7 ± 2 and 8 ± 3%, respectively, when measured at 5–6 min after the end of injection (Fig. 3d–f). There were no significant differences in the response of rCBF between the three different cortices. Blood pressure was not significantly influenced. The injection of the same volume of vehicle (phosphate-buffered saline) into the NBM did not produce any significant changes in rCBF.
Fig. 3.
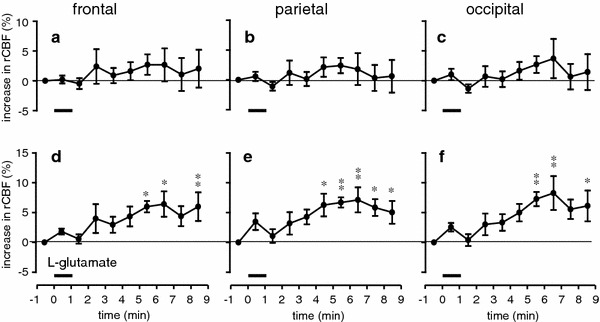
Summary of the responses of rCBF following microinjection of l-glutamate (5–12.5 nmol/10–25 nl) into the unilateral NBM obtained by laser speckle flowmetry. rCBF changes during the 10-min trial averaged every 1 min in the frontal (a, d), parietal (b, e) and occipital (c, f) cortices, contralateral (a–c) and ipsilateral (d–f) to the site of stimulation, expressed as the percentage increase from the prestimulus control rCBF (n = 7 in 4 mice). *p < 0.05, **p < 0.01 by one-way repeated-measures ANOVA followed by Dunnett’s multiple comparison test
Dependence on stimulus parameters
The relations of stimulus current, frequency, and duration to rCBF responses in the parietal cortex were examined in 8 mice, by means of either laser speckle (2 mice) or laser Doppler (6 mice) flowmetry. No differences in any of the measures were found across the two different methods, therefore all data were pooled. When stimulation was applied at a constant frequency of 50 Hz for 10 s (0.5 ms pulse duration), stimulation with currents lower than 10 μA elicited no effect, but stimulation with 25–100 μA produced clear intensity-dependent increases in blood flow (Fig. 4a). Systemic blood pressure was occasionally changed slightly (decreased or increased), but the rCBF response was independent of changes in blood pressure. In half the mice tested, stimulation with 10 μA elicited clear rCBF increase. However, when summarized in 8 mice, significant response was obtained with stimulation above 20 μA (Fig. 4b).
Fig. 4.
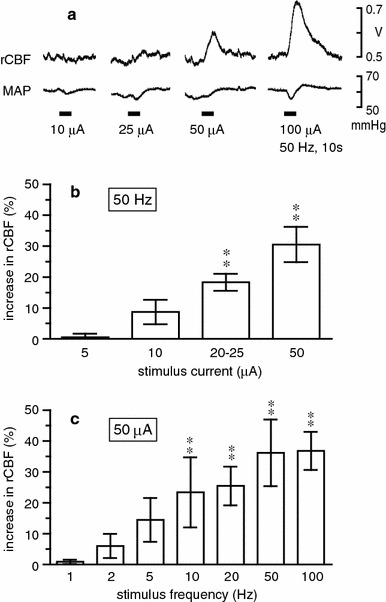
Changes in rCBF in the parietal cortex ipsilateral to the stimulated NBM. a Sample recordings of rCBF obtained by laser Doppler flowmetry and mean arterial pressure (MAP) in a mouse. b, c Summarized responses of rCBF measured at maximum level and expressed as the percentage increase from the prestimulus control rCBF. Each column and vertical bar shows the mean ± SEM (n = 8). Data depict blood flow changes measured by laser Doppler (n = 6) or laser speckle (n = 2) flowmetry. **p < 0.01; significantly different from prestimulus control rCBF by one-way repeated-measures ANOVA followed by Dunnett’s multiple comparison test
When stimulation was applied at a constant current of 50 μA for 10 s, stimulation at 1–5 Hz elicited no significant effect, but there were frequency-dependent increases in rCBF at 10–100 Hz (Fig. 4c). Responses to 200 Hz stimulation were usually smaller than those to 100 Hz (tested in 6 mice). When the duration of the stimulus train was altered (1–60 s), we found that stimulation with 50 μA at 50 Hz produced a small increase in rCBF by stimulation even when applied for 1 s, and the magnitude of the blood flow changes increased with increasing train durations, reaching its maximum with 10–30 s stimulation (data not shown).
Effects of cholinergic blockers
Repetitive electrical stimulation at 50 Hz was delivered (0.5 ms pulse duration, 10 s stimulus train) at various intensities. We increased the stimulus intensity in 5-μA steps. When rCBF response started to appear in the parietal cortex, the intensity of stimulation was defined as threshold (T). Threshold was between 10 and 25 μA in all 8 mice tested. The maximum increases in cortical rCBF at 2T, 3T and 5T stimulation reached levels that were 23 ± 3, 30 ± 8 and 51 ± 12% above the prestimulus basal rCBF, respectively. We examined the changes in rCBF to NBM stimulation at intensities of 2T, 3T, and 5T before and 20–30 min after each drug administration. The time interval between the administration of drug was usually 50 min. Basal rCBF did not change significantly in response to any drug’s administration. The NBM stimulation-induced increase in rCBF was reduced by atropine administration (10 mg/kg, i.v.). The rCBF responses of 2T, 3T and 5T following injection of atropine were much smaller, increasing by 10 ± 3, 22 ± 5 and 38 ± 9% over the prestimulus basal rCBF, respectively (Fig. 5). Residual responses at 2T, 3T and 5T were further reduced by administration of mecamylamine (10–20 mg/kg, i.v.) plus atropine, increasing by 6 ± 2, 10 ± 2 and 18 ± 5% over the prestimulus basal rCBF, respectively (Fig. 5). The NBM stimulation-induced increase in rCBF at 2T was significantly reduced by atropine administration. However, the response at 3T was significantly reduced only after administration of mecamylamine plus atropine. The reduction of rCBF response at 5T was not significant even after administration of mecamylamine plus atropine.
Fig. 5.
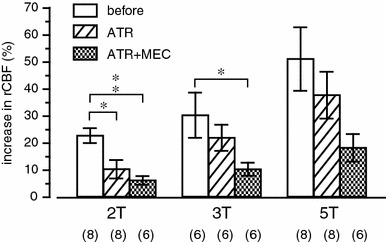
The effects of muscarinic and nicotinic cholinergic receptor blockers (ATR atropine, MEC mecamylamine) on the rCBF response in the parietal cortex induced by stimulation of the NBM (0.5 ms, 50 Hz, for 10 s). Summarized responses of rCBF measured at maximum level and expressed as percentage increase from the prestimulus control rCBF (n = 6 or 8, shown in parentheses). Data depict blood flow changes measured by laser Doppler (n = 6) or laser speckle (n = 2) flowmetry. *p < 0.05, **p < 0.01; significantly different from control response before injection of cholinergic receptor blockers by the Kruskal–Wallis test followed by Dunn’s multiple comparison test
Dependence on stimulated areas
We examined the effect of electrical stimulation (50 μA, 0.5 ms, 50 Hz) for 10 s to various areas at 0.5 mm, 0.9 mm (the usual antero-posterior coordinate) and 1.3 mm posterior to the bregma, and at 0.4-mm increments in the medio-lateral and dorso-ventral axes on blood flow in the parietal cortex in 4 mice. The response of blood flow was the largest when stimulus trains were applied at locations straddling the border between the globus pallidus and the internal capsule, invading both these structures (Fig. 6a). We confirmed the existence of ChAT-immunoreactive neurons at these locations. ChAT-immunoreactive neurons were scattered widely in the basal forebrain, but mainly located in the medial and ventral portion of the globus pallidus and interstitially between the fiber bundles of the internal capsule (Fig. 6b).
Fig. 6.
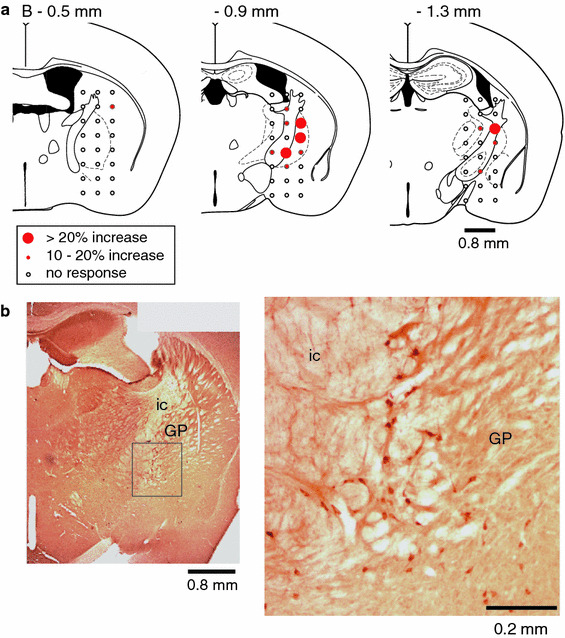
a Diagrams of 3 different coronal sections of mouse brain showing the relationship between stimulating sites and rCBF responses in the parietal cortex with brain electrical stimulation (50 μA, 0.5 ms, 50 Hz, for 10 s). The diagram depicts slices 0.5, 0.9 and 1.3 mm posterior to the bregma, with 24 stimulating sites shown in each slice. Filled circles indicate stimulation sites that led to increased rCBF, and the size of circles represents the magnitude of the responses. Open circles indicate no significant response. All data were summarized from the results of 4 mice. b Photomicrographs illustrating ChAT-immunostained neurons in the NBM. GP globus pallidus, ic internal capsule
Discussion
The basal forebrain contains a population of large cholinergic neurons sending axons to the cerebral cortex in many species [16]. Experiments in rats revealed that stimulation of the NBM produces an increase in rCBF in the cerebral cortex independent of changes in both systemic blood pressure and regional metabolism [1, 2]. It has been shown using laser Doppler flowmetry [5] and [14C]iodoantipyrine [6, 7] that vasodilation in response to basal forebrain stimulation is produced in the frontal, parietal and occipital cortices. The present results demonstrate with laser speckle flowmetry for the first time that focal stimulation, either electrical or chemical, of the NBM produces an increase in rCBF in mice in widespread cerebral cortical areas, and that these changes are independent of changes in systemic arterial pressure.
In the present study, the rCBF response during stimulation of the NBM was similar to that observed in rats in most aspects, including response magnitude and time course, as well as stimulus strength dependence and frequency dependence of the response, laterality with responses being produced predominantly in the ipsilateral cortex, and contribution of both muscarinic and nicotinic receptors [4]. These findings suggest that the cerebral vasodilation as a result of electrical stimulation of the NBM is attributed mostly to increased release of acetylcholine from the cholinergic projecting systems to the cortex originating in the NBM.
The retrograde transport experiments in rats [17, 18] and cats [19] revealed that basal forebrain projections to the parietal cortex arise from neurons that are scattered widely in the ipsilateral basal forebrain, but mainly located in the medial and ventral portion of the globus pallidus and interstitially between the fiber bundles of the internal capsule. Stimulation in this area produced the largest changes in rCBF in our mice, and blood flow increases were reduced by muscarinic and nicotinic receptor antagonists. Finally, our immunocytochemical experiments confirmed a high density of large neurons containing choline acetyltransferase in this region of the basal forebrain as reported previously in mice [8], suggesting that a significant portion of this projection is cholinergic, resembling reported projections in rats [4, 20, 21]. It is interesting that most of the blood flow change induced by low intensity stimulation was reduced by atropine, but the addition of mecamylamine was necessary to reduce changes caused by larger stimuli. These larger stimuli are likely to activate a greater number of cholinergic (and perhaps non-cholinergic) projection neurons, suggesting that different parts of the projection preferentially target muscarinic or nicotinic elements. This is a complex issue that may well benefit from additional studies in mice that can employ specific genetic mutations to help unravel the cholinergic receptor pharmacology of the cerebral vasculature.
When the rCBF responses in the ipsilateral frontal, parietal and occipital cortices following either electrical or chemical stimulation of the NBM were compared, there were some differences. Firstly, time course of the blood flow responses to glutamate injection was markedly different from those to the electrical stimulation. This result is similar to the previous report in rats that the maximum flow response was sometimes observed 10–20 min after glutamate injection [5]. The reason for slow peak latency following focal glutamate injection may be related to the fact that cholinergic neurons in the NBM are scattered widely in the basal forebrain of rats and mice (see Fig. 6). Focally injected glutamate would diffuse around the site of injection, and then would gradually recruit excitation of many cell bodies of the vasodilator fibers. Secondly, responses to glutamate and lower intensity electrical stimuli showed no significant differences between the sites of the recording, whereas those to higher intensity electrical stimuli were larger in the frontal and parietal cortex than those in the occipital cortex. These results indicate that the cell bodies of the vasodilator fibers are located in the site where we had injected glutamate and the tip of the stimulus electrode. The higher intensity stimuli may cause excitation of passing fibers going to the frontal and parietal cortices, in addition to activating neuronal soma. This consideration is well in accord with our results that the response was more sensitive to cholinergic blockers when stimulus intensity was lower.
Blood flow is important for every tissue, especially for the brain that is vulnerable to even transient disturbance of its blood supply. NBM stimulation-induced vasodilatation in parenchymal microvessels results in protection against delayed neuronal death following transient ischemia in the rat’s cerebral cortex [22–24]. In mice, nicotine treatment [25] or voluntary exercise [26] reduced amyloid load in transgenic models of Alzheimer’s disease. In these studies, however, cerebral blood flow was not measured. Since such pharmacological and physiological stimuli can activate NBM [2, 27], the present increase in rCBF would contribute to the reduction of beta amyloidosis by facilitating clearance of beta-amyloid.
Acknowledgment
We thank Ms Chieko Kanai for her help in the immunohistochemical study.
References
- 1.Sato A, Sato Y. Regulation of regional cerebral blood flow by cholinergic fibers originating in the basal forebrain. Neurosci Res. 1992;14:242–274. doi: 10.1016/0168-0102(92)90071-J. [DOI] [PubMed] [Google Scholar]
- 2.Sato A, Sato Y. Cholinergic neural regulation of regional cerebral blood flow. Alzheimer Dis Assoc Disord. 1995;9:28–38. doi: 10.1097/00002093-199505000-00007. [DOI] [PubMed] [Google Scholar]
- 3.Hotta H, Uchida S, Shiba K. Cerebral cortical blood flow response during basal forebrain stimulation in cats. Neuroreport. 2007;18:809–812. doi: 10.1097/WNR.0b013e3280d9e9ce. [DOI] [PubMed] [Google Scholar]
- 4.Biesold D, Inanami O, Sato A, Sato Y. Stimulation of the nucleus basalis of Meynert increases cerebral cortical blood flow in rats. Neurosci Lett. 1989;98:39–44. doi: 10.1016/0304-3940(89)90370-4. [DOI] [PubMed] [Google Scholar]
- 5.Adachi T, Biesold D, Inanami O, Sato A. Stimulation of the nucleus basalis of Meynert and substantia innominata produces widespread increases in cerebral blood flow in the frontal, parietal and occipital cortices. Brain Res. 1990;514:163–166. doi: 10.1016/0006-8993(90)90452-H. [DOI] [PubMed] [Google Scholar]
- 6.Adachi T, Inanami O, Ohno K, Sato A. Responses of regional cerebral blood flow following focal electrical stimulation of the nucleus basalis of Meynert and the medial septum using the [14C]iodoantipyrine method in rats. Neurosci Lett. 1990;112:263–268. doi: 10.1016/0304-3940(90)90214-T. [DOI] [PubMed] [Google Scholar]
- 7.Vaucher E, Borredon J, Seylaz J, Lacombe P. Autoradiographic distribution of cerebral blood flow increases elicited by stimulation of the nucleus basalis magnocellularis in the unanesthetized rat. Brain Res. 1995;691:57–68. doi: 10.1016/0006-8993(95)00601-L. [DOI] [PubMed] [Google Scholar]
- 8.Kitt CA, Höhmann C, Coyle JT, Price DL. Cholinergic innervation of mouse forebrain structures. J Comp Neurol. 1994;341:117–129. doi: 10.1002/cne.903410110. [DOI] [PubMed] [Google Scholar]
- 9.Chen KS, Nishimura MC, Armanini MP, Crowley C, Spencer SD, Phillips HS. Disruption of a single allele of the nerve growth factor gene results in atrophy of basal forebrain cholinergic neurons and memory deficits. J Neurosci. 1997;17:7288–7296. doi: 10.1523/JNEUROSCI.17-19-07288.1997. [DOI] [PMC free article] [PubMed] [Google Scholar]
- 10.Greferath U, Bennie A, Kourakis A, Bartlett PF, Murphy M, Barrett GL. Enlarged cholinergic forebrain neurons and improved spatial learning in p75 knockout mice. Eur J Neurosci. 2000;12:885–893. doi: 10.1046/j.1460-9568.2000.00976.x. [DOI] [PubMed] [Google Scholar]
- 11.Fragkouli A, Hearn C, Errington M, Cooke S, Grigoriou M, Bliss T, Stylianopoulou F, Pachnis V. Loss of forebrain cholinergic neurons and impairment in spatial learning and memory in LHX7-deficient mice. Eur J Neurosci. 2005;21:2923–2938. doi: 10.1111/j.1460-9568.2005.04141.x. [DOI] [PubMed] [Google Scholar]
- 12.Ayata C, Dunn AK, Gursoy-Ozdemir Y, Huang Z, Boas DA, Moskowitz MA. Laser speckle flowmetry for the study of cerebrovascular physiology in normal and ischemic mouse cortex. J Cereb Blood Flow Metab. 2004;24:744–755. doi: 10.1097/01.WCB.0000122745.72175.D5. [DOI] [PubMed] [Google Scholar]
- 13.Engel BT, Sato A, Sato Y. Responses of sympathetic nerves innervating blood vessels in interscapular, brown adipose tissue and skin during cold stimulation in anesthetized C57BL/6J mice. Jpn J Physiol. 1992;42:549–559. doi: 10.2170/jjphysiol.42.549. [DOI] [PubMed] [Google Scholar]
- 14.Piché M, Uchida S, Hara S, Aikawa Y, Hotta H. Modulation of somatosensory-evoked cortical blood flow changes by GABAergic inhibition of the nucleus basalis of Meynert in urethane-anaesthetized rats. J Physiol. 2010;588:2163–2171. doi: 10.1113/jphysiol.2010.187633. [DOI] [PMC free article] [PubMed] [Google Scholar]
- 15.Franklin KBJ, Paxinos G. The mouse brain in stereotaxic coordinates. New York: Elsevier; 2008. [Google Scholar]
- 16.Nieuwenhuys R, Voogd J, van Huijzen CHR. The human central nervous system. 3. Berlin: Springer; 1988. [Google Scholar]
- 17.Bigl V, Woolf NJ, Butcher LL. Cholinergic projections from the basal forebrain to frontal, parietal, temporal, occipital, and cingulate cortices: a combined fluorescent tracer and acetylcholinesterase analysis. Brain Res Bull. 1982;8:727–749. doi: 10.1016/0361-9230(82)90101-0. [DOI] [PubMed] [Google Scholar]
- 18.Baskerville KA, Chang HT, Herron P. Topography of cholinergic afferents from the nucleus basalis of Meynert to representational areas of sensorimotor cortices in the rat. J Comp Neurol. 1993;335:552–562. doi: 10.1002/cne.903350407. [DOI] [PubMed] [Google Scholar]
- 19.Barstad KE, Bear MF. Basal forebrain projections to somatosensory cortex in the cat. J Neurophysiol. 1990;64:1223–1232. doi: 10.1152/jn.1990.64.4.1223. [DOI] [PubMed] [Google Scholar]
- 20.Arneric SP. Basal forebrain neurons modulate cortical cerebral blood flow: increases by nicotinic cholinergic mechanisms. J Cereb Blood Flow Metab. 1989;9:S502. [Google Scholar]
- 21.Lacombe P, Sercombe R, Verrecchia C, Philipson V, MacKenzie ET, Seylaz J. Cortical blood flow increases induced by stimulation of the substantia innominata in the unanesthetized rat. Brain Res. 1989;491:1–14. doi: 10.1016/0006-8993(89)90083-8. [DOI] [PubMed] [Google Scholar]
- 22.Hotta H, Uchida S, Kagitani F. Effects of stimulating the nucleus basalis of Meynert on blood flow and delayed neuronal death following transient ischemia in the rat cerebral cortex. Jpn J Physiol. 2002;52:383–393. doi: 10.2170/jjphysiol.52.383. [DOI] [PubMed] [Google Scholar]
- 23.Hotta H, Kanai C, Uchida S, Kanda K. Stimulation of the nucleus basalis of Meynert increases diameter of the parenchymal blood vessels in the rat cerebral cortex. Neurosci Lett. 2004;358:103–106. doi: 10.1016/j.neulet.2004.01.010. [DOI] [PubMed] [Google Scholar]
- 24.Hotta H, Uchida S. Aging of the autonomic nervous system and possible improvements in autonomic activity using somatic afferent stimulation. Geriatr Gerontol Int. 2010;10(Suppl 1):S127–S136. doi: 10.1111/j.1447-0594.2010.00592.x. [DOI] [PubMed] [Google Scholar]
- 25.Nordberg A, Hellström-Lindahl E, Lee M, Johnson M, Mousavi M, Hall R, Perry E, Bednar I, Court J. Chronic nicotine treatment reduces beta-amyloidosis in the brain of a mouse model of Alzheimer’s disease (APPsw) J Neurochem. 2002;81:655–658. doi: 10.1046/j.1471-4159.2002.00874.x. [DOI] [PubMed] [Google Scholar]
- 26.Adlard PA, Perreau VM, Pop V, Cotman CW. Voluntary exercise decreases amyloid load in a transgenic model of Alzheimer’s disease. J Neurosci. 2005;25:4217–4221. doi: 10.1523/JNEUROSCI.0496-05.2005. [DOI] [PMC free article] [PubMed] [Google Scholar]
- 27.Uchida S, Hotta H. Cerebral cortical vasodilatation mediated by nicotinic cholinergic receptors: effects of old age and of chronic nicotine exposure. Biol Pharm Bull. 2009;32:341–344. doi: 10.1248/bpb.32.341. [DOI] [PubMed] [Google Scholar]


