Abstract
Throughout our investigations on the ontogenesis of the electrophysiological events in early embryonic chick hearts, using optical techniques to record membrane potential probed with voltage-sensitive dyes, we have introduced a novel concept of “functiogenesis” corresponding to “morphogenesis”. This article gives an account of the framework of “functiogenesis”, focusing on the cardiac pacemaker function and the functional organization of the pacemaking area.
Keywords: Functiogenesis, Voltage-sensitive dye, Early embryonic chick heart, Cardiac pacemaker potential, Pacemaking area, Optical technique
Introduction
Conventional physiology has dealt, primarily, with functions in completed living systems, as stated in standard textbooks of physiology. In the late 1970s, and the beginning of the 1980s, we introduced the idea of the ontogeny of electrophysiology and related functions associated with morphogenesis in the early embryo: a new combination of embryology and electrophysiology through our newly developed knowledge and technical skills with multiple-site optical recording of membrane potential using voltage-sensitive dyes (VSD) [1–3]: we later termed this interest “functiogenesis”, a coined word corresponding to “morphogenesis”: “functiogenesis” is the physiology of process (becoming) rather than state (being). Thus, “functiogenesis” is far more interesting than the stereotyped description of the growth of functions: it was intended to break through the conventional frameworks of physiology.
Functiogenetic approaches using VSD-optical recording has been a powerful method for complex functions such as heart and/or central nervous systems: it allows us to progressively analyze complex functional organization and architecture, in a manner reminiscent of the expansion of a complex function in a power series in mathematics, as a natural ontogenic progress.
We describe quasi-classically here, on the bases of our own original works, the functiogenesis of electrophysiological events, and of pacemaker activity in the cardiac primordia and the precontractile chick heart [see also reviews 2, 4].
Cardiac functiogenesis
Morphological characteristics and methodological problems
In the early phases of cardiogenesis of the chick embryo, paired cardiac primordia are brought together at the midline and begin to fuse with each other, progressively caudally at the 7-somite stage (corresponding to an incubation time of about 26–35 h) (Fig. 1). This process results in the formation of the primitive tubular heart in which first spontaneous beating appears at the middle period of the 9-somite stage: before this stage, contraction has not yet appeared in tubular hearts [5]. A review article by Patten [6] on the embryonic origin of the heart beat in vertebrate embryos appeared in Physiological Reviews, and is a comprehensive summary of earlier studies on the ontogenesis of cardiac functions.
Fig. 1.
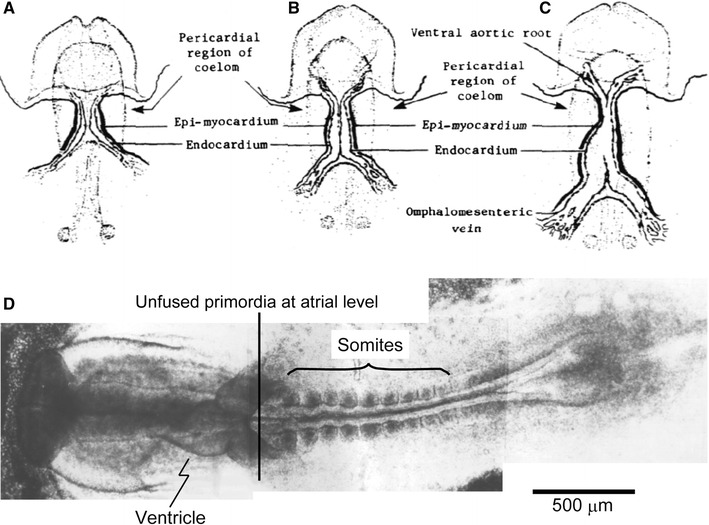
a–c Diagrammatic illustration of ventral view to show the origin and subsequent fusion of the paired primordia of the chick heart. a The 6- to early 7-somite stage; b the early 8-somite to early 9-somite stage; and c the 9-somite to 10-somite stage. d Photomontage of the ventral view of a chick embryo with 9 pairs of somites. Modified from Ref. [32]
In these very early embryonic developmental stages, because the cardiac primordium and primitive embryonic cells are extremely small, fragile, and possessed of non-specific topology, it is technically difficult or impossible to make experiments on these subjects by using conventional electrophysiological methods with microelectrodes, including even modern patch-clamp methods. For these reasons progress in the study of the embryonic origin (onset) of physiological function in cardiac tissue has been hampered.
In this situation, with the introduction of VSD-optical recording of membrane-potential activity, we were able to answer many of the questions that had plagued the earlier developmental physiologist for decades. As a consequence of this achievement, we also showed that the VSD-optical technique [2, 4, 7] is the optimal method for studying embryonic primitive hearts: it is important, therefore, to emphasize that “functiogenesis” of electrophysiology has been made possible by a breakthrough in the VSD-optical recording technology. In this context, we introduced multiple-site optical recording with VSDs as the leading principle.
Embryonic onset of cardiac electrophysiology
The Greek philosopher Aristotle already understood that “the heart is the first organ of the embryo to reach a functional state” more than two millennia ago [8]. However, on the bases of the results obtained using conventional electrophysiological measurements, Manasek, in Handbook of Physiology published in 1979 [9], tentatively concluded that the onset of electrical activity occurs at stage 10 of Hamburger–Hamilton (H–H) [10] (corresponding to the 10-somite stage, and to about 35 h of incubation). Afterwards, in 1987, introducing the VSD-optical monitoring technique, we first recorded spontaneous electrical activity in the pre-fused cardiac primordium in 6-somite chick embryos [11] (Fig. 2).
Fig. 2.
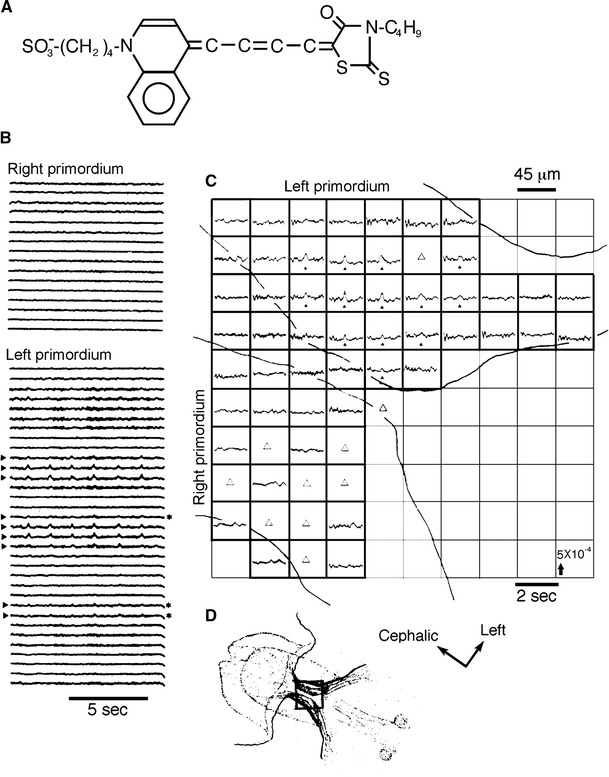
a Chemical structure of the voltage-sensitive merocyanine–rhodanine dye that we have been using (NK2761). b Optical recordings of spontaneous electrical activities from the pre-fused right and left cardiac primordia of a 6-somite chick embryo using 10 × 10-element photodiode array. The preparation was stained with NK2761, and each trace shows changes in transmission detected by one element at 37.1 °C. A 700 ± 11 nm interference filter was used. Nine traces obtained from the left primordium exhibit spike-signals which we attribute to spontaneous action potentials (indicated by arrowheads). Three traces showed very tiny signals (asterisks). Note that the signals appeared rhythmically and were nearly synchronized among the different positions where the signals were detected. No signals were detected from the right primordium. c Second representation of spontaneous electrical activity recorded simultaneously from many adjacent separate regions of primordial area in 6-somite embryo shown in a. Traces are arranged so that relative positions correspond to relative positions of regions of the heart imaged onto the detector. Here, very small but distinct optical signals were detected by 13 elements of the photodiode array (filled triangles). In some positions, output from amplifiers overflowed because of large fluctuation of baselines (open triangles). From examination of other portions of the recording, we think that no signals appeared in these areas. d Sketch of the 6-somite chick embryo. The square overlaid on the sketch is schematically indicating the size of the photodiode array relative to the size of the image of the cardiac primordial area, and shows the relative position of the photodiode array. The arrows with “Cephalic” and “Left” indicate the directions in the sketch. Modified from Ref. [11]
Although we suggested earlier that, in the embryonic chick heart, the spontaneous action potential would be generated initially during the middle period of the 7-somite stage of development, corresponding to the initiation of fusion of paired right and left primordia [12, 13], additional experiments indicated that this speculation was not reliable. As described above, the multiple-site optical recording method with a 100-element photodiode array detected spontaneous electrical activity in the pre-fused cardiac primordia at the 6- and early 7-somite stages, before the morphological formation of the heart. This finding was an epoch-making discovery for the study of cardiac functiogenesis [11].
The size of the VSD-optical action signals (optical action potentials) detected from the pre-fused cardiac primordium was very small, and the signal-to-noise ratio was smaller than 1.5:1–2.0:1. Nevertheless, the signals appeared rhythmically and were nearly synchronized among the different positions where the signals were detected. The optical signals related to spontaneous action potentials (spontaneous optical action potentials) in the early 7-somite prefused cardiac primordia seem to be somewhat larger than those observed at the 6-somite stage. In addition, in the 6-somite embryos, the signals were always detected from only one side of the primordia [11].
Furthermore, a remarkable finding was that spontaneous action potential-related signals (optical action potentials) occur rhythmically in the pre-fused cardiac primordium. This strongly suggests that the genesis of excitability, spontaneity, and rhythmicity appear to be inherently coupled in the cardiac primordium: it was thus deduced that pacemaking ability is incorporated by nature in the cardiac primordium. Further, the size of the optical action potentials obtained from the pre-fused cardiac primordium was often distinct, though very small, and the electrical activity appeared in a limited area. This result suggests that a few cells with very immature (not yet fully developed) electrical activity, differentiated in a limited area in the right or left cardiac primordium, before fusion begins [11].
Excitation spread in primitive tubular hearts
In precontractile primitive hearts of chick embryos, during the 6- to 9-somite stages, the size of optical action potentials and their area of spread increased dramatically [11].
Figure 3a shows an example of a simultaneous optical recording of a spontaneous action potential from 91 different contiguous regions of a 9-somite embryonic precontractile chick heart stained with a VSD (NK2761) using a 12 × 12-element photodiode array. The spontaneous optical action potentials are nearly synchronized among the different regions. Figure 3b demonstrates an example of a simultaneous multiple-site optical recording of spontaneous action potentials from 128 adjacent areas of the same preparation as that shown in Fig. 3a. The grid superimposed on the drawing of the heart in Fig. 3b indicates the relative size and position of the photodiode array elements, which correspond to positions of the optical signals measured simultaneously. In this recording, short delays between the signals are clearly recognized, and the action potential first appeared in position J8 (indicated by an arrowhead). Thus, it is likely that, in this heart, the pacemaking area was located at this position, and the excitatory wave spread over the entire region of the heart from this pacemaking area [14].
Fig. 3.
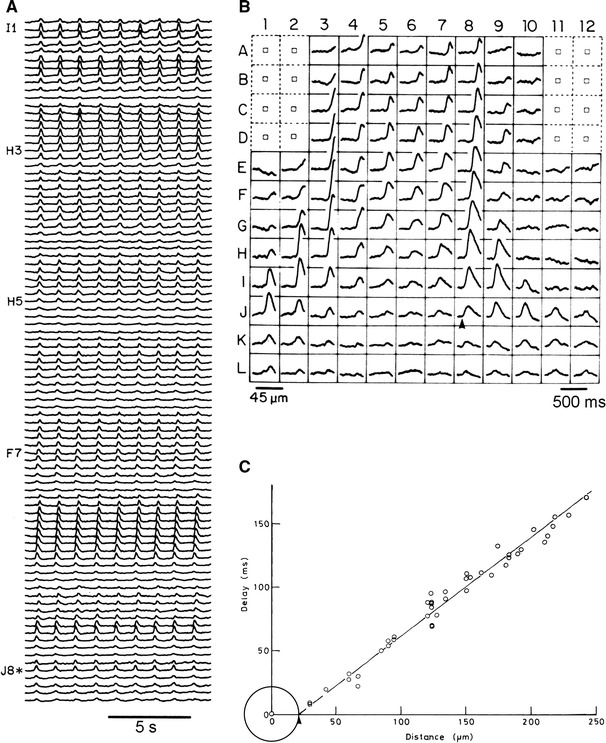
a Simultaneous optical recording of spontaneous action potential from 91 contiguous regions of a 9-somite embryonic precontractile chick heart, using a 12 × 12-element photodiode array. The preparation was stained with a merocyanine–rhodanine dye (NK2761), and each trace shows changes in transmission detected by one element at 36.6–37.5 °C. A 702 ± 13 nm interference filter was used. b Real-time optical recording of spontaneous action potentials from a 9-somite embryonic heart, using 128 photodiodes. This preparation was the same as that shown in a. Note the delays in the timing among the signals. The trace of the earliest signal(s) are indicated by an asterisk in a and by an arrowhead in b (position J8). c An example of graphical micro-survey method. The delays in the feet of the signals between the position of the first firing and other positions in which each signal was detected were plotted against the distance between the center of the first firing position and that of other positions. The circle on the origin with a radius of 21 μm shows the size of the pacemaking area of this preparation. Modified from Ref. [14]
Similar measurements were carried out on 7-, 8-, 9-, 10- and 11-somite embryonic hearts [15]. At the 7- and 8-somite stages, the initial optical action potentials were detected from various positions, such as the right and left ventricular and pre-fused atrial portions. They were usually first detected from the left atrial portion at the 9- to 10-somite stages and the left sinoatrial primordium at the 11-somite stage. It is thus concluded that at the 7- to 8-somite stages, the location of the pacemaker was not uniquely determined, and was situated randomly in various positions, such as the left and right ventricular and atrial portions, and, as development proceeds to the 9-somite stage, the pacemaker area becomes localized in the left preatrial portion. Subsequently, the pacemaker area shifts caudally along the atrium to the sinus primordium at the 11-somite stage.
Pacemaking area and excitation spreading
Using multiple-site optical recording, we assessed the size of the pacemaking area with the following procedure [14]. We measured the delays in the feet of the signals between the position of the first firing and other positions in which each signal was detected, and the delays were plotted against the distance from the center of the firing position of the grid. An example of the results is shown in Fig. 3c. This relationship between the delay and the distance indicates that the excitation spreads over the heart radially and at a uniform rate, from the pacemaking site. In this graph, from the slope of the straight line, the conduction velocity was calculated to be about 1.3 mm/s in this heart; we extrapolated the straight line at the distance axis, and as a result, the extrapolated value of approximately 21 μm was obtained (indicated by an arrowhead). This graphical characteristic indicates that, in this heart, the pacemaking area is circular in shape, and that this extrapolated value on the distance axis corresponds to the radius of the circular pacemaking area. Therefore, the pacemaking area in this heart was calculated to be about 1500 μm2. We have named such a procedure the “graphical micro-survey method” of the pacemaking area [14].
Using this method, we also compared the sizes of the pacemaking areas among 100 preparations during the 8- to 9-somite stages. The mean radius was 25.2 ± 5.3 μm for the 8-somite stage (35 preparations), and 24.9 ± 5.1 μm for the 9-somite stage (65 preparations). At the 8- to 9-somite stages, the size of the pacemaking area was estimated to be 1200–3000 μm2. These results suggest that, although the size of the heart increases gradually throughout the 8- to 9-somite stages, the size of the pacemaking area does not increase [14].
Here, in the 7- to 9-somite embryonic chick hearts, the myocardial cells nearly form a monolayer, and, since the diameter of the cells is about 5 μm [16–18], the pacemaker in early embryonic chick hearts is probably composed of 60–150 cells. It is thus strongly implied that, not a single cell, but a population of cells having pacemaker ability serves as a rhythm generator in the heart, and that these cells form a strong functional syncytium [14]. As a consequence, it is implied that the functionally organized group consists of pacemaker cells, which are the rhythm generator, and is located dramatically in the right sinus primordium from the atrium, as development proceeds from the 7-somite to the 11-somite stage [15]. This is surely the ontogenetic process of the functional organization of the cardiac pacemaking area.
On the other hand, the spontaneous optical action potentials spread widely at a uniform velocity over the entire area of the primitive tubular heart in the shape of concentric circles from the pacemaking area [14]. Accordingly, it is important to emphasize that no specific conduction systems are yet differentiated in early developmental chick hearts, and that there is electrical coupling among heart cells even in the early stage of cardiogenesis. Also, the slow conduction velocity of the excitation-spread reflects the fact that the electrical coupling among the early embryonic heart cells is very weak, though they are uniformly distributed.
Early embryonic rhythm
As described above, rhythmicity in recurrence of spontaneous action potentials is evident in the pre-fused cardiac primordium at the 6-somite stage, and during the 7-somite to 8-somite stages, the rhythm is labile, but is stably organized by the early period of the 9-somite stage [11, 19], just before the first rhythmical contraction [5]. Corresponding to such a process, the rhythm of the spontaneous action potentials is increased in frequency as development proceeds from the 6-somite to the 9-somite stages [5, 13, 15, 20].
Regional rhythm gradient
When an early embryonic primitive tubular heart was microsurgically separated into right and left or anterior and posterior parts, the spontaneous action potential synchrony between the two separated halves was blocked, although the synchrony and the intrinsic rhythmicity of the spontaneous action potential recurrence remains in each part [21].
Similar to these experimental results, in the congenital double heart, which was formed by a block of fusion of the right and left cardiac primordia, and developed independently in each half-heart, rhythmical spontaneous action potentials were detected from both the right and left hearts, and differences were detected in their rhythm. Usually, the frequency in the right half-heart was slower than that in left half-heart [22, 23].
Using cultured double- and multiple-heart embryos, we examined regional differences of rhythmicity in more detail. The multiple-heart embryos were produced by whole embryo culture of 1- to 6-somite embryonic hearts in which the tissue of anterior intestinal portal was microsurgically cut into two, or several shreds. In this case, embryos having two or four to six hearts were obtained [24, 25].
In these double- and multiple-heart embryos, regional differences in the rhythmicity were observed. In the fragmented hearts produced in the anterior portion, irregular spontaneous action potentials appeared, and in the fragmented hearts produced in the left posterior position, the most rhythmical spontaneous action potentials were detected in the great majority of the multiple-heart embryos [24, 25].
These results clearly show that there is a regional gradient in the ability to generate electrical rhythmicity in the early phases of cardiogenesis, and suggest that the rhythmicity is highest in the left posterior portion of the early precontractile heart.
As described before, we note that the regional pacemaking priority is very labile in early embryonic hearts at the 7- to 8-somite stage of development and, later, as the development proceeds to the 9-somite stage, it becomes stable and the pacemaking area confined to left pre-atrial tissue as a result of the developmental increase in a regional gradient of pacemaker activity, i.e., special gradient of inherent rhythmicity. Such a process would be summarized as following four steps: (1) maturation of spontaneous active pacemaker cells which have their own inherent rhythmicity in the cardiac primordia; (2) formation of the regional gradient of rhythmicity and emergence of the regional priority of the pacemaking function: at this stage the regional gradient of rhythmicity is very small and the regional priority of pacemaker function is unstable; (3) developmental increase in the regional gradient of rhythmicity results in the functional organization of a single pacemaking area; and (4) localization of the pacemaking area [14, 15, 20, 26].
This developmental sequence appears to provide an example of the scheme of formation of order from instability, which often appears in biological systems, and of functional self-organization both in time and in space. In this case, time corresponds to the development of rhythmicity, and space to the localization of the pacemaking area. This event is shown as a phase diagram, which is named a Kamino diagram (Fig. 4) [25].
Fig. 4.
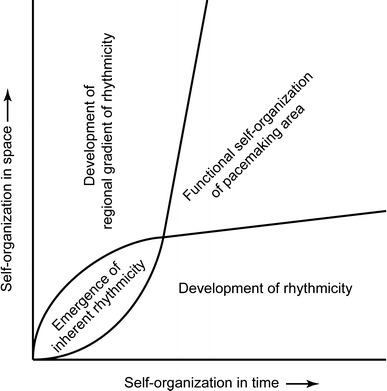
A phase diagram (Kamino diagram) of functional self-organization of the rhythmicity and the pacemaking area of the early embryonic heart. From Ref. [25]
Pacemaker potential
The correlation between development of rhythm generation and development of pacemaker potential is of physiological interest. In the 8- to 9-somite embryonic precontractile primitive tubular hearts, optical signals resembling the pacemaker type action potential with a slow (diastolic) depolarization phase (i.e., optical pacemaker potential) are detected from the pacemaking area and its near neighbors [19, 26]. The slope of the slow depolarization phase is largest in the pacemaking area, and it decreases gradually towards the periphery. In mature cardiac physiology, it is known that the heart rate is determined by the slope of the diastolic depolarization phase (e.g., Weidmann [27]). In the same way, it is shown that early development of heart rate is coupled with development of the slope of the slow depolarization phase [19, 26, 28, 29].
The maximum slope of the slow depolarization also increases as development proceeds, and is related to the early developmental increase in the heart rate [26]. On the other hand, the regional gradient of the slope of the slow depolarization phase is increased as development proceeds [26]. Those results precisely suggest that formation of a gradient in pacemaker activity results in the morphological and functional organization of the pacemaking area in the early phases of cardiogenesis. Furthermore, in the 7- to 8-somite embryonic primitive heart, the regional lability of the pacemaking area is produced by fluctuations in the tiny slope of the slow depolarization phase.
The events in generation of spontaneous rhythmic electrical activity (i.e., pacemaking function) in early phases of cardiogenesis of chick embryo are summarized in Fig. 5.
Fig. 5.
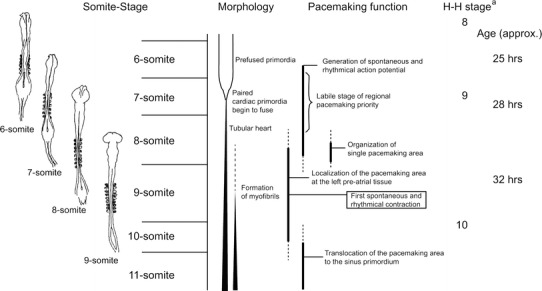
Representation of events in generation of spontaneous rhythmic electrical activity (i.e., pacemaking function) in early phases of cardiogenesis of chick embryo. The ventral views of the chick embryos in 6- to 9-somite stages are shown on the left. aHamburger and Hamilton [H–H, Ref. 10]
Supplemental consideration
In the early developing chick hearts, the temporal origin of generation of morphology and function is not absolutely determined with physical time-scaling of the incubation, because of individual differences among preparations. On the other hand, there is a direct correspondence between the number of pairs of somites and morphological and physiological generations. Thus, the number of pairs of the somite stage is indicated as the time-scale within the biological dimension in the early embryonic process: in this biological time-scaling, there are generally not individual differences in ontogenetic emergence times in the morphological and physiological events [2].
Accordingly, morphogenesis and functiogenesis are closely coupled. In addition, it is shown that in the 6- to early 8-somite stages, the early development of morphogenesis proceeds symmetrically about the median line of the embryo. In the same fashion, the development of function, e.g., electrical activity, also proceeds symmetrically on the right-to-left axis. In contrast, in the later 8- and 9-somite stages, the pacemaker function is asymmetrical, and becomes dominant on the left side [11, 14, 15, 26], while morphological development of the right side of the tubular heart proceeds at a different rate [30, 31]. In other words, around the 8-somite stage of the chick embryo, the symmetry of the primitive tubular heart is broken. Consequently, the asymmetrical developmental progression of the tubular heart, with “morphogenesis-functiogenesis coupling”, results in the localization of the pacemaking area in the primitive atrial tissue [15] and further proceeds to reside in the sinoatrial primordium tissue [30, 31]. Eventually, this process organizes the sinoatrial node, forming its complex topology.
Thus, we have described, phenomenologically, “morphogenesis-functiogenesis coupling” in the early embryonic tubular heart. Genesis of the structural factor would stand between “morphogenesis” and “functiogenesis”. This is a future problem in the triple conjugation among “morphogenesis”-“structural-genesis”-“functiogenesis”. For this study, a novel experimental methodology is needed. It is not developed in the present step.
The concept of “functiogenesis” described above in this article consequently proceeded to the ontogenesis of excitation–contraction coupling [5, see also review 32], initial heart beat [33], and hemodynamics in the tubular heart [34]. Furthermore, this concept has been generalized further in respect to “functiogenesis of the central nervous system”, as methodology and as strategy [35, see also reviews 36, 37]. The concept of “functiogenesis” should give useful tips for research on systems physiology.
Acknowledgments
The experiments on the embryonic hearts were carried out in collaboration with many members in the laboratory in Tokyo Medical and Dental University. We are grateful to Brian Salzberg for his improvement of the English version.
Abbreviations
- VSD
Voltage-sensitive dye
- H–H
Hamburger and Hamilton
Compliance with ethical standards
Conflict of interest
The authors declare that there are no conflicts of interest.
References
- 1.Cohen LB, Salzberg BM. Optical measurement of membrane potential. Rev Physiol Biochem Pharmacol. 1978;83:35–88. doi: 10.1007/3-540-08907-1_2. [DOI] [PubMed] [Google Scholar]
- 2.Kamino K. Optical approaches to ontogeny of electrical activity and related functional organization during early heart development. Physiol Rev. 1991;71:53–91. doi: 10.1152/physrev.1991.71.1.53. [DOI] [PubMed] [Google Scholar]
- 3.Kamino K. Personal recollections: regarding the pioneer days of optical recording of membrane potential using voltage-sensitive dyes. Neurophotonics. 2015;2:021002-1-9. doi: 10.1117/1.NPh.2.2.021002. [DOI] [PMC free article] [PubMed] [Google Scholar]
- 4.Kamino K. Optical studies of early developing cardiac and neural activities using voltage-sensitive dyes. Jpn J Physiol. 1990;40:443–461. doi: 10.2170/jjphysiol.40.443. [DOI] [PubMed] [Google Scholar]
- 5.Hirota A, Kamino K, Komuro H, Sakai T, Yada T. Optical studies of excitation-contraction coupling in the early embryonic chick heart. J Physiol Lond. 1985;366:89–106. doi: 10.1113/jphysiol.1985.sp015786. [DOI] [PMC free article] [PubMed] [Google Scholar]
- 6.Patten BM. Initiation and early changes in the character of the heart beat in vertebrate embryos. Physiol Rev. 1949;29:31–47. doi: 10.1152/physrev.1949.29.1.31. [DOI] [PubMed] [Google Scholar]
- 7.Sakai T, Kamino K. Optical mapping approaches to cardiac electrophysiological functions. Jpn J Physiol. 2001;51:1–18. doi: 10.2170/jjphysiol.51.1. [DOI] [PubMed] [Google Scholar]
- 8.Thomson W. The work of Aristotle. Clarendon: Oxford; 1910. [Google Scholar]
- 9.Manasek FJ (1980) Organization, interactions, and environment of heart cell during myocardial ontogeny. In: Berne RM, Sperelakis N, Geiner SR (eds) Handbook of physiology sect 2, The cardiovascular system vol 1. The heart. Williams and Wikins, Baltimore, pp 29–42
- 10.Hamburger V, Hamilton HL. A series of normal stages in the development of the chick embryo. J Morphol. 1951;88:49–92. doi: 10.1002/jmor.1050880104. [DOI] [PubMed] [Google Scholar]
- 11.Hirota A, Kamino K, Komuro H, Sakai T. Mapping of early development of electrical activity in the embryonic chick heart using multiple-site optical recording. J Physiol Lond. 1987;383:711–728. doi: 10.1113/jphysiol.1987.sp016437. [DOI] [PMC free article] [PubMed] [Google Scholar]
- 12.Fujii S, Hirota A, Kamino K. Optical signals from early embryonic chick heart stained with potential sensitive dyes: evidence for electrical activity. J Physiol Lond. 1980;304:503–518. doi: 10.1113/jphysiol.1980.sp013339. [DOI] [PMC free article] [PubMed] [Google Scholar]
- 13.Fujii S, Hirota A, Kamino K. Optical recording of development of electrical activity in embryonic chick heart during early phases of cardiogenesis. J Physiol Lond. 1981;311:147–160. doi: 10.1113/jphysiol.1981.sp013578. [DOI] [PMC free article] [PubMed] [Google Scholar]
- 14.Kamino K, Komuro H, Sakai T, Hirota A. Functional pacemaking area in the early embryonic chick heart assessed by simultaneous multiple-site optical recording of spontaneous action potentials. J Gen Physiol. 1988;91:573–591. doi: 10.1085/jgp.91.4.573. [DOI] [PMC free article] [PubMed] [Google Scholar]
- 15.Kamino K, Hirota A, Fujii S. Localization of pacemaking activity in early embryonic heart monitored using voltage-sensitive dye. Nat Lond. 1981;290:595–597. doi: 10.1038/290595a0. [DOI] [PubMed] [Google Scholar]
- 16.Manasek FJ. Embryonic development of the heart. I. A light and electron microscopic study of myocardial development in the early chick embryo. J Morphol. 1968;125:329–366. doi: 10.1002/jmor.1051250306. [DOI] [PubMed] [Google Scholar]
- 17.Ojeda JL, Hurle JM. Establishment of the tubular heart role of cell death. In: Pexieder T, editor. Perspectives in cardiovascular research. Mechanism of cardiac morphogenesis and teratogenesis. New York: Raven; 1981. pp. 101–113. [Google Scholar]
- 18.Hiruma T, Hirakow R. An ultrastructual topographical study on myofibrillogenesis in the heart of chick embryo during pulsation onset period. Anat Embryol. 1985;172:325–329. doi: 10.1007/BF00318980. [DOI] [PubMed] [Google Scholar]
- 19.Fujii S, Hirota A, Kamino K. Optical indications of pace-maker potential and rhythm generation in early embryonic chick heart. J Physiol Lond. 1981;312:253–263. doi: 10.1113/jphysiol.1981.sp013627. [DOI] [PMC free article] [PubMed] [Google Scholar]
- 20.Sakai T, Hirota A, Fujii S, Kamino K. Flexibility of regional pacemaking priority in early embryonic heart monitored by simultaneous optical recording of action potentials from multiple sites. Jpn J Physiol. 1983;33:337–350. doi: 10.2170/jjphysiol.33.337. [DOI] [PubMed] [Google Scholar]
- 21.Fujii S, Hirota A, Kamino K. Action potential synchrony in embryonic precontractile chick heart: optical monitoring with potentiometric dyes. J Physiol Lond. 1981;319:529–541. doi: 10.1113/jphysiol.1981.sp013924. [DOI] [PMC free article] [PubMed] [Google Scholar]
- 22.Fujii S, Sakai T, Hirota A, Kamino K. Optical recording of the pacemaking activity of a congenital double-heart in an early chick embryo. Dev Growth Differ. 1983;25:193–200. doi: 10.1111/j.1440-169X.1983.00193.x. [DOI] [PubMed] [Google Scholar]
- 23.Hirota A, Fujii S, Sakai T, Kamino K. Optical recording of spontaneous action potentials from the congenital chick embryonic pre-contractile double-heart. Proc Jpn Acad Ser B. 1984;60:281–284. doi: 10.2183/pjab.60.281. [DOI] [Google Scholar]
- 24.Yada T, Sakai T, Komuro H, Hirota A, Kamino K. Development of electrical rhythmic activity in early embryonic cultured chick double-heart monitored optically with a voltage-sensitive dye. Dev Biol. 1985;110:455–466. doi: 10.1016/0012-1606(85)90103-4. [DOI] [PubMed] [Google Scholar]
- 25.Sakai T, Yada T, Hirota A, Komuro H, Kamino K. A regional gradient of cardiac intrinsic rhythmicity depicted in embryonic cultured multiple hearts. Pflüger Arch-Eur J Physiol. 1998;437:61–69. doi: 10.1007/s004240050747. [DOI] [PubMed] [Google Scholar]
- 26.Kamino K, Komuro H, Sakai T. Regional gradient of pacemaker activity in the early embryonic chick heart monitored by multisite optical recording. J Physiol Lond. 1988;402:301–314. doi: 10.1113/jphysiol.1988.sp017205. [DOI] [PMC free article] [PubMed] [Google Scholar]
- 27.Weidmann S. Electrical constants of trabecular muscle from mammalian heart. J Physiol Lond. 1970;210:1041–1054. doi: 10.1113/jphysiol.1970.sp009256. [DOI] [PMC free article] [PubMed] [Google Scholar]
- 28.Hirota A, Fujii S, Sakai T, Kamino K. Temperature dependence of spontaneous electrical activity in early embryonic heart monitored optically with a potential-sensitive dye. Jpn J Physiol. 1983;33:85–100. doi: 10.2170/jjphysiol.33.85. [DOI] [PubMed] [Google Scholar]
- 29.Sakai T, Fujii S, Hirota A, Kamino K. Optical evidence for calcium-action potentials in early embryonic precontractile chick heart using a potential-sensitive dye. J Membr Biol. 1983;72:205–212. doi: 10.1007/BF01870587. [DOI] [PubMed] [Google Scholar]
- 30.Stalsberg H, DeHaan RL. Precardiac areas and formation of the tubular heart in the chick embryo. Dev Biol. 1969;19:128–159. doi: 10.1016/0012-1606(69)90052-9. [DOI] [PubMed] [Google Scholar]
- 31.Patten BM. Early embryology of the chick. New York: McGraw-Hill; 1971. pp. 113–138. [Google Scholar]
- 32.Kamino K, Hirota A, Komuro H. Optical indication of electrical activity and excitation-contraction coupling in the early embryonic heart. Adv Biophys. 1989;25:45–93. doi: 10.1016/0065-227X(89)90004-X. [DOI] [PubMed] [Google Scholar]
- 33.Sakai T, Hirota A, Kamino K. Video-imaging assessment of initial beating patterns of the early embryonic chick heart. Jpn J Physiol. 1996;46:465–472. doi: 10.2170/jjphysiol.46.465. [DOI] [PubMed] [Google Scholar]
- 34.Sakai T. Video-imaging visualization of blood flow dynamics in early chick embryo. Jpn J Physiol. 2003;53:385–388. doi: 10.2170/jjphysiol.53.385. [DOI] [PubMed] [Google Scholar]
- 35.Kamino K, Katoh Y, Komuro H, Sato K. Multiple-site optical monitoring of neural activity evoked by vagus nerve stimulation in the embryonic chick brainstem. J Physiol Lond. 1989;409:263–283. doi: 10.1113/jphysiol.1989.sp017496. [DOI] [PMC free article] [PubMed] [Google Scholar]
- 36.Momose-Sato Y, Sato K, Kamino K. Optical approaches to embryonic development of neural functions in the brainstem. Prog Neurobiol. 2001;63:151–197. doi: 10.1016/S0301-0082(00)00023-X. [DOI] [PubMed] [Google Scholar]
- 37.Momose-Sato Y, Sato K, Kamino K. Monitoring population membrane potential signals during development of the vertebrate nervous system. In: Carpenter M, Zecevic D, Bernus O, editors. Membrane potential imaging in the nervous system and heart. New York: Springer; 2015. pp. 213–242. [DOI] [PubMed] [Google Scholar]


