Abstract
The present study evaluated the effects of exercise training on pyruvate carboxylase protein (PCB) levels in hepatic tissue and glucose homeostasis control in obese mice. Swiss mice were distributed into three groups: control mice (CTL), fed a standard rodent chow; diet-induced obesity (DIO), fed an obesity-inducing diet; and a third group, which also received an obesity-inducing diet, but was subjected to an exercise training protocol (DIO + EXE). Protocol training was carried out for 1 h/d, 5 d/wk, for 8 weeks, performed at an intensity of 60% of exhaustion velocity. An insulin tolerance test (ITT) was performed in the last experimental week. Twenty-four hours after the last physical exercise session, the animals were euthanized and the liver was harvested for molecular analysis. Firstly, DIO mice showed increased epididymal fat and serum glucose and these results were accompanied by increased PCB and decreased p-Akt in hepatic tissue. On the other hand, physical exercise was able to increase the performance of the mice and attenuate PCB levels and hyperglycemia in DIO + EXE mice. The above findings show that physical exercise seems to be able to regulate hyperglycemia in obese mice, suggesting the participation of PCB, which was enhanced in the obese condition and attenuated after a treadmill running protocol. This is the first study to be aimed at the role of exercise training in hepatic PCB levels, which may be a novel mechanism that can collaborate to reduce the development of hyperglycemia and type 2 diabetes in DIO mice.
Keywords: Obesity, Type 2 diabetes, Physical exercise, PCB, Hyperglycemia
Introduction
Obesity is a global public health problem directly associated with different metabolic disorders. In obese individuals, an obesogenic environment leads to adipose tissue accumulation and a chronic, low-grade inflammatory state, impairing intracellular insulin signaling. All of these factors result in insulin resistance and the development of type 2 diabetes (DM2) [1–3].
Insulin resistance is directly related to disturbances in glucose homeostasis, which contribute to increased blood glucose in the fasting and fed states, mainly through increased gluconeogenesis [4, 5]. The enzymes involved in this process, phosphoenolpyruvate carboxykinase (PEPCK) (EC 4.1.1.32) and glucose-6-phosphatase (G6Pase) (EC 3.1.3.9), are regulated by transcription factors, but recent rodent studies have shown that during fasting, these enzymes are not associated with hyperglycemia as strongly as is pyruvate carboxylase protein (PCB) (EC 6.4.1.1) in models of DM2 [6–8].
PCB acts on the first step of the gluconeogenic pathway, converting pyruvate to oxaloacetate inside mitochondria and also responding to acetyl-CoA levels [9]. The relevance of PCB protein to glucose homeostasis control has been proven through its inhibition, wherein animals showed a decrease in blood glucose, attenuated hepatic glucose production and reduced development of hepatic steatosis, even after being fed a high-fat diet [6]. Moreover, PCB inhibition with antisense oligonucleotide (ASO) is also associated with improved insulin sensitivity, contributing to suppression of hepatic glucose production.
In this context, recent studies have shown a significant link between the benefits of physical exercise to hepatic metabolism and health in obesity models, but these mechanisms are not fully understood [10–16]. Physical exercise is able to act on molecular interactions either acutely or chronically, improving liver insulin sensitivity in both animal models and obese humans [10–13]. Thus, obese nondiabetic subjects showed defects in the regulation of hepatic glucose production; however, 7 days of cycling physical exercise at 70% VO2peak improved insulin sensitivity in obese individuals [17, 18]. Moreover, in response to exercise the improvement in insulin sensitivity could culminate in a reduction of hepatic glucose production. Although these studies demonstrate exercise efficacy on liver insulin resistance and glucose homeostasis control, it is necessary to understand how this strategy can modulate PCB levels. For this reason, we investigated how exercise can modulate hepatic PCB protein and glycemic control in obese insulin resistant mice subjected to an exercise training program.
Methods
Experimental animals
Male, 4-week-old Swiss mice (Mus musculus) (15–20 g), were allowed access to a standard rodent chow diet and a high-fat diet (HFD) for 8 weeks. After obesity induction, these animals were distributed into three experimental groups for an additional 8 weeks: lean sedentary mice fed with standard rodent chow diet (CTL, n = 7), high-fat diet-induced obese sedentary mice (DIO, n = 10) and DIO mice subjected to exercise training (DIO-EXE, n = 10). The standard commercial diet (Presence®) contained approximately 5% fat from soybean oil and provided 3.4 kcal/g. The high-fat diet (PragSoluções®) contained approximately 36% fat from coconut oil and provided 5.5 kcal/g (Table 1). The mice were housed in individual cages at 21 ± 2 °C, on a 12-h light/dark cycle, and the body weights of the experimental groups were registered weekly. At the end of the experimental period, animals were anesthetized (chlorohydrate of ketamine, 50 mg/kg, ketamine, Parke-Davis, Ann Arbor, MI and xylazine, 20 mg/kg, Rompun, Bayer, Leverkusen) and euthanized by decapitation. The experimental procedures were approved by the Ethics Committee on Animal Use, Campinas University State — UNICAMP (no. 2805-1).
Table 1.
Composition of experimental diets (g/100 g)
| Commercial chow | High-fat diet | |
|---|---|---|
| Fata | 5.0 | 35.8 |
| Protein | 22.0 | 23.0 |
| Carbohydrate | 51.5 | 34.5 |
| Total kcal | 339 | 552.2 |
aCommercial chow was composed of only soybean oil, and the high-fat diet was composed of 2.5% soybean oil and 33.35% coconut oil
Incremental load test
First, mice were adapted to the exercise on a motor treadmill (AVS Projetos®, São Carlos, São Paulo, Brazil). After 2 days, the animals were subjected to an incremental load test. The initial test intensity was 6 m/min at a 0% grade, with increments of 3 m/min every 3 min until exhaustion. Exhaustion occurred after the animals reached the end of the treadmill 5 times. The exhaustion velocity (EV) was measured at the exhaustion point of the test and 60% of EV was determined as the exercise training intensity [19].
Exercise training
The exercise training lasted 8 weeks. However, it was divided into two phases: phase 1 (Ph1) consisted of 4 weeks during which the physical exercise volume was gradually increased; during phase 2 (Ph2), the physical exercise volume from the last week (Ph1) was used for the next 4 weeks. Each experimental week consisted of 5 consecutive days of physical exercise training and 2 days of rest. The exercise training began after induction of obesity using a high-fat diet. In total, the experiment lasted 16 weeks. To compensate for the performance gain during the physical exercise protocol, the incremental load test was performed at the beginning of Ph1, at the beginning of Ph2 and at the end of Ph2, adjusting the EV percentage for the 8 weeks (Fig. 1).
Fig. 1.

Experimental protocol representation of the treatments, physiological tests and molecular analysis 24 h after exercise
Intraperitoneal insulin tolerance test (ITTip) and serum analyses
To evaluate whole body insulin sensitivity, the test was performed before and after treatment with specific diets and exercise training. Thus, after 24 h of the last exercise training session and 6 h of fasting, a set of control (lean), DIO, and DIO-EXE mice was submitted to an ITTip (1.5 U/kg body weight−1 of insulin) (n = 7–10 per group). The insulin was injected intraperitoneally (i.p.) and blood samples were collected at 0, 5, 10, 15, 20, 25 and 30 min from the tail for serum glucose determination. The rate constant for plasma glucose disappearance (kITT) was calculated using the formula 0.693/biological half-life (t 1/2). The plasma glucose t 1/2 was calculated from the slope of least square analysis of the plasma glucose concentration during the linear phase of decline.
The serum analyses were performed 24 h after the last exercise training session and 6 h of fasting (n = 7–10 per group). Fasting glucose was determined in blood samples from tails using a glucometer (Accu-Chek; Roche Diagnostics) to determine glucose concentration. From blood samples, plasma was separated by centrifugation at 1100 g for 15 min at 4 °C and stored at −80 °C for subsequent analysis. To measure fasting insulin, radioimmunoassay (RIA) was performed according to previous studies [20]. Next, serum free fatty acid (FFA) levels were analyzed by the colorimetric method, using a commercial kit (Laborlab®, São Paulo, Brazil).
Liver extractions and immunoblotting analysis
After the physiological tests all animals were submitted to another day of treadmill exercise and they were anesthetized with intraperitoneal injection of chlorohydrate of ketamine (50 mg/kg, ketamine, Parke-Davis, Ann Arbor, MI) and xylazine (20 mg/kg, Rompun, Bayer, Leverkusen). After this, the corneal reflexes were verified and assured. Thereafter, the mice were injected with human insulin (10 U/kg body wt Humulin R; Lilly, Indianapolis, IN) or saline intraperitoneally, and 10 min later the liver was rapidly removed and snap-frozen in liquid nitrogen and stored at −80 °C until analysis. The tissue was homogenized in extraction buffer (1% Triton-X 100, 100 mM Tris (pH 7.4), 100 mM sodium pyrophosphate, 100 mM sodium fluoride, 10 mM EDTA, 10 mM sodium vanadate, 2 mM PMSF and 0.1 mg of aprotinin/ml) at 4 °C with a Bead Ruptor 12 Homogenizer (OMNI®) operated at maximum speed for 60 s. The lysates were centrifuged (Eppendorf® 5804R) at 11,000 rpm (12,851 g) at 4 °C for 15 min to remove insoluble material, and the supernatant was used for the assay. The protein content was determined according to the bicinchoninic acid method [21]. The samples were applied to a polyacrylamide gel for separation by SDS-PAGE and transferred to nitrocellulose membranes. The blots were blocked with 5% dry milk at room temperature for 1 h and then incubated with primary antibodies against anti-PCB (sc-271493), anti-phospho-Akt [ser 473] (sc-33437), anti-Akt (sc-8312), anti-PEPCK (sc-271204), anti-G6Pase (sc-398155), anti-GAPDH (sc-25778), and anti-β-actin (sc-47778) from Santa Cruz Biotechnology, Inc., Santa Cruz, CA. Thereafter, a specific secondary antibody was used, according to the primary antibody. The specific bands were labeled by chemiluminescence and visualization was performed by exposure of the membranes to RX-films (Kodak®). The bands were quantified by their areas using optical densitometry. The images of protein bands were acquired by the C-DiGit™Blot Scanner (LI-CORR, Lincoln, Nebraska, USA) and quantified using the software UN-SCAN-IT gel 6.1.
Statistical analysis
All results were presented as the mean ± standard error of the mean (SEM). The Gaussian distribution of the data was assessed using a Shapiro–Wilk W test, and analyzed by Student’s t-test for parametric data, then the Mann–Whitney test for non-parametric data. Two-way ANOVA (with repeated measures when appropriate), with Tukey’s correction for multiple comparison, was used for parametric data and Kruskal–Wallis followed by Dunn’s multiple correction test for non-parametric data. The level of statistical significance used was p < 0.05. The construction of the graphics and the statistical analysis were performed using GraphPad Prism 5.0®.
Results
Performance during the 8-week exercise training protocol
During the 8 weeks of exercise training, it was expected that performance would increase. Therefore, three incremental load tests were performed to adjust the workload to 60% of EV after 4 and 8 weeks of treadmill exercise. The first test was performed before the beginning of the physical exercise protocol, the second after 4 weeks of running at 60% of EV (with increasing volume) and the third at the end of 8 weeks of running at 60% of EV (60 min duration). The table in Fig. 2a represents the individual change at 60% EV of each animal during the three steps. Figure 2b, c show the EV and total distance run in the same three incremental load tests performed during the physical exercise protocol. The highest speed and total distance are significantly higher in the last test, demonstrating a performance gain after 8 weeks of the physical exercise protocol.
Fig. 2.
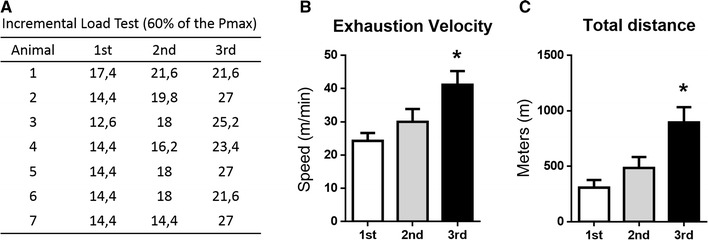
Performance gain during 8 weeks of physical exercise training in the DIO-EXE group. a Table showing the individual 60% load of exhaustion velocity (EV) of each animal (in m/min) after the three incremental tests. b Incremental load test speed reached in the 1st, 2nd and 3rd incremental load tests. c Total distance reached at the same three incremental load tests. Bars represent mean and SEM of DIO-EXE mice (n = 7) in each test. *p < 0.05 versus 1st test
Body mass and epididymal fat variation
Mice fed a high-fat diet showed an increase in body weight and epididymal fat when compared with the control group (Fig. 3a–c). These results demonstrate the effectiveness of the high-fat diet at inducing obesity. On the other hand, obese mice subjected to exercise training (DIO + EXE) showed a significant reduction in body weight compared with the control obese group (DIO). In addition, exercise training was able to reduce epididymal fat compared with the DIO group (Fig. 3a–c).
Fig. 3.
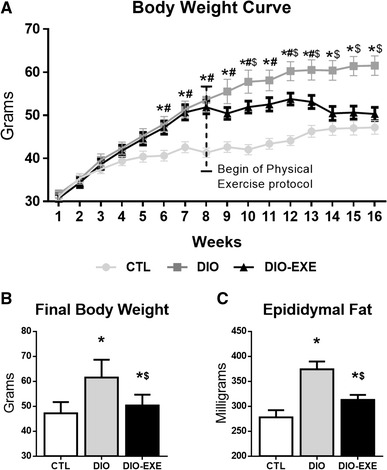
Physiological parameters of control (CTL), obese (DIO) and trained obese (DIO-EXE) groups. a Body weight curve during 16 weeks. b Final body weight at the end of 16 weeks. c Epididymal weight. Bars represent means and SEM of CTL, DIO and DIO-EXE mice (n = 7–10). *p < 0.05 for CTL versus DIO group; # p < 0.05 for CTL versus DIO-EXE group; $ p < 0.05 for DIO versus DIO-EXE group
Insulin sensitivity, serum FFAs, fasting glycemia and insulinemia
At the end of the experiment the insulin tolerance test was performed. The DIO group showed decreased whole body insulin sensitivity, through kITT, when it was compared to the CTL group. Meanwhile, the DIO-EXE group did not have statistically significant reduction in kITT (versus CTL), indicating a protective effect of physical exercise (Fig. 4a, b). Further, evaluation of fasting FFAs, glycemia and insulinemia indicated these variables increase in response to high-fat diet treatment (DIO group), while physical exercise attenuates such changes (DIO-EXE) (Fig. 4a–e).
Fig. 4.
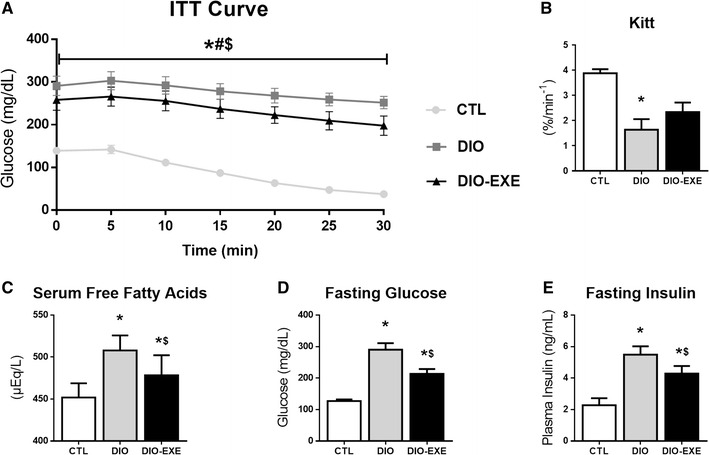
Metabolic parameters of control (CTL), obese (DIO) and trained obese (DIO-EXE) groups. a Insulin tolerance test curve. b Rate constant of plasma glucose disappearance (KITT) in the insulin tolerance test curve. c Serum free fatty acids after 6 h of fasting. d Fasting glucose after 6 h of fasting collected from tail blood. e Fasting Insulin after 6 h of fasting measured in plasma. Bars represent means and SEM of CTL, DIO and DIO-EXE mice (n = 7–10). *p < 0.05 for CTL versus DIO group; # p < 0.05 for CTL versus DIO-EXE group; $ p < 0.05 for DIO versus DIO-EXE group
PCB levels, gluconeogenic enzymes and insulin signaling in the liver
To evaluate the insulin resistant condition, the animals received an intraperitoneal insulin injection, and we quantified Akt phosphorylation in hepatic tissue. The DIO group had higher levels of PCB (Fig. 5a). Moreover, the DIO group had reduced Akt phosphorylation (Fig. 5d) and PEPCK (Fig. 5b), with no changes in G6Pase protein levels (Fig. 5c). However, after performing 8 weeks of treadmill exercise (Fig. 1: experimental protocol), the DIO-EXE group presented reduced hepatic PCB levels (Fig. 5e). Furthermore, physical exercise did not change G6Pase protein content (Fig. 5g) nor phosphorylation of Akt (Fig. 5h) in obese mice. Finally, obese trained mice had reduced PEPCK levels (Fig. 5f).
Fig. 5.
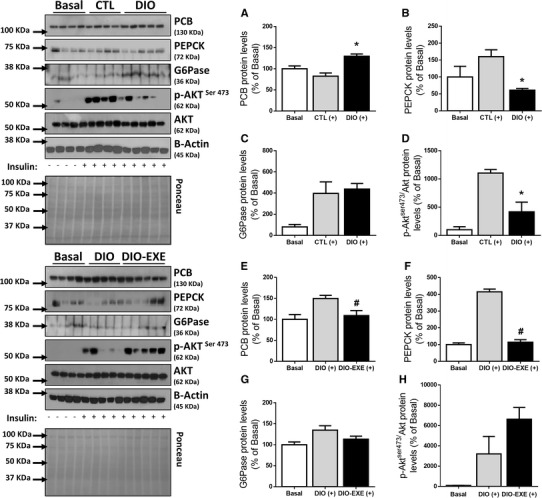
Hepatic PCB, gluconeogenic enzymes and Akt phosphorylation of control (CTL), obese (DIO) and trained obese (DIO-EXE) groups. Liver extracts with saline or insulin stimulus. a PCB levels of insulin-stimulated CTL (+) (n = 4) and DIO (+) group (n = 5). b PEPCK levels of insulin-stimulated CTL (+) (n = 4) and DIO (+) group (n = 5). c G6Pase levels of insulin-stimulated CTL (+) (n = 4) and DIO (+) group (n = 5). d p-Akt normalized to total Akt of insulin-stimulated CTL (+) (n = 4) and DIO (+) group (n = 5). e PCB levels of insulin-stimulated DIO (+) (n = 5) and DIO-EXE (+) group (n = 5). f PEPCK levels of insulin-stimulated DIO (+) (n = 5) and DIO-EXE (+) group (n = 5). g G6Pase levels of insulin-stimulated DIO (+) (n = 5) and DIO-EXE (+) group (n = 5). h p-Akt normalized to total Akt of insulin-stimulated DIO (+) (n = 5) and DIO-EXE (+) group (n = 5). Basal = control group for drug administration, used as mechanistic control for insulin injection, not included for statistical analysis. Bars represent means and SEM of 4–5 mice. *p < 0.05 for CTL (+) versus DIO (+); # p < 0.05 for DIO (+) versus DIO-EXE (+)
Discussion
Hepatic glucose production is essential to the maintenance of glycemic homeostasis as well as the direct action of insulin in the liver, muscle, adipose tissue and central nervous system [22, 23]. The action of insulin in hepatic cells and inhibition of gluconeogenesis occur through the exclusion of the transcription factor Forkhead Box (Foxo1) from the nucleus and consequent reduction of gluconeogenic enzymes (PEPCK and G6Pase) [24, 25]. However, recent studies related the importance of hepatic glucose production suppression through PCB activity [6, 26]. In contrast, it is well established that physical training enhances insulin sensitivity and reduces hepatic glucose production in obesity models [10, 13]. Therefore, we hypothesized that physical training would reduce hepatic glucose production in obese and insulin-resistant mice through reduction of hepatic PCB protein levels. To examine this hypothesis, we induced obesity by a high-fat diet and submitted these animals to an exercise training protocol.
Initially, we analyzed the effects of obesity on body weight, epididymal fat, insulin sensitivity, fasting FFAs, fasting glycemia and fasting insulin. The high-fat diet increased body weight and epididymal fat, and related to physiological parameters, the DIO group presented higher serum FFAs, fasting glucose and insulin levels. However, exercise training reduced both body weight and epididymal fat mass when compared with the DIO group. Moreover, the deleterious effects of the high-fat diet were prevented in the DIO-EXE group by insulin sensitivity, and decreasing serum FFAs, fasting glucose, and insulin. These data indicate that our intervention was effective in the treatment of diet-induced obesity.
In addition, it has been demonstrated that obesity impairs hepatic insulin signaling, characterized by changes in the activity of key proteins such as Akt [27–29]. Corroborating these studies, the high-fat diet reduced Akt phosphorylation, while PCB content in the liver was increased when compared with the control group. This result is in accordance with other findings in the literature showing that obesity is associated with an increase in liver PCB levels [6, 26].
Exercise seems to be an important non-pharmacological intervention in the control of hepatic glucose production and elevated blood glucose levels. A wide variety of studies showed that physical exercise can regulate gluconeogenesis by reducing PEPCK and G6Pase protein content [10–13, 30]. Considering PCB plays an important role in hepatic glucose production [6] and is still poorly investigated, it would be interesting to evaluate whether physical exercise could modulate this molecular parameter. Herein, for the first time, we demonstrated that exercise training reduced PCB levels in the livers of the DIO-EXE group, thus producing an improved glycemic profile. Considering other gluconeogenic enzymes, PEPCK was the only one that showed a statistically significant difference.
We did not measure the hepatic glucose production directly. However, the effects of PCB silencing on hepatic glucose production of obese animals are known [6]. In fact, after PCB inhibition, the DIO group improved the following parameters: (1) pyruvate tolerance test; (2) fasting glycemia and insulinemia; and (3) endogenous glucose production during the hyperinsulinemic-euglycemic clamp procedure. Interestingly, the hepatic levels of PCB were increased during obesity induction. In the same investigation, the authors demonstrated that among all the key gluconeogenic enzymes [mitochondrial and cytosolic PEPCK, fructose-1,6-bisphosphatase (FBP1), and G6Pase as well as PCB mRNA expression], the hepatic PCB content best expresses the glycemia in humans, which was assessed by both fasting plasma glucose concentration and hemoglobin A1c (HbA1c). Based on the data above, we suggest that the current decrease of PCB levels in the liver of trained obese mice probably contributes to the reduction of both hepatic glucose production and glycemia.
Furthermore, a recent study showed that PCB activation in the liver can result from increased lipolysis in white adipose tissue (WAT) [26]. Increased free fatty-acid levels induces higher hepatic acetyl-CoA concentrations, enhancing PCB flux in the hepatocytes, reinforcing the link between WAT and liver glucose production [31, 32]. Thereby, as noted in the literature, obesity impairs insulin signaling, enhancing fatty acid levels in WAT and consequently serum FFAs [33, 34]. In line with these findings, we observed increased serum FFA levels in DIO group. Physical exercise was able to reduce this parameter, but at molecular levels had no effect on Akt phosphorylation (p = 0.22), indicating PCB protein and FFA serum levels have a major contribution in altering fasting glucose levels [35]. These findings could explain why our animals presented a higher concentration of hepatic PCB protein.
In conclusion, considering our study limitations, our findings support the previous hypothesis that exercise training could reduce hyperglycemia, at least partially by reduced PCB protein content, a key molecule in hepatic glucose metabolism (Fig. 6). Exercise training effects on hepatic PCB levels may be considered as a novel mechanism for attenuating high-fat diet effects, such as hyperglycemia and type 2 diabetes, as observed in DIO mice. Future studies could also evaluate molecular markers of lipolysis in the WAT and possible interactions with PCB levels in response to physical exercise.
Fig. 6.
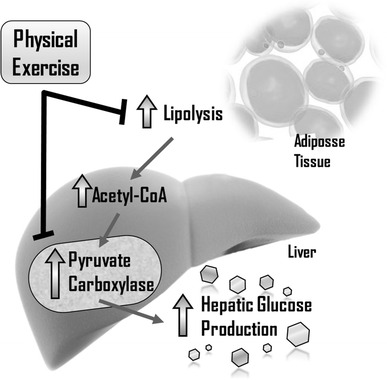
Role of exercise training in hepatic glucose production. Pyruvate carboxylase protein has shown great importance in hepatic glucose production, modulating the fasting glucose state. Moreover, exercise training can reduce fat accumulation in adipocytes and improve glucose homeostasis. One new mechanism shown in this study is the hepatic PCB content reduction after the exercise training protocol, resulting in better fasting glucose and fasting insulin in obese insulin resistant mice
Acknowledgements
The authors would like to thank FAPESP (2013/21491-2), CNPq, CAPES and FAEPEX, for their indispensable support.
Author contributions
V.R.M. wrote the paper and had the overall responsibilities of the experiments of this study. V.R.M., R.C.G., B.M.C., G.P.F., M.R.S. and R.S.G. designed and performed the experiments, data collection and statistical analysis; R.S.G., J.D.B. and L.P.M. contributed to data analysis; A.R.S.S., D.E.C., E.R.R. and J.R.P contributed to discussion and supported the financial costs. All the authors have read and approved this manuscript.
Compliance with ethical standards
Funding
This study was funded by FAPESP (2013/21491-2 and 2016/18488-8).
Conflict of interest
The authors declare that they have no conflict of interest.
Ethical approval
The experimental procedures were approved by the Ethics Committee on Animal Use, Campinas University State–UNICAMP (no. 2805-1). All applicable international, national, and/or institutional guidelines for the care and use of animals were followed. This article does not contain any studies with human participants performed by any of the authors.
References
- 1.Lumeng CN, Saltiel AR. Review series. Inflammatory links between obesity and metabolic disease. J Clin Invest. 2011;121:2111–2117. doi: 10.1172/JCI57132.In. [DOI] [PMC free article] [PubMed] [Google Scholar]
- 2.Hotamisligil GS. Inflammation and metabolic disorders 1. Nature. 2006;444:860–867. doi: 10.1038/nature05485. [DOI] [PubMed] [Google Scholar]
- 3.Gregor MF, Hotamisligil GS. Inflammatory mechanisms in obesity. Annu Rev Immunol. 2011;29:415–445. doi: 10.1146/annurev-immunol-031210-101322. [DOI] [PubMed] [Google Scholar]
- 4.Boden G, Chen X, Stein TP, et al. Gluconeogenesis in moderately and severely hyperglycemic patients with type 2 diabetes mellitus. Am J Physiol Endocrinol Metab. 2001;280:23–30. doi: 10.1152/ajpendo.2001.280.1.E23. [DOI] [PubMed] [Google Scholar]
- 5.Gastaldelli A, Baldi S, Pettiti M, et al. Influence of obesity and type 2 diabetes on gluconeogenesis and glucose output in humans: a quantitative study. Diabetes. 2000;49:1367–1373. doi: 10.2337/diabetes.49.8.1367. [DOI] [PubMed] [Google Scholar]
- 6.Kumashiro N, Beddow SA, Vatner DF, et al. Targeting pyruvate carboxylase reduces gluconeogenesis and adiposity and improves insulin resistance. Diabetes. 2013;62:2183–2194. doi: 10.2337/db12-1311. [DOI] [PMC free article] [PubMed] [Google Scholar]
- 7.Samuel VT, Beddow SA, Iwasaki T, et al. Fasting hyperglycemia is not associated with increased expression of PEPCK or G6Pc in patients with type 2 diabetes. Diabetes. 2009;106:12121–12126. doi: 10.1073/pnas.0812547106. [DOI] [PMC free article] [PubMed] [Google Scholar]
- 8.Ramnanan CJ, Irimia-dominguez J, Neal D, et al. Molecular characterization of insulin-mediated suppression of hepatic glucose production in vivo. Diabetes. 2010;59:302–1311. doi: 10.2337/db09-1625. [DOI] [PMC free article] [PubMed] [Google Scholar]
- 9.Jitrapakdee S, Maurice MS, Rayment I, et al. Structure, mechanism and regulation of pyruvate carboxylase. Biochem J. 2008;413:369–387. doi: 10.1042/BJ20080709. [DOI] [PMC free article] [PubMed] [Google Scholar]
- 10.de Moura LP, Pauli LS, Cintra DE, et al. Acute exercise decreases PTP-1B protein level and improves insulin signaling in the liver of old rats. Immun Ageing. 2013;10:8. doi: 10.1186/1742-4933-10-8. [DOI] [PMC free article] [PubMed] [Google Scholar]
- 11.Tsuzuki T, Shinozaki S, Nakamoto H, et al. Voluntary exercise can ameliorate insulin resistance by reducing iNOS-mediated S-nitrosylation of Akt in the liver in obese rats. PLoS One. 2015;10:e0132029. doi: 10.1371/journal.pone.0132029. [DOI] [PMC free article] [PubMed] [Google Scholar]
- 12.Marcinko K, Sikkema SR, Samaan MC, et al. High intensity interval training improves liver and adipose tissue insulin sensitivity. Mol Metab. 2015;4:903–915. doi: 10.1016/j.molmet.2015.09.006. [DOI] [PMC free article] [PubMed] [Google Scholar]
- 13.Botezelli JD, Coope A, Ghezzi AC, et al. Strength training prevents hyperinsulinemia, insulin resistance, and inflammation independent of weight loss in fructose-fed animals. Sci Rep. 2016;6:31106. doi: 10.1038/srep31106. [DOI] [PMC free article] [PubMed] [Google Scholar]
- 14.Sano A, Koshinaka K, Abe N, et al. The effect of high-intensity intermittent swimming on post-exercise glycogen supercompensation in rat skeletal muscle. J Physiol Sci. 2012;62:1–9. doi: 10.1007/s12576-011-0170-y. [DOI] [PMC free article] [PubMed] [Google Scholar]
- 15.Nagatomo F, Fujino H, Kondo H, et al. The effects of running exercise on oxidative capacity and PGC-1α mRNA levels in the soleus muscle of rats with metabolic syndrome. J Physiol Sci. 2012;62:105–114. doi: 10.1007/s12576-011-0188-1. [DOI] [PMC free article] [PubMed] [Google Scholar]
- 16.Ju J-S, Jeon S-I, Park J-Y, et al. Autophagy plays a role in skeletal muscle mitochondrial biogenesis in an endurance exercise-trained condition. J Physiol Sci. 2016;66:417–430. doi: 10.1007/s12576-016-0440-9. [DOI] [PMC free article] [PubMed] [Google Scholar]
- 17.Basu R, Chandramouli V, Dicke B, et al. Obesity and type 2 diabetes impair insulin induced suppression of glycogenolysis as well as gluconeogenesis. Diabetes. 2005;54:1942–1948. doi: 10.2337/diabetes.54.7.1942. [DOI] [PubMed] [Google Scholar]
- 18.Kang J, Robertson RJ, Hagberg JM, et al. Effect of exercise intensity on glucose and insulin metabolism in obese individuals and obese NIDDM patients. Diabetes Care. 1996;19:341–349. doi: 10.2337/diacare.19.4.341. [DOI] [PubMed] [Google Scholar]
- 19.Ferreira JCB, Rolim NPL, Bartholomeu JB, et al. Maximal lactate steady state in running mice: effect of exercise training. Clin Exp Pharmacol Physiol. 2007;34:760–765. doi: 10.1111/j.1440-1681.2007.04635.x. [DOI] [PubMed] [Google Scholar]
- 20.Scott AM, Atwater I, Rojas E. A method for the simultaneous measurement of insulin release and B cell membrane potential in single mouse islets of Langerhans. Diabetologia. 1981;21:470–475. doi: 10.1007/BF00257788. [DOI] [PubMed] [Google Scholar]
- 21.Walker J. The bicinchoninic acid (BCA) assay for protein quantitation. Methods Mol Biol. 1994;32:5–8. doi: 10.1385/0-89603-268-X:5. [DOI] [PubMed] [Google Scholar]
- 22.Girard J. The inhibitory effects of insulin on hepatic glucose production are both direct and indirect production. Diabetes. 2006;55:23–25. doi: 10.2337/db06-S009. [DOI] [Google Scholar]
- 23.Cherrington AD. The role of hepatic insulin receptors in the regulation of glucose production. J Clin Invest. 2005;115:1136–1139. doi: 10.1172/JCI200525152. [DOI] [PMC free article] [PubMed] [Google Scholar]
- 24.Ayala JE, Streeper RS, Desgrosellier JS, et al. Conservation of an insulin response unit between mouse and human glucose-6-phosphatase catalytic subunit gene promoters. Diabetes. 1999;48:1885–1889. doi: 10.2337/diabetes.48.9.1885. [DOI] [PubMed] [Google Scholar]
- 25.Haeusler RA, Kaestner KH, Accili D. FoxOs function synergistically to promote glucose production. J Biol Chem. 2010;285:35245–35248. doi: 10.1074/jbc.C110.175851. [DOI] [PMC free article] [PubMed] [Google Scholar]
- 26.Perry RJ, Camporez J-PG, Kursawe R, et al. Hepatic acetyl CoA links adipose tissue inflammation to hepatic insulin resistance and type 2 diabetes. Cell. 2015;160:745–758. doi: 10.1016/j.cell.2015.01.012. [DOI] [PMC free article] [PubMed] [Google Scholar]
- 27.Tremblay F, Lavigne C, Jacques H, Marette A. Defective insulin-induced GLUT4 translocation in skeletal muscle of high fat-fed rats is associated with alterations in both Akt/protein kinase B and atypical protein kinase C (z/l) activities. Diabetes. 2001;50:1901–1910. doi: 10.2337/diabetes.50.8.1901. [DOI] [PubMed] [Google Scholar]
- 28.Karlsson HKR, Zierath JR, Kane S, et al. Insulin-stimulated phosphorylation of the Akt substrate AS160 is impaired in skeletal muscle of type 2 diabetic subjects. Diabetes. 2005;54:1692–1698. doi: 10.2337/diabetes.54.6.1692. [DOI] [PubMed] [Google Scholar]
- 29.Zick Y. Insulin resistance: a phosphorylation-based uncoupling of insulin signaling. Trends Cell Biol. 2001;11:437–441. doi: 10.1016/S0962-8924(01)81297-6. [DOI] [PubMed] [Google Scholar]
- 30.Trefts E, Williams AS, Wasserman DH. Exercise and the regulation of hepatic metabolism. Prog Mol Biol Transl Sci. 2015;135:203–225. doi: 10.1016/bs.pmbts.2015.07.010. [DOI] [PMC free article] [PubMed] [Google Scholar]
- 31.De Filippo G, Rendina D, Moccia F, et al. Interleukin-6, soluble interleukin-6 receptor/interleukin-6 complex and insulin resistance in obese children and adolescents. J Endocrinol Invest. 2015;38:339–343. doi: 10.1007/s40618-014-0176-4. [DOI] [PubMed] [Google Scholar]
- 32.Eder K, Baffy N, Falus A, Fulop AK. The major inflammatory mediator interleukin-6 and obesity. Inflamm Res. 2009;58:727–736. doi: 10.1007/s00011-009-0060-4. [DOI] [PubMed] [Google Scholar]
- 33.Suganami T, Ogawa Y. Adipose tissue macrophages: their role in adipose tissue remodeling. J Leukoc Biol. 2010;88:33–39. doi: 10.1189/jlb.0210072. [DOI] [PubMed] [Google Scholar]
- 34.Savage DB, Petersen KF, Shulman GI. Mechanisms of insulin resistance in humans and possible links with inflammation. Hypertension. 2005;45:828–833. doi: 10.1161/01.HYP.0000163475.04421.e4. [DOI] [PubMed] [Google Scholar]
- 35.Samuel VT, Shulman GI. The pathogenesis of insulin resistance: integrating signaling pathways and substrate flux. J Clin Invest. 2016;126:12–22. doi: 10.1172/JCI77812. [DOI] [PMC free article] [PubMed] [Google Scholar]


