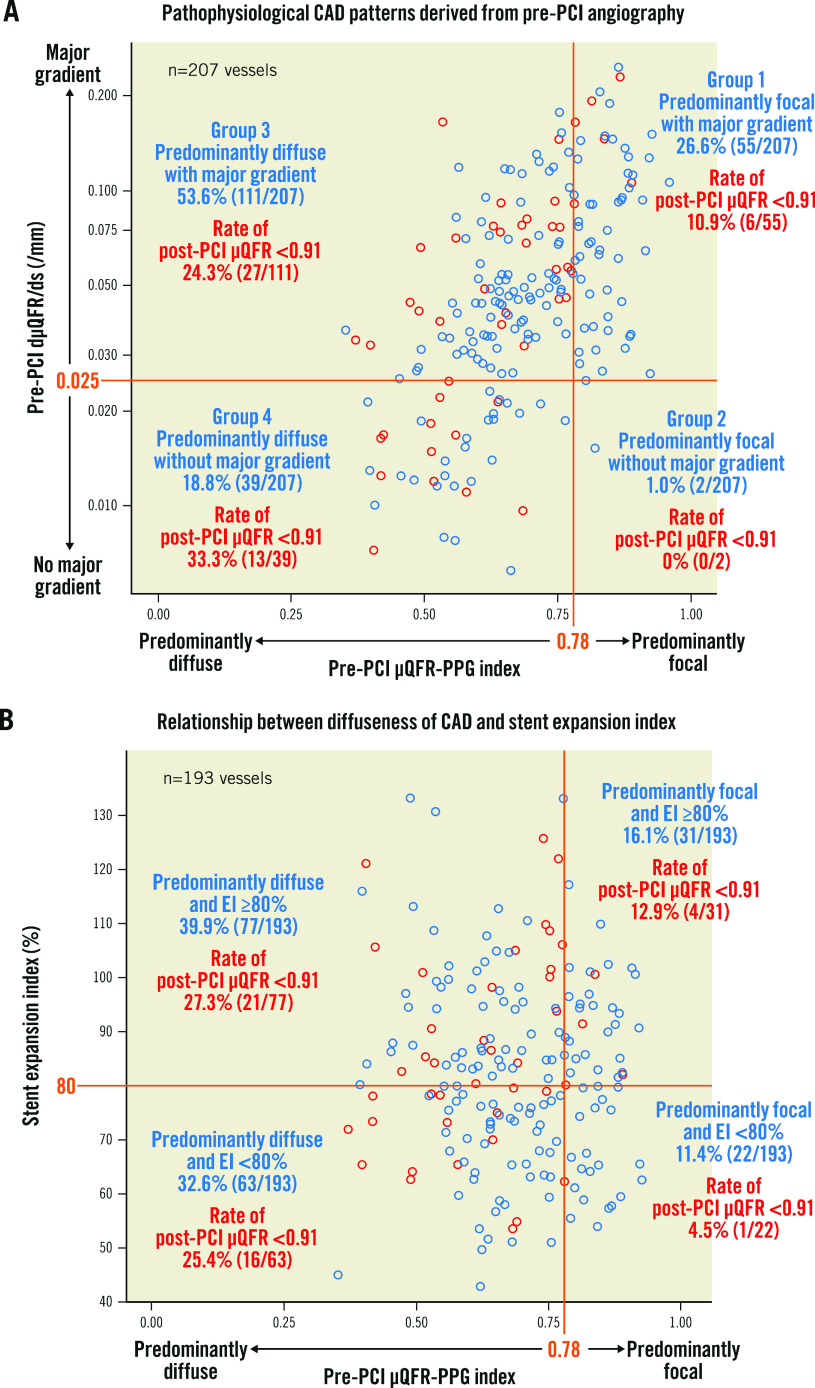
Figure 2. Pathophysiological CAD patterns and the relationship between diffuseness of CAD and stent expansion index.
The x-axis in both figures shows the pre-PCI PPG index derived from pre-PCI angiography. Red and blue open circles show vessels with post-PCI µQFR <0.91 and ≥0.91, respectively. A) The figure shows pathophysiological CAD patterns derived from pre-PCI angiography. On the y-axis, values of dµQFR/ds were plotted in a log scale with absolute values. B) The figure shows the relationship between the diffuseness of CAD and the stent expansion index. CAD: coronary artery disease; dµQFR/ds: instantaneous µQFR ratio gradient per unit length; EI: expansion index; PCI: percutaneous coronary intervention; PPG: pullback pressure gradient; µQFR: Murray law-based quantitative flow ratio

