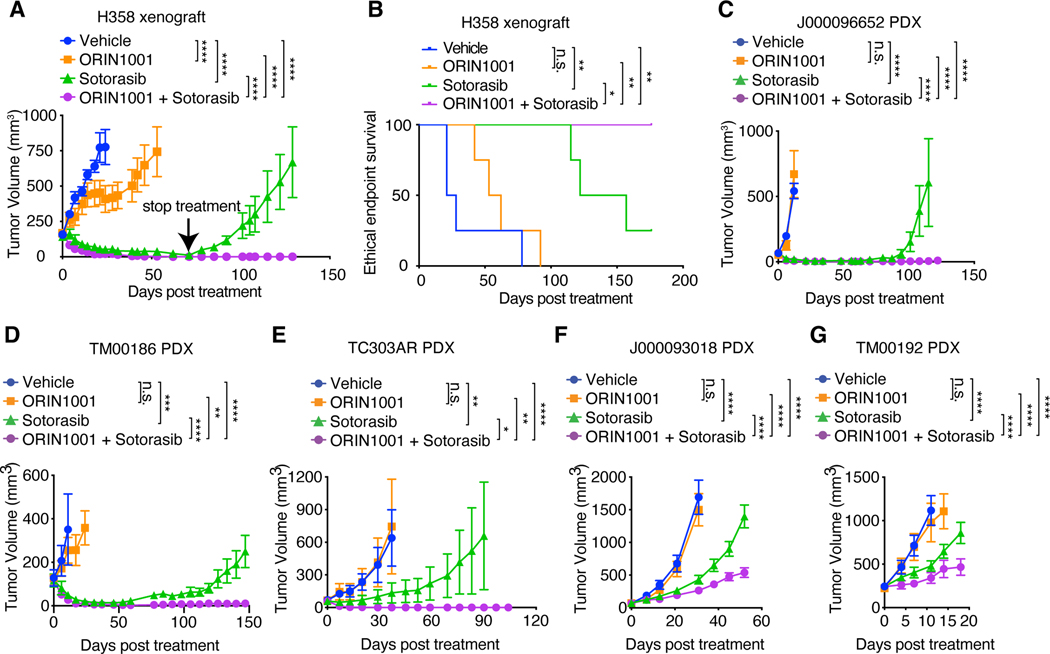
Fig. 8. IRE1α inhibition enhances the response of KRASG12C-driven tumors to sotorasib.
(A) Tumor volume quantification of established H358 tumors in SCID/beige mice treated with vehicle, ORIN1001 (150mg/kg), sotorasib (30mg/kg), or ORIN1001 plus sotorasib. (n=4). Treatment was stopped at day 71. (B) Kaplan-Meier survival curve of H358 tumor-bearing mice under different treatments as indicated in (A) from treatment start time. (C) Tumor volume quantification of established J000096652 PDX tumors in NSG mice treated with vehicle (n=6), ORIN1001 (300mg/kg, n=4), sotorasib (100mg/kg, n=7), or ORIN1001 plus sotorasib (n=8). Treatment was stopped at day 65. (D) Tumor volume quantification of established TM00186 PDX tumors in NSG mice treated with vehicle (n=6), ORIN1001 (300mg/kg, n=6), sotorasib (100mg/kg, n=7), or ORIN1001 plus sotorasib (n=9). (E) Tumor volume quantification of established TC303AR PDX tumors in NSG mice treated with vehicle (n=5), ORIN1001 (300mg/kg, n=5), sotorasib (100mg/kg, n=9), or ORIN1001 plus sotorasib (n=9). Treatment was stopped at day 53. (F) Tumor volume quantification of established J000093018 PDX tumors in NSG mice treated with vehicle (n=6), ORIN1001 (300mg/kg, n=6), sotorasib (100mg/kg, n=9), or ORIN1001 plus sotorasib (n=9). (G) Tumor volume quantification of established TM00192 PDX tumors in NSG mice treated with vehicle (n=6), ORIN1001 (300mg/kg, n=5), sotorasib (100mg/kg, n=9), or ORIN1001 plus sotorasib (n=9). Data are presented as mean ± SEM (A, C to G). Two-way ANOVA test with Bonferroni’s multiple comparisons test (A, C to G), log-rank (Mantel-Cox) test (B) was used to calculate P values. n.s., not significant, * P<0.05, **P < 0.01, ***P < 0.001, ****P < 0.0001.

