

Abstract
The retinal pigmented epithelium (RPE) constitutes the outer blood‐retinal barrier, enables photoreceptor function of the eye, and is constantly exposed to oxidative stress. As such, dysfunction of the RPE underlies pathology leading to development of age‐related macular degeneration (AMD), the leading cause of vision loss among the elderly in industrialized nations. A major responsibility of the RPE is to process photoreceptor outer segments, which relies on the proper functioning of its endocytic pathways and endosomal trafficking. Exosomes and other extracellular vesicles (EVs) from RPE are an essential part of these pathways and may be early indicators of cellular stress. To test the role of small EVs (sEVs) including exosomes, that may underlie the early stages of AMD, we used a polarized primary RPE cell culture model under chronic subtoxic oxidative stress. Unbiased proteomic analyses of highly purified basolateral sEVs from oxidatively stressed RPE cultures revealed changes in proteins involved in epithelial barrier integrity. There were also significant changes in proteins accumulating in the basal‐side sub‐RPE extracellular matrix during oxidative stress, that could be prevented with an inhibitor of sEV release. Thus, chronic subtoxic oxidative stress in primary RPE cultures induces changes in sEV content, including basal‐side specific desmosome and hemidesmosome shedding via sEVs. These findings provide novel biomarkers of early cellular dysfunction and opportunity for therapeutic intervention in age‐related retinal diseases (e.g., AMD).
Keywords: age‐related macular degeneration (AMD), exosome, oxidative stress, polarized, proteomics, retinal pigmented epithelium (RPE), small extracellular vesicle (sEV)
1. INTRODUCTION
The retinal pigmented epithelium (RPE) is a polarized cell monolayer in the eye that is situated between the photoreceptors and the systemic circulation of the choroid. RPE dysfunction is the major contributor to the pathogenesis of the early stages of age‐related macular degeneration (AMD), which is the leading cause of blindness in people 65 years of age or older in developed countries (Bowes Rickman et al., 2013). RPE are highly specialized cells that carry out crucial functions in the eye, including daily phagocytosis of outer segments shed from rod and cone photoreceptors, processing and transport of nutrients and recycling of visual pigments (Strauss, 1995). In addition, the RPE forms the outer blood‐retinal barrier (oBRB) in the eye and its polarity is responsible for the directional secretion of proteins, lipoprotein particles and lipid bilayer‐enclosed extracellular vesicles (EVs), including exosomes. Such polarity dictates directed interactions between the systemic circulation (basolateral) and the retina (apical). The role of this extensive endocytic trafficking, including the formation and release of a range of EVs, in AMD and other retinal diseases has not been thoroughly investigated to date (Klingeborn et al., 2017).
Exosomes are cell‐derived, bilayer‐enclosed, nanovesicles (diameter (ø) = 30–150 nm) that are secreted in a controlled manner from most cell types. They make up the smallest subpopulation of the wide range of EVs released from most cells. It has become increasingly clear in recent years that exosomes have specialized functions and play a key role in, among other things, intercellular signalling and cellular waste management (van der Pol et al., 2012). The results from a number of studies suggest that exosomes are not secreted merely as a degradation route for redundant molecules (Johnstone et al., 1991); rather they are equipped to withstand lysis by the complement system to carry out extracellular functions (Clayton et al., 2003). Exosomes are formed inside specialized endosomes called multivesicular endosomes (MVE) and are released into the extracellular milieu upon MVE fusion with the plasma membrane. Their biogenesis and extracellular release is distinct from other EVs such as larger microvesicles that bud directly from the plasma membrane (Raposo & Stoorvogel, 2013). Exosomes and microvesicles are functionally distinct in many respects (Raposo & Stoorvogel, 2013). The role of exosomes and other EVs in the healthy and diseased eye has only recently begun to undergo rigorous study (reviewed in (Klingeborn et al., 2017)). Research has shown that highly polarized cells such as epithelia release exosomes and EVs in a directional manner with different cargoes detected in apical versus basolateral exosomes and/or small EVs (sEVs) (Chen et al., 2016; Colombo et al., 2021; Dang et al., 2017; Davies et al., 2020; Klingeborn et al., 2017; Matsui et al., 2021; Sreekumar et al., 2010; Tauro et al., 2013; van Niel et al., 2001; Wang et al., 2021). However, there is a paucity of such studies to date using a global approach to characterize the changes to exosome protein content in response to common environmental stressors, such as chronic oxidative stress.
Oxidative stress has been implicated in RPE dysfunction that underlies development and progression of AMD (Age‐Related Eye Disease Study Research Group, 2001; Beatty et al., 2000; Jun et al., 2019; Seddon et al., 2006; Tisi et al., 2021; Weismann et al., 2011). This dysfunction manifests in several RPE cellular processes including mitochondrial dysfunction (Terluk et al., 2015), lipid metabolism perturbation (Weismann et al., 2011) and disrupted autophagic clearance (Mitter et al., 2014; Wang et al., 2019). To date, most studies of experimental oxidative stress in RPE have only utilized acute and severe oxidative stress of 24‐, 48‐, but in rare cases, 72‐h treatments (Chen et al., 2022; Ishii et al., 2021) have been utilized. Longer experiments using milder oxidative stressors that more closely mimic early clinical stages of AMD, have rarely been conducted (Flores‐Bellver et al., 2021; Mitter et al., 2014). Cells under stress are known to increase the release of membranous vesicles including exosomes (King et al., 2012), and this has also been shown in RPE cells (Atienzar‐Aroca et al., 2016). There have been several recent studies analysing the release of EVs from RPE cells under various types of stress, including acute and aggressive oxidative stress (Flores‐Bellver et al., 2021; Nicholson et al., 2020; Shah et al., 2018). However, to more closely mimic the early stages of RPE dysfunction in early dry AMD, we optimized conditions to induce a chronic subtoxic level of oxidative stress with minimal to no cell death. This was achieved using our previously validated primary porcine culture model of polarized RPE cell monolayers grown on semi‐permeable membrane supports (Klingeborn et al., 2017; Pilgrim et al., 2017; Toops et al., 2014) and subjected to up to 4 weeks of low concentrations of hydrogen peroxide (H2O2). These chronically stressed primary RPE cultures on permeable transwell supports allow collection of separate EV populations secreted from the apical and basolateral side, which is essential for examining these epithelial monolayer responses in a more relevant physiological context.
Previous studies of secreted exosome and sEV preparations have been limited due to reliance on traditional mass spectrometric analysis of preparations of varying enrichment and purity, which are inherently heterogeneous mixtures and thus reduce identification of low abundance proteins that are nonetheless specific for exosomes and sEVs. To address these limitations, we used density gradient flotation ultracentrifugation to achieve a higher degree of purity (Théry et al., 2018). In addition, to increase yield but maintain purity, we incorporated a novel step concentrating exosomes in a liquid cushion prior to density gradient ultracentrifugation (Brennan et al., 2020; Duong et al., 2019; Karimi et al., 2022; Langevin et al., 2019; Li et al., 2018).
Multiple lines of evidence indicate that one of the major culprits observed in RPE dysfunction is dysregulation in the endosomal pathway, which is thought to contribute to formation of ‘drusen’ (protein‐ and lipid‐rich extracellular deposits associated with AMD) between the basal lamina of the RPE and the pentalaminar collagen‐ and elastin‐rich Bruch's membrane (BrM) (Bowes Rickman et al., 2013). At present, the exact mechanisms for drusen formation are unknown. Since RPE‐released exosomes and other EVs are essential parts of the endosomal pathway via their formation in MVEs that also provide trafficking of intracellular cargo (Xu et al., 2018), we undertook this study of sEVs released from chronically oxidatively stressed RPE cells, and the role they play in ECM changes that underlie early and late stages of AMD.
In the current study, we show for the first time that chronic subtoxic oxidative stress in primary RPE cultures induces changes in the protein cargo of sEVs released on the basal side reflecting desmosome and hemidesmosome shedding. Desmosomes are specialized and highly ordered membrane domains that mediate cell‐cell contact and strong adhesion on the lateral cell surface (Kowalczyk & Green, 2013). Hemidesmosomes on the other hand, are multiprotein complexes that facilitate the stable adhesion of epithelial cells via their basal surface to the underlying basement membrane (Walko et al., 2015). We also show that release of these sEVs correlates with ECM changes that can be prevented by inhibition of sEV release. These findings provide a novel avenue for therapeutic intervention and access to early biomarkers of cellular dysfunction in aging‐related retinal diseases, in particular AMD.
2. MATERIALS AND METHODS
We have submitted all relevant data of our experiments to the EV‐TRACK knowledgebase (EV‐TRACK ID: EV230370) (Van Deun et al., 2017).
2.1. Antibodies and reagents
Calcium and magnesium free PBS (PBS; #10010‐023), and Hoechst 33258 (#H3569) were from Invitrogen (Waltham, MA). Triton X‐100 (#T8787) was obtained from Sigma–Aldrich (St. Louis, MO). Antibodies used in the current study were as follows: Mouse anti‐RPE65 (#NB100‐355) [clone 401.8B11.3D9]; Novus Biologicals, Centennial, CO), mouse anti‐DSG1 (#610273, BD Transduction, Franklin Lakes, NJ), mouse anti‐Cytokeratin 10 (#MA5‐13705 [clone DE‐K10]; ThermoFisher, Waltham, MA), rabbit anti‐Syntenin‐1 (#ab19903]; Abcam, Cambridge, MA), mouse anti‐Annexin II (#610068, BD Transduction Laboratories, Franklin Lakes, NJ), rat anti‐Integrin Beta 1 (AIIB2 clone, Developmental Studies Hybridoma Bank, Iowa City, IA), mouse anti‐Occludin (#66378‐1‐Ig, Proteintech, Rosemont, IL), rabbit anti‐Calreticulin (#12238 [clone D3E6]; Cell Signaling Technologies, Danvers, MA), anti‐SOD1 (#10269‐1‐AP, Proteintech), anti‐Catalase (#66765‐1‐Ig, Proteintech), anti‐MDA (#NBP2‐59367, Novus Biologicals), anti‐HSPA5 (#PA5‐19503, ThermoFisher), anti‐CLDN19 (#SC‐36597, Santa Cruz Technology, Dallas, TX), HRP‐conjugated donkey‐anti‐rat IgG (#712‐035‐153, Jackson ImmunoResearch Laboratories, West Grove, PA), HRP‐conjugated donkey‐anti‐mouse IgG (#715‐035‐150, Jackson ImmunoResearch) and HRP‐conjugated donkey‐anti‐rabbit IgG (#711‐035‐152, Jackson ImmunoResearch).
2.2. Polarized porcine RPE cell culture
Primary cultures of porcine RPE cells were prepared as described previously (Klingeborn et al., 2017) with minor modifications. Briefly, porcine eyes were trimmed of excess tissue and anterior segments (including the entire lens and vitreous) were removed with a scalpel at the ora serrata. Eyecups (posterior poles) were placed into individual wells of 6‐well tissue culture cluster plates (Corning #3516). Eyecups were filled with 2 mL of PBS containing 1 mM EDTA (pre‐warmed to 37°C) and incubated in a 37°C 5% CO2 incubator for 30 min to loosen the retina. After removal of the retina, eyecups were filled with 2 mL of 0.25% trypsin‐0.91 mM EDTA solution (Gibco #25200‐056) and placed in an incubator at 37°C for 30 min. RPE cells were recovered by repeated aspiration followed by a low‐speed centrifugation (5 min at 300 g). RPE cells were seeded at 60% confluence on 75 cm2 cell culture flasks (Corning #430641) and allowed to grow to >90% confluence before being trypsinized for seeding onto cell culture inserts. Thus, cells were seeded at passage p1 onto Laminin/Entactin (Corning #354259) coated 24 mm cell culture inserts with pore size of 0.4 μm (Corning Transwell, #3450). Cells were seeded at high density onto inserts (300,000 RPE cells/cm2). Under these high‐density seeding conditions, 100% confluence is achieved immediately upon seeding. RPE cells on inserts were maintained in DMEM with glucose and sodium pyruvate (Gibco #11995‐065) supplemented with 1% (v/v) heat‐inactivated FBS (Mediatech #35‐010‐CV), 100 units/mL penicillin, 100 μg/mL streptomycin, 2 mM L‐glutamine (Sigma #G6784), MEM non‐essential amino acids (Gibco #11140050), 0.25 μg/mL Amphotericin B (Gibco #15290‐018) and 10 μg/mL Ciprofloxacin (Corning #61‐277‐RF). This medium will be referred to as complete pig RPE (pRPE) medium with FBS. High levels of pigmentation were achieved after as little as 1–2 weeks on cell culture inserts.
2.3. Human RPE cell cultures from induced pluripotent stem cells (iPSC)
For the generation of iPSC‐RPE cells with a known genetic risk for AMD, patients were recruited at the University Eye Clinic Regensburg after thorough clinical examination by an experienced ophthalmologist, the tests including fundoscopy and color fundus imaging (FF450plus fundus camera, Zeiss, Oberkochen, Germany), macular optical coherence tomography, fundus autofluorescence, as well as fluorescein angiography (all done with a Spectralis device, Heidelberg Engineering, Heidelberg, Germany). DNA samples were extracted from blood samples or skin biopsies and genotyped for 13 selected AMD‐associated SNPs at 8 different loci known to be highly correlated with AMD risk, by Sanger sequencing or restriction fragment length polymorphisms (RFLP) (Fritsche et al., 2016). Genetic risk scores were calculated using the model reported by Grassmann et al. (Grassmann et al., 2012) and samples from four high‐risk (group 5) and four low‐risk (group 1) individuals were included in the study. The culture and differentiation of human iPSC (hiPSC) from human donor material were approved by the Ethics Review Board of the University of Regensburg, Germany (reference no. 12‐101‐0241). Fibroblasts or peripheral blood mononuclear cells (PBMCs) from the selected donors were reprogrammed to iPSCs and subsequently differentiated into iPSC‐RPE as described. Detailed information on the cell lines is given in (Plössl et al., 2022). iPSC‐RPE cells were thawed, seeded on 6‐well plates coated with Matrigel GFR (Corning Inc., Corning, NY), passaged once after 2 weeks and cultivated for another 2 weeks before seeding the cells onto transwell filters (ThinCert Cell Culture Inserts by Greiner Bio‐One, Kremsmünster, Austria). Conditioned apical and basal media were collected from cells which had been matured on transwell inserts for at least 6 and up to 9 weeks. Media was changed every 72 hrs at the latest. After collection, media were centrifuged at 2000 x g for 10 min and then stored at −80°C until use for sEV isolation.
2.4. Induction of oxidative stress
Oxidative stress conditions were induced by adding H2O2 daily to both the apical and basal compartments of fully differentiated RPE transwell cultures. The concentration was chosen from a range of concentrations tested from 50 to 500 μM, to achieve subtoxic oxidative stress conditions mimicking early stages of RPE dysfunction without catastrophic loss of barrier integrity (occurs at TER below 100 Ω•cm2; (Rizzolo, 2014)) and outright RPE dysfunction and cell death within the 4‐week experimental treatment duration. The identified concentration was 0.2 mM H2O2.
2.5. Inhibition of neutral sphingomyelinase 2 (nSMase 2)
A stock solution of 5 mM in DMSO was made of the nSMase 2 (SMPD3) inhibitor GW4869 (Tocris Bioscience, Minneapolis, MN, #6741). Control and H2O2‐treated cultures were also treated with a matched concentration of the vehicle (DMSO) that GW4869 was solubilized in. RPE transwell cultures were treated in both apical and basal‐side media every 48 hrs for 4 weeks (28 days) with GW4869 to decrease small EV release (Kosaka et al., 2010; Trajkovic et al., 2008).
2.6. Transepithelial electrical resistance (TER)
TER is a reliable assay for the assessment of RPE barrier function and is inversely proportional to the paracellular permeability of cultured RPE cells (Ablonczy & Crosson, 2007; Ablonczy et al., 2011; Ablonczy et al., 2009; Dunn et al., 1996). It was measured by means of a volt‐ohm meter (EVOM) equipped with a 24 mm EndOhm chamber (both from World Precision Instruments, Sarasota, FL). Resistance values for each condition were determined from a minimum of three individual cultures and corrected for the inherent cell culture insert resistance within 5 min after removing the plates from the incubator. All values represent the mean ± S.E.M.
2.7. LDH cytotoxicity assay
Twenty microliter aliquots of apical media from each well in a Control, and an H2O2‐treated 6‐well transwell plate, were collected before first treatment (day 0) and weekly thereafter for the 4‐week experiment. Media aliquots were collected from media that had been conditioned with the cells for 48 hrs, in all cases. Aliquots were frozen at −80°C until analysis. Amounts of LDH in conditioned media were assessed by using an ultrasensitive bioluminescent plate‐based assay (LDH‐Glo Cytotoxicity Assay, Promega, Madison, WI). We followed the manufacturer's instructions in their entirety and used a Molecular Devices SpectraMax M5 (San Jose, CA) multimodal microplate reader for luminescence signal detection.
2.8. Conditioned media for EV isolation
For generation of conditioned media for EV isolation, cell media was exchanged with media supplemented with 2% (v/v) EV‐depleted FBS. To avoid contamination with FBS‐derived EVs from the complete pRPE medium, cells were cultured for one day in the EV collection media after which it was discarded, and fresh collection media was added. EV‐depleted FBS was prepared as described previously (Théry et al., 2006). Briefly, 20% (v/v) FBS was centrifuged in a Beckman Optima XE‐90 ultracentrifuge using an SW 28 Ti rotor at 100,000 g avg for 18 hrs at 4°C. The supernatant was carefully collected without disturbing the loose pellet and sterile‐filtered through a 0.22 μm PVDF filter bottle (Millipore), aliquoted and frozen at −20°C until used.
For EV collection from cell culture inserts: For each treatment condition, conditioned media from two 6‐well cluster plates with 24 mm permeable inserts were collected every other day (every 48 hrs) for four weeks. The volumes used were 1.5 mL in the upper (apical) chamber and 2.6 mL in the lower (basal) chamber for each insert. For an average sEV preparation, 100–200 mL of apical and 200–400 mL of basal conditioned media was used as starting material.
2.9. EV isolation
Two experimental protocols were used to isolate EVs:
2.9.1. EV isolation by differential centrifugation
EVs were isolated using a modification of a well‐established differential centrifugation protocol as previously described (Théry et al., 2006; Wik et al., 2012). Briefly, conditioned medium was centrifuged at 2000 g for 10 min to remove cell debris and the resulting supernatant was collected and kept at −80°C until the next steps of the isolation protocol. Cleared conditioned media was centrifuged at 10,000 g for 30 min and the resulting supernatant was transferred to a new tube and centrifuged at 100,000 g avg for 90 min. The resulting supernatant was discarded, and the EV pellet was resuspended in a lysis buffer (2% SDS, 100 mM Tris‐HCl [pH 6.8]) if the sample was prepared for immunoblotting analyses or resuspended in PBS if prepared for NTA analysis. Centrifugations at 10,000 g (k‐factor = 2547.2) and 100,000 g (k‐factor = 254.7) were done at +4°C using polyallomer tubes (Beckman Coulter Inc., Indianapolis, IN; #326823) in an SW 28 Ti rotor in a Beckman Optima XE‐90 ultracentrifuge (Beckman Coulter).
2.9.2. EV isolation by cushioned iodixanol buoyant density gradient centrifugation
Conditioned media previously cleared at 2000 g was concentrated using Centricon Plus‐70 centrifugal filter devices with 100 kDa NMWL cutoff (Millipore, #UFC710008), or Corning Spin‐X 20 mL centrifugal filter devices with 100 kDa NMWL cutoff (Sigma–Aldrich, #CLS431491). We modified a previously published protocol from (Duong et al., 2019; Li et al., 2018) to provide a gentler EV isolation with improved yield, see schematic of workflow in Figure 1. Briefly, the concentrated media was centrifuged at 10,000 g for 30 min as described in the previous paragraph, and the resulting supernatant was recovered and made up to 36 mL with PBS if needed. The supernatant was carefully placed in a polyallomer tube onto a 2 mL cushion of 60% OptiPrep (Sigma–Aldrich #D1556) and centrifuged at 100,000 gavg in an SW 28 Ti rotor for 180 min. The resulting 2 mL cushion and 1 mL of interface was collected from the bottom using a 4‐inch blunt 18‐gauge metal hub Luer lock needle (Hamilton Company, #7748‐04) with a 5 mL syringe (BD#309646) extending from the open top. The collected 3 mL was used as the bottom 40% OptiPrep fraction in the subsequent density gradient. A discontinuous gradient of iodixanol solutions was then prepared by carefully overlaying the bottom fraction with 3 mL of 20%, 10%, and 5% solutions of iodixanol buffered with [0.25 M sucrose, 10 mM Tris‐HCl (pH 7.5)], respectively. The gradient tubes (UltraClear; Beckman Coulter #344059) were subjected to centrifugation at 200,000 gavg (SW 41 Ti rotor; 40,000 rpm) for 4 hrs at +8°C. One millilitre fractions were collected manually from the top of the self‐generated gradient and weighed to determine density. One millilitre fractions were diluted 12‐fold with PBS and subjected to centrifugation at 100,000 gavg for 90 min in the SW 41 Ti rotor. Pellets were resuspended in 50–100 μL 2% SDS, 100 mM Tris‐HCl [pH 6.8] and stored at −80°C until use. Total protein content in EV preparations were determined with the Pierce 660 nm protein assay (ThermoFisher Scientific #22660) using a NanoDrop 2000 spectrophotometer (ThermoFisher Scientific #ND‐2000).
FIGURE 1.
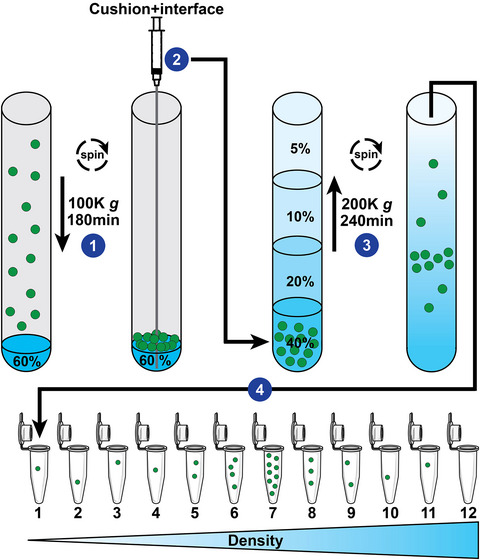
Schematic of a cushioned flotation density gradient ultracentrifugation (C‐DGUC) method for isolation of small EVs (sEV) including exosomes. (1) EV‐containing fluid that has already undergone sequential centrifugations of 2000 g and 10,000 g to remove cell debris and large EVs, is placed on top of a cushion of 60% Iodixanol (OptiPrep) and sEV are pelleted by ultracentrifugation. (2) 60% Iodixanol cushion and interface are collected from the bottom using a 4‐inch blunt needle extending from the open top. The collected sEV 40% Iodixanol sample is placed on the bottom of a tube and (3) carefully overlaid with three Iodixanol step fractions of decreasing concentrations (20%, 10% and 5%). Flotation of EVs to their intrinsic density is achieved by ultracentrifugation of the self‐forming gradient. (4) Twelve fractions of equal volume are collected from the top of the gradient, and weighed or analysed by spectrophotometry for Iodixanol content, to determine density and identify location of exosomes and sEVs (ϱ = 1.07–1.11 g/mL). Individual fractions are processed for downstream analyses.
2.10. Immunoblotting
Western blot analysis was performed as previously described (Ding et al., 2015). Briefly, cell lysate, ECM, crude EV and purified iodixanol gradient fraction samples were run reduced or unreduced, on 10% or 4%–12% gradient Bis‐Tris Criterion XT gels in MOPS buffer, transferred to PVDF using a BioRad Trans‐Blot Turbo Semi‐Dry transfer apparatus, and then probed with indicated antibodies. Anti‐Catalase and anti‐Occludin were used at 1:3,000 dilution. Anti‐Syntenin‐1, anti‐RPE65, anti‐SOD1, anti‐MDA, and anti‐Calreticulin were used at 1:1,000 dilution. Anti‐CLDN19, anti‐HSPA5, anti‐Annexin II, anti‐Cytokeratin 10, and anti‐Desmoglein 1 were used at 1:500 dilution. Anti‐Integrin Beta 1 was used at 1:88 dilution. Subsequent incubation with horseradish peroxidase‐conjugated secondary antibodies at 1:40,000 dilution was followed by detection with SuperSignal West Pico Plus (ThermoFisher Scientific #34580) or Immobilon ECL Ultra Western HRP Substrate (Sigma #WBULS0500). ECL signals and total protein loading amounts were measured with a Bio‐Rad ChemiDoc MP imaging system (Bio‐Rad Laboratories Inc., Hercules, CA). The acquired images were analysed with Bio‐Rad ImageLab software version 6.1 (Bio‐Rad Laboratories).
2.11. EV sample preparation for proteomics
EV samples in lysis buffer (2% SDS, 100 mM Tris‐HCl [pH 6.8]) were prepared for proteomic analysis and digested with the trypsin/endoproteinase LysC mixture (Promega, V5072) using a recently reported paramagnetic bead‐based protocol (Hughes et al., 2014) that is described in detail in (Klingeborn et al., 2017). Total peptide amounts were determined in each sample using A280 after trypsin cleavage and peptide cleanup steps, to normalize amounts prior to mass spectrometry analysis. Three porcine RPE sEV preparations (three biological repeats) of basolateral origin and two of apical origin, were analysed by mass spectrometry. Two hiPSC‐RPE sEV preparations of basolateral origin from each of four high genetic AMD‐risk lines and four low genetic AMD‐risk lines, were analysed by mass spectrometry. For all discussions of proteomic data, the term ‘set(s)’ is used throughout the current study to describe individual mass spectrometry datasets from biological replicate EV preparations.
2.12. EV sample preparation and LC‐MS/MS analysis
Proteins were cleaved with the trypsin/endoproteinase LysC mixture (Promega, V5072) using the paramagnetic bead‐based method (Hughes et al., 2014). Each digest was dissolved in 12 μL of 1/2/97% (by volume) of the trifluoroacetic acid/acetonitrile/water solution, and 3 μL were injected into a 5 μm, 180 μm × 20 mm Symmetry C18 trap column (Waters) in 1% acetonitrile in water for 3 min at 5 μL/min. The analytical separation was next performed using an HSS T3 1.8 μm, 75 μm × 200 mm column (Waters) over 90 min at a flow rate of 0.3 μL/min at 55°C. The 5%–30% mobile phase B gradient was used, where phase A was 0.1% formic acid in water and phase B 0.1% formic acid in acetonitrile. Peptides separated by LC were introduced into the Q Exactive HF Orbitrap mass spectrometer (ThermoFisher Scientific) using positive electrospray ionisation at 2000 V and capillary temperature of 275°C. Data collection was performed in the data‐dependent acquisition (DDA) mode with 120,000 resolution (at m/z 200) for MS1 precursor measurements. The MS1 analysis utilized a scan from 375–1450 m/z with a target AGC value of 1.0 × 10⁶ ions, the RF lens set at 30%, and a maximum injection time of 50 ms. Advanced peak detection and internal calibration (EIC) were enabled during data acquisition. Peptides were selected for MS/MS using charge state filtering (2‐5), monoisotopic peak detection and a dynamic exclusion time of 25 sec with a mass tolerance of 10 ppm. MS/MS was performed using higher‐energy C‐trap dissociation (HCD) with a collision energy of 30 ± 5% with detection in the ion trap using a rapid scanning rate, automatic gain control target value of 5.0 × 10⁴ ions, maximum injection time of 150 ms, and ion injection for all available parallelisable time enabled.
2.13. EV protein identification and quantification
For label‐free relative protein quantification, raw mass spectral data files (.raw) were imported into Progenesis QI for Proteomics 4.2 software (Nonlinear Dynamics) for duplicate runs alignment of each preparation and peak area calculations. Peptides were identified using Mascot version 2.6.2 (Matrix Science) for searching Sus scrofa UniProt July 2019 database. Mascot search parameters were: 10 ppm mass tolerance for precursor ions; 0.025 Da for fragment‐ion mass tolerance; one missed cleavage by trypsin; fixed modification was carbamidomethylation of cysteine; variable modification was oxidized methionine. Only proteins identified with 2 or more peptides (protein confidence p < 0.05 and false discovery rate < 1%), were included in the protein quantification analysis. To account for variations in experimental conditions and amounts of protein material in individual LC‐MS/MS runs, the integrated peak area for each identified peptide was corrected using the factors calculated by automatic Progenesis algorithm utilising the total intensities for all peaks in each run. This provided a normalized abundance that could be compared between samples. Values representing protein amounts were calculated based on a sum of ion intensities for all identified constituent non‐conflicting peptides for a given protein (Reidel et al., 2011).
The MS proteomics data have been deposited to the ProteomeXchange Consortium via the MassIVE (UCSD) partner repository Version 1.3.16 (last modified 5/31/2023) with the data set identifier MSV000092372.
2.14. Isolation of RPE ECM for immunoblotting analysis
Primary porcine RPE cells were grown to confluence in 6‐well Transwell inserts, media was removed, and wells washed twice with 1 mL PBS per well. Each well was placed on individual small petri dishes to avoid liquid leaking through. One millilitre of [20 mM NH4OH, 0.5% Triton X‐100] was added to each well to lyse cells and incubated for 15 min at room temperature (RT). Wells were rocked occasionally to ensure entire area of wells were lysed. Solution was removed, and wells washed twice carefully with 1 mL ddH2O per well. 200 μL of 2x GLB + 8 M Urea lysis buffer was added to each well on petri dishes. Wells were incubated at RT for 10 min. Wells were again rocked occasionally to ensure entire area of wells were solubilized. ECM solution was scraped with cell scraper and collected in 1.5 mL tubes. Tubes were vortexed vigorously, then insoluble debris was cleared at 10,000 g for 15 min at +4°C. Supernatant was frozen in a fresh tube at −80°C.
2.15. Isolation and preparation of RPE ECM for mass spectrometry analysis
Cell culture flasks were decellularized using the method of Vlodavsky et al. (Vlodavsky et al., 1987). Briefly, human (fetal human RPE were provided and isolated by A. Maminishkis as previously described in (Maminishkis et al., 2006)) and porcine primary RPE cells were grown to confluence in T‐75 flasks and washed once with PBS. Four millilitres of [20 mM NH4OH, 0.5% Triton X‐100] was added to lyse cells and incubated for 30 min at RT. Twenty millilitres of de‐ionized H2O was added to flask, with rocking. Liquids were removed by vacuum aspiration with a glass Pasteur pipette. The insoluble ECM layer was washed with 20 mL de‐ionized H2O and repeated 4 more times for a total 5 washes to ensure the complete removal of NH4OH and Triton X‐100. One millilitre [8 M Urea, 50 mM Tris‐HCl (pH 8.0)] was added and incubated with gentle shaking for 5 min to denature ECM protein content. To reduce disulfide bonds, Dithiothreitol (DTT) was added to a final concentration of 5 mM and incubated for 30 min at 37°C. The reduced thiol group was alkylated by addition of Iodoacetamide (IAA) to a final concentration of 15 mM and incubated in the dark at RT for 30 min. Mass spectrometry grade Trypsin or Trypsin/Lys‐C Mix (Promega #V5111 or V5071) was added at to a final concentration of 1 μg/mL and incubated for 30 min at 37°C in the flask. The reaction was then diluted 8‐fold with 50 mM Tris‐HCl (pH 8.0) to reduce Urea concentration to 1 M which allows sufficient Trypsin activity for efficient cleavage. ECM was collected with a cell scraper together with the 8 mL solution and incubated overnight at 37°C. The reaction mixture was centrifuged at 10,000 g for 15 min at RT to pellet insoluble material. The supernatant was collected and Trifluoroacetic acid (TFA) was added to 0.2% (v/v) to terminate trypsinization. Peptide samples were cleaned using C18 Silica tip columns (The Nest Group Inc., Southborough, MA; #SEM SS18V). C18 columns were wetted with 200 μL 40% ACN, 40% MeOH, followed by equilibration twice with 200 μL 2% ACN, 0.2% TFA. The 8 mL sample was then added in 200 μL portions, 3–4 drops at a time, incubated for 1 min, then repeated until entire sample had been applied. Columns were then washed with 3 portions of 200 μL 2% ACN, 0.2% TFA. Finally, the cleaned peptides were eluted with 200 μL 50% ACN, 0.2% TFA and vacuum‐dried using an Eppendorf Vacufuge (#22822128) with 45°C heat until dry for 30 min.
Dried samples were resuspended by adding 2 μL (20 μg) of a mixture of hydrophilic and hydrophobic paramagnetic beads as previously described (Hughes et al., 2014). Briefly, the mixture was acidified by adding formic acid to 0.25% (v/v) and mixed by pipetting to resuspend dried sample on tube walls. 195 μL of acetonitrile was added to a final concentration of > 95% and mixed carefully by pipetting up and down. Samples were incubated for 10 min, briefly centrifuged to pellet beads, and tubes were placed on magnetic rack. Following a 2 min incubation, the solution was carefully withdrawn and discarded. Beads were rinsed while on magnet with 180 μL of acetonitrile by pipetting up and down multiple times. Following a 2 min incubation, the solution was again carefully withdrawn and discarded, and tubes were briefly air‐dried. Peptides were eluted by adding 20 μL 2% DMSO, 0.2% formic acid (FA) and pipetting beads up and down. Following a 5 min incubation, tube was placed on magnetic rack and the eluate was carefully collected. The elution procedure was then repeated with the addition of 20 μL 0.2% FA and carefully collected and combined with the first eluate. Eluate was vacuum‐dried, resuspended in 20 μL ddH2O and peptide concentration was determined by A280 quantitation using a NanoDrop 2000 spectrophotometer.
2.16. Nanoparticle tracking analysis
Nanoparticle tracking analysis (NTA) was performed using a ZetaView PMX110 Instrument (ParticleMetrix, Inning am Ammersee, Germany) equipped with a 405 nm laser and integrated automated fluidics. Three cycles of recordings at the ‘high’ setting (2‐s videos) were collected of each sample with camera sensitivity set at 92, shutter at 70, minimum brightness at 15, minimum size at 10 and maximum size at 5000. Temperature was set at 26°C and monitored throughout the measurements. Videos recorded for each sample were analysed with ZetaView software version 8.04.02 SP3 to determine the concentration and size of measured particles with corresponding standard error. For analysis, auto settings were used for blur, minimum track length and minimum expected particle size. The ZetaView system was calibrated with 102 nm polystyrene microbeads (ThermoFisher Scientific #3100A) prior to every analysis session. PBS (Gibco #10010‐023) was used as diluent, and to avoid contaminating particles, a fresh bottle was opened for each analysis session. At least three separate EV preparations for each condition were analysed.
2.17. Statistical analysis
TER measurements, concentrations of small EVs released from RPE, modal and mean EV sizes, and immunoblot densitometry quantitation were tested for statistical significance using a two‐sample two‐tailed Student's t‐test assuming unequal variance; two‐way or one‐way ANOVAs with corrections for multiple corrections were used when appropriate. P‐values < 0.05 were considered statistically significant. All statistical analyses were performed using Prism Software (GraphPad Prism Version 9.4.1 (458) for MacOS, San Diego, CA).
2.17.1. Additional apical sEV proteome statistical analysis
Raw peptide abundances collected from mass spectrometry of H2O2‐treated (n = 2) and untreated (n = 2) apical sEVs were analysed using DESeq2 (Love et al., 2014). Technical replicates (n = 2) for each sample were combined using collapseReplicates‐DESeq2 and a median of ratios normalisation was applied to generate relative protein abundances. Differences in protein abundance by H2O2‐treatment condition were detected using a likelihood‐ratio test. P‐values were adjusted using an FDR cutoff of 0.1.
2.18. Functional enrichment and pathway analyses
Functional enrichment analyses for the category ‘Cellular component’ using the FunRich software v. 3.1.4 (Fonseka et al., 2021; Pathan et al., 2015; Pathan et al., 2017), was performed on the proteins increased ≥2‐fold in response to chronic H2O2 treatment, in basolateral pig RPE EVs, and in apical pig RPE EVs. The protein database used in FunRich software to compare our datasets against (to assess enrichment), was UniProt release 2023_02 (released on May 1, 2023).
Bioinformatics analyses were done using Qiagen Ingenuity Pathway Analysis software (Ingenuity IPA – 94302991) (Qiagen, Redwood City, CA). Protein lists with gene symbols were uploaded to IPA Datasets followed with the Core Analysis for Expression to identify enriched Canonical Pathways and protein Networks containing the uploaded proteins. The list of enriched pathways and networks were exported from Ingenuity IPA analysis.
3. RESULTS
3.1. Chronic subtoxic oxidative stress conditions do not affect tight junction integrity or canonical RPE protein expression
We developed a chronic subtoxic oxidative stress model of RPE by treating our highly differentiated polarized porcine RPE (pRPE) monolayer transwell cultures (Klingeborn et al., 2017) daily with 0.2 mM H2O2 and collecting conditioned media every 48 hrs from Control and Treated, for 4 weeks. The concentration was chosen from a range of concentrations of H2O2 as the one that achieved subtoxic oxidative stress conditions, mimicking early stages of RPE dysfunction, without loss of barrier integrity or outright RPE dysfunction and cell death. Fully differentiated RPE cultures form tight junctions which give rise to an epithelial fluid and ion barrier which can be assessed by measuring the trans‐epithelial electrical resistance (TER). Stressed or diseased RPE monolayers lose some barrier integrity that result in decreased TER (Rizzolo, 2014). Treatment with 0.5 mM H2O2 proved too aggressive with catastrophic loss of TER within a week (Figure S1). We monitored TER in the stressed RPE cultures treated with 0.2 mM H2O2 over the 4 weeks to confirm that epithelial barrier function was maintained above loss of barrier integrity, which occurs below 100 Ω•cm2 (Rizzolo, 2014), for the duration of the experiment (Figure 2a). A statistically significant TER decrease was observed at day 28, indicating that the oxidative stress is at the tipping point of a physiologically more severe effect after prolonged (chronic) H2O2 treatment of the cells. At the light microscopy level there was no detectable disruption of RPE cell morphology following 4 weeks of 0.2 mM H2O2 exposure (Figure S2a), and this was further confirmed using a cell cytotoxicity assay measuring the release of Lactate Dehydrogenase (LDH (Figure S2b).
FIGURE 2.
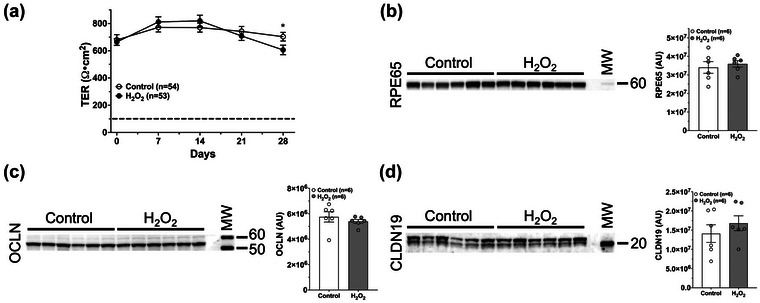
Chronic subtoxic oxidative stress conditions do not affect tight junction integrity or canonical RPE function. Fully differentiated and polarized pig RPE transwell cultures were treated or not for four weeks with 0.2 mM H2O2. (a) Transepithelial electrical resistance (TER) was measured weekly during the 4‐week experiment to assess the integrity of pRPE monolayers. Data from five separate experiments are shown. Throughout the experiment TER in H2O2‐treated cultures remained at levels similar to control cultures and above the level indicating intact barrier integrity (dashed line) (Rizzolo, 2014). Values plotted are mean ± SEM. Data were analysed by multiple unpaired t tests with Welch correction, assuming unequal variance. *p < 0.05. (b–d) Immunoblot and densitometric analysis of RPE65 (b), OCLN (c) and CLDN19 (d). Ten micrograms of total protein in lysates from 4‐week Control and H2O2‐treated RPE transwell cell culture lysates were loaded per lane. Each lane contains a lysate from an individual well from a 6‐well transwell plate. (b) RPE65, which is essential for normal RPE function, did not change under these oxidative stress conditions. (c) Occludin (OCLN), and (d) Claudin 19 (CLDN19), which are tight junction proteins essential for RPE barrier integrity, did not change under these oxidative stress conditions. Error bars are SEM. Unpaired Student's t‐test assuming unequal variance was used to assess statistical significance for treatment condition. MW, molecular weight markers. Apparent molecular weights in kDa are indicated on the right‐hand side. AU, arbitrary units.
We hypothesized that the chronic stress induced by 4 weeks of 0.2 mM H2O2 treatment would have little to no detectable impact on normal cellular function since the cells remained morphologically normal with a normal TER throughout the oxidative stress treatment. To test this, we assayed RPE cell lysates isolated from pRPE cultures with or without H2O2 for 4 weeks, by immunoblotting for changes to levels of three relevant markers: (1) RPE65, which is an enzyme essential for the visual cycle pathway in RPE cells (Figure 2b), (2) Occludin (OCLN), a tight junction protein essential for barrier integrity (Figure 2c), and (3) Claudin 19 (CLDN19), an additional tight junction protein (Figure 2d). The concentrations of all three proteins remained unchanged under oxidative stress conditions compared to controls, indicating that these conditions were largely subtoxic.
To assess the nature of the chronic stress in our model more carefully, we also performed immunoblotting analyses for Superoxide Dismutase 1 (SOD1), which is involved in responses to increased superoxide ions (O2 −) (McCord et al., 1971); Catalase (CAT), which is involved in responses to increased H2O2 (McCord et al., 1971); malondialdehyde (MDA) adduction on proteins, which results from increased lipid peroxidation in response to H2O2 treatment (Barrera et al., 2018; Sachdeva et al., 2014); and HSPA5, an ER stress marker for the unfolded protein response (Wang et al., 2017) (Figure 3a–d). Taken together, these additional markers demonstrate that our oxidative stress model, although subtoxic, results in increased oxidative stress in the cell. The decrease in Catalase levels and increase in MDA adduction, points to peroxisomes as one of the main sites of oxidative stress inside RPE cells under these conditions.
FIGURE 3.
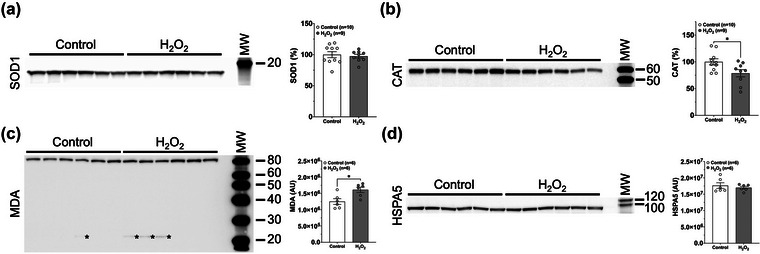
Chronic subtoxic oxidative stress conditions affect stress‐related markers. Immunoblot and densitometric analysis of RPE SOD1 (a), CAT (b), MDA (c) and HSPA5 (d). Ten micrograms of total protein from 4‐week Control and H2O2‐treated RPE transwell cell culture lysates were loaded per lane. (a) Superoxide dismutase 1 (SOD1), which is involved in responses to increased superoxide ions (O2 −), did not change. (b) Catalase (CAT), which is involved in responses to increased H2O2, decreased. (c) The abundance of different Malondialdehyde (MDA) adducts increased in response to H2O2 treatment, especially of the proteins with sizes of 80 and 22 kDa (marked with asterisks). (d) Heat Shock Protein Family A (Hsp70) Member 5 (HSPA5), an ER stress marker, did not change. Error bars are SEM. Unpaired Student's t‐test assuming unequal variance was used to assess statistical significance for treatment condition. MW, molecular weight markers. Apparent molecular weights in kDa are indicated on the right‐hand side. AU, arbitrary units.
3.2. A chronic subtoxic oxidative stress RPE model increases basolateral sEV release and causes changes in the sEV proteome
EVs released basolaterally from control and H2O2‐treated pRPE during weeks 1 & 2 and 3 & 4 were quantified by Nanoparticle Tracking Analysis (NTA). Basolateral EV release was significantly increased during weeks 3 & 4 of H2O2 treatment (Figure 4a). No significant differences were observed in average or modal EV sizes under Control or H2O2 conditions (Table S1). NTA analyses of apical EVs showed a decreased release in response to H2O2 treatment (Figure S3). Basolaterally released pRPE EVs isolated by cushioned Iodixanol density gradient ultracentrifugation (C‐DGUC, Figure 1) from fractions with densities corresponding to sEVs (Figure S4), were shown by immunoblotting to contain the canonical exosome markers, Syntenin‐1 and Annexin A2 (ANXA2) (Figure 4b,c). The absence of the ER marker Calreticulin (CALR) in these EV preparations confirmed a lack of cellular contamination. These EV markers were used for identification of sEVs, not quantitation, as their abundance per EV appeared to change in response to stress conditions.
FIGURE 4.
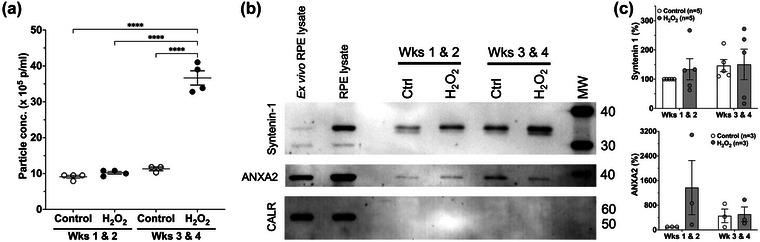
Chronic subtoxic oxidative stress RPE model increases basolateral sEV release and cause changes in canonical exosome protein markers. Fully differentiated and polarized pig RPE transwell cultures were treated or not for four weeks with 0.2 mM H2O2. (a) EVs released basolaterally from control and H2O2‐treated pRPE during weeks 1 & 2 and 3 & 4 were quantified by NTA. EV release was significantly increased during weeks 3 & 4 of H2O2 treatment. Mean ± SEM is indicated. One‐way ANOVA analysis for treatment condition followed by Tukey's post‐hoc multiple comparison analysis indicated as ****p < 0.0001. (b) Representative immunoblots of basolateral pRPE EVs isolated by cushioned Iodixanol density gradient ultracentrifugation (C‐DGUC). Equal volumes of EV lysates were used in these analyses. Exosome markers Syntenin‐1 and Annexin A2 (ANXA2) demonstrates the presence of exosomes and sEVs while the absence of the ER marker Calreticulin (CALR) in EV preparations indicates a lack of cellular contamination. Lysate of RPE cells freshly isolated from pig eyes (ex vivo RPE lysate), and lysate of cultured pig RPE cells (RPE lysate) are indicated. Apparent molecular weights in kDa are indicated on the right‐hand side. (c) Quantitation of chemiluminescent immunodetection signal density on immunoblots. All values are normalized to the ‘Control Wks 1 & 2′ EV preparation and expressed in percent. Quantitation of Syntenin‐1 immunodetection is shown in the upper panel, and ANXA2 quantitation in the lower panel. Error bars are SEM.
We processed the entirety of these sEV preparations isolated by C‐DGUC by an in‐solution bead‐based digestion protocol followed by electrospray‐tandem mass spectrometric analysis. Basolateral sEVs from Control and H2O2‐treated pRPE cultures were compared in a quantitative manner using the ProGenesis QI software suite. Proteins that were increased 2‐fold or more in two sets (individual mass spectrometry datasets from biological replicate EV preparations) during weeks 3 & 4, and one set during weeks 1–4, are shown in Table 1. Proteins decreased two‐fold or more are shown in Table S2. Proteomic analyses of basolateral sEVs released during weeks 1 & 2 were variable between sample sets and did not reveal any clear consensus among proteins increased or decreased 2‐fold or more (data not shown).
TABLE 1.
Proteins increased ≥2‐fold in at least two of the three sets of basolateral sEVs released during weeks 3 & 4 from H2O2‐treated RPE cultures compared to untreated. Sets #1 & #2 represent two biological replicates. Set #3 was generated from sEVs released during an entire 4‐week experiment. Each set was generated from two technical mass spectrometric replicate runs.
| Protein name | Gene name | Average fold increase (H2O2/Ctrl) | Average abundance ranking in H2O2 EXOs* |
|---|---|---|---|
| NHERF Family PDZ Scaffold Protein 1 | NHERF1/SLC9A3R1 | 76.46 ± 51.50 | 147 |
| Desmoglein 1 | DSG1 | 71.25 ± 19.63 | 81 |
| Proteolipid Protein 2 | PLP2 | 32.30 ± 25.23 | 66 |
| Junction plakoglobin | JUP | 14.05 ± 2.82 | 63 |
| Integrin Subunit Alpha 3 | ITGA3 | 13.14 ± 4.83 | 118 |
| 5′‐Nucleotidase Ecto | NT5E | 10.06 ± 0.78 | 90 |
| Moesin | MSN | 9.62 ± 5.79 | 77 |
| Keratin 2 | KRT2 | 7.12 ± 1.74 | 8 |
| Eukaryotic Translation Elongation Factor 1 Alpha 1 | EEF1A1 | 6.53 ± 3.98 | 43 |
| Lemur Tyrosine Kinase 3 | LMTK3 | 5.77 ± 0.46 | 9 |
| Integrin Subunit Beta 1 | ITGB1 | 5.69 ± 3.23 | 23 |
| Lactate Dehydrogenase A | LDHA | 5.05 ± 0.94 | 100 |
| RANBP2‐Type and C3HC4‐Type Zinc Finger Containing 1 | RBCK1 | 4.87 ± 2.04 | 112 |
| ATPase Na+/K+ Transporting Subunit Alpha 1 | ATP1A1 | 4.31 ± 0.93 | 19 |
| Actin Beta | ACTB | 4.25 ± 2.02 | 9 |
| Peroxiredoxin 1 | PRDX1 | 4.11 ± 1.42 | 79 |
| Keratin 1 | KRT1 | 3.42 ± 1.49 | 4 |
| Hemoglobin Subunit Alpha 1 | HBA1 | 3.24 ± 1.15 | 80 |
| Keratin 14 | KRT14 | 3.22 ± 0.15 | 10 |
| Integrin Subunit Alpha 7 | ITGA7 | 3.10 ± 0.32 | 56 |
| Complement C4A | C4A | 2.64 ± 0.52 | 94 |
Note: Proteins involved in desmosome and hemidesmosome structure and function are indicated by grey background. ± = SEM; * = Abundance in sEVs released during H2O2 treatment, proteins ranked from highest to lowest.
Apical sEVs isolated in the same way as basolateral sEVs were also processed and analysed the same way. The apical sEV proteins that were increased (Table 2) or decreased (Table S3) two‐fold or more during weeks 3 & 4 of H2O2 treatment of the pRPE are shown.
TABLE 2.
Proteins increased ≥2‐fold in both sets of apical sEVs released during weeks 3 & 4 from H2O2‐treated RPE cultures compared to untreated. Sets #1 & #2 represent two biological replicates. Each set was generated from two technical mass spectrometric replicate runs.
| Protein name | Gene name | Average fold increase (H2O2/Ctrl) | Average abundance ranking in H2O2 EXOs* |
|---|---|---|---|
| DnaJ Heat Shock Protein Family (Hsp40) Member C13 | DNAJC13 | 13.77 ± 9.55 | 354 |
| Multiple EGF like domains 6 | MEGF6 | 7.98 ± 3.16 | 507 |
| Hydroxysteroid 17‐beta dehydrogenase 12 | HSD17B12 | 6.79 ± 4.39 | 79 |
| Annexin A11 | ANXA11 | 4.79 ± 0.36 | 44 |
| Thioredoxin Related Transmembrane Protein 3 | TMX3 | 4.55 ± 2.53 | 419 |
| 2′−5′‐Oligoadenylate Synthetase 2 | OAS2 | 3.59 ± 0.10 | 255 |
| Caldesmon 1 | CALD1 | 3.06 ± 0.90 | 148 |
| Serine Protease 12 | PRSS12 | 3.05 ± 0.80 | 478 |
| Vesicle associated membrane protein 3 | VAMP3 | 2.75 ± 0.57 | 283 |
Note: ± = SEM; * = Abundance in sEVs released during H2O2 treatment, proteins ranked from highest to lowest.
3.3. Subtoxic oxidative stress induces basolateral sEV release of desmosomal and hemidesmosomal proteins
Analysis of the basolateral sEV proteome revealed that a set of proteins important for desmosomal and hemidesmosomal ECM‐attachment structure and function were statistically significantly increased upon oxidative stress (see proteins highlighted by a grey background in Table 1). Functional enrichment analyses using the FunRich analysis tool (version 3.1.4) confirmed these observations and robustly identified the ‘cellular component’ categories ‘cornified envelope’, ‘ITGA3‐ITGB1 complex’ and ‘integrin complex’ as statistically significantly increased in sEVs released under oxidative stress conditions (Figure S5a). The majority of the proteins annotated to the ‘cornified envelope’ category (Gene Ontology definition GO:0001533 in EMBL‐EBI database) are keratins and desmosomal proteins (see the above GO term at https://www.ebi.ac.uk/QuickGO/). Pathway analyses using the Qiagen IPA software of the increased basal EV proteins, also identified affected interaction networks of keratins (‘cornified envelope’), desmosomes and hemidesmosomes (integrin complexes), further validating these pathways as affected by chronic oxidative stress, see Figure S6a.
Interestingly, enrichment of desmosomal or hemidesmosomal proteins were not seen in apical sEVs (Table 2, Figures S5b and S6b), suggesting a highly polarized response to oxidative stress. An increase in the hemidesmosomal marker, Integrin beta 1 (ITGB1) in the protein cargo of basolaterally released sEVs under oxidative stress was further validated by immunoblotting (Figure 5a). It is also worth noting that ITGA3 and ITGB1, which form a preferred heterodimer (DiPersio et al., 1997; Li et al., 2021), were both increased in response to stress (Table 1).
FIGURE 5.
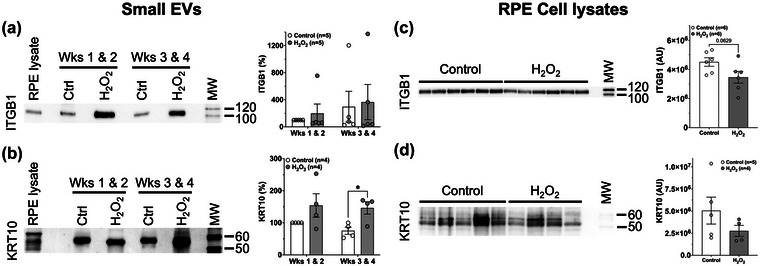
Immunoblotting validation of a subset of desmosomal proteins released via basolateral sEVs under subtoxic oxidative stressor conditions. (a,b) Basolaterally released sEVs were analysed by immunoblotting for a subset of desmosomal proteins in control and H2O2‐treated RPE cultures during the early (weeks 1 & 2) and late (weeks 3 & 4) parts of 4‐week experiments. Representative immunoblots for (a) Integrin beta 1 (ITGB1) and (b) Keratin 10 (KRT10) show an increased abundance of these proteins in sEVs released from H2O2‐treated RPE cultures. This correlated with findings from unbiased mass spectrometric analyses (see Table 1). Quantitation of chemiluminescent immunodetection signal on immunoblots are shown to the right in panels. All values are normalized to the ‘Control Wks 1 & 2′ EV preparation and expressed in percent. (c,d) Lysates of Control and H2O2‐treated RPE transwell cell cultures after 4‐week experiments were analysed by immunoblotting. Each lane contains a lysate from an individual well in 6‐well transwell plates. Representative blots for (c) ITGB1 and (d) KRT10 are shown. Quantitation of chemiluminescent immunodetection signal density on immunoblots was done as described in (a,b) and show a decrease in cells under oxidative stress conditions. Unpaired Student's t‐test assuming unequal variance was used to assess statistical significance for treatment condition. P‐values below 0.1 are indicated. *p < 0.05. AU, arbitrary density units.
Immunoblotting for the desmosome and hemidesmosome‐anchoring protein, KRT1 proved challenging due to a lack of high‐quality antibodies against porcine KRT1. Therefore, given that KRT1 is known to form preferred heterodimers with KRT10, and these pairs play an essential role in desmosome structure integrity (Wallace et al., 2012), we analysed the quantity of KRT10 as a proxy for KRT1 in basal sEVs. KRT10 was only increased more than two‐fold in one of three proteomic datasets (Tables S8–10), and was therefore not included in Table 1. However, KRT10 was increased in response to oxidative stress on immunoblots of protein lysates from three separate basal sEV preparations (Figure 5b). This correlated with proteomic findings for KRT1 (Table 1).
Significantly, a similar subset of desmosomal proteins were increased in sEVs released basolaterally from untreated induced pluripotent stem cell (iPSC)‐derived RPE from AMD patients with high genetic AMD risk compared to low‐risk control lines (Table 3, Tables S4, and S13–16). Pathway analyses of the basal EV proteins increased in AMD patient RPE lines, again demonstrated striking similarity to the primary pig RPE model, in the affected pathway interaction networks of keratins (‘cornified envelope’), desmosomes and hemidesmosomes (integrin complexes), see Figure S6c.
TABLE 3.
Desmosome and hemidesmosome‐associated proteins in basolateral sEVs increased ≥2‐fold in at least two of four iPSC‐derived RPE lines from donors with high genetic AMD risk compared to four iPSC‐RPE lines from donors with low risk (Grassmann et al., 2012; Brandl et al., 2014). Data was generated from two technical mass spectrometric replicate runs.
| Protein name | Gene name | Average fold increase (high‐risk/low‐risk) | Average abundance ranking in high‐risk EXOs* |
|---|---|---|---|
| CD151 | CD151 | 144.69 ± 244.37 | 20 |
| Keratin 34 | KRT34 | 64.47 ± 43.70 | 120 |
| Junction Plakoglobin | JUP | 14.93 ± 11.96 | 126 |
| Keratin 5 | KRT5 | 6.27 ± 3.68 | 21 |
| Keratin 1 | KRT1 | 4.87 ± 2.88 | 3 |
| Keratin 16 | KRT16 | 4.84 ± 4.54 | 19 |
| Keratin 2 | KRT2 | 3.75 ± 1.56 | 9 |
| Desmoplakin | DSP | 3.47 ± 1.22 | 121 |
| Keratin 81 | KRT81 | 3.05 ± 3.33 | 48 |
| Keratin 9 | KRT9 | 2.62 ± 2.83 | 17 |
Concomitant with the increased amounts of desmosomal and hemidesmosomal proteins in sEVs released under oxidative stress conditions, immunoblotting analyses of RPE cell lysates revealed a decrease in ITGB1 and KRT10 in the RPE lysates treated for 4 weeks with 0.2 mM H2O2 compared to controls (Figure 5c,d). These complementary results further underscore that the sEV pathway is a route of protein shedding under these chronic oxidative stress conditions.
The protein cargo identified by proteomic analysis of the apical sEVs did not reveal any obvious pathways affected by H2O2 treatments, including no changes in desmosome pathway components. This was confirmed by in depth biostatistical analyses of the apical proteomic data from the primary pig RPE cultures. As expected, no changes to desmosome shedding were found in either of these apical datasets. The only statistically significant changes found using this analysis method were a decrease in Alpha‐2‐Macroglobulin (A2M), Fibrillin 1 (FBN1), and Talin 1 (TLN1) in response to H2O2 treatment, see Table S5.
3.4. Chronic subtoxic oxidative stress increases deposition of sEV proteins in the ECM
We next tested whether the proteins that were increased in basolaterally released sEVs following chronic oxidative stress were also deposited in the basal ECM. We developed a protocol to lyse and remove the overlying cells, followed by rigorous solubilisation of the ECM. The ECM preparations were analysed by immunoblotting for several of the proteins increased in the basolaterally released sEVs in response to oxidative stress.
Interestingly, a subset of the basolateral desmosome and hemidesmosome sEV proteins that were increased during stress conditions (DSG1, ITGB1, and KRT10) were also significantly increased in the ECM (Figure 6). Further studies will be needed to investigate whether ECM deposition of these sEV‐associated proteins play a role in overall deposit formation.
FIGURE 6.
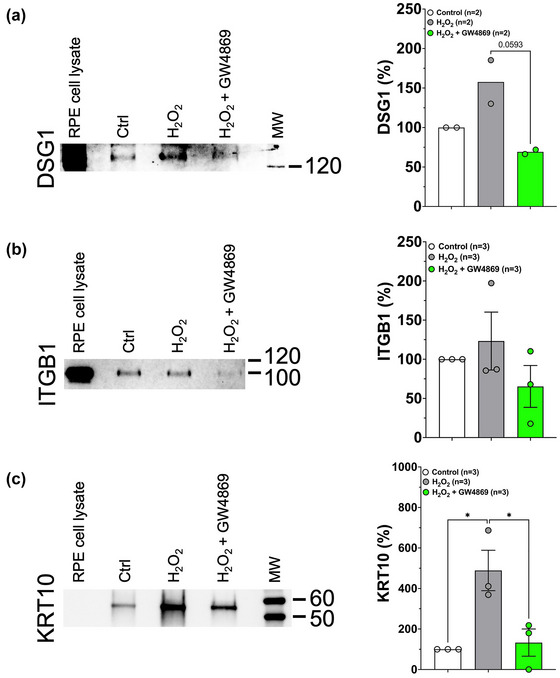
Desmosomal and hemidesmosomal proteins are deposited into the basal ECM under subtoxic oxidative stress conditions and this deposition is blocked by inhibiting sEV release. Increased deposition of DSG1 (a), ITGB1 (b) and KRT10 (c) into ECM is seen under oxidative stress conditions. The increased ECM deposition under oxidative stress conditions (0.2 mM H2O2) can be blocked by inhibiting small EV release with 4 μM of the nSMase 2 inhibitor GW4869. Quantitation of chemiluminescent immunodetection signal is shown in the graphs on the right‐hand side and are based on two to three experiments in all cases. Error bars are SEM. Data were analysed by One‐way ANOVA for treatment condition followed by Tukey's post‐hoc test for multiple comparisons. P‐values below 0.1 are indicated. *p < 0.05.
3.5. Many common drusen and ECM proteins are found in RPE exosomes, and canonical exosome proteins are found in both ex vivo and in vitro RPE ECM
We recently generated extensive proteomic data of human and porcine BrM, and porcine RPE ECM (some of the data published in (Kelly et al., 2020)) and compared those data to our previously published porcine RPE basal exosomes (Klingeborn et al., 2017). Interestingly, we found many common drusen and ECM proteins that are present in highly purified RPE exosomes. For ease of presentation and for the focus of the current study, we show a comparison of a subset of known protein components of drusen, ECM, and basally secreted exosomes in Table S6. The table also clearly shows the presence of a number of exosomal marker proteins in both porcine and human ex vivo ECM, known as Bruch's Membrane (BrM); as well as in vitro RPE ECM. Finally, the table shows a high degree of similarity in the composition of human and porcine‐derived samples overall, further validating the utility of the porcine model.
3.6. Inhibition of basolateral sEV release during chronic oxidative stress decreases deposition of exosomal proteins in ECM
After establishing that some proteins found in basally secreted sEVs were also increased in ECM, we tested if inhibition of sEV release could prevent this protein accumulation in the ECM. To decrease sEV release, several different concentrations of the neutral Sphingomyelinase 2 (nSMase 2) inhibitor GW4869 were used since it has previously been shown to decrease small EV secretion (Kosaka et al., 2010; Trajkovic et al., 2008). Based on these studies we tested 4 and 20 μM concentrations and found that basolateral sEV release was significantly decreased over a 4‐week treatment in fetal human RPE (Figure S7). Neither concentration affected modal or average sEV sizes (Table S7). However, 20 μM caused some morphological changes in porcine RPE (Figure S8a), and TER was significantly affected throughout the experiment with a near loss of barrier integrity at 4 weeks (Figure S8b). Thus, we settled on 4 μM which was well tolerated morphologically (Figure S9a) and caused no decrease in TER throughout the 4‐week experiment (Figure S9b).
GW4869 (4 μM) treatment concurrent with H2O2 stress prevented the increased deposition of DSG1, ITGB1, and KRT10 seen in response to H2O2 stress alone (Figure 6a–c), demonstrating that this deposition is sEV‐mediated.
4. DISCUSSION
In the current study, we show for the first time that chronic low‐level oxidative stress in highly polarized primary RPE cultures induces basal‐side specific desmosome and hemidesmosome shedding via sEVs. We also show that release of these sEVs correlates with deposition of desmosomal and hemidesmosomal proteins into ECM, and that this deposition can be prevented by inhibition of sEV release. Dysfunction of desmosomes and hemidesmosomes leads to impaired oBRB function, which is known to play a role in AMD pathology (Tisi et al., 2021). The implications of oBRB breakdown in disease are profound as it results in the leakage of blood contents and influx of osmolytes that lead to accumulating fluid in the subretinal space (edema) and ultimately to exudative retinal detachment (Xu & Le, 2011). Thus, early detection of RPE dysfunction is essential for efficacious intervention to maintain oBRB integrity. Significant in this regard, our findings provide potential novel biomarkers of early cellular dysfunction and opportunity for therapeutic intervention in aging‐related retinal diseases, such as AMD.
We investigated changes to the protein content of EVs and in particular sEVs, released both apically and basolaterally from a highly differentiated and polarized cell culture model of the outer blood‐retinal barrier, under conditions of chronic subtoxic oxidative stress. Chronic subtoxic stress in the RPE (defined here as not causing overt morphological or functional dysfunction) is thought to play a central role in the pathophysiology of AMD (Bowes Rickman et al., 2013) and we therefore sought to identify protein changes in RPE‐derived sEVs that precede overt morphological changes and severe cellular dysregulation, in order to identify potential pre‐symptomatic biomarkers of AMD.
We have previously shown that both apical and basolateral exosomes can be isolated at a high level of purity from polarized RPE cultures, and that their proteomes are distinctly different, reflecting polarized cargo loading (Klingeborn et al., 2017). In order to adhere to the guidelines for minimum requirements for characterisation of EVs that were recently described by the EV community (MISEV2018; (Théry et al., 2018)), we analysed isolated sEVs for the presence of several sEV marker proteins (Syntenin, ANXA2) and other membrane‐associated proteins (ITGB1), as well as the absence of markers of cellular contamination (e.g., Calreticulin; ER marker) by immunoblotting. We also measured the size distribution of the sEV preparations, which were of expected sizes for small EVs. We implemented an improved cushioned density‐gradient ultracentrifugation (C‐DGUC) method for EV isolation that resulted in a robust enrichment of sEVs while maintaining the efficient removal of contaminants seen in traditional DGUC. Analysis of the proteomes of the sEV preparations clearly demonstrated that the majority of the contents were sEVs, given the high percentage of membrane and transmembrane proteins, as well as canonical small EV/exosome proteins, Tables S8–10 (basolateral EVs weeks 3 & 4) and S11–12 (apical EVs weeks 3 & 4).
There was some variation between experiments, in which increases in sEV basolateral‐specific desmosome and hemidesmosome shedding was not only seen during weeks 3 & 4 but could also be seen in the sEVs released during weeks 1 & 2 (Figure 5a,b). This is not surprising given that the level of resistance to stress in a subtoxic chronic setting may vary between batches of primary RPE cultures. It will be interesting to investigate in future studies in iPSC‐derived RPE cultures, if this variation in stress resistance is also seen between individual donor cell lines, and if it is seen with more targeted oxidative stressors such as the mitochondrion redox cycler Paraquat.
Based on our findings it is important to discuss the difficulties with validating proteomic findings via immunoblotting. In cases of relatively low abundance proteins which exhibit a large change between treatment conditions by mass spectrometry, amounts may be close to the limit of detection in many immunoblot settings. This was the case with ANXA2 and ITGB1. ITGB1 was robustly increased in basolateral sEVs released during weeks 3 & 4 in response to H2O2, as assessed by mass spectrometry. However, validation by immunoblotting for these two proteins showed a large degree of variability, see Figures 4, 5, and Figure S10. This is a well‐known issue for validation of proteomic findings, and has been discussed in detail in the following publications (Handler et al., 2018; Mehta et al., 2022). Given that the main findings of the current study were reproduced in several mass spectrometry datasets both from primary RPE cultures as well as hiPSC‐RPE cultures, combined with the superior sensitivity and accuracy of mass spectrometry compared to immunoblotting, we feel confident in the results supported by the mass spectrometry.
The identification of sEV‐mediated desmosomal and hemidesmosomal shedding under chronic subtoxic oxidative stress conditions, is a novel finding. Effects of oxidative stress in the RPE accumulate during aging, resulting in disruption of the outer retinal blood‐barrier (Naylor et al., 2019). Tight junctions are critical in maintaining this barrier and the integrity of the RPE, but how tight junctions or other structural junctions are dismantled during oxidative stress is unknown. Desmosomes are different from tight and adherens junctions, located basally to those junctions in the lateral membrane, and are specialized and highly ordered membrane domains that mediate cell‐cell contact and strong adhesion, Figure S11 and (Kowalczyk & Green, 2013). Adhesive interactions at the desmosome are coupled to the intermediate filament cytoskeleton. By mediating both cell‐cell adhesion and cytoskeletal linkages, desmosomes mechanically bind cells within tissues and thereby function to resist mechanical stress (Kowalczyk & Green, 2013). Hemidesmosomes on the other hand, are multiprotein complexes that facilitate the stable adhesion of basal epithelial cells to the underlying basement membrane (Walko et al., 2015), see Figure S11. Strikingly, we found that desmosome‐ and hemidesmosome‐associated proteins were being released as sEV cargo on the basolateral side, but not the apical side of the RPE. This polarized specificity is perhaps not surprising given the lateral and basal locations of desmosomes and hemidesmosomes, respectively. Nonetheless, these findings further underscore the highly polarized endosomal pathways that govern cargo loading of EVs inside the fully differentiated RPE cell. The details of how this polarized sorting of apical vs basolateral cargo into sEVs and other EVs is achieved, is not currently well understood and warrants further investigation. The current study does not distinguish between desmosomes or hemidesmosomes as the major source of the anchoring junctions shed via sEVs since proteins from both were detected. Both desmosomal (DSG1, JUP, and DSP) and hemidesmosomal (ITGB1 and ITGA3) component proteins were increased in basolaterally released sEVs under stress conditions, suggesting that they were both shed. Future studies aimed at co‐immunoprecipitation experiments and similar approaches will be required to specifically clarify the relative contribution and time‐course of sEV‐mediated desmosomal versus hemidesmosomal shedding under chronic subtoxic oxidative stress conditions.
We are confident that we have demonstrated that desmosomes are associated with sEVs and/or exosomes, as opposed to being shed and present as separate multiprotein complexes from sEVs, based on the following lines of evidence: (1) Desmosomes were identified in density gradient fractions containing exosomes and sEVs, with densities that indicate lipid content found only in EVs and lipoprotein particles (mainly LDL; LPs); (2) In order for desmosomes to be exclusively present separate from lipid‐containing vesicles and/or particles, their density (proteins have higher density than lipids) would place them in fractions with higher densities than those in which the EVs are located, and those higher density fractions were not used in our analyses; (3) Desmosomes and hemidesmosomes are plasma membrane‐integral and ‐binding structures that are unlikely to exist separate from lipid membranes; and (4) The lipid and cholesterol content of LPs are not in the form of lipid bilayers required for intact assembly of desmosomes.
It is remarkable that highly similar protein signatures reflecting desmosome and hemidesmosome shedding were also found in basal sEVs from high AMD‐risk patient‐derived iPSC‐RPE lines not subjected to oxidative stress (Table 3 and Table S4). This suggests that robust common pathways in oxidative stress and AMD pathogenesis, such as gene networks that respond to environmental stressors (Hyttinen et al., 2019), are responsible for these changes in RPE monolayers in both porcine and human cell culture models. Future studies investigating the protein content of apical and basolateral sEVs from hiPSC‐RPE generated by additional laboratories and patient groups, would be important to validate the findings presented here. In addition, the use of other types of oxidative stressors, such as targeted mitochondrial uncouplers or oxidized lipids, may help clarify the exact intracellular dysfunction causing this early‐stage desmosome and hemidesmosome dismantling, and how it may affect intercellular desmosome‐mediated signalling.
Oxidative stressor experiments in cell culture often raise concerns of the contributions of apoptosis and other severely destructive impacts on the cell that can lead to release of large amounts of membrane blebs. Therefore, we chose to use low levels of the oxidative stressor H2O2 over an extended timeframe in the current study. Very few previous studies have investigated the impact of prolonged oxidative stress in RPE for more than 72 hrs (Flores‐Bellver et al., 2021) and, to our knowledge, none at subtoxic levels as in the current study. In addition, none have done so with highly purified and validated sEV isolation methods (Klingeborn et al., 2017) as in the current study. Given the lack of any observable cell loss in light microscopic analyses, and lack of LDH release under these oxidative stress conditions (Figure S2a,b), there is no reason to expect that any apoptotic processes were underway, or any release of apoptotic bodies. Furthermore, our exosome/small EV isolation protocol includes a pre‐clearing centrifugation step at 10,000 x g for 30 min prior to using the cleared supernatant for the subsequent C‐DGUC steps. Thus, if any traditional apoptotic bodies (ø≈0.5–2 μm; (Battistelli & Falcieri, 2020)) were released, this pre‐clearing step would pellet and remove the vast majority of them. If a subpopulation of apoptotic bodies escapes pelleting at 10,000 x g, they would however locate to heavier density fractions (ϱ = 1.12–1.23 g/mL) in the density gradient (Zhang et al., 2022) than those used for analyses in the current study. In addition, our in‐depth proteomic analyses of the sEV preparations under stress conditions (Tables S8–12), did not show an increase in traditional apoptotic body markers such as Caspases, Lamins, and ER proteins such as Calreticulin (Zhang et al., 2022), again demonstrating that our small EV preparations contain minimal to no amounts of apoptotic bodies.
To further ensure that our oxidative stressor conditions were indeed subtoxic, we analysed the protein levels of the canonical RPE protein RPE65. RPE65, is an isomerase involved in the visual cycle, responsible for converting all‐trans‐retinyl ester to 11‐cis‐retinol. We did not detect a difference in RPE65 expression between control RPE cells and stressed RPE cells (Figure 2b) after 4 weeks of oxidative stress. A previous study showed decreased RPE65 expression in response to H2O2‐induced acute oxidative stress in RPE cultures (Alizadeh et al., 2001). We also analysed the levels of two tight junction proteins, Occludin and Claudin 19, which are both important to maintain the RPE barrier (Rizzolo, 2014). We did not observe a change in expression of either protein between control or stressed RPE cells after 4 weeks of oxidative stress (Figure 2c,d). We observed a small statistically significant TER decrease in H2O2‐treated cultures at Day 28, at the end of the experiment, and although not decreased in abundance, a change in the subcellular location of OCLN and/or CLDN19 may account for this observation. A previous study in a porcine intestinal epithelial cell line (IPEC‐J2) exposed to short‐term acute H2O2‐mediated oxidative stress, showed significant reduction in the protein levels of the tight junction proteins Claudin‐1 and Occludin, as well as the tight junction adaptor and adherens junction protein ZO‐1 (Zhuang et al., 2019). Similarly, RPE oxidative stress studies using 30 min to 24‐h treatment experiments with a high concentration of H2O2 (0.5–2 mM), led to loss of barrier markers such as Occludin and ZO‐1 (Bailey et al., 2004; Miura & Roider, 2009). Thus, our lack of observed change in the RPE65, Occludin and Claudin 19 levels demonstrate that the chronic oxidative stress conditions used in the current study were subtoxic.
To clarify the nature and subcellular site of the oxidative stress experienced by the RPE cells under these subtoxic conditions, we included immunoblotting and quantitation for protein levels of the enzymes Superoxide Dismutase 1 (SOD1) and Catalase (CAT), that are involved in responses to increased superoxide ions (O2 −) and H2O2, respectively (McCord et al., 1971). We found that SOD1 levels were not significantly changed under these conditions (Figure 3a), while Catalase levels were decreased (Figure 3b). Although this may initially seem counterintuitive, previous studies have shown, that chronic oxidative stress in particular, negatively impacts the cell's ability to control high levels of superoxide ions and H2O2, as evidenced by decreased levels of SOD1 and/or Catalase (Ismail et al., 2016; Sullivan‐Gunn & Lewandowski, 2013). Of particular interest is a previous study showing that Catalase activity is decreased in RPE cells isolated from AMD donors compared to controls, while SOD1 activity in donor RPE is not affected by AMD disease status (Liles et al., 1991). These observations support that our oxidative stress model does indeed replicate some of the characteristics of RPE dysfunction in AMD.
In addition, we performed immunoblotting for malondialdehyde (MDA) adducts on proteins in RPE cell lysates from Control and H2O2‐treated cultures. MDA adduction is the result of lipid peroxidation of proteins and occurs in highly oxidative environments (Barrera et al., 2018; Sachdeva et al., 2014). As shown in Figure 3c, the chronic oxidative stress conditions used resulted in significantly increased levels of MDA‐adducted proteins. Finally, we also performed immunoblotting for HSPA5 (also known as GRP78 or BiP), which is a heat shock protein localized to the lumen of the endoplasmic reticulum (ER) where it operates as a typical HSP70 chaperone involved in the folding and assembly of proteins in the ER and is a master regulator of ER homeostasis. As such, increased HSPA5 levels are considered a marker of increased ER stress (Wang et al., 2017). No change was seen in the levels of HSPA5 (Figure 3d), suggesting that specific ER stress is not a feature of our oxidative stress RPE model. Taken together, these additional markers show that our chronic oxidative stress model, although subtoxic, results in increased oxidative stress in the cell. The decrease in Catalase levels and increase in MDA adduction, points to peroxisomes as one of the main sites of oxidative stress inside RPE cells under these conditions.
Interestingly, Apolipoprotein E (ApoE), which is a common constituent of drusen in AMD eyes (Anderson et al., 2001), was not increased in basolaterally released sEVs under these oxidative stress conditions (Tables S8–10). This is not a surprise given that ApoE is a major component of lipoprotein particles, rather than EVs released from RPE. A recent study (Flores‐Bellver et al., 2021) subjecting iPSC‐RPE to stress with a Cigarette Smoke Extract (CSE; (Gellner et al., 2016)), reported an increase of ApoE in EVs. However, EVs in that study were isolated by differential ultracentrifugation (DUC) rather than by density gradient ultracentrifugation (DGUC) in the current study, which is considered the gold standard in the field (Théry et al., 2018). It has been shown in numerous studies (Brennan et al., 2020; Langevin et al., 2019) that DUC EV preparations contain markedly higher amounts of lipoproteins compared to DGUC EV preparations. Another difference between the studies is that although both employed a 4‐week treatment duration, the CSE study added stressor every 48 hrs, while in the current study, the stressor (0.2 mM H2O2) was added every 24 hrs. Thus, the differences in choice of oxidative stressor, study design, and in EV isolation method, are likely explanations for the differing results in the two studies.
In the current study, we also showed that DSG1, ITGB1 and KRT10 are deposited in increased amounts in ECM under chronic oxidative stress conditions. Importantly, this increased deposition could be blocked by inhibiting sEV release, demonstrating the exosomal origin of these proteins. Since formation of drusen and other deposits in the BrM is a major part of the AMD disease process (Bowes Rickman et al., 2013), and our data show that the exosomal pathway may play a role in this process; targeting sEV release from RPE may be feasible as a novel approach for therapeutic intervention in AMD and other retinal degenerative disorders. Different subpopulations of EVs are thought to be generated via ESCRT‐dependent and ceramide‐dependent (nSMase 2) biogenesis pathways, and these may be differentially utilized by apical vs basolateral EV release in highly polarized cell types (Matsui et al., 2021). However, this has not been studied in detail in RPE cells to date. Furthermore, it is not clear whether inhibition of basolateral EV release will shift release of EVs to the apical side or result in rerouting of EVs to lysosomal degradation. Several studies have recently reported that increased ceramide production in RPE cells is responsible for increased RPE dysfunction and is thought to play a role in the AMD disease process (La Cunza et al., 2021; Simon et al., 2021). It is not currently clear if this pathological effect is mainly or in part mediated via exosomes/sEVs. Great care will be needed in choosing targets for inhibition of basolateral EV release without affecting apical release, while also avoiding disturbing endosomal trafficking overall in RPE cells. Thus, additional future studies are warranted for detailed characterisation of the apical vs basolateral EV biogenesis and release pathways in RPE cells.
In conclusion, the disassembly of desmosomes and hemidesmosomes in RPE and release via sEVs and/or exosomes during chronic oxidative stress conditions has to our knowledge not been reported previously in any epithelial cell culture system. Thus, this finding presents novel targets for interventional treatments aimed at maintaining oBRB integrity in pre‐symptomatic and early‐stage AMD, as well as potentially in other retinal neurodegenerative diseases. Finally, the identified chronic oxidative stress sEV protein profiles unique to RPE cells (constituting the oBRB) prior to overt functional and morphological dysfunction, suggest they may be candidates for early‐stage AMD or even pre‐AMD biomarkers accessible in the systemic circulation.
AUTHOR CONTRIBUTIONS
Belinda J. Hernandez: Conceptualization; data curation; formal analysis; funding acquisition; investigation; methodology; project administration; validation; writing—original draft; writing—review and editing. Nikolai P. Skiba: Conceptualization; data curation; formal analysis; investigation; methodology; writing—review and editing. Karolina Plössl: Resources; writing—review and editing. Madison Strain: Data curation; formal analysis; methodology; validation; writing—review and editing. Yutao Liu: Data curation; formal analysis; writing—review and editing. Daniel Grigsby: Investigation; writing—review and editing. Una Kelly: Formal analysis; investigation; methodology; writing—review and editing. Martha A. Cady: Data curation; formal analysis. Vikram Manocha: Investigation. Arvydas Maminishkis: Methodology; resources; writing—review and editing. TeddiJo Watkins: Investigation. Sheldon S. Miller: Resources; writing—review and editing. Allison Ashley‐Koch: Data curation; formal analysis; writing—review and editing. William Daniel Stamer: Conceptualization; funding acquisition; methodology; supervision; writing—review and editing. Bernhard H. F. Weber: Funding acquisition; resources; writing—review and editing. Catherine Bowes Rickman: Conceptualization; data curation; formal analysis; funding acquisition; investigation; methodology; project administration; supervision; writing—original draft; writing—review and editing. Mikael Klingeborn: Conceptualization; data curation; formal analysis; funding acquisition; investigation; methodology; project administration; supervision; validation; writing—original draft; writing—review and editing.
CONFLICT OF INTEREST STATEMENT
We confirm that there are no known conflicts of interest associated with this publication and there has been no significant financial support for this work that could have influenced its outcome.
Supporting information
Supporting Information
Supporting Information
Supporting Information
Supporting Information
Supporting Information
Supporting Information
Supporting Information
Supporting Information
Supporting Information
Supporting Information
ACKNOWLEDGEMENTS
This study was supported by NIH grants R21EY033057 (M.K.), F31EY033170 (B.J.H.), R01EY031748 (C.B.R.), R01EY022359 and R01EY028608 (W.D.S.), R01EY032960 (Y.L), a grant from the Pro Retina Foundation Germany (B.H.F.W.), and a grant from the Foundation Fighting Blindness (C.B.R.). Duke University Department of Ophthalmology is supported by an unrestricted grant from Research to Prevent Blindness (RPB). In addition, a small unrestricted RPB grant to B.J.H. supported the study. A Core Grant for Vision Research (P30EY005722) from NEI (to Duke University), supported much of the work, including the mass spectrometric analyses carried out by N.P.S. A Core Grant for Vision Research (P30EY031631) from NEI (to Augusta University) supported the IPA analysis by Y.L.
Hernandez, B. J. , Skiba, N. P. , Plössl, K. , Strain, M. , Liu, Y. , Grigsby, D. , Kelly, U. , Cady, M. A. , Manocha, V. , Maminishkis, A. , Watkins, T. J. , Miller, S. S. , Ashley‐Koch, A. , Stamer, W. D. , Weber, B. H. F. , Bowes Rickman, C. , & Klingeborn, M. (2023). Polarized desmosome and hemidesmosome shedding via small extracellular vesicles is an early indicator of outer blood‐retina barrier dysfunction. Journal of Extracellular Biology, 2, e116. 10.1002/jex2.116
Contributor Information
Catherine Bowes Rickman, Email: bowes007@duke.edu.
Mikael Klingeborn, Email: mikael@mclaughlinresearch.org.
REFERENCES
- Ablonczy, Z. , & Crosson, C. E. (2007). VEGF modulation of retinal pigment epithelium resistance. Experimental Eye Research, 85(6), 762–771. [DOI] [PMC free article] [PubMed] [Google Scholar]
- Ablonczy, Z. , Dahrouj, M. , Tang, P. H. , Liu, Y. , Sambamurti, K. , Marmorstein, A. D. , & Crosson, C. E. (2011). Human retinal pigment epithelium cells as functional models for the RPE in vivo. Investigative Ophthalmology & Visual Science, 52(12), 8614–8620. [DOI] [PMC free article] [PubMed] [Google Scholar]
- Ablonczy, Z. , Prakasam, A. , Fant, J. , Fauq, A. , Crosson, C. , & Sambamurti, K. (2009). Pigment epithelium‐derived factor maintains retinal pigment epithelium function by inhibiting vascular endothelial growth factor‐R2 signaling through gamma‐secretase. The Journal of Biological Chemistry, 284(44), 30177–30186. [DOI] [PMC free article] [PubMed] [Google Scholar]
- Age‐Related Eye Disease Study Research Group . (2001). A randomized, placebo‐controlled, clinical trial of high‐dose supplementation with vitamins C and E, beta carotene, and zinc for age‐related macular degeneration and vision loss: AREDS report no. 8. Archives of Ophthalmology (Chicago, Ill.: 1960), 119(10), 1417–1436. [DOI] [PMC free article] [PubMed] [Google Scholar]
- Alizadeh, M. , Wada, M. , Gelfman, C. M. , Handa, J. T. , & Hjelmeland, L. M. (2001). Downregulation of differentiation specific gene expression by oxidative stress in ARPE‐19 cells. Investigative Ophthalmology & Visual Science, 42(11), 2706–2713. [PubMed] [Google Scholar]
- Anderson, D. H. , Ozaki, S. , Nealon, M. , Neitz, J. , Mullins, R. F. , Hageman, G. S. , & Johnson, L. V. (2001). Local cellular sources of apolipoprotein E in the human retina and retinal pigmented epithelium: Implications for the process of drusen formation. American Journal of Ophthalmology, 131(6), 767–781. [DOI] [PubMed] [Google Scholar]
- Atienzar‐Aroca, S. , Flores‐Bellver, M. , Serrano‐Heras, G. , Martinez‐Gil, N. , Barcia, J. M. , Aparicio, S. , Perez‐Cremades, D. , Garcia‐Verdugo, J. M. , Diaz‐Llopis, M. , Romero, F. J. , & Sancho‐Pelluz, J. (2016). Oxidative stress in retinal pigment epithelium cells increases exosome secretion and promotes angiogenesis in endothelial cells. Journal of Cellular and Molecular Medicine, 20(8), 1457–1466. [DOI] [PMC free article] [PubMed] [Google Scholar]
- Bailey, T. A. , Kanuga, N. , Romero, I. A. , Greenwood, J. , Luthert, P. J. , & Cheetham, M. E. (2004). Oxidative stress affects the junctional integrity of retinal pigment epithelial cells. Investigative Ophthalmology & Visual Science, 45(2), 675–684. [DOI] [PubMed] [Google Scholar]
- Barrera, G. , Pizzimenti, S. , Daga, M. , Dianzani, C. , Arcaro, A. , Cetrangolo, G. P. , Giordano, G. , Cucci, M. A. , Graf, M. , & Gentile, F. (2018). Lipid peroxidation‐derived aldehydes, 4‐hydroxynonenal and malondialdehyde in aging‐related disorders. Antioxidants (Basel, Switzerland), 7(8), 102. [DOI] [PMC free article] [PubMed] [Google Scholar]
- Battistelli, M. , & Falcieri, E. (2020). Apoptotic bodies: Particular extracellular vesicles involved in intercellular communication. Biology, 9(1), 21. [DOI] [PMC free article] [PubMed] [Google Scholar]
- Beatty, S. , Koh, H. , Phil, M. , Henson, D. , & Boulton, M. (2000). The role of oxidative stress in the pathogenesis of age‐related macular degeneration. Survey of Ophthalmology, 45(2), 115–134. [DOI] [PubMed] [Google Scholar]
- Bowes Rickman, C. , Farsiu, S. , Toth, C. A. , & Klingeborn, M. (2013). Dry age‐related macular degeneration: Mechanisms, therapeutic targets, and imaging. Investigative Ophthalmology & Visual Science, 54(14), ORSF68–ORSF80. [DOI] [PMC free article] [PubMed] [Google Scholar]
- Brandl, C. , Zimmermann, S. J. , Milenkovic, V. M. , Rosendahl, S. M. , Grassmann, F. , Milenkovic, A. , Hehr, U. , Federlin, M. , Wetzel, C. H. , Helbig, H. , & Weber, B. H. (2014). In‐depth characterisation of Retinal Pigment Epithelium (RPE) cells derived from human induced pluripotent stem cells (hiPSC). Neuromolecular Medicine, 16(3), 551–564. [DOI] [PMC free article] [PubMed] [Google Scholar]
- Brennan, K. , Martin, K. , FitzGerald, S. P. , O'Sullivan, J. , Wu, Y. , Blanco, A. , Richardson, C. , & Mc Gee, M. M. (2020). A comparison of methods for the isolation and separation of extracellular vesicles from protein and lipid particles in human serum. Scientific Reports, 10(1), 1039. [DOI] [PMC free article] [PubMed] [Google Scholar]
- Chen, L. , Perera, N. D. , Karoukis, A. J. , Feathers, K. L. , Ali, R. R. , Thompson, D. A. , & Fahim, A. T. (2022). Oxidative stress differentially impacts apical and basolateral secretion of angiogenic factors from human iPSC‐derived retinal pigment epithelium cells. Scientific Reports, 12(1), 12694. [DOI] [PMC free article] [PubMed] [Google Scholar]
- Chen, Q. , Takada, R. , Noda, C. , Kobayashi, S. , & Takada, S. (2016). Different populations of Wnt‐containing vesicles are individually released from polarized epithelial cells. Scientific Reports, 6, 35562. [DOI] [PMC free article] [PubMed] [Google Scholar]
- Clayton, A. , Harris, C. L. , Court, J. , Mason, M. D. , & Morgan, B. P. (2003). Antigen‐presenting cell exosomes are protected from complement‐mediated lysis by expression of CD55 and CD59. European Journal of Immunology, 33(2), 522–531. [DOI] [PubMed] [Google Scholar]
- Colombo, F. , Casella, G. , Podini, P. , Finardi, A. , Racchetti, G. , Norton, E. G. , Cocucci, E. , & Furlan, R. (2021). Polarized cells display asymmetric release of extracellular vesicles. Traffic (Copenhagen, Denmark), 22(4), 98–110. [DOI] [PubMed] [Google Scholar]
- Dang, V. D. , Jella, K. K. , Ragheb, R. R. T. , Denslow, N. D. , & Alli, A. A. (2017). Lipidomic and proteomic analysis of exosomes from mouse cortical collecting duct cells. Faseb Journal, 31(12), 5399–5408. [DOI] [PMC free article] [PubMed] [Google Scholar]
- Davies, B. A. , Morton, L. O. , Jefferson, J. R. , Rozeveld, C. N. , Doskey, L. C. , LaRusso, N. F. , & Katzmann, D. J. (2020). Polarized human cholangiocytes release distinct populations of apical and basolateral small extracellular vesicles. Molecular Biology of the Cell, 31(22), 2463–2474. [DOI] [PMC free article] [PubMed] [Google Scholar]
- Ding, J. D. , Kelly, U. , Landowski, M. , Toomey, C. B. , Groelle, M. , Miller, C. , Smith, S. G. , Klingeborn, M. , Singhapricha, T. , Jiang, H. , Frank, M. M. , & Bowes Rickman, C. (2015). Expression of human complement factor H prevents age‐related macular degeneration‐like retina damage and kidney abnormalities in aged Cfh knockout mice. The American Journal of Pathology, 185(1), 29–42. [DOI] [PMC free article] [PubMed] [Google Scholar]
- DiPersio, C. M. , Hodivala‐Dilke, K. M. , Jaenisch, R. , Kreidberg, J. A. , & Hynes, R. O. (1997). alpha3beta1 Integrin is required for normal development of the epidermal basement membrane. The Journal of Cell Biology, 137(3), 729–742. [DOI] [PMC free article] [PubMed] [Google Scholar]
- Dunn, K. C. , Aotaki‐Keen, A. E. , Putkey, F. R. , & Hjelmeland, L. M. (1996). ARPE‐19, a human retinal pigment epithelial cell line with differentiated properties. Experimental Eye Research, 62(2), 155–169. [DOI] [PubMed] [Google Scholar]
- Duong, P. , Chung, A. , Bouchareychas, L. , & Raffai, R. L. (2019). Cushioned‐Density Gradient Ultracentrifugation (C‐DGUC) improves the isolation efficiency of extracellular vesicles. PLoS ONE, 14(4), e0215324. [DOI] [PMC free article] [PubMed] [Google Scholar]
- Flores‐Bellver, M. , Mighty, J. , Aparicio‐Domingo, S. , Li, K. V. , Shi, C. , Zhou, J. , Cobb, H. , McGrath, P. , Michelis, G. , Lenhart, P. , Bilousova, G. , Heissel, S. , Rudy, M. J. , Coughlan, C. , Goodspeed, A. E. , Becerra, S. P. , Redenti, S. , & Canto‐Soler, M. V. (2021). Extracellular vesicles released by human retinal pigment epithelium mediate increased polarised secretion of drusen proteins in response to AMD stressors. Journal of Extracellular Vesicles, 10(13), e12165. [DOI] [PMC free article] [PubMed] [Google Scholar]
- Fonseka, P. , Pathan, M. , Chitti, S. V. , Kang, T. , & Mathivanan, S. (2021). FunRich enables enrichment analysis of OMICs datasets. Journal of Molecular Biology, 433(11), 166747. [DOI] [PubMed] [Google Scholar]
- Fritsche, L. G. , Igl, W. , Bailey, J. N. , Grassmann, F. , Sengupta, S. , Bragg‐Gresham, J. L. , Burdon, K. P. , Hebbring, S. J. , Wen, C. , Gorski, M. , Kim, I. K. , Cho, D. , Zack, D. , Souied, E. , Scholl, H. P. , Bala, E. , Lee, K. E. , Hunter, D. J. , Sardell, R. J. , … Heid, I. M. (2016). A large genome‐wide association study of age‐related macular degeneration highlights contributions of rare and common variants. Nature Genetics, 48(2), 134–143. [DOI] [PMC free article] [PubMed] [Google Scholar]
- Gellner, C. A. , Reynaga, D. D. , & Leslie, F. M. (2016). Cigarette smoke extract: A preclinical model of tobacco dependence. Current Protocols in Neuroscience, 77, 9.54.1–9.54.10. [DOI] [PMC free article] [PubMed] [Google Scholar]
- Grassmann, F. , Fritsche, L. G. , Keilhauer, C. N. , Heid, I. M. , & Weber, B. H. (2012). Modelling the genetic risk in age‐related macular degeneration. PLoS ONE, 7(5), e37979. [DOI] [PMC free article] [PubMed] [Google Scholar]
- Handler, D. C. , Pascovici, D. , Mirzaei, M. , Gupta, V. , Salekdeh, G. H. , & Haynes, P. A. (2018). The art of validating quantitative proteomics data. Proteomics, 18(23), e1800222. [DOI] [PubMed] [Google Scholar]
- Hughes, C. S. , Foehr, S. , Garfield, D. A. , Furlong, E. E. , Steinmetz, L. M. , & Krijgsveld, J. (2014). Ultrasensitive proteome analysis using paramagnetic bead technology. Molecular Systems Biology, 10(10), 757. [DOI] [PMC free article] [PubMed] [Google Scholar]
- Hyttinen, J. M. T. , Kannan, R. , Felszeghy, S. , Niittykoski, M. , Salminen, A. , & Kaarniranta, K. (2019). The regulation of NFE2L2 (NRF2) signalling and epithelial‐to‐mesenchymal transition in age‐related macular degeneration pathology. International Journal of Molecular Sciences, 20(22), 5800. [DOI] [PMC free article] [PubMed] [Google Scholar]
- Ishii, M. , Beeson, G. , Beeson, C. , & Rohrer, B. (2021). Mitochondrial C3a receptor activation in oxidatively stressed epithelial cells reduces mitochondrial respiration and metabolism. Frontiers in Immunology, 12, 628062. [DOI] [PMC free article] [PubMed] [Google Scholar]
- Ismail, N. , Ismail, M. , Azmi, N. H. , Abu Bakar, M. F. , Basri, H. , & Abdullah, M. A. (2016). Modulation of hydrogen peroxide‐induced oxidative stress in human neuronal cells by thymoquinone‐rich fraction and thymoquinone via transcriptomic regulation of antioxidant and apoptotic signaling genes. Oxidative Medicine and Cellular Longevity, 2016, 2528935. [DOI] [PMC free article] [PubMed] [Google Scholar]
- Johnstone, R. M. , Mathew, A. , Mason, A. B. , & Teng, K. (1991). Exosome formation during maturation of mammalian and avian reticulocytes: Evidence that exosome release is a major route for externalization of obsolete membrane proteins. Journal of Cellular Physiology, 147(1), 27–36. [DOI] [PubMed] [Google Scholar]
- Jun, S. , Datta, S. , Wang, L. , Pegany, R. , Cano, M. , & Handa, J. T. (2019). The impact of lipids, lipid oxidation, and inflammation on AMD, and the potential role of miRNAs on lipid metabolism in the RPE. Experimental Eye Research, 181, 346–355. [DOI] [PMC free article] [PubMed] [Google Scholar]
- Karimi, N. , Dalirfardouei, R. , Dias, T. , Lötvall, J. , & Lässer, C. (2022). Tetraspanins distinguish separate extracellular vesicle subpopulations in human serum and plasma—Contributions of platelet extracellular vesicles in plasma samples. Journal of Extracellular Vesicles, 11(5), e12213. [DOI] [PMC free article] [PubMed] [Google Scholar]
- Kelly, U. L. , Grigsby, D. , Cady, M. A. , Landowski, M. , Skiba, N. P. , Liu, J. , Remaley, A. T. , Klingeborn, M. , & Bowes Rickman, C. (2020). High‐density lipoproteins are a potential therapeutic target for age‐related macular degeneration. The Journal of Biological Chemistry, 295(39), 13601–13616. [DOI] [PMC free article] [PubMed] [Google Scholar]
- King, H. W. , Michael, M. Z. , & Gleadle, J. M. (2012). Hypoxic enhancement of exosome release by breast cancer cells. BMC cancer, 12, 421. [DOI] [PMC free article] [PubMed] [Google Scholar]
- Klingeborn, M. , Dismuke, W. M. , Bowes Rickman, C. , & Stamer, W. D. (2017). Roles of exosomes in the normal and diseased eye. Progress in Retinal and Eye Research, 59, 158–177. [DOI] [PMC free article] [PubMed] [Google Scholar]
- Klingeborn, M. , Dismuke, W. M. , Skiba, N. P. , Kelly, U. , Stamer, W. D. , & Bowes Rickman, C. (2017). Directional exosome proteomes reflect polarity‐specific functions in retinal pigmented epithelium monolayers. Scientific Reports, 7(1), 4901. [DOI] [PMC free article] [PubMed] [Google Scholar]
- Kosaka, N. , Iguchi, H. , Yoshioka, Y. , Takeshita, F. , Matsuki, Y. , & Ochiya, T. (2010). Secretory mechanisms and intercellular transfer of microRNAs in living cells. The Journal of Biological Chemistry, 285(23), 17442–17452. [DOI] [PMC free article] [PubMed] [Google Scholar]
- Kowalczyk, A. P. , & Green, K. J. (2013). Structure, function, and regulation of desmosomes. Progress in Molecular Biology and Translational Science, 116, 95–118. [DOI] [PMC free article] [PubMed] [Google Scholar]
- La Cunza, N. , Tan, L. X. , Thamban, T. , Germer, C. J. , Rathnasamy, G. , Toops, K. A. , & Lakkaraju, A. (2021). Mitochondria‐dependent phase separation of disease‐relevant proteins drives pathological features of age‐related macular degeneration. JCI Insight, 6(9), e142254. [DOI] [PMC free article] [PubMed] [Google Scholar]
- Langevin, S. M. , Kuhnell, D. , Orr‐Asman, M. A. , Biesiada, J. , Zhang, X. , Medvedovic, M. , & Thomas, H. E. (2019). Balancing yield, purity and practicality: A modified differential ultracentrifugation protocol for efficient isolation of small extracellular vesicles from human serum. RNA Biology, 16(1), 5–12. [DOI] [PMC free article] [PubMed] [Google Scholar]
- Li, K. , Wong, D. K. , Hong, K. Y. , & Raffai, R. L. (2018). Cushioned‐Density Gradient Ultracentrifugation (C‐DGUC): A refined and high performance method for the isolation, characterization, and use of exosomes. Methods in Molecular Biology (Clifton, N.J.), 1740, 69–83. [DOI] [PMC free article] [PubMed] [Google Scholar]
- Li, Y. , Li, F. , Bai, X. , Li, Y. , Ni, C. , Zhao, X. , & Zhang, D. (2021). ITGA3 is associated with immune cell infiltration and serves as a favorable prognostic biomarker for breast cancer. Frontiers in Oncology, 11, 658547. [DOI] [PMC free article] [PubMed] [Google Scholar]
- Liles, M. R. , Newsome, D. A. , & Oliver, P. D. (1991). Antioxidant enzymes in the aging human retinal pigment epithelium. Archives of Ophthalmology (Chicago, Ill.: 1960), 109(9), 1285–1288. [DOI] [PubMed] [Google Scholar]
- Love, M. I. , Huber, W. , & Anders, S. (2014). Moderated estimation of fold change and dispersion for RNA‐seq data with DESeq2. Genome Biology, 15(12), 550. [DOI] [PMC free article] [PubMed] [Google Scholar]
- Maminishkis, A. , Chen, S. , Jalickee, S. , Banzon, T. , Shi, G. , Wang, F. E. , Ehalt, T. , Hammer, J. A. , & Miller, S. S. (2006). Confluent monolayers of cultured human fetal retinal pigment epithelium exhibit morphology and physiology of native tissue. Investigative Ophthalmology & Visual Science, 47(8), 3612–3624. [DOI] [PMC free article] [PubMed] [Google Scholar]
- Matsui, T. , Osaki, F. , Hiragi, S. , Sakamaki, Y. , & Fukuda, M. (2021). ALIX and ceramide differentially control polarized small extracellular vesicle release from epithelial cells. EMBO Reports, 22(5), e51475. [DOI] [PMC free article] [PubMed] [Google Scholar]
- McCord, J. M. , Keele, B. B., Jr , & Fridovich, I. (1971). An enzyme‐based theory of obligate anaerobiosis: The physiological function of superoxide dismutase. Proceedings of the National Academy of Sciences of the United States of America, 68(5), 1024–1027. [DOI] [PMC free article] [PubMed] [Google Scholar]
- Mehta, D. , Ahkami, A. H. , Walley, J. , Xu, S. L. , & Uhrig, R. G. (2022). The incongruity of validating quantitative proteomics using western blots. Nature Plants, 8(12), 1320–1321. [DOI] [PubMed] [Google Scholar]
- Mitter, S. K. , Song, C. , Qi, X. , Mao, H. , Rao, H. , Akin, D. , Lewin, A. , Grant, M. , Dunn, W., Jr , Ding, J. , Bowes Rickman, C. , & Boulton, M. (2014). Dysregulated autophagy in the RPE is associated with increased susceptibility to oxidative stress and AMD. Autophagy, 10(11), 1989–2005. [DOI] [PMC free article] [PubMed] [Google Scholar]
- Miura, Y. , & Roider, J. (2009). Triamcinolone acetonide prevents oxidative stress‐induced tight junction disruption of retinal pigment epithelial cells. Graefe's Archive for Clinical and Experimental Ophthalmology = Albrecht Von Graefes Archiv Fur Klinische Und Experimentelle Ophthalmologie, 247(5), 641–649. [DOI] [PubMed] [Google Scholar]
- Naylor, A. , Hopkins, A. , Hudson, N. , & Campbell, M. (2019). Tight junctions of the outer blood retina barrier. International Journal of Molecular Sciences, 21(1), 211. [DOI] [PMC free article] [PubMed] [Google Scholar]
- Nicholson, C. , Shah, N. , Ishii, M. , Annamalai, B. , Brandon, C. , Rodgers, J. , Nowling, T. , & Rohrer, B. (2020). Mechanisms of extracellular vesicle uptake in stressed retinal pigment epithelial cell monolayers. Biochimica Et Biophysica Acta. Molecular Basis of Disease, 1866(3), 165608. [DOI] [PMC free article] [PubMed] [Google Scholar]
- Pathan, M. , Keerthikumar, S. , Ang, C. S. , Gangoda, L. , Quek, C. Y. , Williamson, N. A. , Mouradov, D. , Sieber, O. M. , Simpson, R. J. , Salim, A. , Bacic, A. , Hill, A. F. , Stroud, D. A. , Ryan, M. T. , Agbinya, J. I. , Mariadason, J. M. , Burgess, A. W. , & Mathivanan, S. (2015). FunRich: An open access standalone functional enrichment and interaction network analysis tool. Proteomics, 15(15), 2597–2601. [DOI] [PubMed] [Google Scholar]
- Pathan, M. , Keerthikumar, S. , Chisanga, D. , Alessandro, R. , Ang, C. S. , Askenase, P. , Batagov, A. O. , Benito‐Martin, A. , Camussi, G. , Clayton, A. , Collino, F. , Di Vizio, D. , Falcon‐Perez, J. M. , Fonseca, P. , Fonseka, P. , Fontana, S. , Gho, Y. S. , Hendrix, A. , Hoen, E. N. , … Mathivanan, S. (2017). A novel community driven software for functional enrichment analysis of extracellular vesicles data. Journal of Extracellular Vesicles, 6(1), 1321455. [DOI] [PMC free article] [PubMed] [Google Scholar]
- Pilgrim, M. G. , Lengyel, I. , Lanzirotti, A. , Newville, M. , Fearn, S. , Emri, E. , Knowles, J. C. , Messinger, J. D. , Read, R. W. , Guidry, C. , & Curcio, C. A. (2017). Subretinal pigment epithelial deposition of drusen components including hydroxyapatite in a primary cell culture model. Investigative Ophthalmology & Visual Science, 58(2), 708–719. [DOI] [PMC free article] [PubMed] [Google Scholar]
- Plössl, K. , Webster, E. , Kiel, C. , Grassmann, F. , Brandl, C. , & Weber, B. H. F. (2022). In vitro modeling of the complex retinal condition age‐related macular degeneration. Journal of Translational Genetics and Genomics, 6(1), 46–62. [Google Scholar]
- Raposo, G. , & Stoorvogel, W. (2013). Extracellular vesicles: Exosomes, microvesicles, and friends. Journal of Cell Biology, 200(4), 373–383. [DOI] [PMC free article] [PubMed] [Google Scholar]
- Reidel, B. , Thompson, J. W. , Farsiu, S. , Moseley, M. A. , Skiba, N. P. , & Arshavsky, V. Y. (2011). Proteomic profiling of a layered tissue reveals unique glycolytic specializations of photoreceptor cells. Molecular & Cellular Proteomics: MCP, 10(3), M110.002469. [DOI] [PMC free article] [PubMed] [Google Scholar]
- Rizzolo, L. J. (2014). Barrier properties of cultured retinal pigment epithelium. Experimental Eye Research, 126, 16–26. [DOI] [PubMed] [Google Scholar]
- Sachdeva, M. M. , Cano, M. , & Handa, J. T. (2014). Nrf2 signaling is impaired in the aging RPE given an oxidative insult. Experimental Eye Research, 119, 111–114. [DOI] [PMC free article] [PubMed] [Google Scholar]
- Seddon, J. M. , George, S. , & Rosner, B. (2006). Cigarette smoking, fish consumption, omega‐3 fatty acid intake, and associations with age‐related macular degeneration: The US Twin Study of Age‐Related Macular Degeneration. Archives of Ophthalmology, 124(7), 995–1001. [DOI] [PubMed] [Google Scholar]
- Shah, N. , Ishii, M. , Brandon, C. , Ablonczy, Z. , Cai, J. , Liu, Y. , Chou, C. J. , & Rohrer, B. (2018). Extracellular vesicle‐mediated long‐range communication in stressed retinal pigment epithelial cell monolayers. Biochimica Et Biophysica Acta. Molecular Basis of Disease, 1864(8), 2610–2622. [DOI] [PMC free article] [PubMed] [Google Scholar]
- Simon, M. V. , Basu, S. K. , Qaladize, B. , Grambergs, R. , Rotstein, N. P. , & Mandal, N. (2021). Sphingolipids as critical players in retinal physiology and pathology. Journal of Lipid Research, 62, 100037. [DOI] [PMC free article] [PubMed] [Google Scholar]
- Sreekumar, P. G. , Kannan, R. , Kitamura, M. , Spee, C. , Barron, E. , Ryan, S. J. , & Hinton, D. R. (2010). αB crystallin is apically secreted within exosomes by polarized human retinal pigment epithelium and provides neuroprotection to adjacent cells. PLoS ONE, 5(10), e12578. [DOI] [PMC free article] [PubMed] [Google Scholar]
- Strauss, O. (1995). The retinal pigment epithelium. In Kolb H., Fernandez E., & Nelson R. (Eds.), Webvision: The organization of the retina and visual system. University of Utah Health Sciences Center. [PubMed] [Google Scholar]
- Sullivan‐Gunn, M. J. , & Lewandowski, P. A. (2013). Elevated hydrogen peroxide and decreased catalase and glutathione peroxidase protection are associated with aging sarcopenia. BMC Geriatrics, 13, 104. [DOI] [PMC free article] [PubMed] [Google Scholar]
- Tauro, B. J. , Greening, D. W. , Mathias, R. A. , Mathivanan, S. , Ji, H. , & Simpson, R. J. (2013). Two distinct populations of exosomes are released from LIM1863 colon carcinoma cell‐derived organoids. Molecular & Cellular Proteomics: MCP, 12(3), 587–598. [DOI] [PMC free article] [PubMed] [Google Scholar]
- Terluk, M. R. , Kapphahn, R. J. , Soukup, L. M. , Gong, H. , Gallardo, C. , Montezuma, S. R. , & Ferrington, D. A. (2015). Investigating mitochondria as a target for treating age‐related macular degeneration. The Journal of Neuroscience: The Official Journal of the Society for Neuroscience, 35(18), 7304–7311. [DOI] [PMC free article] [PubMed] [Google Scholar]
- Théry, C. , Amigorena, S. , Raposo, G. , & Clayton, A. (2006). Isolation and characterization of exosomes from cell culture supernatants and biological fluids. Current Protocols in Cell Biology, Chapter, 3, 22. [DOI] [PubMed] [Google Scholar]
- Théry, C. , Witwer, K. W. , Aikawa, E. , Alcaraz, M. J. , Anderson, J. D. , Andriantsitohaina, R. , Antoniou, A. , Arab, T. , Archer, F. , Atkin‐Smith, G. K. , Ayre, D. C. , Bach, J. M. , Bachurski, D. , Baharvand, H. , Balaj, L. , Baldacchino, S. , Bauer, N. N. , Baxter, A. A. , Bebawy, M. , … Zuba‐Surma, E. K. (2018). Minimal information for studies of extracellular vesicles 2018 (MISEV2018): A position statement of the International Society for Extracellular Vesicles and update of the MISEV2014 guidelines. Journal of Extracellular Vesicles, 7(1), 1535750. [DOI] [PMC free article] [PubMed] [Google Scholar]
- Tisi, A. , Feligioni, M. , Passacantando, M. , Ciancaglini, M. , & Maccarone, R. (2021). The impact of oxidative stress on blood‐retinal barrier physiology in age‐related macular degeneration. Cells, 10(1), 64. [DOI] [PMC free article] [PubMed] [Google Scholar]
- Toops, K. A. , Tan, L. X. , & Lakkaraju, A. (2014). A detailed three‐step protocol for live imaging of intracellular traffic in polarized primary porcine RPE monolayers. Experimental Eye Research, 124, 74–85. [DOI] [PMC free article] [PubMed] [Google Scholar]
- Trajkovic, K. , Hsu, C. , Chiantia, S. , Rajendran, L. , Wenzel, D. , Wieland, F. , Schwille, P. , Brügger, B. , & Simons, M. (2008). Ceramide triggers budding of exosome vesicles into multivesicular endosomes. Science (New York, N.Y.), 319(5867), 1244–1247. [DOI] [PubMed] [Google Scholar]
- van der Pol, E. , Boing, A. N. , Harrison, P. , Sturk, A. , & Nieuwland, R. (2012). Classification, functions, and clinical relevance of extracellular vesicles. Pharmacological Reviews, 64(3), 676–705. [DOI] [PubMed] [Google Scholar]
- Van Deun, J. , Mestdagh, P. , Agostinis, P. , Akay, Ö. , Anand, S. , Anckaert, J. , Martinez, Z. A. , Baetens, T. , Beghein, E. , Bertier, L. , Berx, G. , Boere, J. , Boukouris, S. , Bremer, M. , Buschmann, D. , Byrd, J. B. , Casert, C. , Cheng, L. , Cmoch, A. , … Hendrix, A. , EV‐TRACK Consortium . (2017). EV‐TRACK: Transparent reporting and centralizing knowledge in extracellular vesicle research. Nature Methods, 14(3), 228–232. [DOI] [PubMed] [Google Scholar]
- van Niel, G. , Raposo, G. , Candalh, C. , Boussac, M. , Hershberg, R. , Cerf‐Bensussan, N. , & Heyman, M. (2001). Intestinal epithelial cells secrete exosome‐like vesicles. Gastroenterology, 121(2), 337–349. [DOI] [PubMed] [Google Scholar]
- Vlodavsky, I. , Folkman, J. , Sullivan, R. , Fridman, R. , Ishai‐Michaeli, R. , Sasse, J. , & Klagsbrun, M. (1987). Endothelial cell‐derived basic fibroblast growth factor: Synthesis and deposition into subendothelial extracellular matrix. Proceedings of the National Academy of Sciences of the United States of America, 84(8), 2292–2296. [DOI] [PMC free article] [PubMed] [Google Scholar]
- Walko, G. , Castañón, M. J. , & Wiche, G. (2015). Molecular architecture and function of the hemidesmosome. Cell and Tissue Research, 360(2), 363–378. [DOI] [PMC free article] [PubMed] [Google Scholar]
- Wallace, L. , Roberts‐Thompson, L. , & Reichelt, J. (2012). Deletion of K1/K10 does not impair epidermal stratification but affects desmosomal structure and nuclear integrity. Journal of Cell Science, 125(Pt 7), 1750–1758. [DOI] [PubMed] [Google Scholar]
- Wang, J. , Lee, J. , Liem, D. , & Ping, P. (2017). HSPA5 Gene encoding Hsp70 chaperone BiP in the endoplasmic reticulum. Gene, 618, 14–23. [DOI] [PMC free article] [PubMed] [Google Scholar]
- Wang, S. , Wang, X. , Cheng, Y. , Ouyang, W. , Sang, X. , Liu, J. , Su, Y. , Liu, Y. , Li, C. , Yang, L. , Jin, L. , & Wang, Z. (2019). Autophagy dysfunction, cellular senescence, and abnormal immune‐inflammatory responses in AMD: From mechanisms to therapeutic potential. Oxidative Medicine and Cellular Longevity, 2019, 3632169. [DOI] [PMC free article] [PubMed] [Google Scholar]
- Wang, X. , Wilkinson, R. , Kildey, K. , Ungerer, J. P. J. , Hill, M. M. , Shah, A. K. , Mohamed, A. , Dutt, M. , Molendijk, J. , Healy, H. , & Kassianos, A. J. (2021). Molecular and functional profiling of apical versus basolateral small extracellular vesicles derived from primary human proximal tubular epithelial cells under inflammatory conditions. Journal of Extracellular Vesicles, 10(4), e12064. [DOI] [PMC free article] [PubMed] [Google Scholar]
- Weismann, D. , Hartvigsen, K. , Lauer, N. , Bennett, K. L. , Scholl, H. P. , Charbel Issa, P. , Cano, M. , Brandstätter, H. , Tsimikas, S. , Skerka, C. , Superti‐Furga, G. , Handa, J. T. , Zipfel, P. F. , Witztum, J. L. , & Binder, C. J. (2011). Complement factor H binds malondialdehyde epitopes and protects from oxidative stress. Nature, 478(7367), 76–81. [DOI] [PMC free article] [PubMed] [Google Scholar]
- Wik, L. , Klingeborn, M. , Willander, H. , & Linne, T. (2012). Separate mechanisms act concurrently to shed and release the prion protein from the cell. Prion, 6(5), 498–509. [DOI] [PMC free article] [PubMed] [Google Scholar]
- Xu, H. Z. , & Le, Y. Z. (2011). Significance of outer blood‐retina barrier breakdown in diabetes and ischemia. Investigative Ophthalmology & Visual Science, 52(5), 2160–2164. [DOI] [PMC free article] [PubMed] [Google Scholar]
- Xu, J. , Camfield, R. , & Gorski, S. M. (2018). The interplay between exosomes and autophagy—partners in crime. Journal of Cell Science, 131(15), jcs215210. [DOI] [PubMed] [Google Scholar]
- Zhang, X. , Tang, J. , Kou, X. , Huang, W. , Zhu, Y. , Jiang, Y. , Yang, K. , Li, C. , Hao, M. , Qu, Y. , Ma, L. , Chen, C. , Shi, S. , & Zhou, Y. (2022). Proteomic analysis of MSC‐derived apoptotic vesicles identifies Fas inheritance to ameliorate haemophilia a via activating platelet functions. Journal of Extracellular Vesicles, 11(7), e12240. [DOI] [PMC free article] [PubMed] [Google Scholar]
- Zhuang, Y. , Wu, H. , Wang, X. , He, J. , He, S. , & Yin, Y. (2019). Resveratrol attenuates oxidative stress‐induced intestinal barrier injury through PI3K/Akt‐mediated Nrf2 signaling pathway. Oxidative Medicine and Cellular Longevity, 2019, 7591840. [DOI] [PMC free article] [PubMed] [Google Scholar]
Associated Data
This section collects any data citations, data availability statements, or supplementary materials included in this article.
Supplementary Materials
Supporting Information
Supporting Information
Supporting Information
Supporting Information
Supporting Information
Supporting Information
Supporting Information
Supporting Information
Supporting Information
Supporting Information