

Abstract
Background
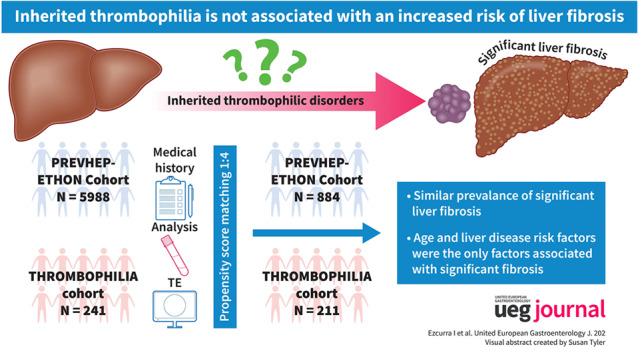
Preliminary evidence suggests that inherited hypercoagulable disorders can lead to an increased risk of significant liver fibrosis.
Objective
We aimed to investigate the prevalence of significant fibrosis in patients with inherited thrombophilia, assessed by using liver stiffness (LS), and to compare this prevalence to that found in a large population‐based cohort from the same region.
Methods
This was a single‐center, cross‐sectional study. A complete laboratory analysis for liver disease, LS by transient elastography and an abdominal ultrasound were performed in patients with inherited thrombophilia diagnosed between May 2013‐February 2017. These patients were propensity score matched (ratio 1:4) with a population‐based cohort from the same region (PREVHEP‐ETHON study; NCT02749864; N = 5988).
Results
Of 241 patients with inherited thrombophilia, eight patients (3.3%) had significant fibrosis (LS ≥8 kPa). All of them had risk factors for liver disease and met diagnostic criteria for different liver diseases. After matching 221 patients with thrombophilia with 884 patients of the PREVHEP‐ETHON cohort, the prevalence of significant fibrosis was similar between both cohorts (1.8% vs. 3.6%, p = 0.488). Multivariate analysis showed that age and liver disease risk factors, but not belonging to the thrombophilia cohort, were associated with the presence of significant fibrosis. The magnitude of the increased risk of significant fibrosis in patients with risk factors for liver disease was also similar in both cohorts.
Conclusions
Our findings do not provide evidence supporting an association between inherited thrombophilia and an increased risk of significant liver fibrosis, independent of the presence of liver‐related causes of fibrosis.
Keywords: general population, genetic, liver fibrosis, liver stiffness, thrombophilia, transient elastography
Key summary.
Summarize the established knowledge on this subject.
Preliminary evidence suggests that inherited hypercoagulable disorders can lead to an increased risk of significant liver fibrosis.
What are the significant and/or new findings of this study?
The prevalence of significant liver fibrosis, assessed through transient elastography, was low in our cohort of inherited thrombophilia (N = 241) and similar to a matched population‐based cohort from the same region (N = 5988).
Our findings do not support that inherited thrombophilia leads to liver fibrosis.
INTRODUCTION
Inherited thrombophilias are blood disorders in which a genetic mutation affects the amount or function of a protein in the coagulation system, altering the balance of hemostasis toward hypercoagulability. In the Western population, factor V Leiden (FVL, 2%–7%) and prothrombin G20210A (PGM, 1%–2%) mutations are relatively common, while the remaining mutations are rare and due to a deficiency of natural anticoagulants (protein C [PC], 0.2%–0.5%; protein S [PS], 0.1%–0.7%; and antithrombin III [AT], 0.02%) 1
Emerging evidence suggests that the hypercoagulable state associated with inherited thrombophilia may contribute to the development and progression of liver fibrosis. The proposed mechanisms involve the formation of thrombi within the hepatic microcirculation, leading to parenchymal extinction, and the activation of hepatic stellate cells through thrombin and Factor Xa via protease‐activated receptors. 2 Several observational studies have reported an increased risk of advanced liver fibrosis and/or faster progression of liver fibrosis in patients with chronic liver disease harboring hereditary thrombophilic disorders. 3 , 4 , 5 , 6 , 7 , 8 , 9 , 10 , 11 , 12 , 13 , 14 , 15 , 16 , 17 , 18 Moreover, preliminary evidence also suggests that inherited thrombophilia can per se lead to clinically relevant liver fibrosis. In a Dutch population‐based cohort study including 1055 patients, its presence was an independent risk factor for significant fibrosis estimated by liver stiffness (LS). 19 Based on these findings, it has been proposed that screening for thrombophilia should be considered in patients with chronic liver disease and individuals with liver disease of unknown etiology. This approach could potentially facilitate the timely initiation of anticoagulant therapy to impede the progression of liver fibrosis. 4 , 13 , 18 , 19
However, before implementing a widespread screening strategy, further data are needed. Therefore, the aim of the current study was to examine the prevalence of significant fibrosis in patients with inherited thrombophilia, assessed by using LS, and to compare these prevalences with those observed in a large population‐based cohort from the same geographical region.
MATERIAL AND METHODS
Design of the study and recruitment of the thrombophilia cohort
We conducted a cross‐sectional study in the Marqués de Valdecilla University Hospital (Santander, Cantabria, Spain), a tertiary care academic center. All patients aged ≥18 years harboring an inherited thrombophilia were invited to participate. Patients were identified by reviewing all thrombophilia studies performed by the Hematology Department from May 2013 to February 2017. Exclusion criteria were a failure of LS measurement, previous liver transplant, pregnancy, and predicted life expectancy of less than one year due to non‐liver comorbidities. Participation in the study entailed an extensive home interview, physical examination, a collection of a fasting blood sample, LS measurement, and an abdominal ultrasound. All of them, except for the latter, were performed on the same day.
Interview, physical evaluation, and laboratory analysis
Extensive data on demographics, smoking and alcohol intake, drug use, history of venous thromboembolism, anticoagulant and antiplatelet therapy, and comorbidities were obtained during the interview. Excessive alcohol consumption was defined as an intake of >20 g/day in females and >30 g/day in males. 20 The physical evaluation included measurement of systolic and diastolic blood pressure, height, weight, body mass index (obese if ≥30 kg/m2) and waist circumference.
Blood tests included the determination of liver tests (aspartate aminotransferase [upper reference limit (URL 40 U/L)], alanine aminotransferase [ALT, URL 40 U/L], alkaline phosphatase [URL 129 U/L], gamma‐glutamyl transferase [URL 32 U/L in woman and 50 U/L in men], bilirubin [URL 1.2 mg/dL] and albumin [lower reference limit (LRL) 3.5 gr/dL]), complete blood count, international normalized ratio, lipid (triglycerides [URL 150 mg/dL], high‐density lipoprotein [LRL 40 mg/dL for men and 50 mg/dL for women], low‐density lipoprotein [URL 130 mg/dL], and total cholesterol [URL 200 mg/dL]) and glycemic profile (glucose and glycated hemoglobin with addition of insulin to calculate the Homeostatic Model Assessment for Insulin Resistance [HOMA‐IR] in non‐diabetics. Insulin resistance was established with values of HOMA‐IR above 2.5 and diabetes mellitus was defined as fasting plasma glucose ≥126 mg/dL, glycated hemoglobin ≥6.5% or drug treatment for elevated blood glucose), ceruloplasmin (LRL 20 mg/dL), alpha‐1‐antitrypsin (LRL 90 mg/dL), ferritin (normal range 22–322 ng/mL and 10–291 ng/mL in men and women, respectively) and transferrin saturation levels (URL 45%), thyroid‐stimulating hormone (normal range 0.35–5.5 mU/L), hepatitis B surface antigen, anti‐hepatitis C virus and human immunodeficiency virus antibodies, immunoglobulins G, M and A, anti‐nuclear antibodies, anti‐mitochondrial antibodies (AMA) and anti‐smooth muscle antibodies. Finally, blood type and homocysteine levels (URL 15 μmol/L) were also determined and in patients with high homocysteine levels C677T MTHFR mutation was analyzed.
Thrombophilic study
Tests included gene mutational analysis for FVL and PGM, in addition to activated protein C resistance, AT, PC and PS levels, and antiphospholipid antibodies. The latter included anticardiolipin, antibeta2 glycoprotein and lupus anticoagulant.
PC and AT had been determined using an automated chromogenic assay for quantitative determination on IL Coagulation Systems (HemosIL Werfen®, Instrumentation Laboratory). Free PS level had been determined using an automated latex ligand immunoassay on IL Coagulation Systems (HemosIL Werfen®). Activated Protein C resistance had been determined by coagulometric test based on TTPa parameter (HemosIL Werfen®). Normal values had been established according to 100 control patients of the same age range and gender and were as follows: AT 85%–140%; PC 85%–140%; PS 70%–120%. Lupus anticoagulant had been determined using diluted Russell's viper venom test and silica clotting time (HemosIL Werfen®). Serum IgG and IgM anticardiolipin and antibeta2 glycoprotein levels had been measured by ELISA following manufacturer's instructions (Orgentec Diagnostika, Mainz, Germany) and expressed in IgG phospholipid (GPL) or IgM phospholipid (MPL) units or U/mL, respectively. Titers were considered to be positive when they were above the 99th percentile, thus corresponding to values above 20 GPL, MPL or U/mL (medium: 20–30 or high: >30 titers). If positive, they had been repeated at least 12 weeks later to confirm their positivity. PGM and FVL mutation had been determined using LightCycler® 2.0 instrument utilizing the polymerase chain reaction (PCR Roche Diagnostics®, Roche Diagnostics GmbH, Mannheim, Germany). The hypercoagulable panel had been interpreted by the Hematology department. Diagnosis of antiphospholipid syndrome had been defined according to the revised Sapporo criteria. 21
Liver stiffness measurement and abdominal ultrasonography
Liver fibrosis was assessed non‐invasively by measuring LS using transient elastography (Fibroscan®, EchosensTM, Paris, France) by two nurses with extensive experience. Results were expressed in kilopascals (kPa) and only valid measurements according to recent guidelines were considered. 22 The XL probe was used when necessary for LSM. In agreement with current guidelines and previous studies, for significant fibrosis, we considered a cutoff value of 8 kPa, and for compensated advanced chronic liver disease (cACLD) values of 10 kPa (suggestive) and 15 kPa (highly suggestive). 19 , 22 If index LS was ≥8kPa, a second LS measurement was performed on a separate day.
Abdominal ultrasound (SIEMENS ACUSON S2000) was performed by the Radiology department on a separate day from the interview. The presence or absence of morphological changes of chronic liver disease (e.g., hypertrophy of the caudate lobe and hepatic surface nodularity), steatosis, splanchnic vein thrombosis and signs of portal hypertension were collected.
Diagnosis of liver disease
The etiological diagnosis of liver disease was made in accordance with current guidelines. To diagnose metabolic‐associated fatty liver disease, we used the recently proposed criteria. 23
PREVHEP‐ETHON cohort
To assess whether the prevalence of significant fibrosis and cACLD in patients with thrombophilia was higher than expected in the general population, we compared these figures with those from the PREVHEP‐ETHON (Epidemiological sTudy of Hepatic infectiONs) Cohort, an observational, cross‐sectional, population‐based study performed in Spain between July 2015 and April 2017 (NCT02749864). The design of the study has been previously published. 24 , 25 Briefly, subjects between 20 and 79 years of age were selected from the population of 18 primary care centers belonging to three university hospitals in Madrid, Cantabria, and Valencia. Participants were selected using two‐stage conglomerate sampling and stratified by age, with randomized subject selection. Those who agreed to participate underwent LS at one of the three reference hospitals. On the same day, the participants filled out an epidemiological questionnaire, had a fasting blood sample collected and received a physical examination. The following data were collected in the epidemiological questionnaire: age, sex and alcohol intake. Blood tests included liver tests, complete blood count, international normalized ratio, lipid and glycemic profile, ferritin, hepatitis B surface antigen and anti‐hepatitis C virus antibodies. Of the 12 246 participants we selected those from Cantabria recruited in the same hospital as the thrombophilia cohort with a total of 5988 subjects.
All patients provided written informed consent for study participation. The study protocol conformed to the ethical guidelines of the 1975 Declaration of Helsinki as reflected in a priori approval by the Ethics Committee for Clinical Research of Cantabria (internal code: 2016.021).
Statistical analysis
Continuous variables were expressed as median and interquartile range, and categorical variables as counts and percentages. Comparisons between groups (within the thrombophilia cohort and between the Thrombophilia and PREVHEP‐ETHON cohorts) were performed using the unpaired Student's t‐test, the Mann‐Whitney test or Fisher's exact test as appropriate. Propensity score matching (PSM) was used to ensure comparability between the thrombophilia and PREVHEP‐ETHON cohorts. Nine confounding factors were included in a PSM model: age, sex, body mass index, alcohol consumption, waist circumference, hypertension, diabetes and dyslipemia. These variables were selected after a preliminary analysis of both cohorts and were based on their association with the presence of significant fibrosis. A 1:4 PSM was performed using the nearest neighbor greedy matching algorithm without replacement. Cohorts were evaluated after PSM for covariate balance using the standardized mean differences, with standardized differences of 0.1 or less between variables for participants in both cohorts considered acceptable. We intended to investigate the adjusted association with the presence of significant fibrosis through logistic regression analysis by introducing variables that were related to the latter in a univariate analysis (P < 0.1). Results of the univariable and multivariable logistic regressions are presented as odds ratio (OR) with a 95% confidence interval (CI). To ensure adequate statistical power for detecting differences between groups, we performed a sample size estimation for our study. We determined that a sample size of 1100 subjects would be necessary, with 880 subjects from the PREVHEP‐ETHON cohort and 220 subjects from the Thrombophilia cohort. This calculation was based on the following assumptions: a prevalence of significant fibrosis in the PREVHEP‐ETHON cohort of 3.6% after PSM, a prevalence ratio of 2.5% derived from previous research 19 and utilizing a two‐sided test with a significance level (α) of 0.05 and a desired power of 80%. Statistical analysis was performed with IBM SPSS Statistics v22.0 for MAC (IBM Corp.) and R: A Language and Environment for Statistical Computing (Vienna, Austria).
RESULTS
Clinical and analytical characteristics of the thrombophilia cohort
Of 821 subjects tested for thrombophilia during the study period, the latter was confirmed in 533. Of these, 241 patients were finally included and provided written informed consent for study participation (Figure 1). The clinical and analytical characteristics of the thrombophilia cohort are described in Tables 1 and 2, respectively. The median age was 45.0 (18.7–75.1) years, 148 (61.4%) were women and all but one participant were white. A full thrombophilic study was available in 221 patients (91.7%), with the most frequent disorders FVL (N = 87, 36.1%) and PGM (N = 88, 36.9%). Combined thrombophilia and blood type non‐O were present in 62 (25.7%) and 145 (60.2%) patients, respectively. Risk factors for chronic liver disease were present in 148 patients (61.4%), being the most prevalent overweight (N = 128, 53.1%)/obesity (N = 61, 25.3%) and excessive alcohol consumption (N = 25, 10.4%).
FIGURE 1.

Flowchart of the study.
TABLE 1.
Clinical characteristics of the thrombophilia cohort and in groups with and without significant fibrosis (i.e., >8kPa).
| Variable a | Thrombophilia cohort | Non‐significant fibrosis | Significant fibrosis | p |
|---|---|---|---|---|
| (N = 241) | (N = 233) | (N = 8) | ||
| Age (Years) | 43.4 (36.2–56.3) | 44.8 (37.0–57.2) | 56.1 (49.4–57.4) | 0.001 |
| Female sex | 93 (38.6) | 89 (38.2) | 4 (50.0) | 0.490 |
| Caucasian race | 240 (99.6) | 232 (99.6) | 8 (100) | 1 |
| Full thrombophilic study | 221 (91.7) | 216 (92.7) | 5 (62.5) | 0.021 |
| Indication of thrombophilic study | 0.849 | |||
| Episode of thrombosis | 74 (30.7) | 71 (30.5) | 3 (37.5) | |
| Family history | 114 (47.3) | 111 (47.6) | 3 (37.5) | |
| Other | 53 (22) | 51 (21.9) | 2 (25) | |
| Blood type Non‐0 (N = 236) | 145 (60.2) | 140 (60.9) | 5 (83.3) | 0.410 |
| Combined thrombophilia | 62 (25.7) | 59 (25.3) | 2 (25) | 1 |
| Factor V Leiden mutation (N = 240) | 87 (36.1) | 85 (36.6) | 2 (25) | 0.714 |
| Prothrombin G20210A mutation (N = 238) b | 88 (36.5) | 85 (37.0) | 3 (37.5) | 0.964 |
| Protein C deficiency (N = 237) | 24 (10) | 24 (10.5) | 0 (0) | 1 |
| Protein S deficiency (N = 237) | 51 (21.2) | 51 (22.3) | 0 (0) | 0.207 |
| Antithrombin deficiency (N = 236) | 11 (4.6) | 9 (3.9) | 2 (25) | 0.048 |
| Hyperhomocysteinemia (N = 228) | 19 (7.9) | 17 (7.6) | 2 (40.0) | 0.057 |
| MTHFR TT (N = 19) c | 7 (2.9) | 7 (31.8) | 0 (0) | 1 |
| Antiphospholipid syndrome (N = 237) | 22 (9.1) | 21 (9.2) | 1 (12.5) | 0.547 |
| Related complications | ||||
| Abortions | 52 (21.6) | 51 (21.9) | 1 (12.5) | 1 |
| Venous thrombosis | 47 (19.5) | 45 (19.3) | 2 (25.0) | 0.656 |
| Anticoagulant therapy | 67 (27.8) | 64 (27.5) | 3 (37.5) | 0.689 |
| Months | 11.1 (0.2–146) | 11.0 (0.2–146) | 22.8 (18.4–126.7) | 0.172 |
| Antiplatelet therapy | 61 (25.3) | 59 (25.3) | 2 (25) | 1 |
| Months | 28.8 (1.0–331.0) | 28.8 (2.0–331.0) | 23.2 (1.0–45.4) | 0.564 |
| Risk factors for CLD d | 160 (66.4) | 152 (65.2) | 8 (100) | 0.041 |
| Excessive alcohol consumption | 25 (10.4) | 23 (9.9) | 2 (25.0) | 0.196 |
| Body mass index (kg/m2) | 25.2 (22.6–30.4) | 25.2 (22.6–30.0) | 31.3 (28.7–42.0) | 0.264 |
| Body mass index ≥25 kg/m2 | 128 (53.1) | 123 (53.5) | 5 (62.5) | 0.728 |
| Increased waist circumference | 78 (32.4) | 75 (34.4) | 3 (75) | 0.126 |
| Hypertension | 110 (45.6) | 106 (45.5) | 4 (50) | 1 |
| Dyslipidemia | 75 (31.1) | 73 (31.5) | 2 (25.0) | 1 |
| Diabetes mellitus | 8 (3.3) | 7 (3.0) | 1 (12.5) | 0.240 |
| Thyroid disease | 4 (1.7) | 4 (1.7) | 0 (0) | 1 |
| Non‐cirrhotic portal vein thrombosis | 9 (3.7) | 9 (3.9) | 0 (0) | 1 |
| Liver disease | 70 (29) | 62 (26.6) | 8 (100) | <0.001 |
| Metabolic associated fatty liver disease e | 54 (22.4) | 50 (21.5) | 4 (50) | 0.078 |
| Alcohol‐associated liver disease | 3 (1.2) | 1 (0.5) | 2 (25) | 0.003 |
| Hepatitis C | 5 (2.1) | 3 (1.3) | 2 (25) | 0.009 |
| Hepatitis B | 4 (1.7) | 3 (1.3) | 1 (12.5) | 0.128 |
| Alpha‐1 antitrypsin deficiency | 8 (3.3) | 7 (3.1) | 1 (20.0) | 0.162 |
| Wilson disease | 1 (0.4) | 0 (0) | 1 (12.5) | 0.033 |
| Abdominal ultrasonography f | 221 (91.7) | 213 (91.4) | 8 (100) | 1 |
| Morphological changes of CLD | 11 (4.6) | 9 (4.2) | 2 (25.0) | 0.054 |
| Splenomegaly | 4 (1.7) | 3 (1.4) | 1 (12.5) | 0.139 |
| Collaterals | 7 (2.9) | 6 (2.6) | 1 (12.5) | 0.213 |
| Transient elastography | ||||
| M probe | 222 (92) | 212 (92.2) | 6 (85.7) | 0.447 |
| Liver stiffness (kPa) | 4.5 (3.7–5.3) | 4.6 (3.7–5.3) | 8.7 (8.3–12.5) | 0.011 |
| CAP (dB/m) | 234 (198–271) | 233 (200–270) | 316 (284–370) | 0.001 |
| Steatosis (CAP >275 dB/m) | 56 (23.2) | 52 (22.7) | 4 (80) | 0.012 |
| Compensated advanced chronic liver disease | ||||
| 10–15 kPa | 1 (0.4) | 0 (0) | 1 (12.5) | 0.033 |
| >15 kPa | 3 (1.2) | 0 (0) | 3 (37.5) | <0.001 |
Abbreviations: CAP, Controlled attenuated parameter; CLD, chronic liver disease; MTHFR, methylenetetrahydrofolate reductase polymorphisms.
Quantitative data are expressed as median (interquartile range) and qualitative data as number and percentage. For variables with missing data, the number of patients with available data is provided.
Two homozygotes.
There were 12 heterozygotes CT and three wild type CC.
Risk factors for CLD are excessive alcohol consumption, overweight/obesity, diabetes mellitus, ≥2 metabolic risk abnormalities according to MAFLD diagnostic criteria, Wilson disease, alpha‐1 antitrypsin deficiency, and hepatitis C or B.
Excessive alcohol consumption and alpha‐1 antitrypsin deficiency were also present in 10 (all in the non‐significant fibrosis group) and 2 patients (one in each group), respectively.
Patients in the non‐significant fibrosis group with morphological changes of CLD, splenomegaly, and portosystemic collaterals corresponded to those who had developed non‐cirrhotic portal vein thrombosis, and the remaining patient with collaterals had alcoholic liver cirrhosis.
TABLE 2.
Analytical characteristics of the thrombophilia cohort and in groups with and without significant fibrosis (i.e.>8kPa).
| Variable a | Thrombophilia cohort | Non‐significant fibrosis | Significant fibrosis | p |
|---|---|---|---|---|
| (N = 241) | (N = 233) | (N = 8) | ||
| Leucocytes (10*3/μL) | 5.9 (4.8–7.2) | 5.9 (4.8–7.2) | 7.5 (4.8–7.5) | 0.293 |
| Hemoglobin (g/dL) | 14.0 (13.1–14.9) | 14.0 (13.1–14.9) | 14.5 (13.8–15.3) | 0.376 |
| Platelets (10*3/μL) | 225 (189–265) | 226 (190–265) | 220.0 (143–253) | 0.219 |
| International normalized ratio | 1.06 (1.02–1.12) | 1.06 (1.01–1.12) | 1.11 (1.08–1.42) | 0.385 |
| Alanine aminotransferase (U/L) | 21 (13–29) | 20 (13–28) | 30 (29–41) | 0.023 |
| Aspartate aminotransferase (U/L) | 21 (17–25) | 21 (16–25) | 26 (25–38) | 0.026 |
| Homocysteine (μmol/L) (N = 228) | 10.0 (8.0–13.0) | 10 (8.0–12.7) | 14.0 (9.3–18.4) | 0.142 |
| Gamma‐glutamyl transferase (U/L) | 17 (11–29) | 16 (10–28) | 39 (21–59) | 0.121 |
| Alkaline phosphatase (U/L) | 61 (51–76) | 60 (50–74) | 86 (78–91) | 0.017 |
| Bilirubin (mg/dL) | 0.6 (0.4–0.8) | 0.6 (0.4–0.8) | 0.7 (0.4–1.3) | 0.274 |
| Albumin (g/dL) | 4.3 (4.2–4.5) | 4.3 (4.2–4.5) | 4.4 (4.2–4.5) | 0.796 |
| Creatinine (mg/dL) | 0.75 (0.7–0.9) | 0.75 (0.67–0.85) | 0.70 (0.59–0.85) | 0.308 |
| HOMA‐IR >2.5 | 58 (24.1) | 54 (26.6) | 4 (50) | 0.006 |
| Elevated glycated hemoglobin | 4 (1.7) | 3 (1.4) | 1 (25) | 0.072 |
| Triglycerides (mg/dL) (N = 230) | 75 (53–105) | 74 (52–102) | 115 (100–135) | 0.109 |
| High‐density lipoprotein (mg/dL) (N = 229) | 55 (46–64) | 55 (46–64) | 53 (101–123) | 0.457 |
| Low‐density lipoprotein (mg/dL) (N = 228) | 109 (88–126) | 109 (88–127) | 113 (101–123) | 0.704 |
| Total cholesterol (mg/dL) | 180 (156–199) | 180 (155–200) | 185 (170–194) | 0.590 |
| Ferritin (ng/mL) | 55 (25–126) | 55 (25–127) | 88.0 (27–106) | 0.648 |
| Transferrin saturation (%) | 27 (21–35) | 27 (21–35) | 25 (13–38) | 0.395 |
| Ceruplasmin (mg/dL) (N = 232) | 24.6 (22.0–28.2) | 24.6 (22.9–28.2) | 29.0 (20.9–30.2) | 0.340 |
| Alpha‐1‐antitrypsin (mg/dL) (N = 232) | 122 (111–136) | 122 (111–136) | 134 (91–135) | 0.283 |
| Thyroid‐stimulating hormone (mU/L) | 1.47 (1.01–2.17) | 1.47 (1.00–2.17) | 1.50 (0.59–2.60) | 0.834 |
Abbreviation: HOMA‐IR, Homeostatic Model Assessment for Insulin Resistance.
Quantitative data are expressed as median (interquartile range). Qualitative data are expressed as numbers and percentages. For variables with missing data, the number of patients with available data is provided.
Prevalence of significant fibrosis and associated risk factors in the thrombophilia cohort
After repeating LS measurement on a separate day in 16 patients with index LS ≥8 kPa, significant fibrosis was confirmed in 8 patients (3.3%) and cACLD was suggestive and highly suggestive in 1 (0.4%) and 3 (1.2%) of the subjects, respectively.
All patients with LS ≥8 kPa had risk factors for liver disease (100% vs. 65.2%; p = 0.041) and met diagnostic criteria for different liver diseases (100% vs. 26.6%; p = <0.001). Other differences from patients without significant fibrosis include older age (56.1 vs. 44.8 years; p = 0.001) and a higher prevalence of antithrombin deficiency (25% vs. 3.9%; p = 0.048). No other major clinical or analytical difference was observed between the groups (Tables 1 and 2). Due to the small number of patients with significant fibrosis, no multivariate logistic regression analysis was performed.
Prevalence of significant fibrosis in the PREVHEP‐ETHON cohort
In the whole cohort (before PSM), the prevalence of significant fibrosis was 3.5% (N = 211) and cACLD was suggestive and highly suggestive in 1.3% (N = 76) and 0.8% (N = 48) of the subjects, respectively. These figures were similar to those of the thrombophilia cohort. However, there were significant differences in some risk factors for liver disease between the two cohorts. Thus, compared to patients with thrombophilia, subjects from the PREVHEP‐ETHON cohort were older (51.7 vs. 44.9 years; p < 0.001), predominantly female (55.1% vs. 38.6%; p < 0.001), had higher prevalence of diabetes (7.9% vs. 3.3%; p = 0.012), dyslipidemia (53.6% vs. 31.2, p < 0.001) and hypertension (59.3% vs. 45.6%; p < 0.001) and had lower prevalence of excessive alcohol consumption (6.4 vs. 10.4%; p = 0.021) and increased waist circumference (21.3% vs. 32.4%; p < 0.001) (Table 3).
TABLE 3.
Clinical and analytical differences between the thrombophilia and PREVHEP‐ETHON cohorts.
| Variable | Before propensity score matching | After propensity score matching | ||||||
|---|---|---|---|---|---|---|---|---|
| Thrombophilia cohort | ETHON cohort | SMD | p | Thrombophilia cohort | ETHON cohort | SMD | p | |
| (N = 241) | (N = 5988) | (N = 221) | (N = 884) | |||||
| Age (Years) | 44.9 (37.3–57.2) | 51.7 (43.8–60.1) | 0.29 | 0.001 | 44.8 (36.7–56.7) | 46.0 (39.4–56.1) | 0.10 | 0.100 |
| Female sex | 93 (38.6) | 3299 (55.1) | 0.34 | <0.001 | 82 (37.1) | 297 (33.6) | 0.07 | 0.367 |
| Excessive alcohol consumption | 25 (10.4) | 383 (6.4) | 0.14 | 0.021 | 21 (9.5) | 76 (8.6) | 0.03 | 0.770 |
| Body mass index (kg/m2) | 25.4 (22.7–30.1) | 26.4 (23.6–29.8) | 0.12 | 0.062 | 25.2 (22.6–30.1) | 26.3 (23.1–29.8) | 0.09 | 0.151 |
| Body mass index ≥30 kg/m2 | 61 (25.6) | 1382 (23.6) | 0.17 | 0.004 | 57 (25.8) | 217 (24.6) | 0.12 | 0.119 |
| Increased waist circumference | 78 (32.4) | 1254 (21.3) | 0.12 | <0.001 | 77 (34.8) | 328 (37.1) | 0.24 | 0.585 |
| Hypertension | 110 (45.6) | 3540 (59.3) | 0.28 | <0.001 | 107 (48.4) | 468 (52.9) | 0.09 | 0.259 |
| Diabetes mellitus | 8 (3.3) | 474 (7.9) | 0.20 | 0.012 | 8 (3.6) | 36 (4.1) | 0.02 | 0.908 |
| Dyslipidemia | 75 (31.2) | 3133 (53.6) | 0.46 | <0.001 | 70 (31.7) | 294 (33.3) | 0.03 | 0.713 |
| Anti‐HCV Ab+, n | 5 (2.1) | 80 (1.4) | 0.05 | 0.514 | 3 (1.4) | 12 (1.4) | 0.00 | 1.000 |
| HBsAg+, n | 4 (1.7) | 36 (0.6) | 0.10 | 0.115 | 1 (0.5) | 6 (0.7) | 0.03 | 1.000 |
| Risk factors for chronic liver disease b | 148 (61.4) | 3884 (64.9) | 0.07 | 0.303 | 134 (60.6) | 560 (63.3) | 0.06 | 0.503 |
| Platelets (10*3/μL) | 227.0 (190.0–266.0) | 225.0 (194.0–262.0) | 0.05 | 0.433 | 227.0 (192.0–265.0) | 223.0 (191.0–257.2) | 0.07 | 0.357 |
| International normalized ratio | 1.0 (1.0–1.1) | 1.1 (1.0–1.1) | 0.36 | <0.001 | 1.1 (1.0–1.1) | 1.0 (1.0–1.1) | 0.32 | 0.072 |
| Alanine aminotransferase (U/L) | 21.0 (13.0–29.0) | 21.0 (16.0–29.0) | 0.10 | 0.174 | 20.0 (13.0–28.2) | 21.0 (15.0–30.0) | 0.16 | 0.017 |
| Aspartate aminotransferase (U/L) | 21.1 (16.0–25.0) | 23.0 (19.0–27.0) | 0.17 | 0.020 | 21.0 (16.8–25.0) | 23.0 (19.0–27.0) | 0.25 | <0.001 |
| Gamma‐glutamyl transferase (U/L) | 16.0 (10.0–28.0) | 20.0 (13.0–33.0) | 0.12 | 0.140 | 16.0 (10.0–28.0) | 19.0 (13.0–31.0) | 0.16 | 0.001 |
| Alkaline phosphatase (U/L) | 60.0 (50.0–74.0) | 67.0 (55.0–81.0) | 0.21 | 0.002 | 60.0 (50.0–73.0) | 64.0 (53.0–78.0) | 0.21 | 0.002 |
| Bilirubin (mg/dL) | 0.6 (0.4–0.8) | 0.5 (0.4–0.6) | 0.36 | <0.001 | 0.6 (0.4–0.8) | 0.5 (0.4–0.7) | 0.17 | 0.001 |
| Albumin (g/dL) | 4.3 (4.2–4.5) | 4.4 (4.3–4.6) | 0.59 | <0.001 | 4.3 (4.2–4.5) | 4.5 (4.3–4.6) | 0.65 | <0.001 |
| Creatinine (mg/dL) | 0.7 (0.7–0.8) | 0.8 (0.7–0.9) | 0.02 | 0.782 | 0.7 (0.7–0.8) | 0.8 (0.7–0.9) | 0.13 | 0.013 |
| Glucose (mg/dL) | 89.0 (83.0–95.0) | 82.0 (76.0–90.0) | 0.31 | <0.001 | 89.5 (84.0–95.0) | 81.0 (74.0–88.0) | 0.57 | <0.001 |
| Triglycerides (mg/dL) | 74.0 (53.0–102.0) | 117.0 (82.0–175.0) | 0.76 | <0.001 | 73.0 (52.5–102.0) | 103.0 (73.0–140.2) | 0.56 | <0.001 |
| High‐density lipoprotein (mg/dL) | 55.0 (46.0–64.0) | 56.0 (46.0–67.0) | 0.09 | 0.176 | 55.0 (46.0–64.0) | 56.0 (46.0–67.0) | 0.10 | 0.292 |
| Low‐density lipoprotein (mg/dL) | 109.0 (89.0–126.0) | 114.0 (92.0–135.0) | 0.10 | 0.132 | 109.0 (88.0–126.8) | 107.0 (87.0–125.0) | 0.07 | 0.462 |
| Total cholesterol (mg/dL) | 181.0 (156.0–199.0) | 198.0 (176.0–222.0) | 0.46 | <0.001 | 180.0 (155.0–199.2) | 188.0 (168.0–211.0) | 0.24 | 0.001 |
| Ferritin (ng/mL) | 52.0 (25.0–126.0) | 81.0 (16.0–165.0) | 0.22 | <0.001 | 55.0 (26.0–128.0) | 92.0 (40.0–173.0) | 0.27 | <0.001 |
| Fibrosis‐4 index ≥1.30 | 65 (27.1) | 1898 (32.6) | 0.12 | 0.087 | 56 (25.5) | 275 (31.1) | 0.13 | 0.120 |
| AST to platelet ratio index >1.5 | 0 (0.0) | 30 (0.5) | 0.10 | 0.520 | 0 (0.0) | 5 (0.6) | 0.11 | 0.578 |
| Transient elastography | ||||||||
| Liver stiffness (kPa) | 4.7 (3.8–5.4) | 4.4 (3.7–5.4) | 0.01 | 0.940 | 4.7 (1.4) | 4.9 (2.3) | 0.07 | 0.412 |
| CAP (dB/m) | 233.5 (200.8–271.3) | 248.0 (211.0–292.0) | 0.18 | 0.010 | 233.5 (200.8–270.0) | 250.0 (209–296.5) | 0.21 | 0.002 |
| ≥8 kPa | 8 (3.3) | 211 (3.5) | 0.03 | 0.678 | 4 (1.8) | 32 (3.6) | 0.11 | 0.488 |
| 10–15 kPa | 1 (0.4) | 76 (1.3) | 0.10 | 0.330 | 0 (0.0) | 7 (0.8) | 0.13 | 0.394 |
| >15 kPa | 3 (1.2) | 48 (0.8) | 0.04 | 0.785 | 1 (0.5) | 8 (0.9) | 0.06 | 0.802 |
Abbreviations: Anti‐HCV Ab+, positive for anti‐hepatitis C virus antibodies; CAP, controlled attenuation parameter; HBsAg+, positive for hepatitis B surface antigen; SMD, standardized mean difference.
Quantitative data are expressed as median (interquartile range) and qualitative data as number and percentage.
Risk factors for chronic liver disease are excessive alcohol consumption, overweight/obesity, diabetes mellitus, and hepatitis C or B.
We then performed a PSM, and 221 patients with thrombophilia were matched with 884 patients of the PREVHEP‐ETHON cohort. After PSM, both cohorts were well balanced for all assessed liver disease risk factors (Table 3, Figure 2). The prevalence of significant fibrosis and cALCD was again non‐significantly different between both cohorts (Thrombophilia vs. PREVHEP‐ETHON; LS ≥8 kPa: 1.8% vs. 3.6%, p = 0.488; LS 10–15kPa: 0% vs. 0.8%, p = 0.394; and LS >15kPa: 0.5% vs. 0.9%, p = 0.802). Similar findings were observed when significant fibrosis was assessed by the Fibrosis‐4 index and AST to platelet ratio index both before and after PSM.
FIGURE 2.
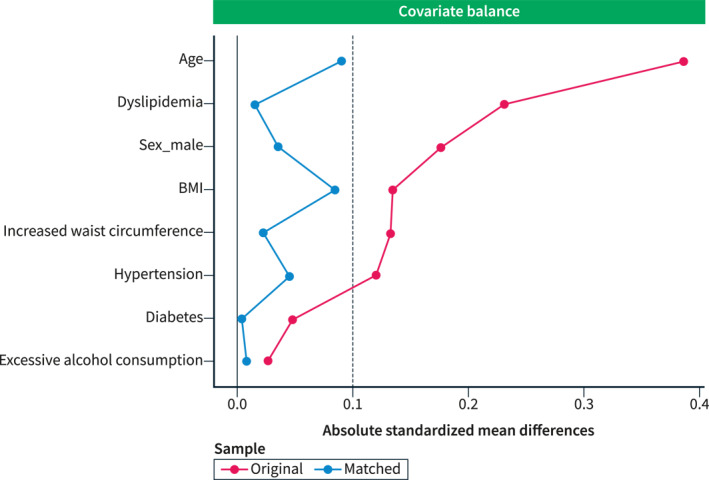
Standardized variable differences plot between patients from the thrombophilia cohort and PREVHEP‐ETHON cohort before (o) and after (∆) propensity score matching. The area between the vertical lines represents the accepted observed standardized bias (−0.1−0.1, presented as absolute values) between the matched cohorts.
Adjusted analysis for risk factors for significant fibrosis
After PSM, we investigated variables that were associated with the presence of significant fibrosis. Age and liver disease risk factors (analyzed both individually and pooled) were associated with the presence of significant fibrosis in the multivariable analysis (Table 4).
TABLE 4.
Univariate and multivariate logistic analysis of variables associated with the presence of significant fibrosis (liver stiffness ≥8Kpa).
| Variable | Univariate | Multivariate | ||||
|---|---|---|---|---|---|---|
| Model 1 a | Model 2 b | |||||
| Odds ratio | p | Odds ratio | p | Odds ratio | p | |
| Age | 1.05 [1.02, 1.08] | 0.001 | 1.03 [1.00, 1.06] | 0.043 | ||
| Sex (male) | 3.34 [1.29, 8.65] | 0.013 | 2.52 [1.03, 7.53] | 0.063 | ||
| Thrombophilia cohort | 0.49 [0.17,1.40] | 0.183 | 0.60 [0.18, 1.58] | 0.354 | 0.44 [0.12, 1.20] | 0.145 |
| Risk factors for liver disease | 6.79 [2.07, 22.28] | 0.001 | 4.32 [1.45, 18.57] | 0.020 | ||
| Hypertension | 5.98 [2.31, 15.50] | <0.001 | 4.82 [1.76, 17.16] | 0.006 | ||
| Diabetes mellitus | 8.20 [3.49, 19.24] | <0.001 | 5.29 [1.98, 13.05] | <0.001 | ||
| Excessive alcohol consumption | 4.34 [2.03, 9.30] | <0.001 | 3.44 [1.43, 7.74] | 0.004 | ||
| Hepatitis C | 12.36 [3.73, 41.00] | <0.001 | 20.96 [5.10, 75.58] | <0.001 | ||
| Increased waist circumference | 4.73 [2.26, 9.92] | <0.001 | 2.68 [1.21, 6.41] | 0.019 | ||
| Body mass index | 1.15 [1.08, 1.22] | <0.001 | ||||
| Number of risk factors | 2.04 [1.58, 2.65] | <0.001 | ||||
Model 1: Pooled risk factors for liver disease.
Model 2: Individually assessed risk factors for liver disease.
To investigate whether the magnitude of the increased risk of significant fibrosis in patients with risk factors for liver disease was different between the two cohorts, we added an interaction term for the prevalence of significant fibrosis by the presence of these risk factors, analyzed individually and pooled. In both analyses, a non‐significant interaction was observed. The prevalence of significant fibrosis in patients with risk factors for liver disease was also similar between cohorts (3.0 vs. 5.2%; p = 0.398).
DISCUSSION
In this cross‐sectional study, we investigated the prevalence of significant fibrosis and cACLD, assessed by using LS, in the largest cohort of patients with inherited thrombophilia to date. We found a low prevalence of significant fibrosis and cACLD that was similar to that found in a large, well‐characterized population‐based cohort from the same region. Further strengths of our study include a comprehensive etiological study of liver disease and inherited thrombophilia (>90% had a full thrombophilic workup), the interpretation of the hypercoagulable panel by the Hematology Department, propensity score matching for confounding variables and a repeated LS measurement if index LS was ≥8kPa.
In our thrombophilia cohort, all patients with LS ≥8kPa met the diagnostic criteria for different liver diseases. These results suggest that inherited thrombophilia per se does not increase the risk of developing clinically significant liver fibrosis. Our data differ from those of Plompen et al, in which the presence of FVL or PGM mutations, especially if combined with blood group type non‐O, was associated with a higher risk of having significant liver fibrosis even in the subgroup of participants without risk factors for liver injury. 19 The less comprehensive etiological study of liver disease and the non‐repetition of LS measurement if index LS was ≥8kPa in the latter study should be taken into consideration when explaining these discrepant results. Indeed, in our cohort 25% of the patients with increased LS had a liver disease that was not evaluated in the Dutch cohort and in half of the patients with index LS ≥8kPa the repetition of LS ruled out the presence of significant fibrosis. Other major differences between both cohorts include an older age (74 vs. 45 years) and higher prevalence of diabetes mellitus (11.3% vs. 3.3%) in the Dutch cohort that could explain their higher prevalence of increased LS (9.6% vs. 3.3%). Hence, in addition to risk factors for liver injury, our study revealed that an older age was associated with increased LS in patients with thrombophilia.
Most studies evaluating whether inherited thrombophilia could increase the risk of advanced liver fibrosis and/or faster progression of liver fibrosis in patients with different chronic liver diseases have reported a positive association. However, in some of them the thrombophilic disorder associated with this increased risk was most likely an acquired defect due to decrease hepatic synthesis (not necessary reflecting a procoagulant imbalance), 3 , 4 , 7 and the association found with each thrombophilic disorder was not consistently confirmed across these studies. 3 , 4 , 6 , 7 , 8 , 9 , 10 , 11 , 12 , 13 Moreover, in two recent observational studies that included patients with established cirrhosis, the presence of FVL, PGM or blood type non‐O did not impact on the progression of liver disease. 26 , 27 Our study found no evidence of an increased risk of significant fibrosis among patients with risk factors for liver disease in the thrombophilia cohort, as compared to the PREVHEP‐ETHON cohort. These findings suggest that inherited thrombophilia may not act as a cofactor in the progression of liver fibrosis. However, it is important to acknowledge that the absence of a specific thrombophilic assessment in the PREVHEP‐ETHON cohort represents a major limitation, preventing us from definitively rejecting this hypothesis.
Some other limitations of our study must be acknowledged beyond those inherent to cross‐sectional and single‐center studies. First, the number of each trombophilic disorder was too low to properly assess which of them could be associated with increased LS. Therefore, whether AT deficiency could be more relevant, as suggested by our study, needs further validation. However, it should be highlighted that the study was sufficiently powered to detect differences between cohorts. Second, we acknowledge the different nature of the two cohorts: the thrombophilia cohort derived mainly from a tertiary center, and the PREVHEP‐ETHON cohort from a primary setting. This disparity may influence the generalizability of our findings since tertiary center cohorts benefit from specialized medical attention and more comprehensive follow‐up. Third, most of our patients were young, thus restricting our findings to this age group and to white people. Finally, while transient elastography stands as a valid screening method for detecting liver fibrosis and cirrhosis in the general population, 28 our study did not extensively investigate the presence of vascular liver diseases such as a porto‐sinusoidal vascular disorder. However, it is important to emphasize that our primary aim was to investigate the association between thrombophilia and fibrosis, rather than focusing on the well‐established connection between thrombophilia and vascular liver disorders. Moreover, due to the limited number of patients identified with LS >8 kPa in our cohort, it would have been ethically untenable to proceed with liver biopsy.
In conclusion, our findings do not provide evidence supporting an association between inherited thrombophilia and an increased risk of significant liver fibrosis, independent of the presence of liver‐related causes of fibrosis.
AUTHOR CONTRIBUTIONS
All authors fulfilled the ICMJE definition of authorship.
CONFLICT OF INTEREST STATEMENT
The authors have nothing to disclose.
ACKNOWLEDGMENTS
María Elena Pérez and Silvia Bragado Rodríguez for their assistance in the study. José Ignacio Fortea was supported by the Instituto de Salud Carlos III through grant PI20/01258, co‐funded by the European Regional Development Fund, “A way to make Europe” and the Spanish Association for Study of the Liver (AEEH, Juan Cordoba grant).
Ezcurra I, Puente Á, Cuadrado A, Tamayo I, Iruzubieta P, Arias‐Loste MT, et al. No evidence of association between inherited thrombophilia and increased risk of liver fibrosis. United European Gastroenterol J. 2023;11(10):1010–1020. 10.1002/ueg2.12500
Javier Crespo and Jose Ignacio Fortea have designate shared senior authorship.
DATA AVAILABILITY STATEMENT
The data that support the findings of this study are available from the corresponding author, [JIF], upon reasonable request.
REFERENCES
- 1. Stevens SM, Woller SC, Bauer KA, Kasthuri R, Cushman M, Streiff M, et al. Guidance for the evaluation and treatment of hereditary and acquired thrombophilia. J Thromb Thrombolysis. 2016;41(1):154–164. 10.1007/s11239-015-1316-1 [DOI] [PMC free article] [PubMed] [Google Scholar]
- 2. Turco L, de Raucourt E, Valla DC, Villa E. Anticoagulation in the cirrhotic patient. JHEP Rep. 2019;1(3):227–239. 10.1016/j.jhepr.2019.02.006 [DOI] [PMC free article] [PubMed] [Google Scholar]
- 3. Papatheodoridis GV, Papakonstantinou E, Andrioti E, Cholongitas E, Petraki K, Kontopoulou I, et al. Thrombotic risk factors and extent of liver fibrosis in chronic viral hepatitis. Gut. 2003;52(3):404–409. 10.1136/gut.52.3.404 [DOI] [PMC free article] [PubMed] [Google Scholar]
- 4. Papatheodoridis GV, Chrysanthos N, Cholongitas E, Pavlou E, Apergis G, Tiniakos DG, et al. Thrombotic risk factors and liver histologic lesions in non‐alcoholic fatty liver disease. J Hepatol. 2009;51(5):931–938. 10.1016/j.jhep.2009.06.023 [DOI] [PubMed] [Google Scholar]
- 5. Wright M, Goldin R, Hellier S, Knapp S, Frodsham A, Hennig B, et al. Factor V Leiden polymorphism and the rate of fibrosis development in chronic hepatitis C virus infection. Gut. 2003;52(8):1206–1210. 10.1136/gut.52.8.1206 [DOI] [PMC free article] [PubMed] [Google Scholar]
- 6. Poujol‐Robert A, Boelle PY, Poupon R, Robert A. Factor V Leiden as a risk factor for cirrhosis in chronic hepatitis C. Hepatology. 2004;39(4):1174–1175. 10.1002/hep.20166 [DOI] [PubMed] [Google Scholar]
- 7. Poujol‐Robert A, Rosmorduc O, Serfaty L, Coulet F, Poupon R, Robert A. Genetic and acquired thrombotic factors in chronic hepatitis C. Am J Gastroenterol. 2004;99(3):527–531. 10.1111/j.1572-0241.2004.04092.x [DOI] [PubMed] [Google Scholar]
- 8. Poujol‐Robert A, Boelle PY, Wendum D, Poupon R, Robert A. Association between ABO blood group and fibrosis severity in chronic hepatitis C infection. Dig Dis Sci. 2006;51(9):1633–1636. 10.1007/s10620-006-9121-5 [DOI] [PubMed] [Google Scholar]
- 9. Adinolfi LE, Ingrosso D, Cesaro G, Cimmino A, D'Anto M, Capasso R, et al. Hyperhomocysteinemia and the MTHFR C677T polymorphism promote steatosis and fibrosis in chronic hepatitis C patients. Hepatology. 2005;41(5):995–1003. 10.1002/hep.20664 [DOI] [PubMed] [Google Scholar]
- 10. Goulding C, O'Brien C, Egan H, Hegarty JE, McDonald G, O'Farrelly C, et al. The impact of inherited prothrombotic risk factors on individuals chronically infected with hepatitis C virus from a single source. J Viral Hepat. 2007;14(4):255–259. 10.1111/j.1365-2893.2006.00790.x [DOI] [PubMed] [Google Scholar]
- 11. Martinelli A, Knapp S, Anstee Q, Worku M, Tommasi A, Zucoloto S, et al. Effect of a thrombin receptor (protease‐activated receptor 1, PAR‐1) gene polymorphism in chronic hepatitis C liver fibrosis. J Gastroenterol Hepatol. 2008;23(9):1403–1409. 10.1111/j.1440-1746.2007.05220.x [DOI] [PubMed] [Google Scholar]
- 12. Toniutto P, Fabris C, Falleti E, Cussigh A, Fontanini E, Bitetto D, et al. Methylenetetrahydrofolate reductase C677T polymorphism and liver fibrosis progression in patients with recurrent hepatitis C. Liver Int. 2008;28(2):257–263. 10.1111/j.1478-3231.2007.01591.x [DOI] [PubMed] [Google Scholar]
- 13. Maharshak N, Halfon P, Deutsch V, Peretz H, Berliner S, Fishman S, et al. Increased fibrosis progression rates in hepatitis C patients carrying the prothrombin G20210A mutation. World J Gastroenterol. 2011;17(45):5007–5013. 10.3748/wjg.v17.i45.5007 [DOI] [PMC free article] [PubMed] [Google Scholar]
- 14. Dik K, de Bruijne J, Takkenberg RB, Roelofs JJ, Tempelmans MJ, Dijkgraaf MGW, et al. Factor XIII Val34Leu mutation accelerates the development of fibrosis in patients with chronic hepatitis B and C. Hepatol Res. 2012;42(7):668–676. 10.1111/j.1872-034x.2011.00963.x [DOI] [PubMed] [Google Scholar]
- 15. Naguib M, Abdel‐Razek W, Estaphan S, Abdelsameea E, Abdel‐Samiee M, Shafik NF. Impact of prothrombin and factor V Leiden mutations on the progression of fibrosis in patients with chronic hepatitis C. PLoS One. 2022;17(11):e0276592. 10.1371/journal.pone.0276592 [DOI] [PMC free article] [PubMed] [Google Scholar]
- 16. Anstee QM, Goldin RD, Wright M, Martinelli A, Cox R, Thursz MR. Coagulation status modulates murine hepatic fibrogenesis: implications for the development of novel therapies. J Thromb Haemost. 2008;6(8):1336–1343. 10.1111/j.1538-7836.2008.03015.x [DOI] [PubMed] [Google Scholar]
- 17. D'Amico M, Pasta F, Pasta L. Thrombophilic genetic factors PAI‐1 4G‐4G and MTHFR 677TT as risk factors of alcohol, cryptogenic liver cirrhosis and portal vein thrombosis, in a Caucasian population. Gene. 2015;568(1):85–88. 10.1016/j.gene.2015.05.034 [DOI] [PubMed] [Google Scholar]
- 18. Pasta L, Pasta F. PAI‐1 4G‐4G and MTHFR 677TT in non‐hepatitis C virus/hepatitis B virus‐related liver cirrhosis. World J Hepatol. 2015;7(29):2920–2926. 10.4254/wjh.v7.i29.2920 [DOI] [PMC free article] [PubMed] [Google Scholar]
- 19. Plompen EP, Darwish Murad S, Hansen BE, Loth DW, Schouten JN, Taimr P, et al. Prothrombotic genetic risk factors are associated with an increased risk of liver fibrosis in the general population: the Rotterdam Study. J Hepatol. 2015;63(6):1459–1465. 10.1016/j.jhep.2015.07.026 [DOI] [PubMed] [Google Scholar]
- 20. EASL Clinical Practice Guidelines . Management of alcohol‐related liver disease. J Hepatol. 2018;69:154–181. [DOI] [PubMed] [Google Scholar]
- 21. Miyakis S, Lockshin MD, Atsumi T, Branch DW, Brey RL, Cervera R, et al. International consensus statement on an update of the classification criteria for definite antiphospholipid syndrome (APS). J Thromb Haemost. 2006;4(2):295–306. 10.1111/j.1538-7836.2006.01753.x [DOI] [PubMed] [Google Scholar]
- 22. Berzigotti A, Tsochatzis E, Boursier J, Castera L, Cazzagon N, Friedrich‐Rust M, et al. EASL Clinical Practice Guidelines on non‐invasive tests for evaluation of liver disease severity and prognosis—2021 update. J Hepatol. 2021;75(3):659–689. 10.1016/j.jhep.2021.05.025 [DOI] [PubMed] [Google Scholar]
- 23. Eslam M, Newsome PN, Sarin SK, Anstee QM, Targher G, Romero‐Gomez M, et al. A new definition for metabolic dysfunction‐associated fatty liver disease: an international expert consensus statement. J Hepatol. 2020;73(1):202–209. 10.1016/j.jhep.2020.03.039 [DOI] [PubMed] [Google Scholar]
- 24. Crespo J, Cuadrado A, Perello C, Cabezas J, Llerena S, Llorca J, et al. Epidemiology of hepatitis C virus infection in a country with universal access to direct‐acting antiviral agents: data for designing a cost‐effective elimination policy in Spain. J Viral Hepat. 2020;27(4):360–370. 10.1111/jvh.13238 [DOI] [PubMed] [Google Scholar]
- 25. Llop E, Iruzubieta P, Perelló C, Fernández Carrillo C, Cabezas J, Escudero MD, et al. High liver stiffness values by transient elastography related to metabolic syndrome and harmful alcohol use in a large Spanish cohort. United Eur Gastroenterol J. 2021;9(8):892–902. 10.1002/ueg2.12109 [DOI] [PMC free article] [PubMed] [Google Scholar]
- 26. Nery F, Chevret S, Condat B, de Raucourt E, Boudaoud L, Rautou PE, et al. Causes and consequences of portal vein thrombosis in 1,243 patients with cirrhosis: results of a longitudinal study. Hepatology. 2015;61(2):660–667. 10.1002/hep.27546 [DOI] [PubMed] [Google Scholar]
- 27. Ollivier‐Hourmand I, Repesse Y, Nahon P, Chaffaut C, Dao T, Nguyen TTN, et al. ABO blood group does not influence Child‐Pugh A cirrhosis outcome: an observational study from CIRRAL and ANRS CO12 CIRVIR cohorts. Liver Int. 2022;42(6):1386–1400. 10.1111/liv.15159 [DOI] [PubMed] [Google Scholar]
- 28. Gines P, Graupera I, Lammert F, Angeli P, Caballeria L, Krag A, et al. Screening for liver fibrosis in the general population: a call for action. Lancet Gastroenterol Hepatol. 2016;1(3):256–260. 10.1016/s2468-1253(16)30081-4 [DOI] [PubMed] [Google Scholar]
Associated Data
This section collects any data citations, data availability statements, or supplementary materials included in this article.
Data Availability Statement
The data that support the findings of this study are available from the corresponding author, [JIF], upon reasonable request.