

Abstract

The rheological properties of entangled polymers loaded with very small, strongly attractive polyhedral oligomeric silsesquioxane (POSS) fillers differ from that of nanocomposites with larger fillers by (1) the shorter breadth of the entanglement plateau and (2) the relatively unchanged terminal viscosity with increasing POSS loading. Although such anomalous rheological properties can rewrite the property–processing map of materials (e.g., high glass transition temperature and low viscosity), their mechanism remains unclear. In this study, we report that polymer relaxations on intermediate time scales between α and entire-chain relaxation, so-called “slower processes”, are responsible for this unusual rheological behavior of poly(2-vinylpyridine)/octa(aminophenyl)silsesquioxane (P2VP/OAPS) nanocomposites. To uncover the effects of entanglements on the nanocomposite dynamics, rheometry is used for variable matrix molecular weights. Results show a systematic change in the rheological response, which is independent of the molecular weight, and in turn, the presence of entanglements. This supports a physical interpretation that a slower process dominates the rheological response of the material at intermediate frequencies on length scales larger than the segment length or the OAPS diameter, while the underlying physical time scales associated with the entanglement relaxation remain unchanged. Such insights are anticipated to assist the future rational design of other highly attractive and ultrasmall nanoparticles that enable a fine-tuned rheological response of nanocomposites across multiple length scales.
Keywords: POSS, Polymer Nanocomposite, Rheology, Disentanglement, Entanglement Plateau
Introduction
Polymer nanocomposites possess attractive material properties that are unattainable with either base component. However, a complete description of these material properties is challenging because they depend on myriad parameters, including interaction strength,1−12 processing conditions,2,13−16 nanofiller size and shape,17−23 and many others. In particular, the physical origin of exceptional performance enhancement offered by ultrasmall (∼1–2 nm diameter) polyhedral silsesquioxane (POSS) nanofillers remains relatively unexplored compared to larger (∼10 nm) fillers. The ultrasmall size of POSS leads to an extremely high interfacial area between the fillers and the polymer matrix in these nanocomposites and in turn offers improved processability,24−26 tunability of the glass transition temperature (Tg) and mechanical properties,27,28 a refractive index decrease,29 and superior gas barrier properties24 in a variety of industrially relevant polymers, despite not typically having a dramatic effect on polymer conformations.17 A well-studied attractive POSS filler, octa(aminophenyl)silsesquioxane (OAPS), has eight hydrogen bond donors, allowing good dispersion in hydrogen bond accepting polymers as reported in poly(2-vinylpyridine) (P2VP) (Figure 1a) and polypropylene glycol.18,30 The “vehicle mechanism” has been proposed as an explanation of why POSS has been observed to have faster diffusion than predicted by the Stokes–Einstein relation.30,31 In this theory, the dynamics of POSS motions are modeled as being controlled predominantly by the local polymer–nanofiller interactions rather than the entire-chain dynamics. This applies when the radius of gyration (Rg) of the polymer is much larger than the radius of the nanofiller and the desorption time of polymer segments to the nanofiller surface is much shorter than the diffusion timescale of the nanofiller. When the desorption time of the OAPS filler is faster than the Rouse time, the OAPS motions are effectively governed only by the segment-scale characteristics of the polymer chain; otherwise, the nanofiller diffusion will have a weak N1/2 dependence on molecular weight. This framework explains the near independence of POSS diffusion times on polymer molecular weight when the polymer Rg is larger than the size of OAPS nanofillers in poly(2-vinylpyridene) and polypropylene glycol.19,30 While the diffusion of OAPS is well-understood by the vehicle mechanism, open questions remain regarding the rheology of polymers loaded with OAPS.
Figure 1.

(a) Chemical structures of the OAPS and P2VP. (b) Typical P2VP/OAPS rheological response for entangled systems. Solid lines show G′, and dashed lines show G″. The terminal flow times τt and entanglement onset times τe are labeled at the intersection of G′ and G″, where the distance between them is the width of the entanglement plateau. The entanglement plateau appears to shrink in the OAPS-loaded sample. Adapted with permission from ref (18). Copyright 2017 American Chemical Society.
While these POSS nanocomposites share some thermophysical and mechanical similarities with other nanocomposites loaded with larger nanoparticles, they possess anomalous features in their rheological response. In P2VP/OAPS, Cheng et al. first reported a relatively unchanged zero-shear viscosity and a decreased entanglement plateau width at high OAPS loadings, with a detailed comparison of the relaxation times of unloaded and loaded P2VP at a fixed molecular wieght.18 Cheng et al. reported that the Tg of a P2VP/OAPS 37 vol % system was 22 °C higher than that of neat P2VP, yet the zero-shear viscosity of the corresponding composite was nearly identical to the neat P2VP. Current models cannot capture the entire nature of this dynamic response; if the relaxation were dominated by long-lived OAPS–polymer interactions, the sticky Rouse model would predict a large increase in the terminal relaxation time of entangled polymers with increasing OAPS loading.32−35 This observation highlights the difference between POSS-loaded polymer composites and other complex materials such as vitrimers and other systems with dynamic cross-links where the terminal relaxation mode is strongly dependent on intermediate relaxation modes, suggesting that the POSS structure gives rise to its unique properties.
Furthermore, a viscosity at a temperature 22 °C closer to the Tg would be expected to cause a 1–2 order of magnitude increase for a typical fragile glass-forming polymer with a Tg = 373 K at a reference temperature of 453 K. Thus, the slowdown of segmental dynamics with the addition of OAPS and the resulting increase in Tg seems to have little to no effect on longer relaxation times across different OAPS loadings. This unique rheological property points to an opportunity to reveal unconventional processing–property relationships, such as high Tg polymer materials with low viscosity.
Beyond the decoupling of zero-shear viscosity and Tg, P2VP/OAPS displays an apparent decrease in the width of the entanglement plateau with increasing the loading of OAPS. The value of this width is taken to be the distance between the two G′ and G″ crossovers, typically denoted as the entanglement onset time (τe) and the terminal flow time (τt), as shown in Figure 1b, though due to the apparent complexity of the response at intermediate time scales near τe, care must be taken before assigning an exact physical interpretation of this value. This change in the apparent entanglement onset time cannot be explained by tube dilution, and the mechanism remains unclear.18 To fully understand the rheological behavior of nanocomposites and further advance material design, it is necessary to independently probe the frequency and temperature dependence of every relaxation process occurring in the material. A comprehensive study of the anomalous response of P2VP/OAPS composites will aid the development of models that describe ultrasmall nanoparticle composite behavior.
We hypothesize that these anomalous rheological properties at high OAPS loadings are governed by the emergence of a “slower process”, which occurs on time scales between the α-relaxation and entire-chain diffusion in P2VP and other polymers.36,37 This process has been observed in dielectric relaxation spectroscopy (DRS) measuring the relaxation of the dipole of the 2VP pendant to the polymer backbone, which is correlated to the segmental dynamics of the polymer. The time scale of this process agrees with that of the recently observed slower Arrhenius process (SAP),38 which appears in polymer thin films under confinement, but the slower process appears to follow Vogel–Fulcher–Tammann (VFT) temperature dependence rather than Arrhenius.37 Thus, the physical interpretation of the results presented in this work is that entanglement relaxations occur at similar time scales independently of OAPS loading; however, they do not dominate the stress response of the material until frequencies lower than τe, at which point the slower process relaxation is complete. This slower relaxation would have an associated length scale that is larger than the polymer segment length or the OAPS molecular diameter. Increasing the OAPS volume fraction (ϕOAPS) in P2VP from ϕOAPS = 0.00 to ϕOAPS = 0.35 significantly increased the time scale of the slower process by a factor of 50, compared to a factor of 2 increase in the α process time.37 Such a drastic increase in the slower process relaxation time with the loading of the OAPS implies that this process is an additional crucial component of rheological properties in P2VP/OAPS nanocomposites, manifesting as a response to both mechanical perturbations (rheology) and electrical perturbations (DRS).
In this study, the rheological response of a model P2VP/OAPS composite system is studied and rationalized based on the principles of gelation at high OAPS loadings and the emergence of the slower process as the dominant relaxation process at time scales between the α process and disentanglement. Previous work18 for entangled P2VP reported that the disentanglement/terminal flow time remains independent of OAPS loading until the system enters the gel regime, at which the filler network dynamics dominate the polymer response, and that the breadth of the entanglement plateau decreased with increasing OAPS loadings. Based on this observation, four regimes of the rheological response are identified based on the below and above entanglement molecular weight (Me) of P2VP and the critical gelation concentration of OAPS (ϕgel), as shown in Table 1. Our systematic rheological study reveals that the time scale associated with either the onset of terminal flow (unentangled) or the onset of the entanglement plateau (entangled) exhibits the same loading dependence as the slower process. These results support our hypothesis that the unconventional rheological response is due to the increasing time scale of the slower process as observed by DRS, which occurs between the entanglement relaxation time and the α relaxation time.
Table 1. Four Regimes of the P2VP/OAPS Rheological Response, Dictated by Polymer Entanglement and OAPS Loading with Regards to ϕgel.
| unentangled (MW < Me) |
entangled (MW > Me) |
|||
|---|---|---|---|---|
| ϕOAPS | observation | explanation | observation | explanation |
| ϕ < ϕgel | zero-shear viscosity increases with ∼ϕn | viscosity increases due to slower process | width of the entanglement plateau decreases while zero-shear viscosity is unchanged | slower process dominates reptation at intermediate frequencies normally dominated by reptation |
| ϕ > ϕgel | tan δ → 1 at low ω | gelation | tan δ → 1 at low ω | gelation |
Results
To systematically study the connection between the slower process of P2VP and the rheological response of the P2VP/OAPS nanocomposite, melt oscillatory shear rheometry was performed on P2VP/OAPS samples with different OAPS volume fractions (ϕOAPS) and different P2VP number average molecular weights (Mn). The molecular weights tested were Mn = 30 kDa (Đ = 1.15), 58 kDa (Đ = 1.28), and 850 kDa (Đ = 1.10), while the Me of P2VP is approximately 29 kDa.39 P2VP and OAPS were co-casted from tetrahydrofuran and annealed at 180 °C at 10–5 mTorr for at least 5 days. Thermogravimetric analysis (TGA) was performed to check whether the OAPS did not degrade under these conditions (Figure S1). To check the dispersion of the OAPS in the P2VP matrix, small-angle X-ray scattering (SAXS) was performed on the samples, with representative examples shown in Figure S2. These results are in agreement with the literature18,19 and do not display the low q features associated with large-scale phase separation due to nanoparticle aggregation.6 Rheometry experiments were performed on all samples with temperatures up to 200 °C under a nitrogen atmosphere and an angular frequency (ω) varying from 0.01–100 rad/s. Results were shifted based on horizontal temperature shift factors aT, as shown in Tables S1, S2, and S3. To reduce the number of fitting parameters, we did not perform vertical shifting.
The storage (G′) and loss (G″) moduli as a function of frequency and temperature were measured for P2VP/OAPS nanocomposites with variable ϕOAPS and Mn values. Representative G′ and G″ data for Mn = 58 kDa (weakly entangled) and Mn = 850 kDa (highly entangled) at different ϕOAPS values are shown in Figure 2, while those for Mn = 30 kDa and 101 kDa (data adapted from Cheng et al.18) are shown in Figure S3. For the composite with Mn = 58 kDa at the highest accessible loading (ϕOAPS = 0.44) (Figure 2a), the material displays a gelation response, presumably due to the formation of a percolated nanoparticle network in a similar manner to silica nanoparticles.40,41 In the ungelled state, the response is shifted to lower frequencies as ϕOAPS increases. The 850 kDa sample (Figure 2b) has an entanglement plateau and is qualitatively consistent with previous reports of entangled P2VP/OAPS nanocomposites (101 kDa; Figure S2b).18 At moderate loadings (ϕOAPS ≤ 0.25), the terminal flow time τt is relatively unchanged with OAPS loading, while the width of the entanglement plateau decreases as the entanglement onset time τe approaches τt.
Figure 2.

Storage (G′, closed symbols) and loss (G″, open symbols) moduli measured by small amplitude oscillatory shear rheometry for P2VP/OAPS with (a) Mn = 58 kDa at different OAPS loadings and (b) Mn = 850 kDa at different OAPS loadings. Master curves are created by shifting with the shift factors in Tables S2 and S3. Curves show mechanical reinforcement at moderate loadings (ϕOAPS ≤ 0.25) with gelation at high loadings (ϕOAPS ≥ 0.35).
The construction of these figures relies on the assumption that time–temperature superposition (TTS) holds. Although the data collected for each composite with variable ϕOAPS values at different temperatures collapsed nicely to a single master curve, the implicit assumption that the temperature dependence of all relaxation processes is identical is not strictly true for the loaded P2VP/OAPS composites due to the temperature dependence of hydrogen bonding. However, we note that the τt remains largely unchanged in the Mn = 850 kDa nanocomposites, regardless of reference temperatures in the range 140 °C ≤ Tref ≤ 200 °C (Figure S4), as will be discussed further in the Discussion section. This indicates that TTS is a reasonable approximation in the P2VP/OAPS system and that the number of entanglements in the polymer is roughly constant with the loading of OAPS.
To illustrate the different regimes of gelled versus ungelled nanocomposite rheology, the data obtained in Figure 2 are replotted as the complex viscosity (η*) in Figure 3. For the 58 kDa samples, the viscosity becomes saturated at low frequencies (i.e., zero-shear viscosity) for ϕOAPS ≤ 0.16 and diverges for ϕOAPS ≥ 0.25, which is indicative of gelation. The zero-shear viscosity increases with increasing the level of the OAPS loading, which is a completely different behavior compared to that of entangled samples. Due to instrumental frequency and temperature limitations, the zero-shear viscosity could not be evaluated for the 850 kDa samples, but the terminal behavior of η* showed small deviations despite a 12 °C increase in Tg.
Figure 3.

Frequency-dependent complex viscosity (η*) of the P2VP/OAPS composites with (a) Mn = 58 kDa and (b) Mn = 850 kDa as a function of ϕOAPS.
Two further experiments were performed to give insight into the role of OAPS–OAPS interactions and OAPS–P2VP interactions on the rheology of the nanocomposite. It was hypothesized that the nonlinear rheological response of the composite would have a strong dependence on the OAPS loading if the OAPS–OAPS interactions were dominant, and one would observe a substantial change in the onset of shear thinning and the shear thinning exponent of the nanocomposites depending on the OAPS loading. To test this, strain amplitude sweeps for the Mn = 850 kDa sample were performed at 180 °C and 0.01 Hz (Figure 4; data at 200 °C is shown in Figure S5). The frequency is chosen to target the middle of the entanglement plateau in the neat polymer. We note that the high ϕOAPS sample (gelled; ϕOAPS = 0.35) could not be measured at high strains due to poor adhesion between the top rheometer plate and the sample. Across all samples, there was no appearance of a secondary plateau at high strain rates, and shear thinning exponents as well as onset strains were similar (Table S4). This invariant nonlinear rheological response with varied ϕOAPS suggests that OAPS–OAPS interactions are unlikely to be the primary contribution to the rheological property change in this composition. More studies in this nonlinear regime, particularly on high ϕOAPS loadings, may reveal further insights in this regard.
Figure 4.

Strain amplitude sweeps at f = 0.01 Hz for the 850 kDa samples at 180 °C, suggesting that no OAPS gel network is formed for the samples with ϕOAPS ≤ 0.25.
To test the effects of P2VP–OAPS interactions on the rheology of the nanocomposites, OAPS was loaded into random copolymers of styrene and 2VP, described in our previous work.6 The mole fraction of 2VP (f2VP) dictates the fraction of monomers that can interact via hydrogen bonds with the OAPS filler. These random copolymers are unentangled with Mw = 13–18 kDa (Table S4), and X-ray scattering suggested that OAPS was found to be well-dispersed for all compositions tested.6 The zero-shear viscosity of the nanocomposites with different ϕOAPS values was measured at a reference temperature of 160 °C and normalized by molecular weight in accordance with Rouse dynamics (Figure S6). If the interactions of OAPS–P2VP were a dominant factor, it would be expected that the copolymer with the lowest f2VP would have a weaker viscosity increase with ϕOAPS. However, the exponential slopes to ϕOAPS are not particularly different between different f2VP values, although the strongest increase in viscosity with OAPS loading is observed in the lowest f2VP nanocomposite. This suggests that the interaction of the polarization of the plasmid with the corresponding rheology does not strongly influence the rheology of the composite, at least at the experimentally achievable range of f2VP. These two experiments imply that below the gelation concentration of ϕOAPS, OAPS–OAPS interactions are unlikely to be the dominant factor and not all nitrogen lone pairs of 2VP engage with P2VP–OAPS interactions.
Discussion
The scaling of critical times with ϕOAPS is examined to quantitatively show the connection between the slower process and the rheological response of the P2VP/OAPS composite at intermediate loadings and time scales. We consider four qualitatively distinct regimes of the P2VP/OAPS nanocomposite behavior, as shown in Table 1. At high OAPS loadings, the composites display gel-like behavior at all molecular weights. At lower loadings, we observe increases in the zero-shear viscosity for unentangled/lightly entangled polymers and a decrease in the width of the entanglement plateau for highly entangled polymers with little impact on the zero-shear viscosity. We rationalize this with the emergence of an extra relaxation process occurring on time scales between the reptation time and the glass transition time, changing the measured value of τe while not affecting the underlying entanglement relaxation.
To quantitatively analyze the relationships of the critical time scales between the slower process, the α process, and the rheological response, the loss tangents (tan δ) of the P2VP/OAPS are shown in Figure 5 with arrows corresponding to critical rheological time scales. In agreement with Figure 2a, low Mn and highly loaded samples (Figure 5a) display gelation, with tan δ approaching unity for gelled compositions. For ungelled and low Mn systems, there is an associated critical time scale of the modes that we hypothesize to be related to the slower process. For low Mn polymers with fewer entanglements, the critical time is given as the unentangled terminal flow time τt, corresponding to ∼101 rad/s when tan δ approaches a constant value independent of the angular frequency (Figure 5a). In Figure 2a, this is seen as terminal flow scaling (G′ ≈ ω, G″ ≈ ω2). In the 850 kDa sample (Figure 5b), the critical time scale is the entanglement onset time τe, corresponding to ∼101 rad/s where tan δ is unity. These features can also be seen in Figure 2b as the crossover point of G′ and G″ approaches the entanglement plateau from low to high frequency. In contrast to τe, the terminal flow time for high Mn polymers (τt) shows weaker composition dependence, as will be further discussed later.
Figure 5.
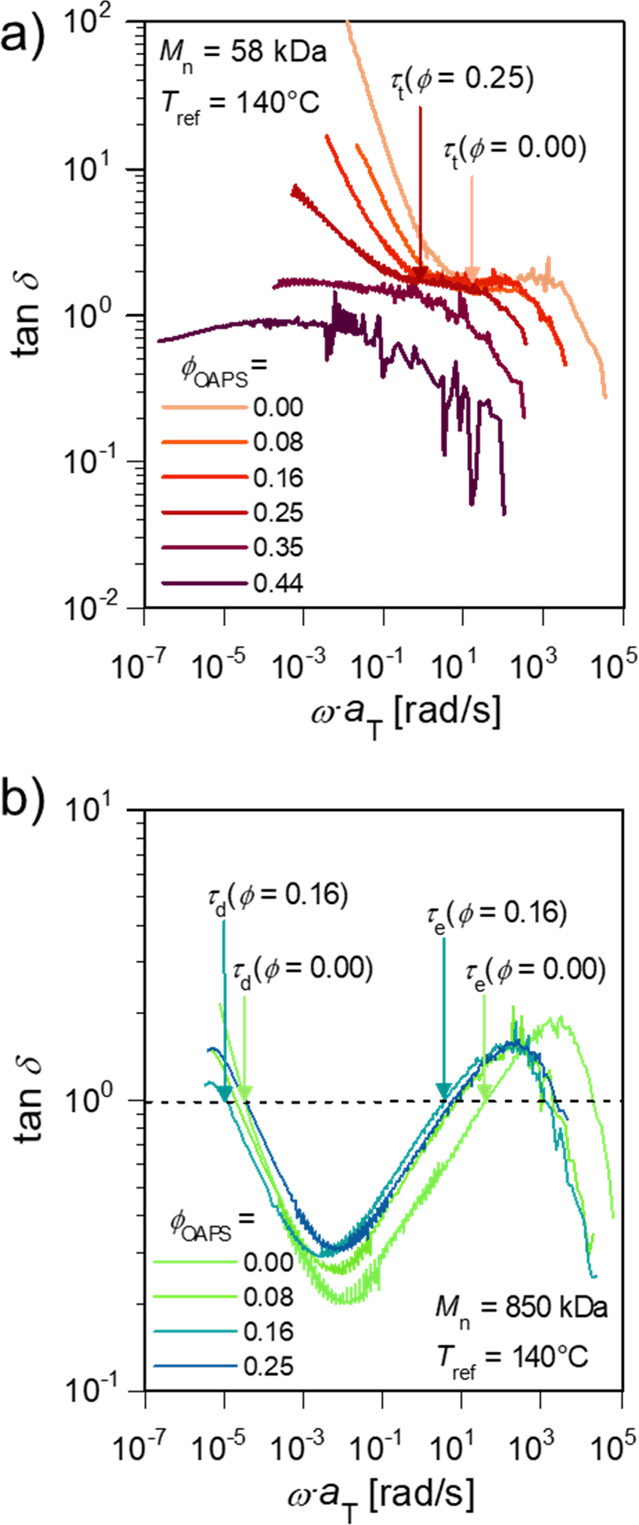
Loss tangent of the (a) Mn = 58 kDa and (b) Mn = 850 kDa P2VP/OAPS composites for various ϕOAPS values. Arrows mark the critical time scales of the terminal flow time τt (58 and 850 kDa) and entanglement onset time τe (850 kDa) for the compositions that do not display rheological gelation.
The slower process time scale agrees well with the critical times observed via rheology and obeys identical scaling with ϕOAPS within error. The time scales of terminal flow τt for the low Mn nanocomposites are shown in Figure 6a, and the time scale of entanglement onset τe is shown in Figure 6b for the high Mn samples. Both are plotted against the slower relaxation time and the α relaxation time of P2VP/OAPS with Mn = 15 kDa, adapted from our former work.37 Data for the 101 kDa nanocomposites is adapted from Cheng et al.18 These critical time scales (τt and τe) are also plotted in Figure 6c, normalized to those of the neat polymer. The terminal flow time, entanglement onset time, slower process time, and α relaxation time are fitted to log10 τ ∝ n · ϕOAPS, where n is a temperature-dependent exponent and indicates how sensitive τ is to ϕOAPS. This functional form is selected for clarity and consistency with prior works,18 though a power law function of the form log(τ/τo – 1) ∝ n · log ϕOAPS may also fit the data (Figure S7).
Figure 6.

(a) Plot of the terminal flow times τt of the lower Mn samples, alongside the slower process time and α process time and their lines of best fit. (b) Plot of the entanglement onset times τe of the higher Mn samples. (c) Plot of characteristic times as a function of ϕOAPS, normalized by the time scale of the ϕOAPS = 0.00 sample. Solid lines and dashed lines are fits to the slower process time and the α process time, respectively. (d) Plot of normalized τslower, τα, and τη as a function of ϕOAPS for unentangled/weakly entangled samples. Note that across all analyses, nanocomposite compositions that display rheological gelation are excluded.
The ϕOAPS dependence of critical rheological time scales (τe and τt for low Mn samples) characterized by the exponent n = 3.5 ± 1.8 to 6.5 ± 1.4 is closer to the slower process time (n = 5.0 ± 0.6) rather than the α process time (n = 0.9 ± 0.1), as shown in Table 2. This loading-dependent change in τα corresponds well to the significant change in Tg reported by DSC but is much weaker than the other trends observed.37 In other words, the change in Tg with increasing ϕOAPS can only be responsible for 1/5 of the change in time scale observed in the rheological measurements. The terminal flow time τt of the entangled polymers is essentially independent of ϕOAPS (n = 0.2 ± 1.5 to 0.6 ± 0.5; data shown in Figure S4). This illustrates that sticky Rouse and sticky reptation models32−35,42 alone cannot capture the rheological complexity of these materials if the OAPS loading is used as a proxy for sticker count; the terminal flow time has a strong dependence on sticker count in these models, yet no strong ϕOAPS dependence of τt is observed in the data, indicating that long-lived polymer–OAPS interactions may not be responsible for the observed behavior.
Table 2. Scaling Exponent n of Relaxation Time Scales with ϕ OAPS log10 τ ∝ n ϕOAPS.
| relaxation process | approximate time scale at 140 °C (s) | Mn (kDa) | n |
|---|---|---|---|
| α relaxation (τα) | 10–4 | 5 | 0.9 ± 0.1 |
| entanglement onset (τe) | 10–3–100 | 101 | 6.5 ± 1.4 |
| 850 | 3.5 ± 1.8 | ||
| terminal flow for low Mn (τt) | 10–3–10–1 | 32 | 4.5 ± 1.3 |
| 58 | 6.3 ± 0.7 | ||
| slower process (τslower) | 10–2–100 | 5 | 5.0 ± 0.6 |
| terminal flow for high Mn (τt) | 100 | 101 | 0.6 ± 0.5 |
| 105 | 850 | 0.2 ± 1.5 |
Perhaps the most striking example of this scaling is that normalized zero-shear viscosities of the ungelled, unentangled, and lightly entangled nanocomposites show identical compositional dependence with the slower process (Figure 6d). In principle, the terminal viscosity can be expressed as η = Goτη, where τη is the time scale associated with terminal flow. Assuming that Go is independent of ϕOAPS for the ungelled and low Mn samples, the scaling of the terminal time with ϕOAPS can be found in eq 1:
| 1 |
This ratio is plotted in Figure 6d as a function of ϕOAPS; it exhibits the same scaling with the slower process time, as observed for the critical crossover time analysis. These results support the conclusion that anomalous P2VP/OAPS nanocomposite rheological responses can be rationalized as a mechanical manifestation of the slower process. The relatively unchanged zero-shear viscosity of entangled nanocomposites is because the slower process acts on time scales faster than the terminal flow time, and the decrease in entanglement plateau width is caused by an extra relaxation process dominating entanglement dynamics at moderate times. Due to the time scale of the process being essentially molecular-weight-independent and likely coupled in some way to the motion of OAPS molecules, it is possible that there is an underlying connection to the vehicle mechanism proposed for nanocomposites with small fillers.30,31 Considering the stunning influences of the slower process on rheological properties, it will be crucial to uncover the atomic-level origin of this hidden midrange relaxation, which is an open opportunity for the field.
Conclusion
The linear rheological response of P2VP/OAPS not only displays features that are common to other nanocomposites, such as gelation at high loadings, but also reveals unique dynamical behavior, particularly a marked increase in Tg and short relaxation times with little effect on entanglement relaxation time. Between the glassy frequencies and the entanglement frequencies, the modulus of P2VP/OAPS is enhanced relative to the neat polymer due to polymer–nanoparticle interactions. The associated time scale of this response agrees well with the slower process observed via DRS for various OAPS loadings, indicating that the slower process manifests as a response in the rheology of the nanocomposite, dominating the entanglement process at intermediate frequencies of the stress response. However, open questions remain regarding the exact physical nature of this relaxation, whether it is primarily a consequence of OAPS–P2VP or OAPS–OAPS interactions. Tailoring the interactions in similar materials to target mechanical reinforcement on a specific time scale thus offers an intriguing way to create materials with enhanced Tg values and unconventional rheological responses without substantially affecting processability and terminal flow.
Methods
Materials
P2VP with an Mn of 850 kDa was purchased from Polymer Source (Dorval, QC, Canada) and used as received. P2VP with Mn = 30 and 58 kDa was synthesized via reversible addition–fragmentation chain transfer polymerization, as described elsewhere.6 Octa(aminophenyl)silsesquioxane (OAPS) was synthesized from octaphenyl silsesquioxane, as described elsewhere.12,43−45 Hexanes, methanol, ethyl acetate, petroleum ether, fuming nitric acid, magnesium sulfate, ferric chloride, and Celite 545 were purchased from Fisher Scientific (Waltham, MA, USA). Azobis(isobutyronitrile) (AIBN) and tetrahydrofuran (THF) were purchased from Alfa Aesar (Haverhill, MA, USA). Basic alumina, 2-vinylpyridine, calcium hydride, and hydrazine hydrate were purchased from Acros Organics (Fair Lawn, NJ, USA). Octaphenyl silsesquioxane was purchased from Hybrid Plastics (Hattiesburg, MS, USA). Ethyl-2-(phenylcarbonothioylthio)-2-phenylacetate was purchased from Sigma-Aldrich (St. Louis, MO, USA). AIBN was recrystallized in methanol. Styrene and 2-vinylpyridine were purified by passing through a column of basic alumina to remove inhibitors. Anisole was dried over calcium hydride.
Gel Permeation Chromatography (GPC)
The molecular weight and dispersity of the synthesized P2VP were characterized via GPC in a mobile phase of dimethylformamide (DMF) with 0.01 M lithium chloride salt at 50 °C relative to a polystyrene standard. The GPC instrument consisted of an Agilent Technologies 1260 Infinity instrument fitted with a PLgel 5 μm guard column, a PLgel 5 μm mix D 1° column, and a PLgel 5 μm mix C 1° column. Samples were run at a flow rate of 1 mL/min by using toluene as the flow rate marker.
Sample Preparation
Samples were prepared by a solution casting polymer and an OAPS from THF at different concentrations to achieve various compositions. THF was then allowed to evaporate for approximately 16 h before further drying at 100 °C and 1 Torr for 1 h. Samples were then annealed for at least 5 days at 180 °C and 10–5 mTorr.
Thermogravimetric Analysis (TGA)
TGA was performed on a TA Instruments Q500 instrument under a nitrogen atmosphere in a platinum sample holder.
X-ray Scattering
X-ray scattering measurements were performed on a SAXSLab Ganesha small- and wide-angle X-ray scattering instrument. The source was Cu Kα 0.154 nm with a beam area of approximately 0.1 mm2. All measurements were performed in transmission geometry on a nanocomposite sample 2 mm thick and acquired over 5 min.
Rheometry
Rheometry measurements were conducted on a Malvern Kinexus PRO rheometer with Peltier plate cartridge heating stage under a nitrogen atmosphere. Parallel plates of 1.5 cm were used for all measurements. The frequency was varied from 0.01–100 rad/s with a temperature up to 200 °C. Stress was fixed at 100 Pa, which was found to be within the linear regime. The gap height was set to 1 mm. Data were analyzed and TTS master curves were constructed using the IRIS Rheo-Hub software package.46
Acknowledgments
R.K. acknowledges support from an NSF CAREER Award (DMR 2046606). The authors acknowledge Jessica D. Schiffman and H. Henning Winter for use of their rheometer and lab space. We thank Jasney Combs for conducting strain sweep rheology experiments. We also thank H. Henning Winter and Benjamin M. Yavitt for insightful discussions.
Supporting Information Available
The Supporting Information is available free of charge at https://pubs.acs.org/doi/10.1021/acspolymersau.3c00020.
Thermogravimetric analysis of OAPS, small-angle X-ray scattering (SAXS) of P2VP/OAPS composites, additional rheological characterizations, and critical time versus OAPS loading in a power law form (PDF)
The authors declare no competing financial interest.
Special Issue
Published as part of ACS Polymers Auvirtual special issue “2023 Rising Stars”.
Supplementary Material
References
- Cheng S.; Carroll B.; Lu W.; Fan F.; Carrillo J.-M. Y.; Martin H.; Holt A. P.; Kang N.-G.; Bocharova V.; Mays J. W.; Sumpter B. G.; Dadmun M.; Sokolov A. P. Interfacial Properties of Polymer Nanocomposites: Role of Chain Rigidity and Dynamic Heterogeneity Length Scale. Macromolecules 2017, 50 (6), 2397–2406. 10.1021/acs.macromol.6b02816. [DOI] [Google Scholar]
- Lin E. Y.; Frischknecht A. L.; Winey K. I.; Riggleman R. A. Effect of Surface Properties and Polymer Chain Length on Polymer Adsorption in Solution. J. Chem. Phys. 2021, 155 (3), 034701 10.1063/5.0052121. [DOI] [PubMed] [Google Scholar]
- Zheng Z.; Li F.; Liu J.; Pastore R.; Raos G.; Wu Y.; Zhang L. Effects of Chemically Heterogeneous Nanoparticles on Polymer Dynamics: Insights from Molecular Dynamics Simulations. Soft Matter 2018, 14 (7), 1219–1226. 10.1039/C7SM02414B. [DOI] [PubMed] [Google Scholar]
- Trazkovich A. J.; Wendt M. F.; Hall L. M. Effect of Copolymer Sequence on Local Viscoelastic Properties near a Nanoparticle. Macromolecules 2019, 52 (2), 513–527. 10.1021/acs.macromol.8b02136. [DOI] [Google Scholar]
- Buitrago C. F.; Pressly J. F.; Yang A. S.; Gordon P. A.; Riggleman R. A.; Natarajan B.; Winey K. I. Creep Attenuation in Glassy Polymer Nanocomposites with Variable Polymer–Nanoparticle Interactions. Soft Matter 2020, 16 (38), 8912–8924. 10.1039/D0SM01247E. [DOI] [PubMed] [Google Scholar]
- Young W. W.; Saez J. P.; Katsumata R. Rationalizing the Composition Dependence of Glass Transition Temperatures in Amorphous Polymer/POSS Composites. ACS Macro Lett. 2021, 10 (11), 1404–1409. 10.1021/acsmacrolett.1c00597. [DOI] [PubMed] [Google Scholar]
- Voylov D. N.; Holt A. P.; Doughty B.; Bocharova V.; Meyer H. M.; Cheng S.; Martin H.; Dadmun M.; Kisliuk A.; Sokolov A. P. Unraveling the Molecular Weight Dependence of Interfacial Interactions in Poly(2-Vinylpyridine)/Silica Nanocomposites. ACS Macro Lett. 2017, 6 (2), 68–72. 10.1021/acsmacrolett.6b00915. [DOI] [PubMed] [Google Scholar]
- Cheng S.; Bocharova V.; Belianinov A.; Xiong S.; Kisliuk A.; Somnath S.; Holt A. P.; Ovchinnikova O. S.; Jesse S.; Martin H.; Etampawala T.; Dadmun M.; Sokolov A. P. Unraveling the Mechanism of Nanoscale Mechanical Reinforcement in Glassy Polymer Nanocomposites. Nano Lett. 2016, 16 (6), 3630–3637. 10.1021/acs.nanolett.6b00766. [DOI] [PubMed] [Google Scholar]
- Bocharova V.; Genix A.-C.; Carrillo J.-M. Y.; Kumar R.; Carroll B.; Erwin A.; Voylov D.; Kisliuk A.; Wang Y.; Sumpter B. G.; Sokolov A. P. Addition of Short Polymer Chains Mechanically Reinforces Glassy Poly(2-Vinylpyridine)–Silica Nanoparticle Nanocomposites. ACS Appl. Nano Mater. 2020, 3 (4), 3427–3438. 10.1021/acsanm.0c00180. [DOI] [Google Scholar]
- Zhou Y.; Schweizer K. S. Theory for the Elementary Time Scale of Stress Relaxation in Polymer Nanocomposites. ACS Macro Lett. 2022, 11, 199–204. 10.1021/acsmacrolett.1c00732. [DOI] [PubMed] [Google Scholar]
- Jia X.-M.; Qian H.-J.; Lu Z.-Y. The Interfacial Structure and Dynamics in a Polymer Nanocomposite Containing Small Attractive Nanoparticles: A Full Atomistic Molecular Dynamics Simulation Study. Phys. Chem. Chem. Phys. 2020, 22 (20), 11400–11408. 10.1039/D0CP00799D. [DOI] [PubMed] [Google Scholar]
- Young W. W.; Shi R.; Jia X.-M.; Qian H.-J.; Katsumata R. Relating the Degree of Nanofiller Functionality to the Glass Transition Temperature and Structure in a Polymer–Polyhedral Oligomeric Silsesquioxane Nanocomposite. Macromolecules 2022, 55 (12), 4891–4898. 10.1021/acs.macromol.2c00646. [DOI] [Google Scholar]
- Kumar S. K.; Benicewicz B. C.; Vaia R. A.; Winey K. I. 50th Anniversary Perspective: Are Polymer Nanocomposites Practical for Applications?. Macromolecules 2017, 50 (3), 714–731. 10.1021/acs.macromol.6b02330. [DOI] [Google Scholar]
- Cheng S.; Sokolov A. P. Correlation between the Temperature Evolution of the Interfacial Region and the Growing Dynamic Cooperativity Length Scale. J. Chem. Phys. 2020, 152 (9), 094904 10.1063/1.5143360. [DOI] [PubMed] [Google Scholar]
- Kim S.; Oh S. M.; Kim S. Y.; Park J. D. Role of Adsorbed Polymers on Nanoparticle Dispersion in Drying Polymer Nanocomposite Films. Polymers 2021, 13 (17), 2960. 10.3390/polym13172960. [DOI] [PMC free article] [PubMed] [Google Scholar]
- Oh S. M.; Lee C. H.; Kim S. Y. Processing Method Determines the Long-Term Stability of Particle Dispersions in Concentrated Nanoparticle/Polymer Suspensions. Soft Matter 2022, 18 (4), 841–848. 10.1039/D1SM01428E. [DOI] [PubMed] [Google Scholar]
- Jouault N.; Kumar S. K.; Smalley R. J.; Chi C.; Moneta R.; Wood B.; Salerno H.; Melnichenko Y. B.; He L.; Guise W. E.; Hammouda B.; Crawford M. K. Do Very Small POSS Nanoparticles Perturb S-PMMA Chain Conformations?. Macromolecules 2018, 51 (14), 5278–5293. 10.1021/acs.macromol.8b00432. [DOI] [Google Scholar]
- Cheng S.; Xie S.-J.; Carrillo J.-M. Y.; Carroll B.; Martin H.; Cao P.-F.; Dadmun M. D.; Sumpter B. G.; Novikov V. N.; Schweizer K. S.; Sokolov A. P. Big Effect of Small Nanoparticles: A Shift in Paradigm for Polymer Nanocomposites. ACS Nano 2017, 11 (1), 752–759. 10.1021/acsnano.6b07172. [DOI] [PubMed] [Google Scholar]
- Bailey E. J.; Griffin P. J.; Composto R. J.; Winey K. I. Multiscale Dynamics of Small, Attractive Nanoparticles and Entangled Polymers in Polymer Nanocomposites. Macromolecules 2019, 52 (5), 2181–2188. 10.1021/acs.macromol.8b02646. [DOI] [Google Scholar]
- Emamy H.; Kumar S. K.; Starr F. W. Diminishing Interfacial Effects with Decreasing Nanoparticle Size in Polymer-Nanoparticle Composites. Phys. Rev. Lett. 2018, 121 (20), 207801 10.1103/PhysRevLett.121.207801. [DOI] [PubMed] [Google Scholar]
- Song Y.; Zheng Q. Size-Dependent Linear Rheology of Silica Filled Poly(2-Vinylpyridine). Polymer 2017, 130, 74–78. 10.1016/j.polymer.2017.09.070. [DOI] [Google Scholar]
- Khan R. A. A.; Qi H.-K.; Huang J.-H.; Luo M.-B. A Simulation Study on the Effect of Nanoparticle Size on the Glass Transition Temperature of Polymer Nanocomposites. Soft Matter 2021, 17 (35), 8095–8104. 10.1039/D1SM00843A. [DOI] [PubMed] [Google Scholar]
- McKenzie-Smith T. Q.; Douglas J. F.; Starr F. W. Explaining the Sensitivity of Polymer Segmental Relaxation to Additive Size Based on the Localization Model. Phys. Rev. Lett. 2021, 127 (27), 277802 10.1103/PhysRevLett.127.277802. [DOI] [PubMed] [Google Scholar]
- Romo-Uribe A.; Reyes-Mayer A.; Paredes-Pérez M.; Lichtenhan J.; Yañez-Lino M.; Sarmiento-Bustos E. POSS Driven Chain Disentanglements, Decreased the Melt Viscosity and Reduced O2 Transmission in Polyethylene. Polymer 2019, 165, 61–71. 10.1016/j.polymer.2019.01.024. [DOI] [Google Scholar]
- Zhang X.; Zhao S.; Xin Z. The Chain Dis-Entanglement Effect of Polyhedral Oligomeric Silsesquioxanes (POSS) on Ultra-High Molecular Weight Polyethylene (UHMWPE). Polymer 2020, 202, 122631 10.1016/j.polymer.2020.122631. [DOI] [Google Scholar]
- Kopesky E. T.; Haddad T. S.; Cohen R. E.; McKinley G. H. Thermomechanical Properties of Poly(Methyl Methacrylate)s Containing Tethered and Untethered Polyhedral Oligomeric Silsesquioxanes. Macromolecules 2004, 37 (24), 8992–9004. 10.1021/ma048934l. [DOI] [Google Scholar]
- Raftopoulos K. N.; Pielichowski K. Segmental Dynamics in Hybrid Polymer/POSS Nanomaterials. Prog. Polym. Sci. 2016, 52, 136–187. 10.1016/j.progpolymsci.2015.01.003. [DOI] [Google Scholar]
- Tanaka K.; Adachi S.; Chujo Y. Structure–Property Relationship of Octa-Substituted POSS in Thermal and Mechanical Reinforcements of Conventional Polymers. J. Polym. Sci., Part A: Polym. Chem. 2009, 47 (21), 5690–5697. 10.1002/pola.23612. [DOI] [Google Scholar]
- Tanaka K.; Adachi S.; Chujo Y. Side-Chain Effect of Octa-Substituted POSS Fillers on Refraction in Polymer Composites. J. Polym. Sci., Part A: Polym. Chem. 2010, 48 (24), 5712–5717. 10.1002/pola.24370. [DOI] [Google Scholar]
- Carroll B.; Bocharova V.; Carrillo J.-M. Y.; Kisliuk A.; Cheng S.; Yamamoto U.; Schweizer K. S.; Sumpter B. G.; Sokolov A. P. Diffusion of Sticky Nanoparticles in a Polymer Melt: Crossover from Suppressed to Enhanced Transport. Macromolecules 2018, 51 (6), 2268–2275. 10.1021/acs.macromol.7b02695. [DOI] [Google Scholar]
- Yamamoto U.; Carrillo J.-M. Y.; Bocharova V.; Sokolov A. P.; Sumpter B. G.; Schweizer K. S. Theory and Simulation of Attractive Nanoparticle Transport in Polymer Melts. Macromolecules 2018, 51 (6), 2258–2267. 10.1021/acs.macromol.7b02694. [DOI] [Google Scholar]
- Baxandall L. G. Dynamics of Reversibly Crosslinked Chains. Macromolecules 1989, 22 (4), 1982–1988. 10.1021/ma00194a076. [DOI] [Google Scholar]
- Leibler L.; Rubinstein M.; Colby R. H. Dynamics of Reversible Networks. Macromolecules 1991, 24 (16), 4701–4707. 10.1021/ma00016a034. [DOI] [Google Scholar]
- Rubinstein M.; Semenov A. N. Dynamics of Entangled Solutions of Associating Polymers. Macromolecules 2001, 34 (4), 1058–1068. 10.1021/ma0013049. [DOI] [Google Scholar]
- Rubinstein M.; Semenov A. N. Thermoreversible Gelation in Solutions of Associating Polymers. 2. Linear Dynamics. Macromolecules 1998, 31 (4), 1386–1397. 10.1021/ma970617+. [DOI] [Google Scholar]
- Papadopoulos P.; Peristeraki D.; Floudas G.; Koutalas G.; Hadjichristidis N. Origin of Glass Transition of Poly(2-Vinylpyridine). A Temperature- and Pressure-Dependent Dielectric Spectroscopy Study. Macromolecules 2004, 37 (21), 8116–8122. 10.1021/ma048555s. [DOI] [Google Scholar]
- Young W. W.; Tabuchi H.; Iguchi R.; Konishi T.; Fukao K.; Katsumata R. A Hidden Relaxation Process in Poly(2-Vinylpyridine) Homopolymers, Copolymers, and Nanocomposites. Macromolecules 2022, 55 (15), 6590–6597. 10.1021/acs.macromol.2c00789. [DOI] [Google Scholar]
- Song Z.; Rodríguez-Tinoco C.; Mathew A.; Napolitano S. Fast Equilibration Mechanisms in Disordered Materials Mediated by Slow Liquid Dynamics. Science Advances 2022, 8 (15), 7154. 10.1126/sciadv.abm7154. [DOI] [PMC free article] [PubMed] [Google Scholar]
- Takahashi Y.; Ochiai N.; Matsushita Y.; Noda I. Viscoelastic Properties of Poly(2-Vinylpyridine) in Bulk and Solution. Polym. J. 1996, 28 (12), 1065–1070. 10.1295/polymj.28.1065. [DOI] [Google Scholar]
- Baeza G. P.; Dessi C.; Costanzo S.; Zhao D.; Gong S.; Alegria A.; Colby R. H.; Rubinstein M.; Vlassopoulos D.; Kumar S. K. Network Dynamics in Nanofilled Polymers. Nat. Commun. 2016, 7, 11368. 10.1038/ncomms11368. [DOI] [PMC free article] [PubMed] [Google Scholar]
- Akcora P.; Kumar S. K.; Moll J.; Lewis S.; Schadler L. S.; Li Y.; Benicewicz B. C.; Sandy A.; Narayanan S.; Ilavsky J.; Thiyagarajan P.; Colby R. H.; Douglas J. F. Gel-like” Mechanical Reinforcement in Polymer Nanocomposite Melts. Macromolecules 2010, 43 (2), 1003–1010. 10.1021/ma902072d. [DOI] [Google Scholar]
- Golkaram M.; Loos K. A Critical Approach to Polymer Dynamics in Supramolecular Polymers. Macromolecules 2019, 52 (24), 9427–9444. 10.1021/acs.macromol.9b02085. [DOI] [PMC free article] [PubMed] [Google Scholar]
- Tamaki R.; Tanaka Y.; Asuncion M. Z.; Choi J.; Laine R. M. Octa(Aminophenyl)Silsesquioxane as a Nanoconstruction Site. J. Am. Chem. Soc. 2001, 123 (49), 12416–12417. 10.1021/ja011781m. [DOI] [PubMed] [Google Scholar]
- Fan H.; Yang R.; Li D. Synthesis Improvement and Characterization of Polyhedral Oligomeric Octa(Aminophenyl)Silsesquioxane. Acta Chimica Sinica 2012, 70 (04), 429. 10.6023/A1110211. [DOI] [Google Scholar]
- Wu Y.; Liu L.; Yang R.; Zhang W. Synthesis and Characterization of Low-Functional Nitrated and Aminated Octa(Phenyl) Silsesquioxane. ChemistrySelect 2019, 4 (10), 2941–2948. 10.1002/slct.201900272. [DOI] [Google Scholar]
- Poh L.; Narimissa E.; Wagner M. H.; Winter H. H. Interactive Shear and Extensional Rheology—25 Years of IRIS Software. Rheol. Acta 2022, 61 (4), 259–269. 10.1007/s00397-022-01331-6. [DOI] [Google Scholar]
Associated Data
This section collects any data citations, data availability statements, or supplementary materials included in this article.