

Significance
Calorie restriction (CR) is a safe treatment for obesity, but how late in life CR has beneficial effects is unclear. Here, we show that transferring male Drosophila melanogaster, from a high to a low-calorie diet slows rate of aging, and extends lifespan even when applied late in life. In contrast, transferring flies from a low to a high-calorie diet induces costly physiological changes that increase mortality rate, and shorten lifespan. Our findings reveal that CR provides benefits in flies aged on high-calorie diet even in old age, while sudden consumption of high-caloric food leads to negative effects. Dietary shift leads to transcriptomic modifications that provide framework for physiological and metabolic adaptation underlying changes in rate of aging.
Keywords: caloric restriction, lifespan, Drosophila melanogaster, obesity, aging
Abstract
The prevalence of obesity is increasing in older adults and contributes to age-related decline. Caloric restriction (CR) alleviates obesity phenotypes and delays the onset of age-related changes. However, how late in life organisms benefit from switching from a high-(H) to a low-calorie (L) diet is unclear. We transferred male flies from a H to a L (HL) diet or vice versa (LH) at different times during life. Both shifts immediately change fly rate of aging even when applied late in life. HL shift rapidly reduces fly mortality rate to briefly lower rate than in flies on a constant L diet, and extends lifespan. Transcriptomic analysis uncovers that flies aged on H diet have acquired increased stress response, which may have temporal advantage over flies aged on L diet and leads to rapid decrease in mortality rate after HL switch. Conversely, a LH shift increases mortality rate, which is temporarily higher than in flies aged on a H diet, and shortens lifespan. Unexpectedly, more abundant transcriptomic changes accompanied LH shift, including increase in ribosome biogenesis, stress response and growth. These changes reflect protection from sudden release of ROS, energy storage, and use of energy to growth, which all likely contribute to higher mortality rate. As the beneficial effects of CR on physiology and lifespan are conserved across many organisms, our study provides framework to study underlying mechanisms of CR interventions that counteract the detrimental effects of H diets and reduce rate of aging even when initiated later in life.
The incidence of diet-related metabolic disorders such as obesity, cardiovascular disease, and type-2 diabetes steadily increases with age. One intervention that mitigates such disorders is calorie restriction (CR), which is known to improve healthspan and extend lifespan in most model organisms (1–5). CR leads to physiological and metabolic adaptations including increased stress resistance, enhanced mitochondrial function, higher insulin sensitivity, and autophagy, while reduced are growth, reproductive capacity, and damage caused by reactive oxidative species (1–3, 6). Human clinical studies reveal that mild CR, or different nutritional regimes, such as intermittent fasting and time-restricted calorie intake, have many beneficial effects, such as weight loss and an improvement of physiological markers in healthy individuals with obesity (2, 5, 7–12). Timing of calorie intake affects appetite and hunger in healthy obese humans (8). However, whether or not an obese individual can benefit from CR when implemented at an old age is not fully understood; hence, more studies into how time of application impacts response to CR are needed.
Several studies in mice examined the effects of late-life shift to CR with different results (13–15). CR initiated at 19 mo decreases mortality rate, extends mean and maximal lifespan of male mice, and leads to shift in hepatic transcriptome toward the gene expression of long-term CR mice including metabolic, immune response, stress response, and growth-related pathways within 8 wk (13). Shifting mice from CR to standard diet shortens their survivorship and affects transcriptome (13). Shifting 24-mo-old ad libitum (AD) fed female mice to dietary restriction (DR) resulted only in a minor improvement in survival, which the authors attribute to metabolic memory illustrated by small refractory changes in the transcriptomes of brown and white adipose tissues (14). The same group found that switching mice from DR to AD feeding increased mortality (14). Response to CR is strongly affected by genetic background, nutritional content of the diet, time of application and sex, and study design, which could explain different outcomes of these studies (13–15).
Many studies into CR diets are done in Drosophila melanogaster models. Flies aged on a CR diet experience dramatic behavioral, physical, and demographic changes (16–22). Wild-type flies have been assayed for the effects of different calorie regimens ranging from starvation to overfeeding on stress resistance, spontaneous physical activity, female fecundity, metabolic changes, and survivorship (17, 23–25). Overnight fasting leads to change in circadian rhythm and extends fly longevity (26). Transferring fully fed flies to a diet with 35% less yeast and sugar at 14 and 22 d of age reduces the short-term risk of death (18). Whole genome transcriptional profiling of whole female flies aged on a control diet or shifted to CR diet at six and eight different ages during their life, respectively, identified down-regulation of genes associated with cell growth, metabolism, and reproduction (19). Analysis of acute response during the first 72 h following transfer of female flies from a normal to a DR diet at age 40 d resulted in a rapid change in mortality rate that became similar to its continuously DR control (27, 28). Whole genome transcriptomic analysis of the head and thorax of flies done every 2 or more hours following DR switch, showed only 144 differentially expressed (DE) genes that rapidly changed their expression to the same levels of genes found in DR flies. DE genes were involved in carbohydrate and fatty acid (FA) metabolism (27, 28). Further Gene Set Enrichment Analysis (GSEA) revealed an early increase in activity in pathways associated with mRNA processing and protein translation, which was followed by downregulation in activity of these pathways (28). We extended those studies and analyzed tissue-specific transcriptomes in male flies 2 and 5 d after shift from both HL and LH diet late in life. Flies fed high-sugar diet (HSD) or high-fat diet (HFD), are characterized by obesity and hyperglycemia, and are used as a model of obesity. However, while HFD reduces lifespan, effects of HSD on lifespan are variable (29, 30). Here, we use high-calorie diet with equal increased proportion of sucrose and protein levels, which leads to obesity phenotype including increase in lipid levels and shorter fly lifespan, and use it to determine full effects of CR (17, 21). Another question recently probed is the effect of transferring flies from CR to high (H) calorie nutrient value. The increase in mortality observed in female flies after switch from DR to full-fed condition was attributed to the cost associated with a nutrient-rich environment and hidden cost of DR (31). However, this view was not supported in another study of female flies, possibly due to different experimental design (22). Our study design differs from previous studies in use of much higher calorie diet to fully determine how late CR can benefit flies, as well in determining effects of transfer from CR to a H diet, determination of tissue-specific transcriptome using RNA-Seq analysis and combining with metabolic analyzes. Our experiments were designed to probe effects of late-life CR on male flies fed H diet and therefore differ from experiments where CR was applied to flies on a standard diet, or AD-fed rats or mice. Here, we address three key unanswered questions: 1) how late in life shifting flies from a high (H) to a low (L)-calorie diet extends fly life; 2) how shifting from L to H calorie diet late in life impacts survivorship; and 3) what are the tissue-specific metabolic and physiological adaptations in response to a shift in dietary caloric content.
Results
CR Has Beneficial Effects on Fly Lifespan when Applied Later in Life.
To determine whether late-life CR has beneficial effects on fly lifespan, we performed a series of survivorship studies in wild-type male Canton-S (CS) flies. While many studies have investigated the effects of shifting flies from a standard to a CR diet, we shifted flies from a high-calorie (H) diet, 3.0 N, to a low-calorie (L) diet, 0.5 N. The 3.0 N diet has six times higher caloric content compared to 0.5 N, which is more clinically relevant to human conditions as metabolic disorders are driven by caloric surplus (17, 21). To determine effects of a late-life shift and to uncover underlying physiological changes, we performed survivorship, metabolic, and transcriptome analyzes (Fig. 1A). Flies were aged on a H diet and a subset of flies was transferred to a L diet on day 20 [(high-to-low day 20 (HLD20)], 50 (HLD50), and 60 (HLD60). Similarly, a group of flies was aged on a L diet and a subset was shifted to H diet at the same ages (low-to-high day 20 LHD20, LHD50, and LHD60) (Fig. 1A). Males switched from HL at D20 showed a dramatic increase in mean lifespan, and all three age groups had significantly longer maximal lifespan compared to flies kept on a H diet (Fig. 1B). Remarkably, even when flies were switched from H to L at 60 d (HLD60), when only 14 percent of H flies remained alive, maximal lifespan was dramatically extended with HLD60 flies living 35.2% longer than flies on a H diet (Fig. 1B and SI Appendix, Tables S1 and S2). Comparing mortality kinetics uncovered that HL and LH shifts lead to immediate and long-term effects. HL shift at all ages resulted in an acute and short-term decrease in age-specific mortality rate, which was briefly lower than of flies on a constant L diet but soon became similar to flies on constant L diet (Fig. 1 D–F). Conversely, there was an immediate increase in short-term risk in LH-shifted flies at all three ages (LHD20, LHD50, LHD60), which was briefly higher and then became similar to that of flies on a constant H diet (Fig. 1 G–I). Furthermore, the LHD50 shift decreases maximal survivorship below that observed in flies on a constant H diet. This is consistent with the finding that fully fed males when switched to DR at 22 d experience rapid increase in mortality that was slightly higher than fully fed flies (18). The beneficial effects of late-life shift were confirmed in a second set of shifting experiments where CS male flies were shifted HL or LH at days 10, 20, 30, 40, and 50. Both shifts affect mean and maximum life spans and mortality rates at all ages (SI Appendix, Fig. S1 and Tables S4 and S5). Overall, our data demonstrate that shifting LH later in life is more detrimental to flies than living on H diet the whole life. In contrast, HL shift is profoundly beneficial even at old age (Fig.1I).
Fig. 1.

Shifting diets has profound effects on male lifespan and mortality: (A) Experimental diagram: Male flies were kept on a low-calorie (L), or a high-calorie diet (H) and shifted from H to L diet at day 20 (HLD20), 50 (HLD50), or 60 (HLD60), or from L to H diet on day 20 (LHD20), 50 (LHD50), or 60 (LHD60). Transcriptomes were determined in flies kept on a L or a H diet at day 50 (D50) and 2 and 5 d after H to L (HLD52, HLD55) or L to H (LHD52, LHD55) shift. Metabolism was determined in homogenate of flies kept on a low-calorie (L) or a high-calorie diet (H) at 20 (LD20, HD20) or 50 (LD50, HD50) days, and in flies 1, 2, or 5 d after shifting from H to L diet at day 20 (HLD21, HLD22, HLD55), or day 50 (HLD51, HLD52, HLD55), or from L to H diet on day 20 (LHD21, LHD22, LHD25), and day 50 (HLD51, HLD52, HLD55). (B–E) Survivorships (B and C) and mortality rates (D–I) of male flies shifted from H to L at day 20 (HLD20), day 50 (HDL50), or day 60 (HLD60) (B and D–F) or from L to H diet on day 20 (LHD20), day 50 (LHD50), or day 60 (LHD60) (C and G–I). Survivorship curves and mortality rate were analyzed by long-rank test JMP16 program.
Diet Shift Has Profound Effects on the Hazard Ratio (HR).
Cox regression analysis was used to calculate differences in HR between flies on a constant L or H diet (control) and LH- or HL-shifted flies (experimental), (SI Appendix, Fig. S2 A–C and Table S3) (14). HLD50 shift decreases HR illustrated by a significant decrease in H/HLD50 ratio of 0.29 (P = 0.02) in flies 20 d after shifting (SI Appendix, Fig. S2B and Table S3). In contrast, high transient increased mortality rate and short-term risk of death were observed in LHD50 flies immediately following shifting compared to flies on a constant H diet. This is illustrated by the death of 186 LHD50 (80%) flies during the first 10 d after shifting compared to 22 (5.7%) on a constant H diet. This is reflected in 1.53 H/LHD50 HR (P = 0.005) and increased HR of 2.87 L/LHD50 (P < 0.001) when compared to L flies during the first 10 d after shift (SI Appendix, Table S3A).
Diet Shift Induces Striking Tissue-Specific Changes in Transcription
To investigate mechanisms underlying profound changes in survivorship during late-life diet shifts, we determined tissue-specific transcriptional changes. RNA was isolated from the heads, thoraces, and abdomens of HD50 or LD50 male flies, and in flies 2 and 5 d after diet shift (Fig. 1A). We determined RNA-Seq profiles using three biological replicates at each time point. A sample-to-sample distance heatmap shows tissue type to be the driving force for distance, indicating distinct transcriptional profiles across tissue types (SI Appendix, Fig. S2A). This is corroborated by transcriptome-wide principal component (PC) analysis, which indicates that biological samples from the same tissues cluster together and are clearly distinct (Fig. 2A). PC analyzes of samples from the head or abdomen indicate that samples segregate along PC1 and PC2 primarily by diet. Head and abdomen samples isolated 2 or 5 d after shifting to a L diet, cluster with samples on constant L diet (Fig. 2A). Samples from the thorax show greater variance along PC1 but smaller PC2 variance (Fig. 2A). A heatmap of unsupervised clustering of DE genes from all samples and heatmaps of samples separated by LH and HL shifts, confirm clustering at the diet and tissue level, respectively (Fig. 2B and SI Appendix, Fig. S2B). Gene expression in biological samples from the head, thorax, or abdomen cluster together based on diet before shifting (LD50 or HD50), while gene expression collected on days 52 and 55 cluster together and with samples from the diet the flies are shifted to (Fig. 2C). Taken together, 2 d after shift transcriptional responses are closer to transcriptomes of samples from the new diet than to original diet.
Fig. 2.
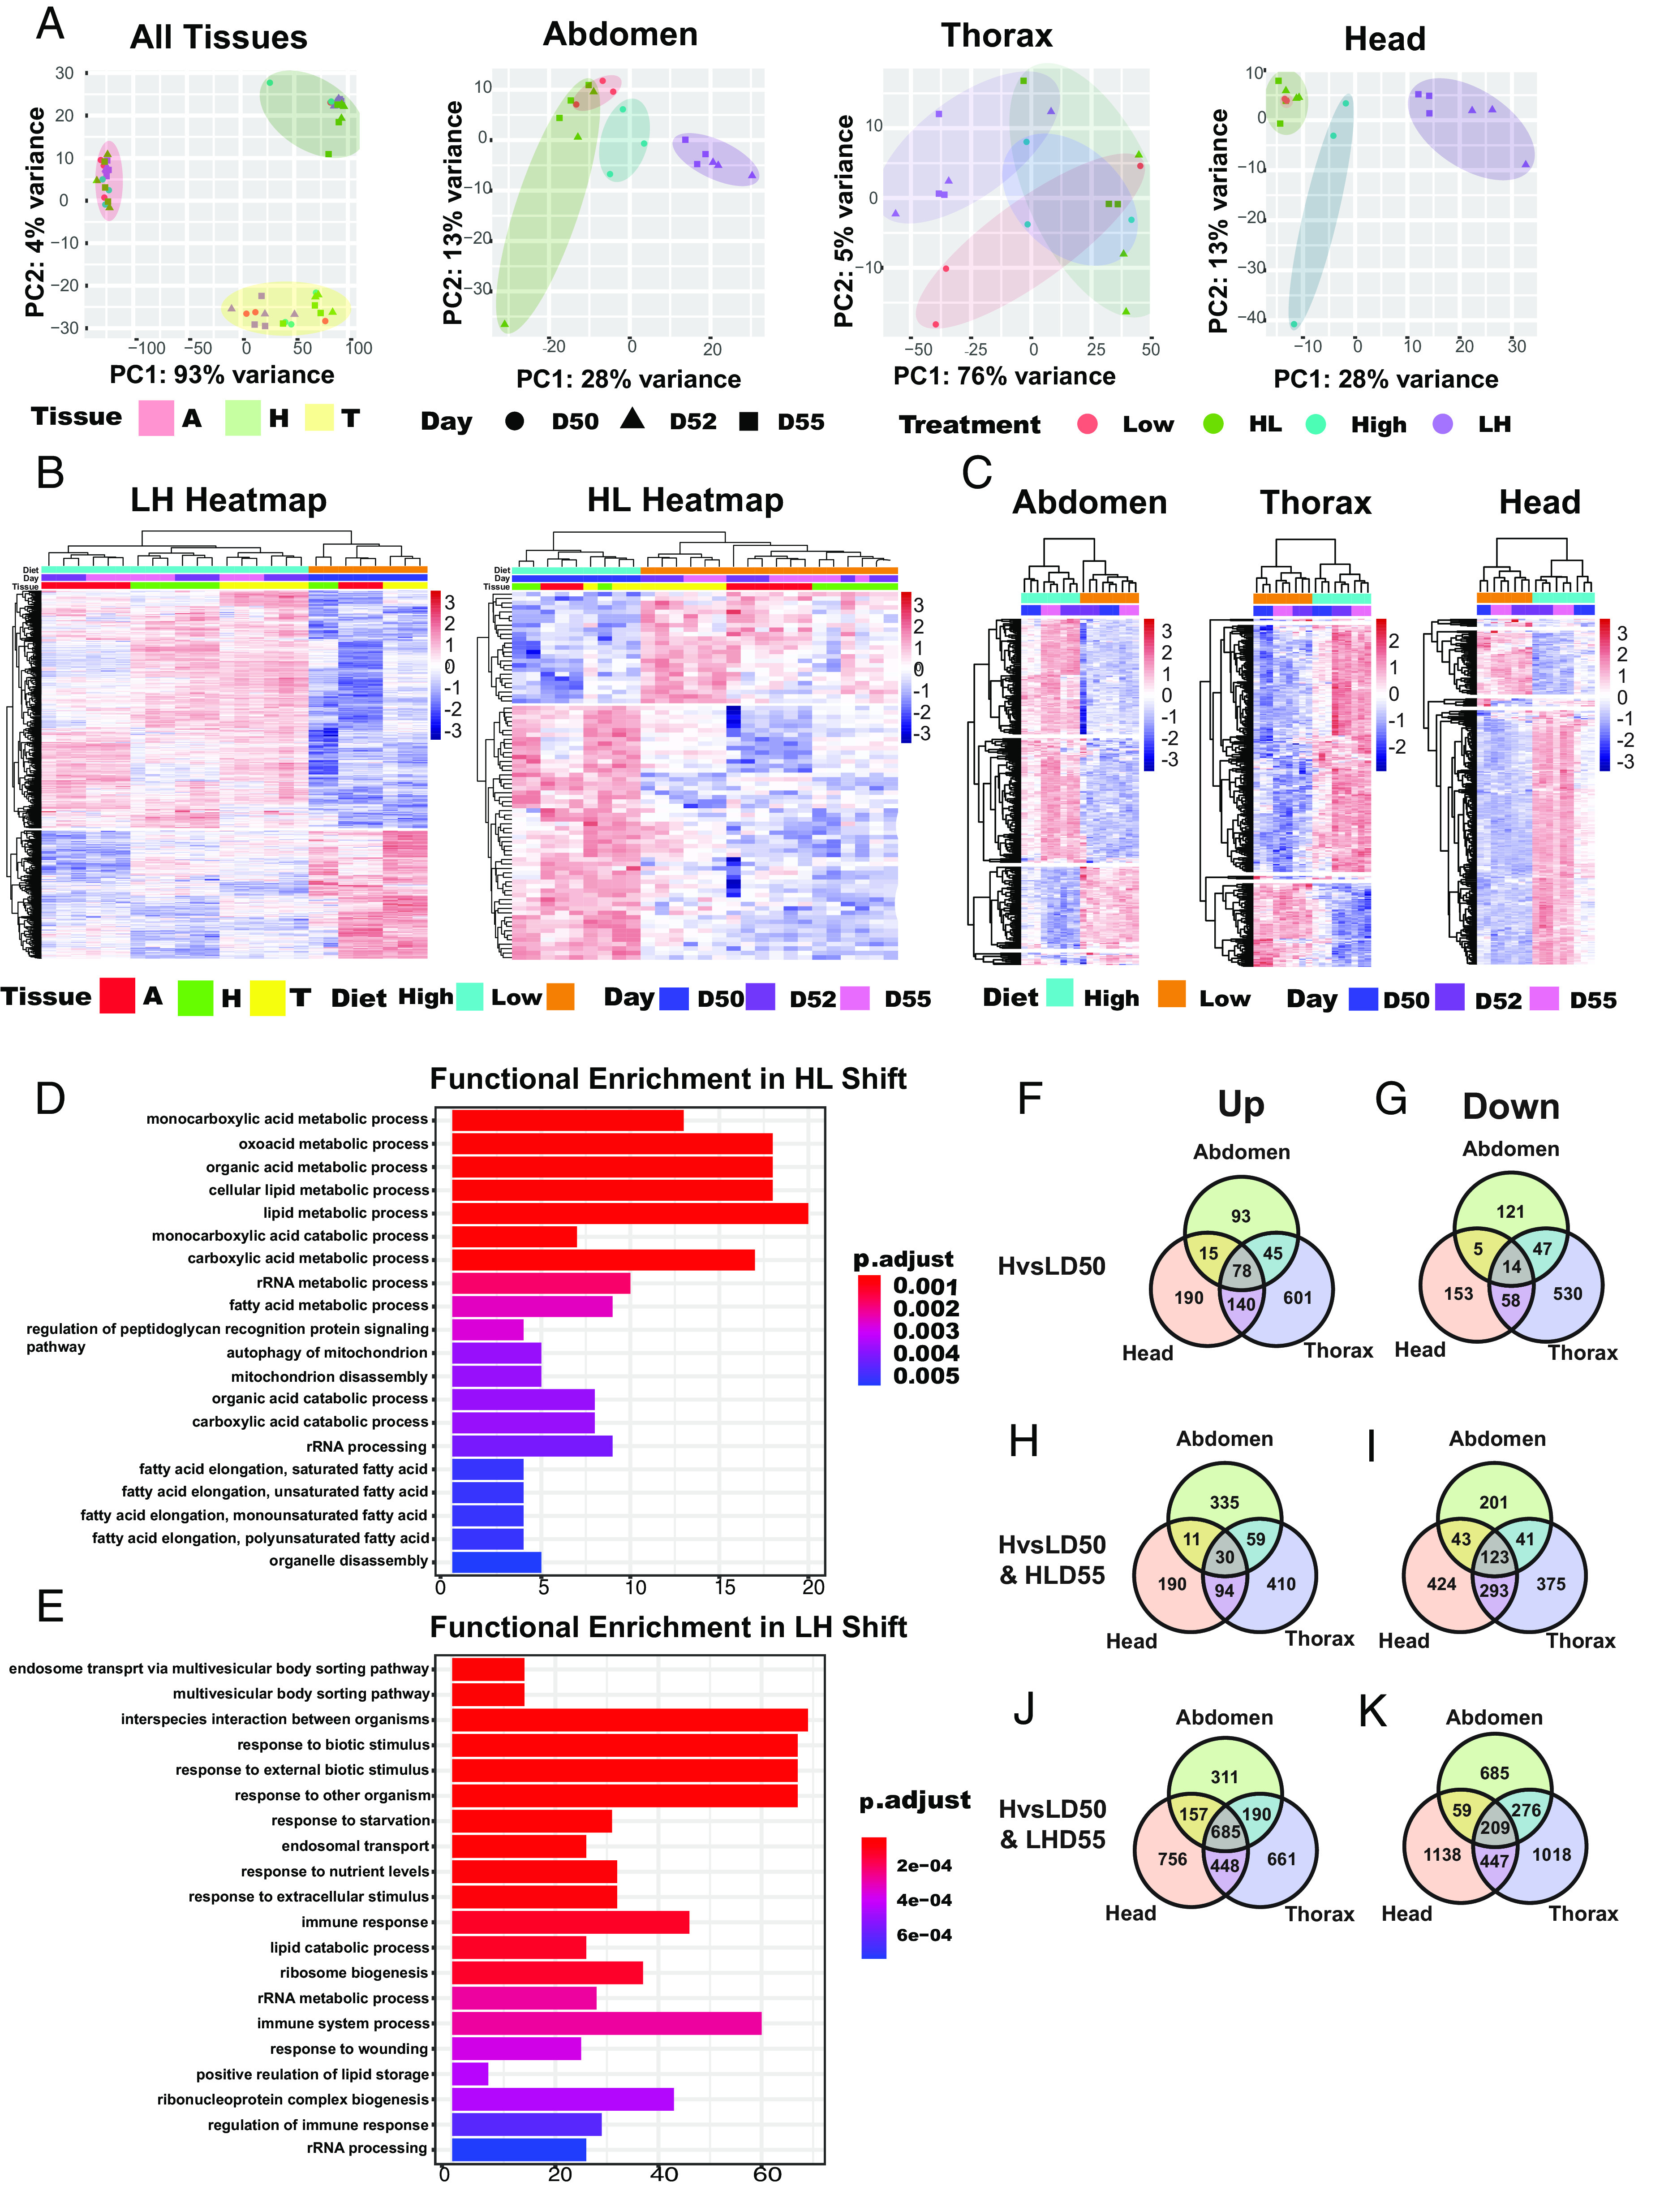
Shifting diet induces striking tissue-specific changes in transcriptome: (A) PCA plots of all tissues or specific tissues, marked Abdomen, Thorax, or Head, of DE genes at high (H) or low (L) diets at day 50 (D50) before, and 2 and 5 d after H to L (HLD52, HLD55) or L to H (LHD52, LHD55) shifting. (B and C) Heatmaps of all (B) or tissue-specific (C) DE genes between flies on H or L diets at day 50 (D50) before and 2 and 5 d after HL (HLD52, HLD55) or LH (LHD52, LHD55) shift. (D and E) Functional enrichment analysis of DE genes in heads, thoraces, and abdomens associated with HL (D) and LH (E) shift. (F–K) Venn diagrams show upregulated (Up) (F, H, and J) or downregulated (Down) (G, I, and K) DE genes between L and H diet from head, thorax, and abdomen at day 50 before shifting (HvsLD50) (F and G) or 5 d after HL shift (HvsLD50 & HLD55) (H and I) or LH shift [HvsLD50 & LHD55 (J and K)]. FDR threshold: 0.05, logFC threshold: 0.2.
Functional Enrichments in HL Shift Reveal Strong FA Metabolism.
We used DESeq2 to quantify DE genes in head, thorax, and abdomen samples obtained from flies before and after shifting (32, 33). To identify specific pathways associated with HL and LH shift across all tissues, we performed functional enrichment analysis of each shift separately (Fig. 2 D and E). This analysis revealed specific KEGG metabolic processes that mediate HL adaptation across all tissues including monocarboxylic acid metabolic and catabolic processes, carboxylic metabolic processes, cellular lipid metabolic processes, and rRNA processing. Strong functional enrichment was associated with FA metabolism, including FA elongation of saturated, unsaturated, monosaturated, and polyunsaturated FAs. These results suggest a shift in metabolism, with flies on a low diet utilizing FAs as preferred means for substrate oxidation, which is consistent with data found in flies, rodents, and humans (2–4, 6, 19, 27, 34–38).
Functional Enrichments in LH Shift Reveal Increased Ribosomal Biogenesis and Lipid Storage Processes.
Increase in nutrients provided by a H diet leads to positive regulation of proliferation, and lipid storage (Fig. 2E) (39). Such processes were identified in LH-shifted flies by functional enrichment analysis and include ribosome biogenesis, rRNA processing, ribonucleoprotein complex biogenesis, rRNA metabolic processes, and positive regulation of lipid storage, all processes that demand high energy investment. Further, regulation of the immune response was another significantly enriched pathway, which is reported to be activated under high-calorie diet conditions (Fig. 2E) (40).
Dynamics of DE Genes Associated with H and L Diets and Shifts.
To search for common and tissue-specific pathways associated with CR, we compared head-, thorax-, and abdomen-specific DE genes between H and L (HvsL) diets before shifting (HvsLD50) (Fig. 2 F and G). A Venn diagram shows only 78 commonly upregulated and 14 commonly downregulated DE genes across the three tissues (Fig. 2 F and G). The largest number of unique genes are found in the thorax (up = 601, down = 530), while a similar number of unique genes are found in the head (up = 190; down = 153), and abdomen (up = 93; down = 121) (Fig. 2 F and G). Surprisingly, comparison of head, thorax, and abdomen DE genes before- and 5 d post-shift (HvsLD50 & HLD55) reveals only 30 commonly upregulated and 123 downregulated genes across the three tissues (Fig. 2 H and I). Most of these genes are involved in metabolic processes.
In contrast, LH shift increases the number of commonly up-regulated (685) and down-regulated (209) genes for the three body segments (HvsLD50 & LHD55) (Fig. 2 J and K). Upregulated genes belong to KEGG pathways: FoxO signaling, mTOR signaling pathway, Jak-STAT signaling pathway, and glutathione metabolism (1, 2, 6). Common downregulated DE genes affect KEGG pathways: metabolic pathways, FA biosynthesis, and amino acid biosynthesis. Similarly, there are an abundant number of tissue-specific DE genes associated with LH shift. A similar number of unique DE genes are upregulated and downregulated in heads (up = 756; down = 1,138) and thorax (up = 661; down = 1,018), while there are a lower number of DE genes in the abdomen (up = 311; down = 685). Our data uncover rapid transcriptomic changes following the shift, characterized by only a few common genes and unique tissue-specific changes. Profoundly, LH shift leads to several fold increase in DE genes compared to HL shift, underlying costly adaptation to sudden increase in calories that likely contributes to increased mortality rate.
Flies Adapt Their Metabolism to Nutrient Shifting at both Young and Old Ages.
Organisms adapt to changes in energy by mobilizing stored nutrients and altering catabolic or anabolic processes to provide energy for survival (2). To probe metabolic adaptation to H and L diets before and after the shifts on the organismal level, we determined the levels of triglycerides (TAG), glucose, glycogen, trehalose, and proteins in homogenates of whole male flies. Flies store excess energy as TAG in lipid droplets and use carbohydrates as an energy source. Accordingly, these levels alter depending on the nutritional status of the organism. To determine how age affects metabolic adaptations, we analyzed metabolism in 20- and 50-d-old flies aged on either a H or L diet (HD20; LD20; HD50; LD50). A subset of flies was then shifted to opposite diets, and metabolism was measured 1, 2, and 5 d after shifting (HLD21, HLD22, HLD25, LHD21, LHD22, LHD25) and the same for D50 (Fig. 1A). The most dramatic changes were observed in TAG levels (Fig. 3A). At D20, flies on constant H or L diets have the same TAG levels indicating that young flies have metabolic resilience and easily adapt their TAG metabolism to different diets. However, by D50, aging on a constant H diet increases and aging on a constant L diet decreases TAG levels leading to an almost twofold difference between HD50 and LD50. Transcriptional analysis identified potential mediators of metabolic changes. At D50, before shift, changes in metabolism between H and L diets are concurrent with increased expression of a limited number of common DE genes (HvsLD50): 1-Acylglycerol-3-phosphate O-acyltransferase 2 (Agpat2) and Diacylglycerol O-acyltransferase 2 (Dgat2), which have roles in triacylglycerol synthesis and droplet growth (Fig. 3B) (39). HL shift results in using lipids as an energy source, as well as a decrease in lipid synthesis. At D20, HL shift leads to decreased TAG levels to about 60% of D20 5 d after shift. At D50, HL shift decreases TAG levels to about 20% of starting levels 5 d post-shift (HLD55) (Fig. 3A). A clear correlation was noted between decreasing trend in TAG levels and reduced expression of common DE genes involved in lipid metabolism following HL shift: Agpat2, Dgat2, and Acetyl Coenzyme A synthase (AcCoAs) (Fig. 3B). LH shift increases the TAG levels at both ages, but is more striking at D50 as illustrated by a threefold increase at D55 and is concurrent with upregulation of DE genes listed above. LH shift is associated with reduced expression of Acetyl-CoA carboxylase (ACC), the rate-limiting substrate for FA synthesis and gene required for DR-associated lifespan extension (Fig. 3B) (34). The levels of Sterol regulatory element-binding protein (SREBP), which affects transcription of a variety of genes involved in de novo lipogenesis show an increasing trend during LH shift (Fig. 3B) (14, 41). Lip3 catalyzes breakdown of TAG into free FAs to be used as an energy source and its levels are strongly upregulated in abdomens and thoraces of HL-shifted flies, and downregulated in LH flies (42). Tissue-specific changes in metabolism are illustrated by different levels or trends in gene expression associated with shifts; for instance, Lip3 levels are increased in heads at D50, but are not affected by shifting, while in thorax the levels are lower in H than in L flies, and LH reduces levels. In the abdomen, HL is associated with an increase and LH with decrease in Lip3. Transcription of doppelganger von brummer (dob), a lipid droplet-associated TAG lipase, decreases in the thorax and abdomens of HL-shifted flies, while the levels are lower and constant in heads (Fig. 3B) (43). Our data show that even at age of 50D, flies immediately adapt their lipid metabolism to nutrient conditions, which correlates with rapid changes in gene expression of key lipid genes, which is consistent with immediate effects on mortality rate and HR (Fig. 1 E, H, K, and L).
Fig. 3.

Age-dependent effects of shift on metabolism: (A) Levels of TAG in male flies on days 20 and 50 before shifting, and 1, 2, and 5 d after shifting from H to L diet (HL) or L to H diet (LH). (B) Tissue-specific DE gene analysis of count data of Agpat2, Dgat2, ACC, AcCoAS, Pepck2 (Phosphoenolpyruvate Carboxykinase 2), Hnf4 (Hepatocyte nuclear factor 4), SREBP, Lip3 (Lipase 3) and dob (doppelganger von brummer) during HL and LH shift. (C) Levels of glucose in male flies on days 20 and 50 before shifting, and 1, 2, and 5 d after shifting from H to L diet (HL) or L to H diet (LH). Error bars represent SEM. Data from 20 and 50 d were analyzed separately using two-way ANOVA. Post-hoc analysis was conducted using Tukey’s test, correcting for multiple comparisons. Results represent means ± SE of 3 biological replicates containing 10 flies per replicate. P: 0.033 (*), 0.002 (**), 0.0002 (***), <0.0001 (****).
Flies use glucose as a major source of energy, which can be stored as glycogen or trehalose. At 20D, levels of glucose, glycogen, and trehalose are the same in flies on a L or H diet. At D50, levels of glucose are higher in HD50 flies, which is parallel to increased levels of Pepck2 (Phosphoenolpyruvate Carboxykinase 2), the rate-limiting enzyme of gluconeogenesis (44). HL shift decreases and LH increases Pepck2 levels that most likely affect glucose levels within 24 h (Fig. 3 B and C). A similar trend in gene expression in all tissues was observed in Hepatocyte nuclear factor 4, which is involved in glucose and lipid metabolism (Fig. 3B) (44). HLD50 shift leads to a decreasing trend in glycogen levels (SI Appendix, Fig. S3A), which may be due to glycogen’s role in supporting the high energy requirements of flight muscle. At D50, levels of trehalose are similar on H and L diets and shifts have no effect on trehalose levels (SI Appendix, Fig. S3B). At D20 the levels of proteins are the same on L and H diets regardless of shift. At D50, HL shift decreases protein levels consistent with findings that CR decreases protein synthesis (SI Appendix, Fig. S3C) (1, 6). The body weight of flies on H and L diets was the same at D20 before and after the shift (SI Appendix, Fig. S3D). At D50, the weight of the male flies was the same on a H and L diet before shift. This is consistent with a report that flies who were aging on the diet with equal ratio of yeast and sugar have similar weight, as well with a report that flies do not compensate for decreased nutrient content of the food by eating more (20, 45). LH shift had no effect on weight, but HL increased weight 2 and 5 d after the shift (SI Appendix, Fig. S3D).
Tissue-Specific Gene Trends Mediate Metabolic and Physiological Adaptation to Diet Shifts.
To identify pathways underlying metabolic/physiological adaptation in each tissue, we analyzed tissue-specific gene trends using the degPattern function from the “DEGreport” package (32).
Changes in heads associated with diet shifting are mediated by ten unique gene trends, the thorax by nine, and the abdomen by six (Fig. 4 A, C, and D). Adaptive response to available energy is orchestrated by key nutrient sensing pathways, which integrate inter-organ signals leading to changes in metabolism and behavior (1). In heads, dramatic metabolic changes associated with HL shift are reflected by decrease in longevity regulating pathway (group 8, Fig. 4 A and B). DAVID analysis of group 8 genes revealed a decreasing trend in the levels of members of the insulin/insulin-like growth factor signaling (IIS) family. Increased expression of several genes, including, Neuropeptide F receptor, Takeout, and Sodium/solute co-transporter-like 5A11 (SLC5A11) have been linked to behavioral changes associated with a sudden drop in energy such as hunger and food search, which may lead to increased weight in HL shifted flies (46). In contrast, LH shift is associated with a decrease in those pathways. A substantial number of DE genes in head are involved in ribosome and cytoplasmic translation. While expression of these genes changes slightly in HL shift, it increases dramatically in LH-shifted flies (Groups 6,8) (Fig. 4 A and B). Upregulation in KEGG pathways associated with transcriptional and translational activity was observed in heads and thoraces within 6 to 8 h following transfer of female flies from normal to DR at 40 d and was followed by downregulation of these pathways (28). It is possible that our HL shifted male flies also had an early higher peak, as observed in female flies (28). It is worth noting that our studies used different sex, age, diet, time, and type of analysis; however, both studies highlight the importance of upregulated and downregulated transcriptional and translational activity during adaptation to dietary shift (28).
Fig. 4.
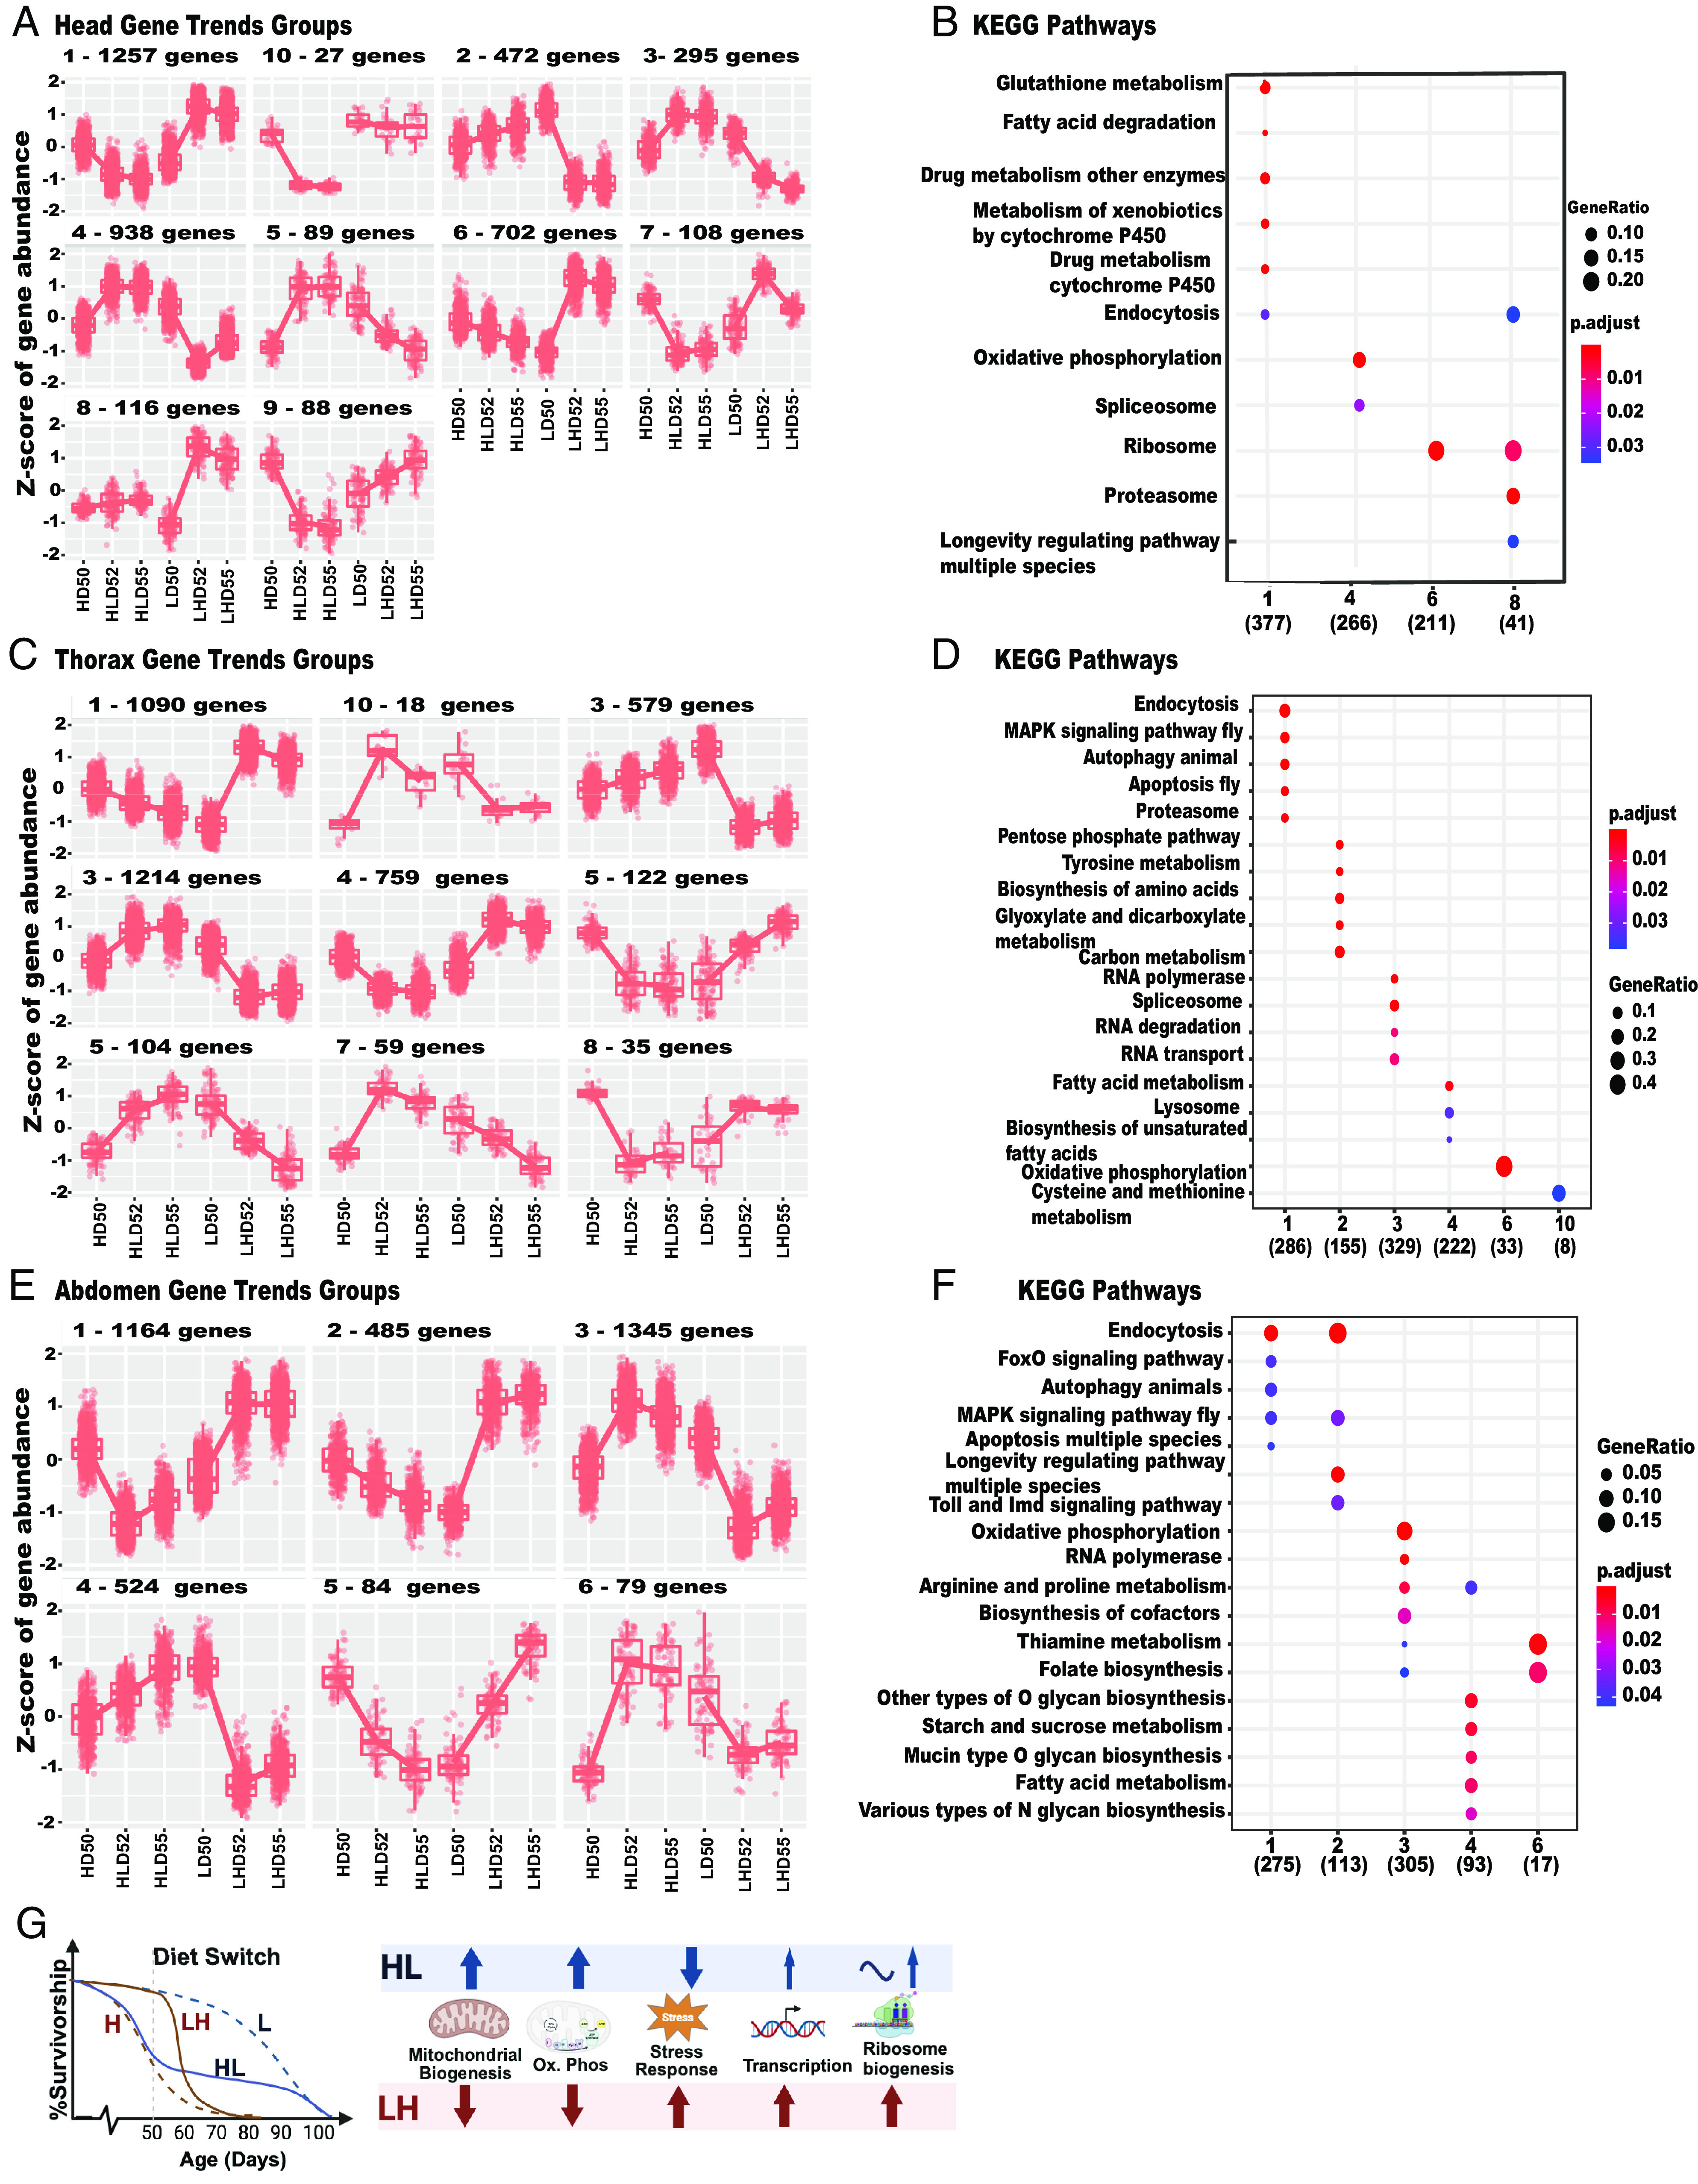
Tissue-specific and whole body physiological changes associated with diet switch late in life: (A) Head-specific ten DE gene trends groups associated with high (H) or low (L) diet on D50, or high to low (HL) or low to high (LH) shift on day two (D52) and five (D55) days after the HL (HLD52, HLD55) or LH (LHD52, LHD55) shift. (B) KEGG functional enrichment pathways of Head-specific gene trends group number described in A. (C) Thorax-specific nine DE gene trends groups associated with diet shifting described in A. (D) KEGG functional enrichment pathways of Thorax-specific gene trends group number described in C. (E) Abdomen-specific six DE gene trends groups associated with diet shifting described in A. (F) KEGG functional enrichment pathways of Abdomen-specific gene trends group number described in E. X axis: gene trend Group number with the number of DE genes in parentheses, which are associated with KEGG pathways marked on Y axis. (G) Male flies rapidly adapt their whole body physiology to late-life HL or LH shifts. Diet switch at D50 leads to longer lifespan in HL and shorter lifespan in LH-shifted flies. Physiological adaptation associated with shifts leads to increase (HL) or decrease (LH) in mitochondrial biogenesis, and oxidative phosphorylation, while an opposite trend is found in stress response. In response to LH shift, flies dramatically increase transcription and ribosome biogenesis, while a smaller increase is associated with HL shift.
HL shift is associated with a decrease in the glutathione metabolism and pathways involved with metabolism of xenobiotics by Cytochrome P450y, while an opposite trend is found in LH shift (Fig. 4 A and B). This trend is most likely associated with reduced ROS production coupled with CR. The brain, thorax, and abdomen adapt rapidly to decreases in available energy. HL shift increases and LH decreases DE genes in pathways associated with energy production, marked by enrichment of KEGG pathways such as oxidative phosphorylation in the head (group 4), thorax (group 6), and abdomen (group 3). Similarly, increased mitochondrial biogenesis is associated with HL, and downregulated in LH, and is associated with DE genes in heads (group 4) (Fig. 4A), the thorax (Fig. 4 C and D and SI Appendix, Fig. S4B), and abdomen (Fig. 4 E and F).
In the abdomen, upregulated pathways support growth reflected by enrichment of folate biosynthesis, RNA polymerase, and ribosome biogenesis. Some upregulated genes are known to stimulate proliferation of the germline stem cells including TGF-β signaling pathway (Smad), Notch, and Hippo signaling. Increased expression of Merlin (Mer) supports proliferation of germline and somatic cyst stem cells in Drosophila testis (47), and is consistent with H diet increasing proliferation of male germline and intestinal stem cells in female flies (48). The opposite is true of HL shifts, which decreases pathways related to growth like FoxO (groups 1,2,5) (Fig. 4 E and F and SI Appendix, Fig. S4C).
While diet shifts clearly affect metabolism in all tissues, there is a difference in the trend of DE genes associated with HL or LH shift. HL shift leads to an increase in oxidative phosphorylation genes within 2 d and stays upregulated in heads and abdomens. In the thorax, there is a linear increase or decrease in oxidative phosphorylation genes that occurs after HL and LH shift, respectively (Fig. 4 A, C, and D).
KEGG Pathways across All Samples.
Functional enrichment analysis across all tissues and time points show significant changes in the components of mitochondrial biogenesis, oxidative phosphorylation, stress response, and the signaling pathways that regulate metabolic homeostasis (Fig. 4G). KEGG pathways include longevity regulating pathway, endocytosis, ribosome, oxidative phosphorylation, metabolism, and drug metabolism (Fig. 4 B, F, and G).
Discussion
Obesity increases with age and enhances risk of age-related disorders. Human clinical studies revealed benefits of different temporal CR application such as mild intermittent fasting or specific timing of nutrient delivery as a treatment of human obese individuals (5, 7–12). This study confers an immediate and long-term beneficial impact of shifting male flies from H to L diet late in life. Our data show that HL shift immediately lowers fly mortality rate and short-term HR below that observed in flies on a constant L diet, which within a few days becomes the same as flies on a constant L diet. We suggest that this short-term lower HR results from adaptation of male flies aged on a H diet for 50 d to cope with high nutrient levels. This adaptation is characterized by increased investment in protection from ROS production, as supported by increased expression of glutathione genes in HD50 flies. Flies on a HSD have increased oxidative stress leading to increased expression of genes involved in ROS response (40). While HSD differs from our H diet in that it has high sugar and low protein content, and our H diet has equally high amount of sugar and protein, it similarly upregulates genes involved in stress response. Thus, flies on a H diet are overprotected after HL shift and also experience an immediate decrease in burden associated with a H diet. This is evidenced by the downregulation of the pathways related to redox status, oxidative stress, and detoxification within days after shift. Studies in rodents, non-human primates, and humans indicate that CR results in metabolic adaptation associated with less oxidative damage to DNA (2, 10). Furthermore, increased TAG levels in male flies aged on H diet could be potentially beneficial by providing energy in flies shifted to L diet. This is consistent with the work showing that best survival in mice subjected to CR was observed in mice that preserved their fat mass longer under CR suggesting that preservation of fat could have a protective role (49, 50).
In contrast, we found that a LH shift leads to an immediate increase in HR, which is transiently higher than in male flies on a constant H diet. Flies aged on L diet adjust their physiology by downregulating growth and produce low levels of ROS. When shifted to a H diet, there is a sudden increase in energy, which is immediately used for growth and energy storage. These processes result in high production of ROS, which flies aged on a L diet have not adapted to. Due to lifelong, low levels of ROS, flies experiencing a sudden burst in metabolic activity may be at higher risk of death at the onset of a H diet, as is supported by our data. The number of DE genes associated with an LH shift is considerably higher compared to an HL shift. Particularly striking is an increase in the glutathione family, cytochrome p450, ribosome biogenesis, genes involved in growth, proliferation, and IIS. Upregulation of genes involved in ribosome biogenesis and Cytochrome p450 was found in female heads reared on HSD (40, 51).
Transferring fully fed young female and male flies to a diet with 35% less yeast and sugar showed that age-specific mortality depends only on current diet and there are no effects of previous diet (18). A different group suggested that the increase in mortality observed in female flies after switch from CR to full-fed condition was a result of the cost associated with a nutrient-rich environment and hidden cost of DR (52). However, another report showed that female flies re-fed after being dietary restricted have increased reproduction post-switch resulting in similar lifelong egg production as fully fed females without effect on survival (22). Our experiments were designed to probe effects of late-life CR on male flies fed H diet and therefore differ from experiments where CR was applied to flies on a standard-diet- or AD fed rats or mice. However, our data suggest that in male flies, sudden exposure to extreme abundance of energy, its utilization, release of ROS, all lead to dramatic transcriptomic activity that is costly for male flies.
Flies preserve metabolic homeostasis by adapting their metabolism to available nutrients (44). The major metabolic change associated with HL shift is use of lipids instead of glucose as the major energy source. This is consistent with metabolic profiles of heads and thoraces of satiated and fasted flies, which show similar shift in energy utilization from glucose in satiated flies to ketone bodies generated from lipids in fasted flies (53). Our transcriptomic data support both increased FA synthesis and degradation resulting in ketone production that is used as an energy source. Similarly, CR in flies leads to both lipolysis, due to use of lipids as energy source, as well as lipogenesis, which is required to replenish TAG used as energy source (34). Mice exposed to CR have a brief period of increased FA synthesis in adipose tissue followed by a prolonged period of whole-body fat oxidation within a day. This metabolic adaptation balances increased FA oxidation and requirements to replenish lipid storage (54) and is mediated by a several fold increase in transcription of key enzymes FA synthase and acetyl-CoA carboxylase several hours after food uptake, which drops below levels observed in AD mice before feeding. Such a metabolic shift reduces ROS production and contributes to benefits of CR. We observed an increase in biological processes associated with FA metabolism such as very long-chain FA biosynthetic processes, membrane lipid metabolic processes, and FA elongation in thoraces and abdomens of HL-shifted flies. Integration of the transcriptional response and metabolic changes is key to further understanding the mechanism of metabolic adaptation associated with diet shifting and require further metabolome analysis.
Overall, our work describes benefits of HL shift of wild-type CS male flies at old age that could provide a framework to CR interventions in older humans and may counteract the detrimental effects of H diets even when initiated later in life. In contrast, sudden consumption of high calories has negative effects due to instant cost of growth and defense against ROS. As the incidence of metabolic syndrome increases with age, delineating age-dependent treatments and the potential of late-life CR application are vital. Studies in flies, mice, and non-human primates show that CR can benefit organismal health without affecting survival (4, 55, 56). Therefore, late-life diet shift in obese humans might have remarkable beneficial impact on health even if lifespan is not affected.
Materials and Methods
Fly Strains, Maintenance, and Diet.
The wild-type CS (Bloomington Stock Center, Stock #1) line was used in the study. All grandparents, parents, and experimental larvae were reared in cornmeal–sugar–yeast standard diet to avoid any developmental effects that different calorie content in the diet may have. In addition, the standard diet was used to avoid any effects of nutrient content of diet during larval development on adult fly physiology, adaptation to shift and survivorship. To avoid any effects of larval density on longevity, 10 virgin female and 9 male flies aged 4 to 10 d were crossed and passed to a new vial with corn media every 2 d starting with grandparents, and parents from which cross was set for F1 fly collections (24). F1 progeny for lifespan, transcriptome, and biochemistry studies were collected within 24 h following eclosion using CO2 and transferred to a vial at density of 25 male and 25 female flies per vial containing low (L) or high-calorie (H) diet. Flies were maintained in a humidified temperature-controlled environmental chamber at 25 °C (Percival Scientific) on a 12-h light:dark cycle. Standard laboratory corn media as well as food marked as L = 0.5 N and H = 3.0 N were used (24). The L and H food levels are standardized as 1.0 N being the food that has 100 g/L of sucrose, 100 g/L of brewer’s yeast, and 20 g/L of agar (21, 24). Detailed food preparation and maintenance are described in Supporting Information as well as in previous studies (21, 24).
Lifespan Studies.
Flies were collected and maintained as noted above. The number of flies in each survivorship study is listed in SI Appendix, Tables S1, S2, S4, and S5. Experiment 1: Two groups of CS flies were kept lifelong on a H or L, and three groups originally on L and three groups on H diets were shifted to opposite food at ages 20, 50, or 60 d. Flies were passed every day from day 1 and the number of dead flies was counted. Experiment 2: Two groups of CS flies aged their whole life on a H or L diets, and five groups that began on H from birth and were moved to L at either 10, 20, 30, 40, or 50 d. Five additional groups of flies were kept on L diet from birth and shifted from L to H at either 10, 20, 30, 40, or 50 d. They were passed every 2 d up to age 10 d and every day after that and the number of dead flies were counted.
Biochemistry.
CS flies were collected and aged on L or H diets as described above. At ages 20 and 50 d, subgroups of flies were transferred to the opposite diet. Flies kept their whole life on L or H were used for analysis at age 20 or 50 d. Groups of flies transferred to opposite diet at 20 d were used for analysis at ages 21, 22, and 25 d. Similarly, flies that were transferred at 50 d to the opposite diet were used for analysis at ages 51, 52, and 55 d. Detailed description is in SI Appendix. In brief: 3 biological replicates of 10 male flies, were used in each assay. Glucose was determined by using the Glucose Assay Kit (Sigma GAG020, PGO Sigma P7119). For glycogen, the procedures were the same as glucose except addition of Amyloglucosidase (Sigma 10115). Similarly, trehalose was determined using procedure the same as glucose with addition of trehalase (Trehalase from porcine kidney, Sigma T8778). Proteins were determined using Lowry and Folin & Ciocalteu’s reagent (Total Protein Kit, Micro Lowry, Peterson's Modification: Sigma TP0300). The TAG were determined using the Serum Triglyceride Determination Kit (Sigma TR0100; Glycerol Standard Solution Sigma G7793) (57).
RNA-Seq and Analysis.
For RNA-Seq experiments flies were collected and maintained as described above, and transferred to opposite diet at age 50 d. At ages 50 (before shift), 52 and 55 d (2 and 5 d after shift), the flies were separated by sex on CO2 and immediately frozen. Total RNA was isolated from dissected heads, thoraces, and abdomens of 3 biological replicates with more than 50 male flies in each replicate using Trizol as described (58). One µg of each RNA sample was used to prepare RNA-seq libraries with the Illumina Tru-Seq Stranded mRNA Library Preparation kit (cat # 20020594) with the IDT for Illumina TruSeq RNA UD Indexes set (cat # 20040871). The libraries were pooled and sequenced on one lane of a NovaSeq 6000 S4 flow cell generating 100bp paired-end reads yielding an average of 80 million reads per sample and a minimum of 20 million reads per replicate.
mRNA-Seq analysis.
The quality of the sequencing data was evaluated with FastQC (v0.11.9) and MultiQC (1.9). Sequence reads were mapped to the Drosophila genome (GSE97233) with STAR (version 2.71a) and the resulting BAM files were used to generate gene counts with featureCount using the uniq-counting mode. Analyses of sample relationship and differential expression were performed with DESeq2 (33). One sample, head LD50 (TLD50) biological sample (#39), had a notably high percentage of unmapped and unassigned reads and was therefore excluded from the downstream analysis. To identify specific pathways associated with diet shift, we performed functional enrichment analysis using the DAVID database. Pathway analysis and identification of networks associated with shifting flies were also carried out by Gene Ontology and the KEGG.
Statistical Analysis.
Biochemistry data from 20- and 50-d-old flies were analyzed separately using two-way ANOVA. Post-hoc analysis was conducted using Tukey’s test, correcting for multiple comparisons using GraphPad Prism 9.4.1. Results represent means ± SE of 3 biological replicates containing 30 flies per replicate. P: 0.033 (*), 0.002 (**), 0.0002 (***), <0.0001 (****). Longevity data were censored for early mortality (1 to 10 D) and analyzed by log-rank tests using the JMP16. program.
Supplementary Material
Appendix 01 (PDF)
Dataset S01 (XLSX)
Dataset S02 (XLSX)
Dataset S03 (XLSX)
Dataset S04 (XLSX)
Dataset S05 (XLSX)
Dataset S06 (CSV)
Dataset S07 (CSV)
Dataset S08 (CSV)
Dataset S09 (CSV)
Dataset S10 (CSV)
Dataset S11 (CSV)
Acknowledgments
We thank Geneva Hargis, Gordon Carmichael, Kavitha Kannan, and Stewart Frankel for their helpful comments and suggestions. Figs. 1A and 4G were prepared using BioRender. This work was supported by grants from the NIH: RO1AG059586, R01AG059586-03S1, R56AG082788, the University of Connecticut (UConn) Claude D. Pepper Older Americans Independence Center (P30-AG067988) to B.R.; U24 HG009889, and R35 GM118140 to B.R.G.; R01 NS106844 and R01 NS120556 to J.Y.H.L; T32HG010463 to B.J.H. Rogina is a recipient of a Glenn Award for Research in Biological Mechanisms of Aging.
Author contributions
M.L., J.Y.H.L., and B.R. designed research; M.L., J.M., K.M., D. Mishra, D. Martin, S.O., B.J.H., and B.R. performed research; M.L., J.M., K.M., D. Mishra, D. Martin, S.O., B.J.H., B.R.G., J.Y.H.L., and B.R. analyzed data; and M.L., K.M., D. Mishra, S.O., B.J.H., J.Y.H.L., and B.R. wrote the paper.
Competing interests
The authors declare no competing interest.
Footnotes
Preprint Server: bioRxiv: https://doi.org/10.1101/2023.05.11.540262.
This article is a PNAS Direct Submission.
Data, Materials, and Software Availability
All the bulk RNA-Seq data have been deposited at GEO and are publicly available as of the date of publication. https://dataview.ncbi.nlm.nih.gov/object/PRJNA924308?reviewer=ba1dirnarfd55lghrc9v7ob451 (59). Original codes used for data analysis are available through GitHub: https://github.com/JLiLab/Late--life-shift-in-caloric-intake (60).
Supporting Information
References
- 1.Longo V. D., Anderson R. M., Nutrition, longevity and disease: From molecular mechanisms to interventions. Cell 185, 1455–1470 (2022). [DOI] [PMC free article] [PubMed] [Google Scholar]
- 2.Di Francesco A., Di Germanio C., Bernier M., de Cabo R., A time to fast. Science 362, 770–775 (2018). [DOI] [PMC free article] [PubMed] [Google Scholar]
- 3.López-Lluch G., et al. , Calorie restriction induces mitochondrial biogenesis and bioenergetic efficiency. Proc. Natl. Acad. Sci. U.S.A. 103, 1768–1773 (2006). [DOI] [PMC free article] [PubMed] [Google Scholar]
- 4.Mattison J. A., et al. , Impact of caloric restriction on health and survival in rhesus monkeys from the NIA study. Nature 489, 318–321 (2012). [DOI] [PMC free article] [PubMed] [Google Scholar]
- 5.Chao A. M., Quigley K. M., Wadden T. A., Dietary interventions for obesity: Clinical and mechanistic findings. J. Clin. Invest. 131, e140065 (2021). [DOI] [PMC free article] [PubMed] [Google Scholar]
- 6.Wilson K. A., et al. , Evaluating the beneficial effects of dietary restrictions: A framework for precision nutrigeroscience. Cell Metab. 33, 2142–2173 (2021). [DOI] [PMC free article] [PubMed] [Google Scholar]
- 7.Panda S., Maier G., Villareal D. T., Targeting energy intake and circadian biology to engage mechanisms of aging in older adults with obesity: Calorie restriction and time-restricted eating. J. Gerontol. Ser. A 78, 79–85 (2023). [DOI] [PMC free article] [PubMed] [Google Scholar]
- 8.Ruddick-Collins L. C., et al. , Timing of daily calorie loading affects appetite and hunger responses without changes in energy metabolism in healthy subjects with obesity. Cell Metab. 34, 1472–1485.e6 (2022). [DOI] [PMC free article] [PubMed] [Google Scholar]
- 9.Dorling J. L., Martin C. K., Redman L. M., Calorie restriction for enhanced longevity: The role of novel dietary strategies in the present obesogenic environment. Ageing Res. Rev. 64, 101038 (2020). [DOI] [PMC free article] [PubMed] [Google Scholar]
- 10.Redman L. M., et al. , Metabolic slowing and reduced oxidative damage with sustained caloric restriction support the rate of living and oxidative damage theories of aging. Cell Metab. 27, 805–815.e4 (2018). [DOI] [PMC free article] [PubMed] [Google Scholar]
- 11.Kraus W. E., et al. , 2 years of calorie restriction and cardiometabolic risk (CALERIE): Exploratory outcomes of a multicentre, phase 2, randomised controlled trial. Lancet Diabetes Endocrinol. 7, 673–683 (2019). [DOI] [PMC free article] [PubMed] [Google Scholar]
- 12.Patikorn C., et al. , Intermittent fasting and obesity-related health outcomes: An umbrella review of meta-analyses of randomized clinical trials. JAMA Netw. Open 4, e2139558 (2021). [DOI] [PMC free article] [PubMed] [Google Scholar]
- 13.Dhahbi J. M., Kim H.-J., Mote P. L., Beaver R. J., Spindler S. R., Temporal linkage between the phenotypic and genomic responses to caloric restriction. Proc. Natl. Acad. Sci. U.S.A. 101, 5524–5529 (2004). [DOI] [PMC free article] [PubMed] [Google Scholar]
- 14.Hahn O., et al. , A nutritional memory effect counteracts the benefits of dietary restriction in old mice. Nat. Metab. 1, 1059–1073 (2019). [DOI] [PMC free article] [PubMed] [Google Scholar]
- 15.Forster M. J., Morris P., Sohal R. S., Genotype and age influence the effect of caloric intake on mortality in mice. FASEB J. 17, 690–692 (2003). [DOI] [PMC free article] [PubMed] [Google Scholar]
- 16.Koyama T., Texada M. J., Halberg K. A., Rewitz K., Metabolism and growth adaptation to environmental conditions in Drosophila. Cell. Mol. Life Sci. 77, 4523–4551 (2020). [DOI] [PMC free article] [PubMed] [Google Scholar]
- 17.Bross T. G., Rogina B., Helfand S. L., Behavioral, physical, and demographic changes in Drosophila populations through dietary restriction. Aging Cell 4, 309–317 (2005). [DOI] [PubMed] [Google Scholar]
- 18.Mair W., Demography of dietary restriction and death in Drosophila. Science 301, 1731–1733 (2003). [DOI] [PubMed] [Google Scholar]
- 19.Pletcher S. D., et al. , Genome-wide transcript profiles in aging and calorically restricted Drosophila melanogaster. Curr. Biol. 12, 712–723 (2002). [DOI] [PubMed] [Google Scholar]
- 20.Skorupa D. A., Dervisefendic A., Zwiener J., Pletcher S. D., Dietary composition specifies consumption, obesity, and lifespan in Drosophila melanogaster. Aging Cell 7, 478–490 (2008). [DOI] [PMC free article] [PubMed] [Google Scholar]
- 21.Chapman T., Partridge L., Female fitness in Drosophila melanogaster: An interaction between the effect of nutrition and of encounter rate with males. Proc. Biol. Sci. 263, 755–759 (1996). [DOI] [PubMed] [Google Scholar]
- 22.Sultanova Z., Ivimey-Cook E. R., Chapman T., Maklakov A. A., Fitness benefits of dietary restriction. Proc. R. Soc. B Biol. Sci. 288, 20211787 (2021). [DOI] [PMC free article] [PubMed] [Google Scholar]
- 23.Pletcher S. D., Libert S., Skorupa D., Flies and their golden apples: The effect of dietary restriction on Drosophila aging and age-dependent gene expression. Ageing Res. Rev. 4, 451–480 (2005). [DOI] [PubMed] [Google Scholar]
- 24.Woods J. K., Kowalski S., Rogina B., Determination of the spontaneous locomotor activity in Drosophila melanogaster. J. Vis. Exp. 51449 (2014), 10.3791/51449. [DOI] [PMC free article] [PubMed] [Google Scholar]
- 25.Parashar V., Rogina B., dSir2 mediates the increased spontaneous physical activity in flies on calorie restriction. Aging 1, 529–541 (2009). [DOI] [PMC free article] [PubMed] [Google Scholar]
- 26.Ulgherait M., et al. , Circadian autophagy drives iTRF-mediated longevity. Nature 598, 353–358 (2021). [DOI] [PMC free article] [PubMed] [Google Scholar]
- 27.Whitaker R., et al. , Dietary switch reveals fast coordinated gene expression changes in Drosophila melanogaster. Aging 6, 355–368 (2014). [DOI] [PMC free article] [PubMed] [Google Scholar]
- 28.Ding F., et al. , Transcriptional response to dietary restriction in Drosophila melanogaster. J. Insect Physiol. 69, 101–106 (2014). [DOI] [PMC free article] [PubMed] [Google Scholar]
- 29.Musselman L. P., Kühnlein R. P., Drosophila as a model to study obesity and metabolic disease. J. Exp. Biol. 221, jeb163881 (2018). [DOI] [PubMed] [Google Scholar]
- 30.Gáliková M., Klepsatel P., Obesity and aging in the Drosophila model. Int. J. Mol. Sci. 19, 1896 (2018). [DOI] [PMC free article] [PubMed] [Google Scholar]
- 31.McCracken A. W., Adams G., Hartshorne L., Tatar M., Simons M. J. P., The hidden costs of dietary restriction: Implications for its evolutionary and mechanistic origins. Sci. Adv. 6, eaay3047 (2020). [DOI] [PMC free article] [PubMed] [Google Scholar]
- 32.Lorena Pantano C., Aut, DEGreport (2017). 10.18129/B9.BIOC.DEGREPORT. Accessed 21 December 2022. [DOI]
- 33.Love M. I., Huber W., Anders S., Moderated estimation of fold change and dispersion for RNA-seq data with DESeq2. Genome Biol. 15, 550 (2014). [DOI] [PMC free article] [PubMed] [Google Scholar]
- 34.Katewa S. D., et al. , Intramyocellular fatty-acid metabolism plays a critical role in mediating responses to dietary restriction in Drosophila melanogaster. Cell Metab. 16, 97–103 (2012). [DOI] [PMC free article] [PubMed] [Google Scholar]
- 35.Silva B., et al. , Glia fuel neurons with locally synthesized ketone bodies to sustain memory under starvation. Nat. Metab. 4, 213–224 (2022). [DOI] [PMC free article] [PubMed] [Google Scholar]
- 36.Hahn O., et al. , Dietary restriction protects from age-associated DNA methylation and induces epigenetic reprogramming of lipid metabolism. Genome Biol. 18, 56 (2017). [DOI] [PMC free article] [PubMed] [Google Scholar]
- 37.E. Ng’oma, P. A. Williams-Simon, A. Rahman, E. G. King, Diverse biological processes coordinate the transcriptional response to nutritional changes in a Drosophila melanogaster multiparent population. BMC Genom. 21, 84 (2020). [DOI] [PMC free article] [PubMed] [Google Scholar]
- 38.Aon M. A., et al. , Untangling determinants of enhanced health and lifespan through a multi-omics approach in mice. Cell Metab. 32, 100–116.e4 (2020). [DOI] [PMC free article] [PubMed] [Google Scholar]
- 39.Wilfling F., et al. , Triacylglycerol synthesis enzymes mediate lipid droplet growth by relocalizing from the ER to lipid droplets. Dev. Cell 24, 384–399 (2013). [DOI] [PMC free article] [PubMed] [Google Scholar]
- 40.Eickelberg V., Lüersen K., Staats S., Rimbach G., Phenotyping of Drosophila Melanogaster-A nutritional perspective. Biomolecules 12, 221 (2022). [DOI] [PMC free article] [PubMed] [Google Scholar]
- 41.Hood S. E., et al. , Nuclear translocation ability of Lipin differentially affects gene expression and survival in fed and fasting Drosophila. J. Lipid Res. 61, 1720–1732 (2020). [DOI] [PMC free article] [PubMed] [Google Scholar]
- 42.Hänschke L., et al. , Drosophila lipase 3 mediates the metabolic response to starvation and aging. Front. Aging 3, 800153 (2022). [DOI] [PMC free article] [PubMed] [Google Scholar]
- 43.Grönke S., et al. , Brummer lipase is an evolutionary conserved fat storage regulator in Drosophila. Cell Metab. 1, 323–330 (2005). [DOI] [PubMed] [Google Scholar]
- 44.Chatterjee N., Perrimon N., What fuels the fly: Energy metabolism in Drosophila and its application to the study of obesity and diabetes. Sci. Adv. 7, eabg4336 (2021). [DOI] [PMC free article] [PubMed] [Google Scholar]
- 45.Mair W., Piper M. D. W., Partridge L., Calories do not explain extension of life span by dietary restriction in Drosophila. PLoS Biol. 3, e223 (2005). [DOI] [PMC free article] [PubMed] [Google Scholar]
- 46.Park J.-Y., et al. , Drosophila SLC5A11 mediates hunger by regulating K+ channel activity. Curr. Biol. 26, 1965–1974 (2016). [DOI] [PMC free article] [PubMed] [Google Scholar]
- 47.Inaba M., Sorenson D. R., Kortus M., Salzmann V., Yamashita Y. M., Merlin is required for coordinating proliferation of two stem cell lineages in the Drosophila testis. Sci. Rep. 7, 2502 (2017). [DOI] [PMC free article] [PubMed] [Google Scholar]
- 48.McLeod C. J., Wang L., Wong C., Jones D. L., Stem cell dynamics in response to nutrient availability. Curr. Biol. CB 20, 2100–2105 (2010). [DOI] [PMC free article] [PubMed] [Google Scholar]
- 49.Mitchell S. J., et al. , Effects of sex, strain, and energy intake on hallmarks of aging in mice. Cell Metab. 23, 1093–1112 (2016). [DOI] [PMC free article] [PubMed] [Google Scholar]
- 50.Liao C.-Y., Rikke B. A., Johnson T. E., Diaz V., Nelson J. F., Genetic variation in the murine lifespan response to dietary restriction: From life extension to life shortening. Aging Cell 9, 92–95 (2010). [DOI] [PMC free article] [PubMed] [Google Scholar]
- 51.Hemphill W., Rivera O., Talbert M., RNA-sequencing of Drosophila melanogaster head tissue on high-sugar and high-fat diets. G3 (Bethesda) 8, 279–290 (2018). [DOI] [PMC free article] [PubMed] [Google Scholar]
- 52.McCracken A. W., Buckle E., Simons M. J. P., The relationship between longevity and diet is genotype dependent and sensitive to desiccation in Drosophila melanogaster. J. Exp. Biol. 223, jeb230185 (2020). [DOI] [PMC free article] [PubMed] [Google Scholar]
- 53.Wilinski D., et al. , Rapid metabolic shifts occur during the transition between hunger and satiety in Drosophila melanogaster. Nat. Commun. 10, 4052 (2019). [DOI] [PMC free article] [PubMed] [Google Scholar]
- 54.Bruss M. D., Khambatta C. F., Ruby M. A., Aggarwal I., Hellerstein M. K., Calorie restriction increases fatty acid synthesis and whole body fat oxidation rates. Endocrinol. Metab. 298, 9 (2010). [DOI] [PMC free article] [PubMed] [Google Scholar]
- 55.Mitchell S. J., et al. , Daily fasting improves health and survival in male mice independent of diet composition and calories. Cell Metab. 29, 221–228.e3 (2019). [DOI] [PMC free article] [PubMed] [Google Scholar]
- 56.Colman R. J., et al. , Caloric restriction reduces age-related and all-cause mortality in rhesus monkeys. Nat. Commun. 5, 3557 (2014). [DOI] [PMC free article] [PubMed] [Google Scholar]
- 57.Woods J. K., Ziafazeli T., Rogina B., Rpd3 interacts with insulin signaling in Drosophila longevity extension. Aging 8, 3028–3044 (2016). [DOI] [PMC free article] [PubMed] [Google Scholar]
- 58.Rogers R. P., Rogina B., Increased mitochondrial biogenesis preserves intestinal stem cell homeostasis and contributes to longevity in Indy mutant flies. Aging 6, 335–350 (2014). [DOI] [PMC free article] [PubMed] [Google Scholar]
- 59.Li M., et al. , PRJNA924308 Late-life shift in caloric intake affects longevity and metabolism. National Library of Medicine. https://dataview.ncbi.nlm.nih.gov/object/PRJNA924308?reviewer=ba1dirnarfd55lghrc9v7ob451. Deposited 16 January 2023.
- 60.Li M., et al. , JLiLab/Late--life-shift-in-caloric-intake. GitHub. https://github.com/JLiLab/Late--life-shift-in-caloric-intake. Deposited 12 September 2023.
Associated Data
This section collects any data citations, data availability statements, or supplementary materials included in this article.
Supplementary Materials
Appendix 01 (PDF)
Dataset S01 (XLSX)
Dataset S02 (XLSX)
Dataset S03 (XLSX)
Dataset S04 (XLSX)
Dataset S05 (XLSX)
Dataset S06 (CSV)
Dataset S07 (CSV)
Dataset S08 (CSV)
Dataset S09 (CSV)
Dataset S10 (CSV)
Dataset S11 (CSV)
Data Availability Statement
All the bulk RNA-Seq data have been deposited at GEO and are publicly available as of the date of publication. https://dataview.ncbi.nlm.nih.gov/object/PRJNA924308?reviewer=ba1dirnarfd55lghrc9v7ob451 (59). Original codes used for data analysis are available through GitHub: https://github.com/JLiLab/Late--life-shift-in-caloric-intake (60).