

Abstract
Depressive disorders are among the leading causes of global disease burden, but there has been limited progress in understanding the causes and treatments for these disorders. In this Perspective, we suggest that such progress crucially depends on our ability to measure depression. We review the many problems with depression measurement, including limited evidence of validity and reliability. These issues raise grave concerns about common uses of depression measures, such as diagnosis or tracking treatment progress. We argue that shortcomings arise because depression measurement rests on shaky methodological and theoretical foundations. Moving forward, we need to break with the field’s tradition that has, for decades, divorced theories about depression from how we measure it. Instead, we suggest that epistemic iteration, an iterative exchange between theory and measurement, provides a crucial avenue for depression measurement to progress.
Introduction
Major Depressive Disorder (MDD)—a prevalent, debilitating, and often recurrent mental disorder of episodic nature—is one of the most frequently measured constructs in the scientific literature. More than 280 measures of this mental health condition have appeared in the literature in the past century.1 These include three scales which are among the 100 most cited papers across all fields of science:2 the Hamilton Rating Scale for Depression (HRSD)3, the Beck Depression Inventory (BDI)4, and the Centre for Epidemiological Studies Depression Scale (CES-D).5 These papers have a combined 81,000 citations since 1960 (see Supplementary Figure 1 and Supplementary Note 1); according to Web of Science, each has been cited in more than 140 distinct disciplines. Papers introducing abbreviated, translated, and adapted versions of these scales contribute thousands more citations.
With so much empirical research on depression, one would expect there to have been considerable advances in understanding depression and the ability to treat it. Unfortunately, progress has been limited. The prevalence rate and global disease burden of MDD have not decreased over the past 3 decades.6 Despite sizeable efforts, researchers have been unable to identify actionable biomarkers for MDD that explain sufficient variance in diagnosis to be useful in clinical settings.7,8 Further, efficacies of both psychological and pharmacological treatments remain limited.9,10
In this Perspective, we take the position that progress in understanding, predicting, and treating depression crucially depends on the ability to measure it. We first provide a brief history of depression measurement. Next, we describe the many problems with depression measurement, including limited evidence of validity and reliability. We argue that these problems arise because the measurement of depression rests on shaky methodological and theoretical foundations. We conclude by offering ideas for moving methodological and theoretical aspects of depression measurement into the 21st century.
A brief history
In the middle of the 20th century, psychoanalytic theory and practice dominated psychiatry.11,12 Diagnoses were defined by narrative descriptions and assessed by unstructured interviews, leaving considerable room for subjectivity.13 Perhaps not surprisingly, the agreement of two psychiatrists on whether a patient had a given mental disorder was barely above chance.14,15
During the 1960s and 1970s, there was a concerted effort to increase diagnostic reliability by developing diagnostic criteria sets: lists of readily observable or reportable experiences with explicit algorithms for determining the presence or absence of a disorder based on these signs and symptoms.16 This effort culminated in 1980 with the third edition of the Diagnostic and Statistical Manual (DSM-III), American psychiatry’s authoritative publication on the diagnosis of mental disorders.17 DSM-III leaned heavily on recently developed criteria sets and aimed to be theoretically agnostic, focusing on symptoms rather than etiology or underlying mechanisms.
In this context, the most commonly used depression scales such as HRSD, BDI and CES-D were developed and began to take hold in the field. Diagnostic interviews (for example, based on DSM criteria) aim to determine the presence or absence of MDD. By contrast, scales such as HRSD, BDI and CES-D were developed to assess the severity of current depressive symptoms, with scores above a certain threshold indicating potential MDD. The various depression scales that arose during this era differ in several ways, including the number and nature of assessed symptoms and mode of assessment; for example, BDI and CES-D are self-rated, whereas HRSD is observer-rated. However, they share a common approach: measuring depression severity by adding together the symptoms of depression, such as depressed mood, sleep problems, and suicidal ideation. This approach based on symptoms and sum-scores is identical in virtually all of the depression instruments that have appeared in the literature, including self-report and observer-rated scales as well as clinician-rated diagnostic criteria.1,18
In the decades since this shift toward diagnostic criteria and standardized scales, depression research has thrived, but the measurement of depression has remained strikingly unchanged. Since the HRSD was published over half a century ago, scientists put a man on the Moon, invented the internet, and created powerful computers small enough to fit in people’s pockets. Yet, the HRSD remains the gold-standard scale for depression, used in over 90% of antidepressant trials.19 Given the enormous amount of depression research and the substantial gains made in psychological measurement practices in the last few decades, it is worth taking stock of depression measurement. We focus our investigation on the most important aspects of validity and reliability. These and other key terms are defined in Box 1.
Box 1. Key terms and definitions.
Alpha (coefficient alpha, Cronbach’s alpha):
Internal consistency is often summarized with coefficient alpha. Alpha ranges from 0–1, with higher numbers indicating more consistency. Alpha does not provide information about scale validity, and is often not appropriate for depression instruments due to strict assumptions that are rarely met.147
Depression instrument:
A depression instrument is a measure of depression. Common instruments include self-rated and observer-rated scales typically used to assess depression severity, and structured or semi-structured clinical interviews typically used to assess the presence of Major Depressive Disorder.
Depression scale:
A depression scale is a particular type of instrument to measure depression severity. Depression scales can be self-rated or observer-rated. These scales typically include a list of depression symptoms rated on a brief ordinal scale indicating frequency (how common is a symptom), intensity (how severe is a symptom), relativity (compared to usual, how is the symptom expression), or a mix of the above.
Diagnostic interview:
A diagnostic interview is a particular type of instrument to measure the presence of Major Depressive Disorder. Diagnostic interviews are usually structured or semi-structured. They typically include a list of depression symptoms coded as present or absent, and a question about impairment of functioning. A specific algorithm determines presence of the disorder.
Dimensionality:
A unidimensional instrument is one that can aptly describe or summarize the relations among items of a construct with only one score (that is, one dimension, factor, or component). It is defensible to add up all items to one total score, which reflects the single dimension, in such scales. Depression instruments are often multidimensional, meaning that more than one score is required to describe the relations among items adequately.
Inter-rater reliability:
In the context of depression measurement, inter-rater reliability is the degree to which independent observers (usually two) agree on whether a person should receive a diagnosis of Major Depressive Disorder or not.
Internal consistency:
Internal consistency quantifies how consistent responses to items on a scale are. A scale is internally consistent if all its items produce similar scores.
Measurement invariance:
If an instrument measures the same construct in the same way across populations or time, it has the psychometric property of measurement invariance. This property is necessary to compare scores across populations or time.
Kappa coefficient:
Inter-rater reliability is commonly assessed using the kappa coefficient, which ranges from 0–1. Higher numbers indicate more agreement.
Reliability:
Reliability or precision denotes the consistency of scores across instances of the testing procedure, such as raters, time, items, and context. Reliability is necessary but not sufficient for validity.
Response process:
The response process denotes the cognitive processes engaged in by people using an instrument. In depression research, these people can be the participants filling out self-rated instruments or being interviewed; observers scoring observer-rated scales; or clinicians administering an interview.
Test score:
The test score is the resulting score from depression instruments, usually a continuous sum-score indicating depression severity, or a categorical score with two groups, healthy versus depressed.
Validity:
As defined by the Standards of Educational and Psychological Testing,25 validity “…refers to the degree to which evidence and theory support the interpretations of test scores for proposed uses of tests […]. The process of validation involves accumulating relevant evidence to provide a sound scientific basis for the proposed score interpretations.”
Validity and reliability
The most fundamental question for any measure concerns its validity: does it measure what it purports to measure?20 This question turns out to be difficult to answer, and there are many theoretical and methodological frameworks for evaluating validity.16,21–24 Here, we adopt the perspective taken by the Standards for Educational and Psychological Testing and consider validity to be the degree to which the evidence supports the interpretation and use of a test score for a specific purpose.25 Examples of such purposes include using DSM-5 criteria to diagnose a person with an episode of MDD or using the BDI to track treatment progress over time. Validation entails accumulating evidence to form a sound scientific basis for using instruments for these purposes.
We will consider three sources of evidence for validity—content, internal structure, and response processes—and will evaluate whether the evidence supports common uses of depression instruments. These three sources do not represent distinct types of validity; instead, they together support the intended interpretation of scores for a given use.25 We also discuss reliability—the consistency of instruments across raters, contexts, and time. Reliability does not provide evidence of validity, given that a score can be consistent but not hold the intended interpretation. Reliability is therefore necessary, but not sufficient, for validity.
Content
One source of evidence for the valid use of depression instruments is its content. A valid score must reflect all of the content needed to describe a construct, avoiding construct under-representation (omitting important content) and construct contamination (including construct-irrelevant content).26 Evidence of adequate content is critical for many uses of depression instruments, such as communication: If a diagnosed patient is referred from one therapist to another, the diagnosis is only useful to the new therapist if the instrument used for diagnosis actually captures content relevant to depression. Appropriate content coverage is also required for many other purposes, such as accurately determining whether treatment is needed or progressing well.
The development of diagnostic criteria sets and scales in the middle of the 20th century provided significant clarity about the content being assessed relative to earlier unstructured interviews. Accordingly, these instruments supported clearer communication and provided standard criteria for determining the need for treatment. However, there is a surprising level of disagreement about the content depression measures ought to assess. A review of seven commonly used scales for depression,18,27 including CES-D, BDI, and HRSD, found that they contain 52 disparate symptoms, 40% of which appear in only one of the scales. The CES-D—the most used depression scale in history (see Supplementary Figure 1)—has the lowest mean overlap with other scales (Jaccard similarity index of 31%), with half of all CES-D items not appearing in any of the six other scales. Content overlap between common scales and DSM-5 criteria for MDD is only moderate (Figure 1).
Figure 1. Co-occurrence of 52 depression symptoms across 7 depression rating scales.
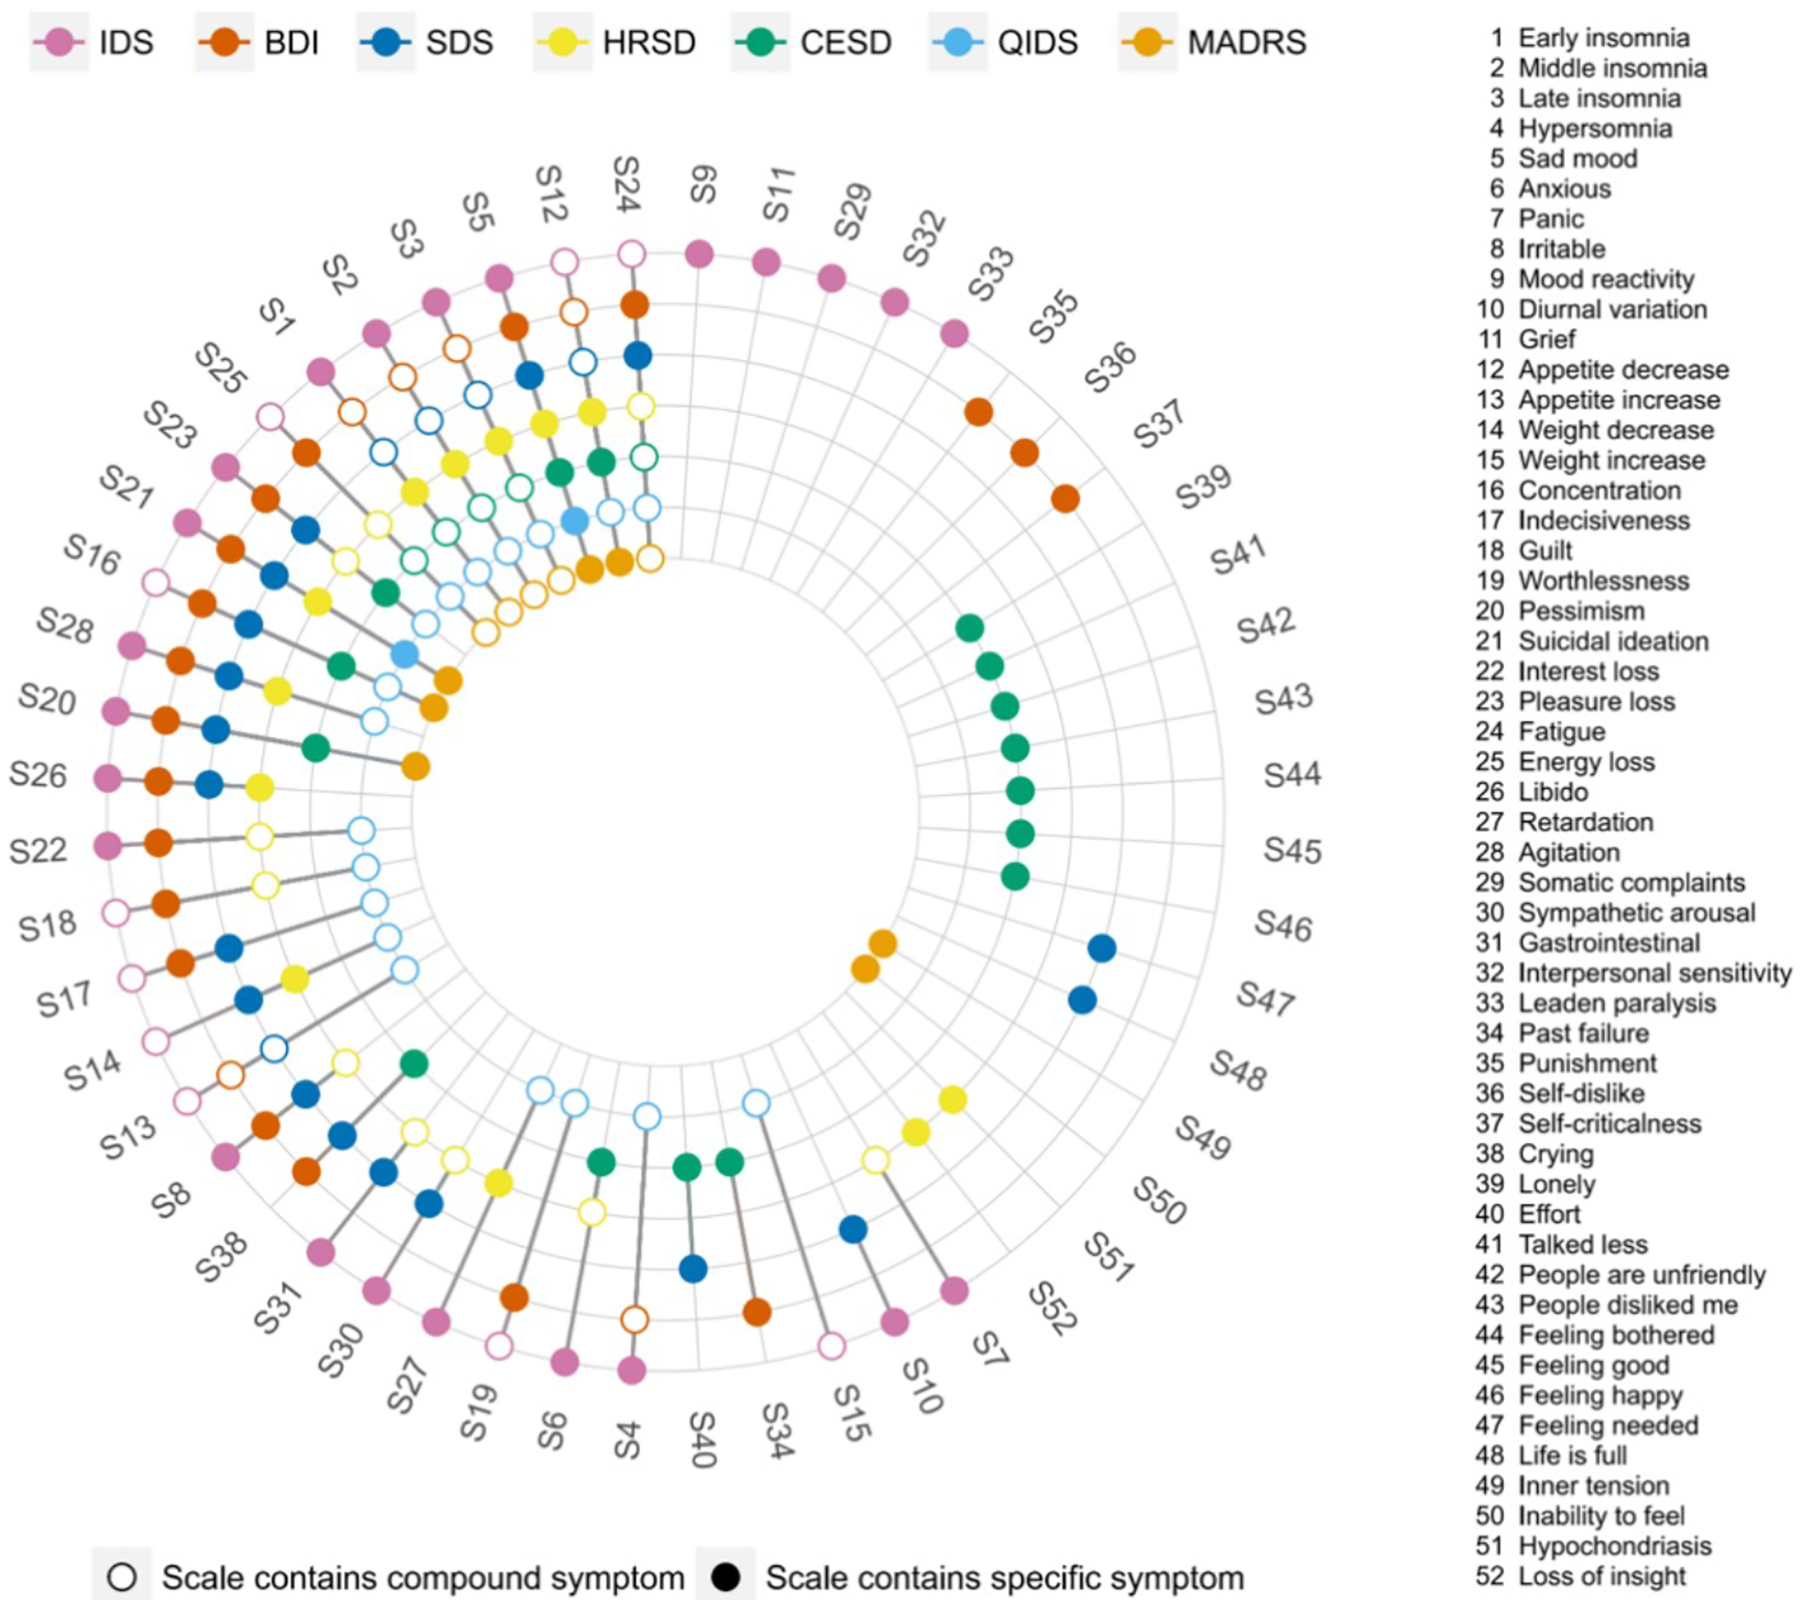
Colored circles for a symptom indicate that a scale directly assesses that symptom, whereas empty circles indicate that a scale indirectly measures a symptom. For instance, IDS assesses item 4 ‘hypersomnia’ directly; BDI measures ‘hypersomnia’ indirectly via a general question on sleep problems; and SDS does not capture ‘hypersomnia’ at all. Note that the 9 QIDS items analyzed correspond to the DSM-5 criterion symptoms for MDD. IDS: Inventory of Depressive Symptoms80; BDI-II: Beck Depression Inventory119; SDS: Zung Self-Rating Depression Scale145; HRSD: Hamilton Rating Scale for Depression3; CES-D: Center of Epidemiological Studies Depression Scale5; QIDS: Quick Inventory of Depressive Symptoms81; MADRS: Montgomery-Åsberg Depression Rating Scale35. Figure reprinted with permission from Fried et al. 201718
If the 52 distinct symptoms are considered to reflect the full breadth of the depression construct for diagnosing, monitoring, and studying depression, no one scale can be said to have adequate content converage.25 And the seven scales mentioned above are just a small minority: Over 280 instruments have been developed to assess depression,1 and a recent review of 30 clinical trials in adolescents found 19 different primary outcome measures for depression.28 Additionally, there is evidence that none of these scales assess important features of depression. In a recent study of over 3,000 patients, informal caregivers, and healthcare professionals from 52 countries, mental pain was commonly mentioned as an important feature of depression;29 but common depression scales do not include this experience.18
Scales therefore seem to measure different ‘depressions’. This conclusion is supported by different content and the fact that correlations among scales are often only around 0.5 (and regularly much lower).30–33 Small to moderate correlations are not surprising, as depression instruments were constructed absent a unifying theory and by scholars working in distinct settings and towards distinct goals. The HRSD was developed for severely depressed inpatients who were already diagnosed and relies heavily on clinical, observable signs such as weight loss and slowing of speech rather than self-reported symptoms. The BDI focuses on cognitive and affective symptoms, such as worthlessness and pessimism, central to Beck’s theory of depression.34 The CES-D was developed for depression screening in general population settings and captures problems such as feeling bothered or lonely that are more common in non-clinical settings than BDI or HRSD symptoms. Items on the Montgomery-Åsberg Depression Rating Scale (MADRS)35 were selected because they were found to change during treatment, providing a scale sensitive to change.35
Despite these key differences in content, scales such as BDI, HRSD, and MADRS are used interchangeably to, for example, track treatment progress in clinical trials. Clinical trials usually report how many patients respond to and remit during treatment. However, there are systematic differences in the measurement of pharmacological interventions (mostly observer-rated; HRSD and MADRS most common) versus behavioral interventions (mostly self-rated; Patient Health Questionnaire (PHQ-9) most common).36 Comparing treatments based on different measures is problematic due to content differences and because observer-rated scales result in larger pre-post treatment effect sizes than self-report scales.36 Different treatments are thus confounded with different types of measurement, biasing their comparison.
Another problem of interchangeable use is when scales are used to diagnose participants. The PHQ-9 developers, for instance, encourage doing so,37 despite evidence that scales like the PHQ-9 produce substantially higher rates of MDD diagnosis compared to clinical interviews.36,38 Important decisions about whether people are diagnosed with MDD, enrolled into a clinical trial, or considered remitted after treatment depend to a considerable degree on the instruments used by researchers and clinicians. This state of affairs leaves much to be desired.
Response processes
A second important source of validity evidence is the response processes when people complete a measure. A score is valid when people respond to an instrument in a way that corresponds to the construct being assessed.39 For example, when developing a test of mathematical reasoning, questions should not be so rote as to render the test a measure of one’s memory for facts, or so verbose as to render the test a measure of reading comprehension.
There is very little research on the processes engaged when people score self-rated or observer-rated depression instruments, but there is reason to think they influence depression measurement. Generally, scores on self-reported depression scales tend to differ from those on observer-rated instruments: studies based on observer ratings find greater efficacy of depression treatments than studies relying on self-report31,36, and self-reported symptoms tend to be more severe than observer ratings.38,40 These differences may be due to different response processes. Clinicians may not score some symptoms endorsed in self-report scales if these symptoms can be attributed to external causes. For example, a single parent getting little sleep due to a newborn may endorse sleep problems in a self-report scale, but a clinician may not score that as a depression symptom in a diagnostic interview, leading to differences in scores. Alternatively, it might be that participants report more honestly in self-rated instruments and are less candid in clinical interviews.41,42 Or differences might arise because observers are vulnerable to certain kinds of cognitive biases, including overconfidence bias (overestimating one’s knowledge and therefore acting without sufficient information), confirmation bias (selectively engaging with confirming rather than refuting evidence), attribution error (when a serious medical condition is misdiagnosed as psychiatric diagnosis), or diagnosis momentum (even if a diagnosis is erroneously attached to a patient, it tends to stick).43
Although the DSM-5 is explicitly atheoretical, clinical judgements are made within the context of implicit and explicit conceptual frameworks, which influence response and measurement processes.44 A 2007 survey showed that clinicians are acutely aware that these frameworks contribute to clinical decision-making: 86% of participating clinicians stated that psychiatric diagnoses are unreliable. When asked about the reasons for this lack of reliability, clinician-related factors such as differences in training, biases, and interview style were the most common explanations for discrepancies between raters (63.5%), rather than patient characteristics (21.6%) or nosological issues (14.9%).45
Overall, we know very little about how participants or observers interpret items or select responses on depression instruments. Differences in response processes could explain consistent differences between scale types (such as self-report versus observer-report), but this is an area that urgently needs more research.
Internal structure
The third source of validity evidence comes from an instrument’s internal structure: the extent to which the relationships among test items are consistent with one’s theory about the construct being assessed.39 Unfortunately, efforts to evaluate whether the relationships among depression symptoms are consistent with theoretical expectations face an immediate challenge: such expectations are often unclear. The measurement of depression has developed largely independently from theories. The DSM, which is explicitly atheoretical, is one of many examples.
However, many tacit theoretical assumptions about the nature of depression are evident in clinical and research practices. Accordingly, whether an instrument’s internal structure conforms to expectations can be evaluated based on assumptions that underlie how this instrument is used. We discuss assumptions of taxonicity, dimensionality, measurement invariance, and inter-rater reliability.
Taxonicity
Researchers and clinicians use instruments to separate people with MDD from people without MDD, implying a belief that depression is taxonic (that is, categorical) in nature. In the DSM-5, MDD is diagnosed if participants meet 5 of 9 symptom criteria, for two weeks, along with significant impairment of functioning.46 Similarly, on the HRSD, BDI, and CES-D, researchers commonly sum all items and use thresholds to determine the presence of MDD.36 However, there is considerable evidence that depression is not categorical, but rather exists on a continuum from healthy to severely depressed.47–50 If MDD were categorical, one would expect an area of the distribution of depression severity with relatively few individuals—a zone of rarity—that divides those with and without depression (Figure 2a). However, this is not present in observed data (Figure 2b and 2c).
Figure 2. Expected and empirical distributions of depressive symptoms.

a) Expected distributions if a disorder is categorical, featuring a ‘zone of rarity’ between cases and controls. Such distributions are not observed in depression data. b) Empirical distribution of depressive symptoms in an online sample, n=12613, based on the 14-item depression subscale of the Depression Anxiety Stress Scale (DASS-42);146 due to the nature of an online convenience dataset, depression scores are considerably higher than those in representative samples. c) Empirical distribution of depressive symptoms from an individual participant data meta-analysis consisting of 54 data sets with n=12613, based on the 9-item Patient Health Questionnaire (PHQ-9).37 See Supplementary Note 2 for further details, and data and code for reproducing this figure.
The data shown in Figure 2 explains why many different MDD thresholds exist for each of the most commonly used scales. It is much more difficult to clearly demarcate healthy from sick in the real data presented in Figures 2b and 2c, compared to the common conceptualization of depression as a taxon in Figure 2a (that is not supported by evidence). An analysis of 350 clinical trials for depression using the MADRS identified that 28 different thresholds were used to determine whether patients have MDD and should therefore be included in a given trial; thresholds ranged from total scores of 5 to 34 points.36 Similarly, a review of 29 trials for adolescent MDD identified 47 unique definitions of remission, with only a minority of trials providing a rationale for their cutoffs.51 Overall, this illustrates that the internal structure of the most commonly used depression instruments does not support the use of cutoffs to identify the presence versus absence of MDD.
Dimensionality
Another common use for depression scales is adding up equally weighted symptoms to derive a single score representing depression severity. This practice is valid if all items measure one construct (rather than three or five), and if items are interchangeable, that is, if they contribute roughly equally to depression severity.52,53 If these assumptions are met, data from depression instruments will be best described by a unidimensional factor model in which item loadings are roughly equal. However, statistical analyses often do not produce this result. Many depression scales are multidimensional, measuring more than one construct. In fact, 1 to 7 factors have been extracted for BDI, HRSD, and CES-D.33,54,55 Notably, replication of factor structures is poor across instruments56; poor within instruments across samples;33,54–61 and poor even within the same instrument in different subsets of the same sample.62 Thus, depression sum scores not only often fail to measure a single construct, but the number and nature of those constructs shift across context, time, and people. The assumption that items are interchangeable is similarly untenable given a broad set of empirical studies showing that individual symptoms differ in their relations to risk factors,63,64 impact on functioning,65–67 and biological markers,68–74 and are differentially predicted by life events.75–79 Together, this severely limits the use of sum scores to denote one underlying construct.52
Further evidence against the validity of sum-scores comes from the internal consistency of depression instruments: the extent to which people respond similarly across all instrument items. For depression scales, there is a wide range of internal consistency estimates, with reported alpha coefficients as low as 0.4 to as high as 0.9.31,33,80,81. Acceptable internal consistency (alpha > 0.7) is usually observed in general population samples, whereas alpha is often substantially lower in clinical populations.31,33,80,81 This phenomenon is particularly visible in clinical trials for depression where, using the same scale in the same sample, alpha often increases considerably within a few weeks as the sample gets healthier (for the HRSD, often from 0.4 to 0.8).80,81
Issues of multidimensionality and inadequate internal consistency might be related to the heterogeneity of the MDD phenotype. An analysis of depression symptoms of 3,703 MDD patients identified over 1,000 unique empirical symptom profiles; around half of these profiles were endorsed by only a single individual82 (see ref83 for similar findings). There have been attempts to tackle the massive heterogeneity of MDD by proposing more homogeneous depression subtypes or specifiers, such as melancholic or atypical depression that come with specific symptoms.84–86 However, subtyping efforts have largely failed to result in categories that support clear demarcation of patients, higher treatment specificity, or higher temporal stability.84–96 Seasonal Affective Disorder is a possible exception.97–99
Some of the limits of total scores were understood a long time ago. Hamilton referred to the sum of symptoms assessed by the HRSD as ‘total crude score’ and focused his analysis on four subscales assessing narrower phenotypes, such as ‘anxiety’ and ‘agitated depression.’3 Yet today, the total crude score is used in nearly all studies that utilize the HRSD. As reviewed here, the six decades since Hamilton developed his scale have provided ample psychometric evidence regarding dimensionality and internal consistency of depression instruments, raising questions about the common use of adding depression symptoms to a single score.
Measurement invariance
Researchers use depression scales to compare scores for different groups of people, implying a belief that depression is invariant across contexts. Accordingly, the measurement of depression should be similarly invariant. Measurement invariance is necessary for common research questions, such as whether depression rates are similar in women and men. If an instrument does not measure the same construct in two groups, it cannot be used to compare groups regarding this construct. Measurement invariance across groups has several levels, including invariance at the structural level (the same number of factors can be extracted in different groups) and invariance of factor loadings (factor loadings of items in one group are similar to those in another group). The more the psychometric properties of an instrument (such as factor loadings) remain consistent across groups, the more the instrument can be said to exhibit measurement invariance,100 that is, to measure the same construct across groups.
Some level of measurement invariance has been established for certain depression instruments across certain groups; for example, the nine DSM-IV depression symptoms exhibit measurement invariance in women assessed across samples collected in the US, Europe, and China,101 as do PHQ-9 scores across women and men in a community sample in Hong Kong.102 However, in other situations and data, depression instruments do not meet the level of measurement invariance required to compare groups on depression scores. Significant differences in the psychometric properties of depression instruments have been observed across groups defined by socioeconomic status103, ethnicity,104 sex,105 and age,106 among others. Thus, common uses of depression instruments, such as comparing depression scores across groups, might not be valid, depending on the instrument and situation.
The same issue applies to measurement invariance across time: Some studies found that so-called temporal measurement invariance of depression scales held, which means that a score in a sample at time 1 holds the same meaning as a score in the same sample at time 2 because it measures the same construct.107 But many other studies have demonstrated a lack of temporal invariance.33,58,108 This raises serious concerns about using depression scales to track treatment progress. If temporal measurement invariance is violated, a BDI score of 20 points for a sample at treatment entry, and 10 points for the same sample 8 weeks later, do not measure the same construct, limiting the ability to assess treatment efficacy.33
Inter-rater reliability
Finally, diagnoses in clinical or research settings are usually given by one rater, implying a belief that diagnoses are sufficiently reliable that multiple assessors are unnecessary. Indeed, much of the motivation to move toward diagnostic criteria and standardized scales was to enhance reliability: the consistency of scores obtained in depression instruments across raters, contexts, and time.25 Here, we focus on inter-rater reliability (the extent to which independent raters produce similar scores), which is required to support the common clinical and research practice of using one rater to assign a depression diagnosis. Inter-rater reliability is important because prevalence rates derived from diagnoses inform mental health policy, and because both over-diagnosis and under-diagnosis of MDD can have dramatic consequences for a person’s life. There are three broad sets of findings related to inter-rater reliability.
Some studies for DSM diagnoses and observer-rated scales have noted very high agreement among raters, at times exceeding 0.90.109,110 However, such high agreement is usually obtained when interviews are not conducted independently (for example, both raters watch the same interview tape), which inflates agreement among raters. To properly assess inter-rater reliability, different clinicians must conduct their interviews separately.
Studies using separate, structured clinical interviews show moderate agreement between raters. For example, a study in which different clinicians conducted structured interviews reported a kappa coefficient of 0.62.111 Although MDD had the lowest inter-rater reliability of the 20 assessed diagnoses, the result suggests that such interviews can produce substantial agreement. Unfortunately, only an estimated 15% of clinical psychologists and psychiatrists make use of structured interviews.112
Finally, studies examining how diagnostic criteria perform in routine clinical practice are troubling; the DSM-5 field trials are a prominent example. Such field trials are conducted when new versions of official psychiatric nosologies such as International Classification of Diseases (ICD) or DSM are released, with the goal to assess the reliability of psychiatric diagnoses in clinical practice. In the DSM-5 field trials, interviewers had a minimum of 2 years of psychiatric post-graduate training, and for each participant, independent psychiatric assessments were conducted by two interviewers within 4 to 48 hours of each other; interviews relied on usual clinical interview procedures to “mirror the circumstances in which most diagnosing takes place.”113 Strikingly, despite using criteria designed explicitly to promote reliability,114 inter-rater reliability for a diagnosis of MDD was just 0.28, placing it among the least reliable diagnoses in the DSM. We illustrate the severe impact of this level of inter-rater reliability on diagnostic outcomes (both false positives and false negatives) in Figure 3. For comparison, kappa values (see Box 1) for bipolar disorder and post-traumatic stress disorder were 0.56 and 0.67, respectively.111 Reliability for MDD is even lower (kappa = 0.16) when interviews are carried out by general practitioners115 who are responsible for a substantial proportion of MDD diagnoses worldwide.116
Figure 3. Simulated impact of low inter-rater reliability on diagnostic outcomes.
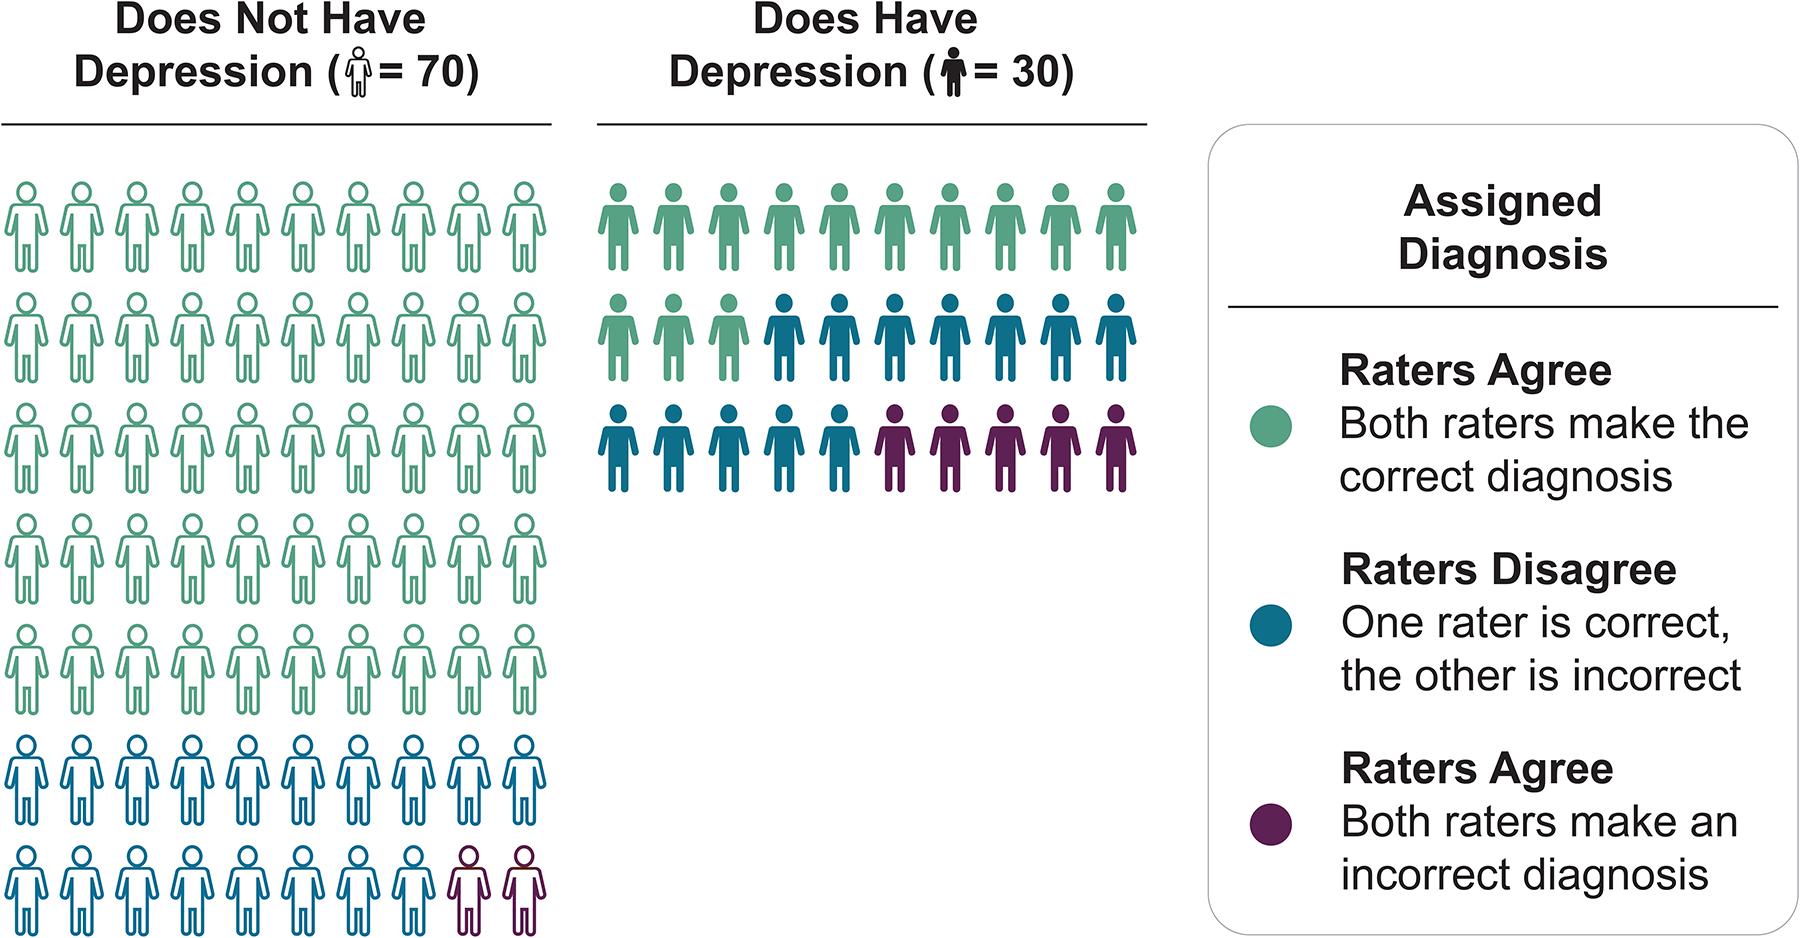
Based on the inter-rater reliability (kappa coefficient) of 0.28 for Major Depressive Disorder reported in the DSM-5 field trials, we simulated data for two clinicians and 100 people, 30 of whom have depression. The left column shows accurate agreement between clinicians in 71% of the 70 non-depressed cases (green), 26% disagreement (blue), and 3% inaccurate agreement (purple). For the 30 depressed participants (right column), diagnostic performance was particularly poor, with only 43% accurate agreement (green), 40% disagreement (blue), and 17% inaccurate agreement (purple). See Supplementary Note 3 for a complete description of the simulation underlying this figure.
In summary, the historical shift of DSM-III towards more objective criteria improved reliability, especially when structured interviews are used to assess signs and symptoms. However, the results from studies attempting to approximate measurement of MDD typical in clinical contexts are discouraging, to the degree that the head of the DSM-5 task force had to concede that the “relatively low reliability of major depressive disorder […] is a concern for clinical decision-making.”113
Shaky Foundations
By the standards commonly applied in psychological research, the evidence does not support many of the common uses of depression instruments. Next, we discuss two potential explanations of these shortcomings rooted in the foundations of depression measurement.
Methodological Foundations
One explanation for the validity and reliability problems of common depression instruments is that they were not developed following modern best practices. Today, the development and validation of psychometric instruments is a thorough process that occurs in three phases.117 In phase 1, the substance of the construct is explored (for example, clarifying its nature, breadth, and depth). In phase 2, the structure of the instrument is investigated (for example, using item analyses and factor analysis). Finally, in phase 3, the relation between the instrument and external constructs is researched (for example, by testing its ability to discriminate between groups known to be distinct). Critically, each phase includes iterative revisions until the instrument meets desired criteria.118 These practices were not widely established when common depression instruments were developed. Although much individual validation research has been published, for example regarding the factor structure of depression instruments,33,54,55,107, it remains a cause for concern that the majority of studies focused on phases 2 and 3 rather than the foundational phase 1, and that findings have not led to substantial iterative development of depression measurement (the BDI is one of few scales that has been updated over the years119).
Rather than a rigorous exploration of the construct to be measured via item development, expert reviews, or focus groups, scale developers often developed depression instruments based on their clinical experiences and personal views. For example, Hamilton developed the HRSD based on his experiences and knowledge working with inpatients, not from an explicated theory that defined depression.3 Other scale developers sidestepped theoretical considerations altogether, often via statistical procedures. For example, to obtain an “empirically founded scale”35 the MADRS items were chosen by dropping items from a prior scale on which 64 patients did not improve significantly after receiving antidepressant drugs. This procedure raises questions about what the scale measures. As a recent historical analysis notes, the MADRS is really a measure of emotions that change over a few weeks in drug trials, rather than a measure of depression.120
Further, the content of depression instruments was often shaped not by theory or to support valid scores, but by what Lilienfeld called “centrifugal antiscientific forces”,121 including practical constraints such as ease of clinical use as well as continuity (for example with previous DSM editions). The former emphasizes brief instruments and thereby presents a considerable obstacle toward adequate content representation, while the latter severely constrains opportunities for iterative development.
Overall, given these various shortcomings and constraints, it should not be surprising that validity evidence does not support many of the common uses of depression measurement.
Theoretical Foundations
A second, related explanation for validity and reliability problems of common depression instruments is that most depression instruments were developed without clear and explicit theories about the nature of depression. Without a clear theory of depression, it is unclear what researchers aim to measure, and how we can evaluate whether they have succeeded.122–124 However, the absence of explicit theories does not mean depression measurement is atheoretical: Many implicit beliefs about depression such as taxonicity are embedded in measures. Unfortunately, these latent theories125 do not align well with decades of empirical research, and one of the most fundamental latent theories is the notion that depression symptoms arise from a common cause.
Mental health research leans heavily on medicine and psychology in its approach to measurement. Medicine has symptom checklists indicating diseases, and psychologists measure constructs such as mathematical ability or personality via tests and questionnaires. Critically, using items to indicate underlying diseases or constructs only works under the assumption that constructs cause item responses. Medical symptoms can indicate an underlying disorder because symptoms are caused by the disorder (for example, measles causes Koplik’s spots). Similarly, tests for mathematical ability use items like ‘17×39’ because an individual’s performance on this item is thought to be caused by their mathematical ability.
The common cause theory—all symptoms have a shared origin—implicitly underlies the scoring and use of nearly all psychiatric assessments, including depression instruments, and justifies practices such as summing items.126,127 The field uses the term ‘symptom’ to refer to items of depression instruments, implying (by definition of the word symptom) an independent disease entity that gives rise to the symptoms.128 The common cause theory presupposes a homogeneous, categorical, unitary construct with interchangeable symptoms. The common cause theory also explains common statistical practices in psychiatric research, including the notion that ‘good’ scales should be unidimensional (they measure one construct) and have high internal consistency (items measure the same construct).
In contrast to the common cause framework, there is increasingly widespread recognition that depression is a highly heterogeneous, multifactorial, and complex phenotype.129,130 Depression has fuzzy boundaries, and features both multifinality (the same constellation of variables can lead to different outcomes) and equifinality (different constellations can lead to the same outcome).131 Depression also shows pronounced inter-individual differences, such that two people diagnosed with MDD may not share a single symptom,82,83 and the disorder may be categorical for some but continuous for others.132 Indeed, the lack of validity evidence for commonly used instruments for measuring depression can be interpreted as evidence that there is a mismatch between the nature of depression and the common cause theory implicit in these instruments. Importantly, if the common cause theory had been explicit when these instruments were developed, the failure to observe evidence for validity would have immediately signaled that something was wrong, either with the instrument or with the theory of depression. However, because theories about depression have largely remained latent and are only implied through research and clinical practices, these discrepancies were less salient, and opportunities to improve depression instruments were missed.
Conclusion
The state of depression measurement today resembles that of thermometry in the 17th century. Although objective measures of temperature are now taken for granted, just a few centuries ago there were many different thermometers developed by many different scientists, all claiming to measure temperature, with “standards kept by each workman, without any agreement or reference to one another” (Halley, 1693, referenced in133). Everyone could agree that these thermometers were assessing something, but the precise nature of the thing was unclear.
Progress in thermometry was made possible by epistemic iteration, a series of successive approximations in which advances in thermometry afforded advances in understanding temperature that, in turn, allowed for further improvement in thermometry.133 Central to this framework is the notion that fallible measures, despite their imperfections, can provide enough advance in knowledge that there is an opportunity for further advances in measurement.
Despite the obvious differences between depression and temperature, the idea of an ongoing exchange between advances in knowledge and improvements in measurement provides a crucial framework for considering how the measurement of depression can move forward. We provide a list of concrete suggestions for improving depression measurement (Box 2), based on two fundamental principles.
Box 2: Towards better depression measurement.
We suggest several steps for iterative improvement of depression measurement.
Development and iteration
1. Develop explicit theories of depression.
Without a clear theory, it is unclear what we ought to measure, and how to evaluate whether we have succeeded in doing so. Explicit theories spell out core beliefs or assumptions about the nature of depression in detail and, in the best case, do so in formalized ways.123,125,148
2. Epistemic iteration.
Progress in depression measurement comes from successive approximations in which each stage moves us closer to our epistemic goals.133 Fallible depression instruments, such as HRSD or BDI, can provide advances in knowledge which, in turn, enable advances in measurement. This iterative exchange between theory and measurement provides an avenue for science to progress, but critically relies on having explicated theories in the first place.
3. Experience experts and cross-cultural aspects.
Common depression instruments were predominantly designed by WEIRD (Western, educated, industrialized, rich and democratic) clinicians, and validated in WEIRD samples. It is crucial to involve people with lived experiences and their caregivers, and people from non-WEIRD cultures and countries, in this process.29
4. Response processes.
There is a lack of research on how self-rated and observer-rated scales are scored. Response processes should be investigated when developing new (or improving existing) instruments via tools such as the Response Process Evaluation method (a type of cognitive interview which elucidates how participants interpret items and select responses).149–153
Use
5. Use scales for appropriate purposes.
Not all instruments are appropriate for all purposes.154 Hamilton wrote in 1960 that his scale ought to be used only in already diagnosed patients as a measure of severity,3 but HRSD is commonly used today to distinguish depressed from healthy participants. Researchers and clinicians should use instruments for the purposes for which they were developed and validated, and justify their choice of depression instrument. In the immediate future, this might mean developing and using different instruments for different uses, for example, one for determining whether treatment is warranted and another for tracking progress. We note that this suggestion is opposed to recent initiatives by NIH and Wellcome Trust to mandate the PHQ-9 as a universal depression measure for all contexts and uses.154
6. Robustness.
Especially for data-driven research, researchers should consider utilizing multiple depression instruments and investigating whether they lead to robust results, or whether results depend on the use of one particular instrument.52,154
7. Symptomics.
Depression severity and MDD are highly heterogeneous phenotypes, such that it can be unclear what scores on these phenotypes represent. Investigating individual symptoms of depression scales, such as insomnia or suicidal ideation, might represent more valid and reliable phenotypes than symptom sum-scores or categorical diagnoses.52,127,129
8. Continuous analyses.
Consistent with psychometric evidence that depression data is best described as continuous (Figure 2),47–50 researchers should avoid arbitrary cutoffs whenever not strictly necessary, and conceptualize and analyze depression as a continuum rather than a taxon.
Reporting
9. Increase transparency of measure use.
The 12 versions of the HRSD differ in the number of items (6 to 36),155,156 and some have dozens of translations. Although these versions differ in crucial aspects such as content and psychometric properties, approximately half of the studies using HRSD provide no information about the version used.155 In intervention trials published in clinical psychology journals, only 1 in 7 studies pre-register their measures,157 leaving these studies vulnerable to selecting which measures to report post-hoc, a practice especially prevalent in studies with industry funding.158 Similarly, only 18 of 32 reviewed randomized controlled trials of adolescent depression featured an identifiable, single, primary outcome.159 This lack of transparency when administering instruments creates fertile ground for questionable measurement practices, and muddies the inferences that can be drawn. We recommend answering the six questions to promote transparent reporting of measurement listed in ref.122
First, we cannot divorce our measures of depression from our theories about what depression is. In contrast to current practices, where measures are often expressly atheoretical but infused with implicit theories (such as that MDD is categorical), it will be essential to ground measurement in strong theories that explicate core assumptions about the nature of depression. Grounding measurement in clearly explicated theory will enable researchers to identify the limits of existing measures and take steps to improve them.123 Developing such theories will be challenging given the complex, dynamic, and heterogeneous nature of MDD. But, doing so is crucial due to the central role of theory development in advancing scientific knowledge. To this end, clinical sciences can draw on tools and frameworks from fields with rigorous approaches to modeling processes of interest.123,125,134
Second, improving depression measurement requires iterative development. Despite evidence of the shortcomings of common instruments that have been in use for many decades, there has been minimal effort to move beyond these measures. Evidence of shortcomings is not a criticism of original scale developers; we doubt that Hamilton would have wanted his scale used uncritically and without any revisions for over 60 years. Moreover, reluctance to move beyond these measures is not unfounded. There is clear value in having consistency of measurement across time and contexts for an applied field like psychiatry. Nonetheless, whatever advantages there are to be gained by adherence to precedent, they are outweighed by the gains to be made by genuine progress in our ability to measure and therefore understand, diagnose, prevent, and treat depression. Given the shortcomings reviewed here, we should develop better depression measures, but these must be rooted in what we have learned from existing instruments.133
To illustrate these core principles, consider the theory that depression syndrome emerges from a complex system of causal interactions among the physiological, cognitive, emotional, and behavioral experiences we commonly refer to as symptoms.135–138 This theory emerged because data gathered from existing measures were inconsistent with the common cause theory on which they are implicitly based. Now, to measure depression as a complex system we need new measures, which will require at least two innovations.
First, each component in the system must be measured rigorously, which is not the case in current depression measures that typically only provide very rough assessments of individual elements.52 Common depression symptoms like guilt, suicidal ideation and sleep problems are themselves complex phenotypes, but are usually assessed only with a single item each. In addition, measures could encompass a broader set of elements than symptoms alone, including variables conceptualized as risk factors, maintenance factors, and outcomes, such as stress or adversity, and impairment and quality of life.139–142 It will be critical to engage scientific and experiential experts in characterizing the system of elements that drive depression.29,143
Second, according to this systems theory, symptoms (such as sad mood) do not merely indicate depression; they are active causal agents that influence other symptoms (such as sleep, concentration, or suicidal ideation). Thus, individual system elements and their relationships must be measured, necessitating a move away from static, retrospective assessments and toward instruments that can assess the dynamic unfolding of depression within individuals over time. For example, smartphone apps and other digital tools that utilize ecological momentary assessment to query people multiple times per day regarding their thoughts, feelings, behaviors, and experiences144 have the potential to reveal dynamic information about depression, including the development of individual system elements and relationships among them.
Importantly, establishing the components of a system and their relations can promote new insights into depression. From a systems perspective, someone is at risk for depression if the system, once sufficiently perturbed, is likely to fall into a self-sustaining depressed state. The key to this determination is in the system’s attractor states. An attractor state can be thought of as a valley in a landscape, with a ball representing the system’s current state resting on the surface. If an individual is healthy, the landscape is flat and only has a single valley, which is their healthy attractor state where elements of depression are absent. Perturbations (such as life stress) may push the ball up the slope of this valley, but it will always return to this healthy attractor state. By contrast, if an individual is at risk for depression, the landscape features a second valley where many elements of depression are active. In this landscape, a perturbation can push the ball up the slope, out of the healthy valley and into the depressed one. Critically, system elements and their causal relationships determine the shape of a person’s stability landscape (and, thus, the presence of attractor states). Accordingly, accurately measuring elements and relationships can identify the presence of a harmful attractor, providing a novel measure of depression. From this perspective, depression is determined by the presence of a harmful attractor state, as well as the shape of the stability landscape (for example, how steep the valleys are), rather than just the number of symptoms. This shift has substantial implications for how we think about measuring depression risk, depression severity, and depression recovery. Identifying people vulnerable for depression means measuring the system thoroughly to determine if a depressed attractor is present before the person ever falls into it; measuring depression severity means to assess the shape of the stability landscape in detail; and assessing treatment efficacy might involve measuring the flattening or elimination of the harmful attractor, changing the stability landscape into one that has a single healthy valley. Working from a theory that clearly specifies the nature of the phenomenon we are assessing affords clear new paths for how to measure it.
Our example is not meant to show that the systems approach is the one right theoretical path forward, but rather that grounding measurement in theories can provide insight into how to advance depression measurement. Measuring depression from a systems perspective would initially exhibit substantial shortcomings, but advances in the theory would enable improvements in measurement, which, in turn, may equip us to interrogate further and advance the theory. Through this iterative exchange we can improve the measurement of depression133, and in doing so, improve our ability to study, diagnose, treat, and prevent it.
Supplementary Material
Acknowledgements
The authors thank Dr Melissa Gordon Wolf, Dr Nancy Butcher, and Dr Zachary Cohen for comments on earlier versions of this manuscript.
Footnotes
Competing interests
The authors declare no competing interests.
Supplementary information
Supplementary information for this paper is available at https://osf.io/7dp5s/
References
- 1.Santor DA, Gregus M & Welch A Eight Decades of Measurement in Depression. Measurement 4, 135–155 (2006). [Google Scholar]
- 2.van Noorden R, Maher B & Nuzzo R The top 100 papers. Nature 514, 550–553 (2014). [DOI] [PubMed] [Google Scholar]
- 3.Hamilton M A rating scale for depression. J. Neurol. Neurosurg. Psychiatry 23, 56–62 (1960). [DOI] [PMC free article] [PubMed] [Google Scholar]
- 4.Beck AT, Ward CH, Mendelson M, Mock J & Erbaugh J An inventory for measuring depression. Arch. Gen. Psychiatry 4, 561–71 (1961). [DOI] [PubMed] [Google Scholar]
- 5.Radloff LS The CES-D Scale: A Self-Report Depression Scale for Research in the General Population. Appl. Psychol. Meas 1, 385–401 (1977). [Google Scholar]
- 6.Jorm AF, Patten SB, Brugha TS, Mojtabi R. Has increased provision of treatment reduced the prevalence of common mental disorders? Review of the evidence from four countries. World Psychiatry 90–99 (2017) doi: 10.1002/wps.20388. [DOI] [PMC free article] [PubMed] [Google Scholar]
- 7.Kapur S, Phillips AG & Insel T Why has it taken so long for biological psychiatry to develop clinical tests and what to do about it? Mol. Psychiatry 17, 1174–1179 (2012). [DOI] [PubMed] [Google Scholar]
- 8.Scull A American psychiatry in the new millennium: A critical appraisal. Psychol. Med (2021) doi: 10.1017/S0033291721001975. [DOI] [PubMed] [Google Scholar]
- 9.Cuijpers P et al. The effects of psychotherapies for depression on response, remission, reliable change, and deterioration: A meta‐analysis. Acta Psychiatr. Scand 1–12 (2021) doi: 10.1111/acps.13335. [DOI] [PMC free article] [PubMed] [Google Scholar]
- 10.Khan A & Brown WA Antidepressants versus placebo in major depression : an overview. World Psychiatry 14, 294–300 (2015). [DOI] [PMC free article] [PubMed] [Google Scholar]
- 11.Kendler K, Munõz R & Murphy G The development of the Feighner criteria: a historical perspective. Am. J. Psychiatry 134–142 (2010) doi: 10.1176/appi.ajp.2009.09081155. [DOI] [PubMed] [Google Scholar]
- 12.Spitzer RL Psychiatric diagnosis: Are clinicians still necessary? Compr. Psychiatry 24, 399–411 (1983). [DOI] [PubMed] [Google Scholar]
- 13.Horwitz AV DSM-I and DSM-II. in The Encyclopedia of Clinical Psychology 1–6 (2015). doi: 10.1002/9781118625392.wbecp012. [DOI] [Google Scholar]
- 14.Beck A Reliability of Psychiatric Diagnoses: 1. A Critique of Systematic Studies. Am. J. Psychiatry 119, 210–216 (1962). [Google Scholar]
- 15.Ash P The Reliability of Psychiatric Diagnoses. J. Abnorm. Soc. Psychol 44, 272–276 (1949). [DOI] [PubMed] [Google Scholar]
- 16.Feighner JP et al. Diagnostic criteria for use in psychiatric research. Arch. Gen. Psychiatry 26, 57–63 (1972). [DOI] [PubMed] [Google Scholar]
- 17.APA. Diagnostic and Statistical Manual of Mental Disorders, Third Edition. (American Psychiatric Association, 1980). [Google Scholar]
- 18.Fried E The 52 symptoms of major depression: Lack of content overlap among seven common depression scales. J. Affect. Disord 208, 191–197 (2017). [DOI] [PubMed] [Google Scholar]
- 19.Cipriani A et al. Comparative efficacy and acceptability of 21 antidepressant drugs for the acute treatment of adults with major depressive disorder: a systematic review and network meta-analysis. Lancet 1–10 (2018) doi: 10.1016/S0140-6736(17)32802-7. [DOI] [PMC free article] [PubMed] [Google Scholar]
- 20.Cronbach LJ & Meehl PE Construct validity in psychological tests. Psychol. Bull 52, (1955). [DOI] [PubMed] [Google Scholar]
- 21.Robins E & Guze SB Establishment of diagnostic validity in psychiatric illness: its application to schizophrenia. Am. J. Psychiatry 126, 983–987 (1970). [DOI] [PubMed] [Google Scholar]
- 22.Bandalos DL Validity. in Measurement theory and applications for the social sciences 268 (2018). [Google Scholar]
- 23.Kane MT Validating the Interpretations and Uses of Test Scores. J. Educ. Meas 50, 1–73 (2013). [Google Scholar]
- 24.Mokkink LB et al. The COSMIN study reached international consensus on taxonomy, terminology, and definitions of measurement properties for health-related patient-reported outcomes. J. Clin. Epidemiol 63, 737–745 (2010). [DOI] [PubMed] [Google Scholar]
- 25.American Educational Research Association, American Psychological Association & National Council on Measurement in Education. Standards for educational and psychological testing. (Joint Committee on Standards for Educational and Psychological Testing, 2014). [Google Scholar]
- 26.Messick S Meaning and Values in Test Validation: The Science and Ethics of Assessment. Educ. Res 18, 5–11 (1989). [Google Scholar]
- 27.Fried EI Corrigendum to “The 52 symptoms of major depression: lack of content overlap among seven common depression scales”, [Journal of Affective Disorders, 208, 191–197]. J. Affect. Disord 260, 744 (2020). [DOI] [PubMed] [Google Scholar]
- 28.Mew EJ et al. Systematic scoping review identifies heterogeneity in outcomes measured in adolescent depression clinical trials. J. Clin. Epidemiol 126, 71–79 (2020). [DOI] [PubMed] [Google Scholar]
- 29.Chevance AM et al. Identifying outcomes for depression that matter to patients, informal caregivers and healthcare professionals: qualitative content analysis of a large international online survey. Lancet Psychiatry (2020) doi: 10.1016/S2215-0366(20)30191-7. [DOI] [PubMed] [Google Scholar]
- 30.Wittkampf K et al. The accuracy of Patient Health Questionnaire-9 in detecting depression and measuring depression severity in high-risk groups in primary care. Gen. Hosp. Psychiatry 31, 451–9 (2009). [DOI] [PubMed] [Google Scholar]
- 31.Sayer NNA et al. The Relations Between Observer-Rating and Self-Report of Depressive Symptomatology. Psychol. Assess 5, 350–360 (1993). [Google Scholar]
- 32.Furukawa TA et al. Translating the BDI and BDI-II into the HAMD and vice versa with equipercentile linking. Epidemiol. Psychiatr. Sci (2019) doi: 10.1017/S2045796019000088. [DOI] [PMC free article] [PubMed] [Google Scholar]
- 33.Fried E et al. Measuring Depression Over Time … or not? Lack of Unidimensionality and Longitudinal Measurement Invariance in Four Common Rating Scales of Depression. Psychol. Assess 28, 1354–1367 (2016). [DOI] [PubMed] [Google Scholar]
- 34.Beck AT, Rush AJ, Shaw FS & Emery G Cognitive Therapy of Depression. (Guilford Press, 1979). [Google Scholar]
- 35.Montgomery SA & Asberg M A new depression scale designed to be sensitive to change. Br. J. Psychiatry 134, 382–389 (1979). [DOI] [PubMed] [Google Scholar]
- 36.von Glischinski M, von Brachel R, Thiele C & Hirschfeld G Not sad enough for a depression trial? A systematic review of depression measures and cut points in clinical trial registrations: Systematic review of depression measures and cut points. J. Affect. Disord 292, 36–44 (2021). [DOI] [PubMed] [Google Scholar]
- 37.Kroenke K, Spitzer RL & Williams JB The PHQ-9: validity of a brief depression severity measure. J. Gen. Intern. Med 16, 606–13 (2001). [DOI] [PMC free article] [PubMed] [Google Scholar]
- 38.Levis B et al. Patient Health Questionnaire-9 scores do not accurately estimate depression prevalence: individual participant data meta-analysis. J. Clin. Epidemiol 122, 115–128.e1 (2020). [DOI] [PubMed] [Google Scholar]
- 39.Whiston S Principles and applications of assessment in counseling. (Brooks/Cole, Cengage Learning, 2009). [Google Scholar]
- 40.Thombs BD, Kwakkenbos L, Levis AW & Benedetti A Addressing overestimation of the prevalence of depression based on self-report screening questionnaires. Can. Med. Assoc. J 190, 44–49 (2018). [DOI] [PMC free article] [PubMed] [Google Scholar]
- 41.Lavender JM & Anderson DA Effect of perceived anonymity in assessments of eating disordered behaviors and attitudes. Int. J. Eat. Disord 42, 546–551 (2009). [DOI] [PubMed] [Google Scholar]
- 42.Keel PK, Crow S, Davis TL & Mitchell JE Assessment of eating disorders: Comparison of interview and questionnaire data from a long-term follow-up study of bulimia nervosa. J. Psychosom. Res 53, 1043–1047 (2002). [DOI] [PubMed] [Google Scholar]
- 43.Croskerry P The Importance of Cognitive Errors in Diagnosis and Strategies to Minimize Them. Acad. Med 78, 775–780 (2003). [DOI] [PubMed] [Google Scholar]
- 44.Kim NS & Ahn W Clinical psychologists’ theory-based representations of mental disorders predict their diagnostic reasoning and memory. J. Exp. Psychol. Gen 131, 451–476 (2002). [PubMed] [Google Scholar]
- 45.Aboraya A Clinicians’ opinions on the reliability of psychiatric diagnoses in clinical settings. Psychiatry 4, 31–3 (2007). [PMC free article] [PubMed] [Google Scholar]
- 46.American Psychiatric Association. Diagnostic and statistical manual of mental disorders: DSM-IV-TR. American Psychiatric Association (American Psychiatric Association, 2000). doi: 10.1176/appi.books.9780890425596.744053. [DOI] [Google Scholar]
- 47.Ruscio J, Zimmerman M, McGlinchey JB, Chelminski I & Young D Diagnosing major depressive disorder XI: a taxometric investigation of the structure underlying DSM-IV symptoms. J. Nerv. Ment. Dis 195, 10–9 (2007). [DOI] [PubMed] [Google Scholar]
- 48.Haslam N Categorical versus dimensional models of mental disorder: the taxometric evidence. Aust. N. Z. J. Psychiatry (2003) doi: 10.1080/j.1440-1614.2003.01258.x. [DOI] [PubMed] [Google Scholar]
- 49.Haslam N, Holland E & Kuppens P Categories versus dimensions in personality and psychopathology: a quantitative review of taxometric research. Psychol. Med 42, 903–20 (2012). [DOI] [PubMed] [Google Scholar]
- 50.Nettle D Normality, disorder and evolved function: The case of depression. in Maladapting Minds: Philosophy, Psychiatry, and Evolutionary Theory (eds. Adriaens PR & De Block A) 192–209 (2010). [Google Scholar]
- 51.Courtney DB et al. Forks in the road: definitions of response, remission, recovery and other dichotomized outcomes in randomized controlled trials for adolescent depression. A scoping review. Depress. Anxiety (2021) doi: 10.1002/da.23200. [DOI] [PubMed] [Google Scholar]
- 52.Fried E & Nesse RM Depression sum-scores don’t add up: why analyzing specific depression symptoms is essential. BMC Med. 13, 1–11 (2015). [DOI] [PMC free article] [PubMed] [Google Scholar]
- 53.McNeish D & Wolf MG Thinking twice about sum scores. Behav. Res. Methods 52, 2287–2305 (2020). [DOI] [PubMed] [Google Scholar]
- 54.Gullion CM & Rush AJ Toward a generalizable model of symptoms in major depressive disorder. Biol. Psychiatry 44, 959–72 (1998). [DOI] [PubMed] [Google Scholar]
- 55.Helmes E & Nielson WR An examination Epidemiological of the internal structure of the Center for Studies-Depression Scale in two medical samples. Pers. Individ. Dif 25, 735–743 (1998). [Google Scholar]
- 56.Shafer AB Meta-analysis of the Factor Structures of Four Depression Questionnaires: Beck, CES-D, Hamilton, and Zung. J. Clin. Psychol 62, 123–146 (2006). [DOI] [PubMed] [Google Scholar]
- 57.van Loo HM, de Jonge P, Romeijn J-W, Kessler RC & Schoevers RA Data-driven subtypes of major depressive disorder: a systematic review. BMC Med. 10, 156 (2012). [DOI] [PMC free article] [PubMed] [Google Scholar]
- 58.Quilty LC et al. The structure of the Montgomery–Åsberg depression rating scale over the course of treatment for depression. Int. J. Methods Psychiatr. Res 22, 175–184 (2013). [DOI] [PMC free article] [PubMed] [Google Scholar]
- 59.Elhai JD et al. The factor structure of major depression symptoms: A test of four competing models using the Patient Health Questionnaire-9. Psychiatry Res. 199, 169–173 (2012). [DOI] [PubMed] [Google Scholar]
- 60.Wardenaar KJ et al. The structure and dimensionality of the Inventory of Depressive Symptomatology Self Report (IDS-SR) in patients with depressive disorders and healthy controls. J. Affect. Disord 125, 146–54 (2010). [DOI] [PubMed] [Google Scholar]
- 61.Wood AM, Taylor PJ & Joseph S Does the CES-D measure a continuum from depression to happiness? Comparing substantive and artifactual models. Psychiatry Res. 177, 120–123 (2010). [DOI] [PubMed] [Google Scholar]
- 62.Furukawa T et al. Cross-cultural equivalence in depression assessment: Japan-Europe-North American study. Acta Psychiatr. Scand 112, 279–85 (2005). [DOI] [PubMed] [Google Scholar]
- 63.Lux V & Kendler K Deconstructing major depression: a validation study of the DSM-IV symptomatic criteria. Psychol. Med 40, 1679–90 (2010). [DOI] [PMC free article] [PubMed] [Google Scholar]
- 64.Fried E, Nesse RM, Zivin K, Guille C & Sen S Depression is more than the sum score of its parts: individual DSM symptoms have different risk factors. Psychol. Med 44, 2067–2076 (2014). [DOI] [PMC free article] [PubMed] [Google Scholar]
- 65.Faravelli C, Servi P, Arends J & Strik W Number of symptoms, quantification, and qualification of depression. Compr. Psychiatry 37, 307–315 (1996). [DOI] [PubMed] [Google Scholar]
- 66.Tweed DL Depression-related impairment: estimating concurrent and lingering effects. Psychol. Med 23, 373–386 (1993). [DOI] [PubMed] [Google Scholar]
- 67.Fried E & Nesse RM The Impact of Individual Depressive Symptoms on Impairment of Psychosocial Functioning. PLoS One 9, e90311 (2014). [DOI] [PMC free article] [PubMed] [Google Scholar]
- 68.Hasler G, Drevets WC, Manji HK & Charney DS Discovering endophenotypes for major depression. Neuropsychopharmacology 29, 1765–81 (2004). [DOI] [PubMed] [Google Scholar]
- 69.Myung W et al. Genetic association study of individual symptoms in depression. Psychiatry Res. 198(3), 400–6 (2012). [DOI] [PubMed] [Google Scholar]
- 70.Kendler K, Aggen SH & Neale MC Evidence for Multiple Genetic Factors Underlying DSM-IV Criteria for Major Depression. Am. J. Psychiatry 70(6), 599–607 (2013). [DOI] [PMC free article] [PubMed] [Google Scholar]
- 71.Nagel M, Watanabe K, Stringer S, Posthuma D & Van Der Sluis S Item-level analyses reveal genetic heterogeneity in neuroticism. Nat. Commun 9, (2018). [DOI] [PMC free article] [PubMed] [Google Scholar]
- 72.Hilland E et al. Exploring the links between specific depression symptoms and brain structure: A network study. Psychiatry Clin. Neurosci 74, 220–221 (2020). [DOI] [PubMed] [Google Scholar]
- 73.Fried E et al. Using network analysis to examine links between individual depressive symptoms, inflammatory markers, and covariates. Psychol. Med 1–21 (2019) doi: 10.1017/S0033291719002770. [DOI] [PubMed] [Google Scholar]
- 74.Van Eeden WA et al. Basal and LPS-stimulated inflammatory markers and the course of individual symptoms of depression. Transl. Psychiatry (2020) doi: 10.1038/s41398-020-00920-4. [DOI] [PMC free article] [PubMed] [Google Scholar]
- 75.Keller MC & Nesse RM Is low mood an adaptation? Evidence for subtypes with symptoms that match precipitants. J. Affect. Disord 86, 27–35 (2005). [DOI] [PubMed] [Google Scholar]
- 76.Keller MC & Nesse RM The evolutionary significance of depressive symptoms: different adverse situations lead to different depressive symptom patterns. J. Pers. Soc. Psychol 91, 316–30 (2006). [DOI] [PubMed] [Google Scholar]
- 77.Keller MC, Neale MC & Kendler K Association of different adverse life events with distinct patterns of depressive symptoms. Am. J. Psychiatry 164, 1521–9 (2007). [DOI] [PubMed] [Google Scholar]
- 78.Cramer AOJ, Borsboom D, Aggen SH & Kendler K The pathoplasticity of dysphoric episodes: differential impact of stressful life events on the pattern of depressive symptom inter-correlations. Psychol. Med 42, 957–65 (2013). [DOI] [PMC free article] [PubMed] [Google Scholar]
- 79.Fried E et al. From Loss to Loneliness : The Relationship Between Bereavement and Depressive Symptoms. J. Abnorm. Psychol 124, 256–265 (2015). [DOI] [PubMed] [Google Scholar]
- 80.Rush AJ, Gullion CM, Basco MR, Jarrett RB & Trivedi MH The Inventory of Depressive Symptomatology (IDS): psychometric properties. Psychol. Med 26, 477–86 (1996). [DOI] [PubMed] [Google Scholar]
- 81.Rush AJ et al. The 16-Item Quick Inventory of Depressive Symptomatology (QIDS), Clinician Rating (QIDS-C), and Self-Report (QIDS-SR): A Psychometric Evaluation in Patients with Chronic Major Depression. Biol. Psychiatry 54(5), 573–583 (2003). [DOI] [PubMed] [Google Scholar]
- 82.Fried E & Nesse RM Depression is not a consistent syndrome: An investigation of unique symptom patterns in the STAR*D study. J. Affect. Disord 172, 96–102 (2015). [DOI] [PMC free article] [PubMed] [Google Scholar]
- 83.Zimmerman M, Ellison W, Young D, Chelminski I & Dalrymple K How many different ways do patients meet the diagnostic criteria for major depressive disorder? Compr. Psychiatry (2014) doi: 10.1016/j.comppsych.2014.09.007. [DOI] [PubMed] [Google Scholar]
- 84.Lichtenberg P & Belmaker RH Subtyping major depressive disorder. Psychother. Psychosom 79, 131–5 (2010). [DOI] [PubMed] [Google Scholar]
- 85.Baumeister H & Parker JD Meta-review of depressive subtyping models. J. Affect. Disord 139, 126–40 (2012). [DOI] [PubMed] [Google Scholar]
- 86.Bech P Struggle for subtypes in primary and secondary depression and their mode-specific treatment or healing. Psychother. Psychosom 79, 331–8 (2010). [DOI] [PubMed] [Google Scholar]
- 87.Lam RW & Stewart JN The validity of atypical depression in DSM-IV. Compr. Psychiatry 37, 375–83 (1996). [DOI] [PubMed] [Google Scholar]
- 88.Davidson JRT A history of the concept of atypical depression. J. Clin. Psychiatry 68, 10–15 (2007). [PubMed] [Google Scholar]
- 89.Arnow BA et al. Depression Subtypes in Predicting Antidepressant Response: A Report From the iSPOT-D Trial. Am. J. Psychiatry 172, 743–750 (2015). [DOI] [PubMed] [Google Scholar]
- 90.Paykel ES Basic concepts of depression. Dialogues Clin. Neurosci 10, 279–289 (2008). [DOI] [PMC free article] [PubMed] [Google Scholar]
- 91.Rush AJ The varied clinical presentations of major depressive disorder. J. Clin. Psychiatry 68, 4–10 (2007). [PubMed] [Google Scholar]
- 92.Melartin T et al. Co-morbidity and stability of melancholic features in DSM-IV major depressive disorder. Psychol. Med 34, 1443 (2004). [DOI] [PubMed] [Google Scholar]
- 93.Fried E, Coomans F & Lorenzo-luaces L The 341 737 ways of qualifying for the melancholic specifier. The Lancet Psychiatry 7, 479–480 (2020). [DOI] [PubMed] [Google Scholar]
- 94.Oquendo MA et al. Instability of symptoms in recurrent major depression: a prospective study. Am. J. Psychiatry 161, 255–61 (2004). [DOI] [PubMed] [Google Scholar]
- 95.Coryell W et al. Recurrently situational (reactive) depression: A study of course, phenomenology and familial psychopathology. J. Affect. Disord 31, 203–210 (1994). [DOI] [PubMed] [Google Scholar]
- 96.Pae CU, Tharwani H, Marks DM, Masand PS & Patkar AA Atypical depression: A comprehensive review. CNS Drugs 23, 1023–1037 (2009). [DOI] [PubMed] [Google Scholar]
- 97.Magnusson A & Boivin D Seasonal affective disorder: an overview. Chronobiol. Int 20, 189–207 (2003). [DOI] [PubMed] [Google Scholar]
- 98.Meyerhoff J, Young MA & Rohan KJ Patterns of depressive symptom remission during the treatment of seasonal affective disorder with cognitive-behavioral therapy or light therapy. Depress. Anxiety 1–11 (2018) doi: 10.1002/da.22739. [DOI] [PMC free article] [PubMed] [Google Scholar]
- 99.Lam RW et al. Efficacy of bright light treatment, fluoxetine, and the combination in patients with nonseasonal major depressive disorder a randomized clinical trial. JAMA Psychiatry 73, 56–63 (2016). [DOI] [PubMed] [Google Scholar]
- 100.Meredith W Measurement invariance, factor analysis and factorial invariance. Psychometrika 58, 525–543 (1993). [Google Scholar]
- 101.Kendler K et al. The similarity of the structure of DSM-IV criteria for major depression in depressed women from China, the United States and Europe. Psychol. Med 1–10 (2015) doi: 10.1017/S0033291714003067. [DOI] [PMC free article] [PubMed] [Google Scholar]
- 102.Yu X, Tam WWS, Wong PTK, Lam TH & Stewart SM The Patient Health Questionnaire-9 for measuring depressive symptoms among the general population in Hong Kong. Compr. Psychiatry 53, 95–102 (2012). [DOI] [PubMed] [Google Scholar]
- 103.Nguyen HT, Kitner-Triolo M, Evans MK & Zonderman AB Factorial invariance of the CES-D in low socioeconomic status African Americans compared with a nationally representative sample. Psychiatry Res. 126, 177–187 (2004). [DOI] [PubMed] [Google Scholar]
- 104.Crockett LJ, Randall BA, Shen Y-L, Russell ST & Driscoll AK Measurement equivalence of the center for epidemiological studies depression scale for Latino and Anglo adolescents: a national study. J. Consult. Clin. Psychol 73, 47–58 (2005). [DOI] [PubMed] [Google Scholar]
- 105.Baas KD et al. Measurement invariance with respect to ethnicity of the Patient Health Questionnaire-9 (PHQ-9). J. Affect. Disord 129, 229–35 (2011). [DOI] [PubMed] [Google Scholar]
- 106.Williams CD et al. CES-D four-factor structure is confirmed, but not invariant, in a large cohort of African American women. Psychiatry Res. 150, 173–80 (2007). [DOI] [PubMed] [Google Scholar]
- 107.Stochl J et al. On Dimensionality, Measurement Invariance, and Suitability of Sum Scores for the PHQ-9 and the GAD-7. Assessment (2020) doi: 10.1177/1073191120976863. [DOI] [PubMed] [Google Scholar]
- 108.Fokkema M, Smits N, Kelderman H & Cuijpers P Response shifts in mental health interventions: an illustration of longitudinal measurement invariance. Psychol. Assess 25, 520–31 (2013). [DOI] [PubMed] [Google Scholar]
- 109.Bagby RM, Ryder AG, Schuller DR & Marshall MB Reviews and Overviews The Hamilton Depression Rating Scale: Has the Gold Standard Become a Lead Weight ? Am. J. Psyc 161, 2163–2177 (2004). [DOI] [PubMed] [Google Scholar]
- 110.Trajković G et al. Reliability of the Hamilton Rating Scale for Depression: A meta-analysis over a period of 49years. Psychiatry Res. 189, 1–9 (2011). [DOI] [PubMed] [Google Scholar]
- 111.Regier DA et al. DSM-5 Field Trials in the United States and Canada, Part II: Test-Retest Reliability of Selected Categorical Diagnoses. Am. J. Psychiatry 170(1), 59–70 (2013). [DOI] [PubMed] [Google Scholar]
- 112.Bruchmüller K, Margraf J, Suppiger A & Schneider S Popular or Unpopular? Therapists’ Use of Structured Interviews and Their Estimation of Patient Acceptance. Behav. Ther 42, 634–643 (2011). [DOI] [PubMed] [Google Scholar]
- 113.Kupfer DJ & Kraemer HC Field Trial Results Guide DSM Recommendations. Huffington Post http://www.huffingtonpost.com/david-j-kupfer-md/dsm-5_b_2083092.html (2013). [Google Scholar]
- 114.Clarke DE et al. DSM-5 Field Trials in the United States and Canada, Part I: Study Design, Sampling Strategy, Implementation, and Analytic Approaches. Am. J. Psychiatry 1–16 (2012) doi: 10.1176/appi.ajp.2012.12070998. [DOI] [PubMed] [Google Scholar]
- 115.Fernández A et al. Is major depression adequately diagnosed and treated by general practitioners? Results from an epidemiological study. Gen. Hosp. Psychiatry 32, 201–209 (2010). [DOI] [PubMed] [Google Scholar]
- 116.Huxley P Mental illness in the community: The Goldberg-Huxley model of the pathway to psychiatric care. Nord. J. Psychiatry, Suppl 50, 47–53 (1996). [Google Scholar]
- 117.Flake JK, Pek J & Hehman E Construct validation in social and personality research: Current practice and recommendations. Soc. Psychol. Personal. Sci 1–9 (2017) doi: 10.1177/1948550617693063. [DOI] [Google Scholar]
- 118.de Vet HCW, Terwee CB, Mokkink LB & Knol DL Measurement in Medicine: A Practical Guide. (Cambridge University Press, 2011). [Google Scholar]
- 119.Beck AT, Steer RA, Ball R & Ranieri W Comparison of Beck Depression Inventories -IA and -II in psychiatric outpatients. J. Pers. Assess 67, 588–97 (1996). [DOI] [PubMed] [Google Scholar]
- 120.McPherson S & Armstrong D Psychometric origins of depression. Hist. Human Sci 1–17 (2021) doi: 10.1177/09526951211009085. [DOI] [Google Scholar]
- 121.Lilienfeld SO DSM-5 : Centripetal Scientific and Centrifugal. Clin. Psychol. Sci. Pract 21, 269–279 (2014). [Google Scholar]
- 122.Flake JK & Fried E Measurement Schmeasurement: Questionable Measurement Practices and How to Avoid Them. Adv. Methods Pract. Psychol. Sci 1–10 (2020) doi: 10.1177/25152459209523. [DOI] [Google Scholar]
- 123.Robinaugh DJ, Haslbeck JMB, Ryan O, Fried E & Waldorp LJ Invisible Hands and Fine Calipers: A Call to Use Formal Theory as a Toolkit for Theory Construction. Perspect. Psychol. Sci 1–11 (2021) doi: 10.1177/1745691620974697. [DOI] [PMC free article] [PubMed] [Google Scholar]
- 124.Robinaugh DJ et al. Advancing the Network Theory of Mental Disorders: A Computational Model of Panic Disorder. 1–76 (2019).
- 125.Fried E Lack of Theory Building and Testing Impedes Progress in The Factor and Network. Psychol. Inq 31, 271–288 (2020). [Google Scholar]
- 126.Van Bork R, Wijsen LD & Rhemtulla M Toward a Causal Interpretation of the Common Factor Model. Disputatio IX, (2017). [Google Scholar]
- 127.Fried E Problematic assumptions have slowed down depression research: why symptoms, not syndromes are the way forward. Front. Psychol 6, 1–11 (2015). [DOI] [PMC free article] [PubMed] [Google Scholar]
- 128.Fried E & Cramer AOJ Moving forward: challenges and directions for psychopathological network theory and methodology. Perspect. Psychol. Sci 12, 999–1020 (2017). [DOI] [PubMed] [Google Scholar]
- 129.Fried E Moving forward: how depression heterogeneity hinders progress in treatment and research. Expert Rev. Neurother 17, 423–425 (2017). [DOI] [PubMed] [Google Scholar]
- 130.Fried E & Robinaugh DJ Systems all the way down: embracing complexity in mental health research. BMC Med. 18, 1–4 (2020). [DOI] [PMC free article] [PubMed] [Google Scholar]
- 131.Cicchetti D & Rogosch FA Equifinality and multifinality in developmental psychopathology. Dev. Psychopathol 8, 597–600 (1996). [Google Scholar]
- 132.Borsboom D et al. Kinds versus continua: a review of psychometric approaches to uncover the structure of psychiatric constructs. Psychol. Med 1–13 (2016) doi: 10.1017/S0033291715001944. [DOI] [PubMed] [Google Scholar]
- 133.Chang H Inventing Temperature. (2004).
- 134.Borsboom D, van der Maas HLJ, Dalege J, Kievit R & Haig B Theory Construction Methodology: A practical framework for theory formation in psychology. PsyArXiv, Prepr. (2020). [DOI] [PubMed] [Google Scholar]
- 135.Borsboom D A network theory of mental disorders. World psychiatry 16, 5–13 (2017). [DOI] [PMC free article] [PubMed] [Google Scholar]
- 136.Kendler K, Zachar P & Craver C What kinds of things are psychiatric disorders? Psychol. Med 41, 1143–1150 (2011). [DOI] [PubMed] [Google Scholar]
- 137.Olthof M, Hasselman F, Maatman FO & Bosman AMT Complexity theory of psychopathology. PsyArxiv 1–35 (2021). [DOI] [PubMed] [Google Scholar]
- 138.Robinaugh DJ, Hoekstra RHA, Toner ER & Borsboom D The network approach to psychopathology: a review of the literature 2008–2018 and an agenda for future research. Psychol. Med (2019) doi: 10.1080/01559982.2019.1584953. [DOI] [PMC free article] [PubMed] [Google Scholar]
- 139.Hammen C Stress and depression. Annu. Rev. Clin. Psychol 1, 293–319 (2005). [DOI] [PubMed] [Google Scholar]
- 140.Kendler K, Karkowski LM & Prescott CA Causal Relationship Between Stressful Life Events and the Onset of Major Depression. Am. J. Psychiatry 156, 837–841 (1999). [DOI] [PubMed] [Google Scholar]
- 141.Mazure CM Life Stressors as Risk Factors in Depression. Clin. Psychol. Sci. Pract 5, 291–313 (1998). [Google Scholar]
- 142.McKnight PE & Kashdan TB The importance of functional impairment to mental health outcomes: a case for reassessing our goals in depression treatment research. Clin. Psychol. Rev 29, 243–59 (2009). [DOI] [PMC free article] [PubMed] [Google Scholar]
- 143.Brouwer ME et al. Psychological theories of depressive relapse and recurrence: A systematic review and meta-analysis of prospective studies. Clin. Psychol. Rev 74, 101773 (2019). [DOI] [PubMed] [Google Scholar]
- 144.Myin-Germeys I & Kuppens P The open handbook of experience sampling methodology: a step-by-step guide to designing, conducting, and analyzing ESM studies. (Leuven: Center for Research on Experience Sampling and Ambulatory Methods, 2021). [Google Scholar]
- 145.Zung WWK A Self-Rating Depression Scale. Arch. Gen. Psychiatry 12, 63–70 (1965). [DOI] [PubMed] [Google Scholar]
- 146.Antony MM, Bieling PJ, Cox BJ, Enns MW & Swinson RP Psychometric Properties of the 42-Item and 21-Item Versions of the Depression Anxiety Stress Scales in Clinical Groups and a Community Sample. Psychol. Assess 10, 176–181 (1998). [Google Scholar]
- 147.Sijtsma K On the Use, the Misuse, and the Very Limited Usefulness of Cronbach. Psychometrika 74, 107–120 (2009). [DOI] [PMC free article] [PubMed] [Google Scholar]
- 148.Smaldino P Models are stupid, and we need more of them. Comput. Soc. Psychol 311–331 (2017) doi: 10.4324/9781315173726. [DOI] [Google Scholar]
- 149.Presser S et al. Methods for testing and evaluating survey questions. Public Opin. Q 68, 109–130 (2004). [Google Scholar]
- 150.Gordon Wolf M, Ihm E, Maul A & Taves A Survey Item Validation. Preprint (2019). [Google Scholar]
- 151.Hawkes N & Brown G Towards a validity framework for CBT self report assessment. in Assessment in cognitive therapy (eds. Brown G & Clark D) 243–267 (The Guilford Press, 2015). [Google Scholar]
- 152.Willis GB Cognitive Interviewing: A Tool for Improving Questionnaire Design. (Sage Publications, Inc., 2004). [Google Scholar]
- 153.Brown G, Hawkes N & Tata P Construct validity and vulnerability to anxiety: A cognitive interviewing study of the revised Anxiety Sensitivity Index. J. Anxiety Disord (2009) doi: 10.1016/j.janxdis.2009.06.001. [DOI] [PubMed] [Google Scholar]
- 154.Patalay P & Fried E Editorial Perspective: Prescribing measures: unintended negative consequences of mandating standardized mental health measurement. J. Child Psychol. Psychiatry 7, (2020). [DOI] [PubMed] [Google Scholar]
- 155.Neumann L Transparency in Measurement: Reviewing 100 Empirical Papers Using the Hamilton Depression Rating Scale. (Leiden University, 2020). [Google Scholar]
- 156.Williams JBW Standardizing the Hamilton Depression Rating Scale: Past, present, and future. Eur. Arch. Psychiatry Clin. Neurosci 251, 6–12 (2001). [DOI] [PubMed] [Google Scholar]
- 157.Cybulski L, Mayo-wilson E, Grant S, Corporation R & Monica S Improving Transparency and Reproducibility Through Registration : The Status of Intervention Trials Published in Clinical Psychology Journals. J. Consult. Clin. Psychol 84, 753–767 (2016). [DOI] [PubMed] [Google Scholar]
- 158.Ramagopalan SV et al. Prevalence of primary outcome changes in clinical trials registered on ClinicalTrials . gov : a cross-sectional study. F1000Research 1–10 (2018). [DOI] [PMC free article] [PubMed] [Google Scholar]
- 159.Monsour A et al. Primary outcome reporting in adolescent depression clinical trials needs standardization. BMC Med. Res. Methodol 20, 1–15 (2020). [DOI] [PMC free article] [PubMed] [Google Scholar]
Associated Data
This section collects any data citations, data availability statements, or supplementary materials included in this article.