
Figure 2. Targeted photo-biotinylation and isolation of chromatin from a transgene locus in cultured U2OS cells.
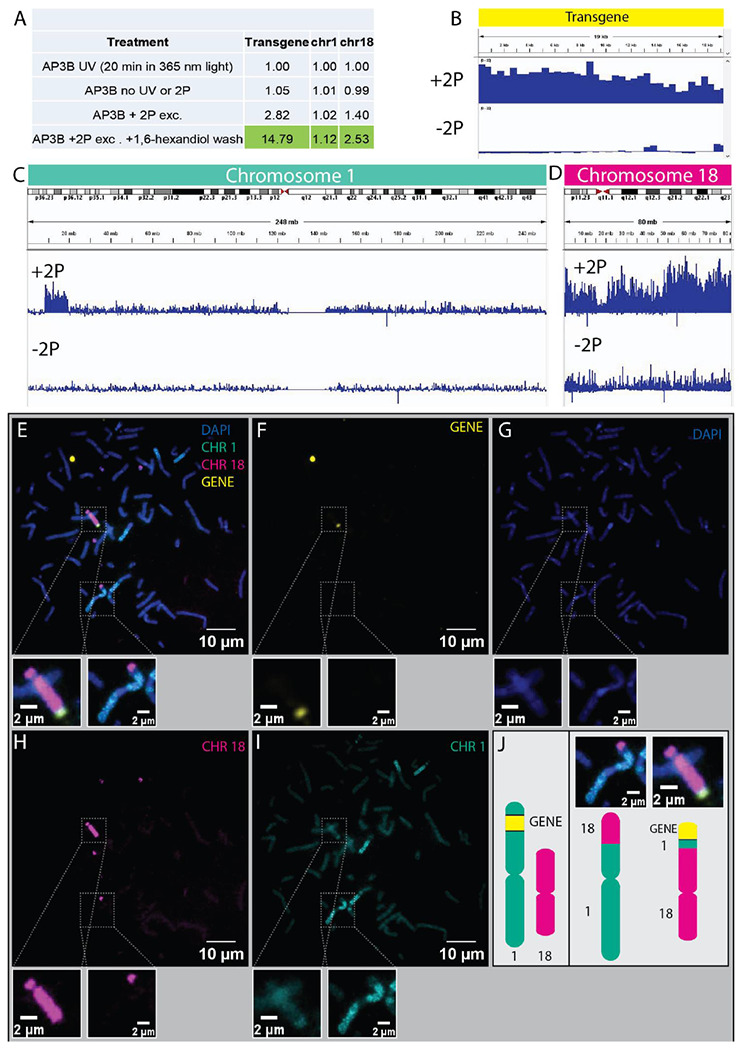
A. Calculated enrichments of selected genomic regions from different treatments (normalized to uniform UV irradiation reads). B-D. Browser shots of transgene, Chromosome 1, and Chromosome 18, respectively, mapping read coverage as the ratio of targeted 2P-treated to UV-treated to control for non-uniform AP3B selectivity. (Unmapped reads in C are q12 peri-centromeric region.) E-I. Metaphase DNA-FISH on U2OS cells. Transgene locus in yellow, Chr1 in green, Chr18 in magenta, DAPI in blue. J. Schematic of the presumed transgene location from ref 3 (left) and the translocated transgene (right) which we determined initially with Femto-Seq, and then subsequently verified with multicolor FISH.