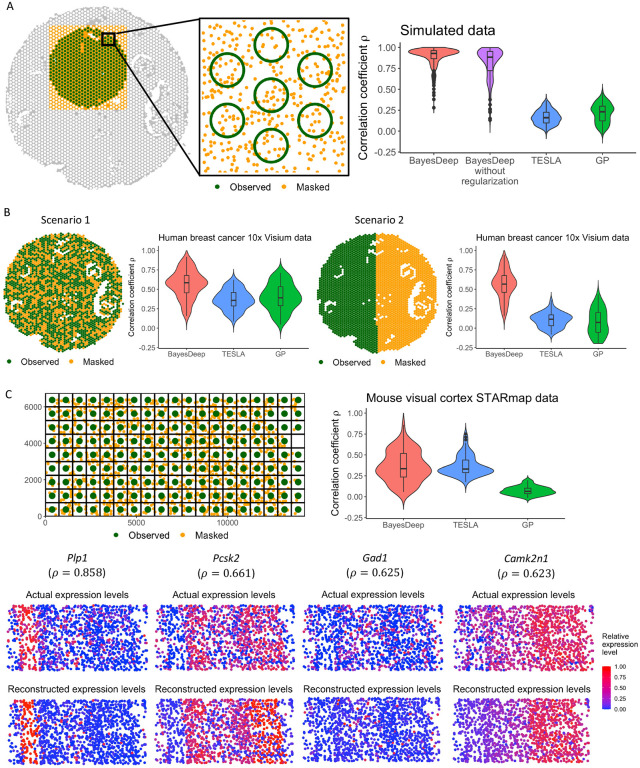
Figure 2.
Overview of model validation, including the validation settings and evaluation results in terms of the Pearson correlation coefficients between the actual and predicted gene expression for BayesDeep, TESLA, and Gaussian Process (GP), respectively. The validation is stratified into three distinct data: A. Simulated data at the spot resolution; B. Human breast cancer 10x Visium data at the spot resolution; C. Mouse visual cortex STARmap data at the single-cell resolution.

