

Abstract
In digital breast tomosynthesis (DBT), projection images are acquired as the x-ray tube rotates in the plane of the chest wall. We constructed a prototype next-generation tomosynthesis (NGT) system that has an additional component of tube motion in the perpendicular direction (i.e., posteroanterior motion). Our previous work demonstrated the advantages of the NGT system using the Defrise phantom. The reconstruction shows higher contrast and fewer blurring artifacts. To expand upon that work, this paper analyzes how image quality can be further improved by customizing the motion path of the x-ray tube based on the object being imaged. In simulations, phantoms are created with realistic 3D breast outlines based on an established model of the breast under compression. The phantoms are given an internal structure similar to a Defrise phantom. Two tissue types (fibroglandular and adipose) are arranged in a square-wave pattern. The reconstruction is analyzed as a binary classification task using thresholding to segment the two tissue types. At various thresholds, the classification of each voxel in the reconstruction is compared against the phantom, and receiver operating characteristic (ROC) curves are calculated. It is shown that the area under the ROC curve (AUC) is dependent on the x-ray tube trajectory. The trajectory that maximizes AUC differs between phantoms. In conclusion, this paper demonstrates that the acquisition geometry in DBT should be personalized to the object being imaged in order to optimize the image quality.
Keywords: Digital Breast Tomosynthesis, Mammography, X-Ray Imaging, Digital Imaging, Defrise Phantom, Image Quality, Image Reconstruction, Receiver Operating Characteristic Curve
1. INTRODUCTION
The Defrise phantom is a test object for evaluating image quality in cone-beam computed tomography (CT). The phantom consists of multiple disks, which are spaced along the direction perpendicular to the plane of source motion. In the reconstruction, there is a cone-beam artifact along this direction; the spacings between the disks are not properly visualized at positions distal to the plane of source motion.1
One application of the Defrise phantom is to demonstrate the advantage of new acquisition geometries for CT. For example, in the work of Becker et al., a multisource system for dedicated breast CT was evaluated.2 The system was built with five sources, which were spaced in 2.0 cm increments along the direction of the cone-beam artifact. The contrast between disks was used to quantify image quality. With multisource scanning, there is a broader range of positions over which contrast is within detectable limits, yielding an improvement in image quality over single-source scanning.
Our previous work showed that the Defrise phantom can also be used to evaluate image quality in digital breast tomosynthesis (DBT).3,4 We demonstrated the existence of a cone-beam artifact along the posteroanterior (PA) direction, which is perpendicular to the motion of the source. To show that image quality can be improved, we later constructed a prototype next-generation tomosynthesis (NGT) system, which is capable of source motion with an additional degree of freedom in the PA direction.5,6 Although a single source is used in the NGT system, our strategy for improving the image quality is similar to the one used by Becker et al.2 in that source positions are introduced along the direction of the cone-beam artifact.
The latest CT scanners incorporate the newest trends in personalized medicine. In point-of-care CT, the scan orbit is customized to the clinical task and body habitus.8–14 The purpose of this paper is to demonstrate that the acquisition settings in DBT also need to be personalized to each patient. We model virtual Defrise phantoms that are created in the shape of the 3D breast outline under compression.7 Various acquisition geometries are simulated for each phantom. This paper shows that a given scan motion will not benefit all phantoms the same way. The best image quality is achieved by customizing the motion of the source to the dimensions of the phantom.
2. METHODS
2.1. Phantom Model
Four phantoms were considered for the purpose of this study. The 3D phantom outlines were created based on previous work modeling the breast under compression.7 Figure 1 shows the output of the MATLAB® software developed by that work. Random phantoms with “advanced 3D curvature” were generated by specifying thicknesses of 45, 55, 75, and 85 mm in this software. Table 1 shows the chest-wall to nipple distance (CND) for each phantom. We truncated some slices at the superior surface of each phantom, as we did in our previous work15, since the shape of the breast outline was not representative of a breast under compression in these slices. More specifically, three slices in phantom #1, four slices in phantom #2, five slices in phantom #3, and six slices in phantom #4 were truncated. The resultant thicknesses of each phantom are summarized in Table 1.
Figure 1.
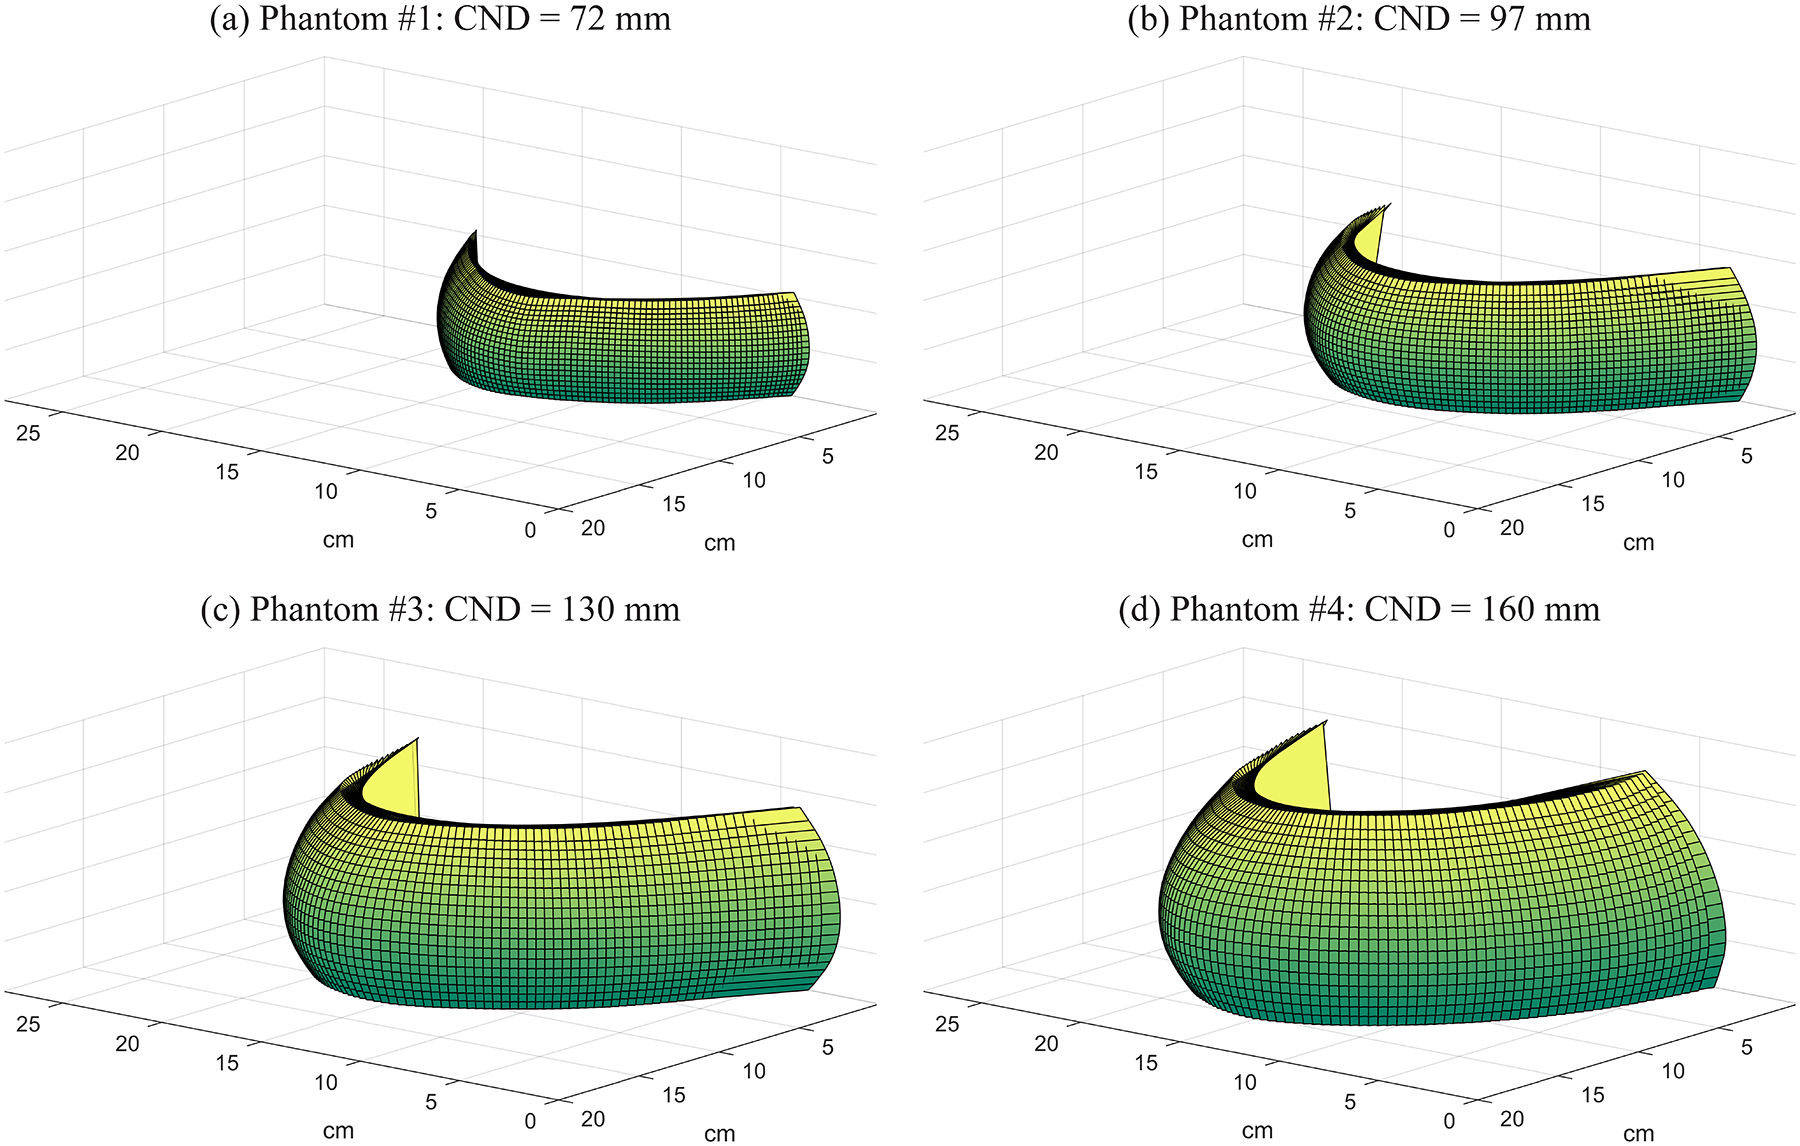
Breast outlines under compression are shown for four phantoms using the model of Rodríguez-Ruiz et al.7
Table 1.
Four phantoms with different sizes and shapes were analyzed in this simulation study.
| Phantom | CND: Chest-Wall to Nipple Distance (mm) | Thickness (mm) | kV | mAs |
|---|---|---|---|---|
| #1 | 72 | 40 | 29 | 45 |
| #2 | 97 | 50 | 31 | 52 |
| #3 | 130 | 69 | 35 | 72 |
| #4 | 160 | 77 | 37 | 70 |
The 3D breast outline was initially created with 1.0 mm3 voxels, and then up-sampled to 0.50 mm3 voxels. Each phantom was given internal structure consisting of two tissue types (fibroglandular and adipose) arranged in a square-wave pattern with a frequency of 0.17 mm−1 oriented in the PA direction. This frequency is chosen based on our previous work on the Defrise phantom.3,4
2.2. X-Ray Projection Images
X-ray projection images were simulated with ray-tracing software developed for virtual clinical trials.16 For the purpose of this study, there were no sources of noise or blurring. Also, the AXS-2430 detector (Analogic Canada Corporation, Montreal, Quebec, Canada) was simulated, since this is the detector used in the NGT system. This detector has 0.085 mm pixels and an active area of 304.64 mm × 239.36 mm.
The kV and mAs for each projection image were determined from a table developed by Feng and Sechopoulos for the automatic exposure control (AEC) settings in DBT for a W/Al target filter combination.17 According to that table, the kV is dependent on the compressed breast thickness. The kV for each phantom was determined by linear interpolation. This result was rounded to the nearest integer. Next, the mAs was determined based on the kV using linear interpolation, assuming a glandular fraction of 50%.
Figure 2 illustrates an example of a source motion supported by the NGT system. There are components of motion in both the conventional tube travel direction (x) and the PA direction (y). The source can be positioned at arbitrary points in these two directions; for example, along the outline of an ellipse. The trajectory shown in Figure 2 consists of two concentric half-ellipses. The semi-axis lengths for the outer ellipse are a and b in the x and y directions, respectively. These parameters control the range of source motion in each direction. The lengths of the axes of the inner ellipse are modeled to be half of these values.
Figure 2.
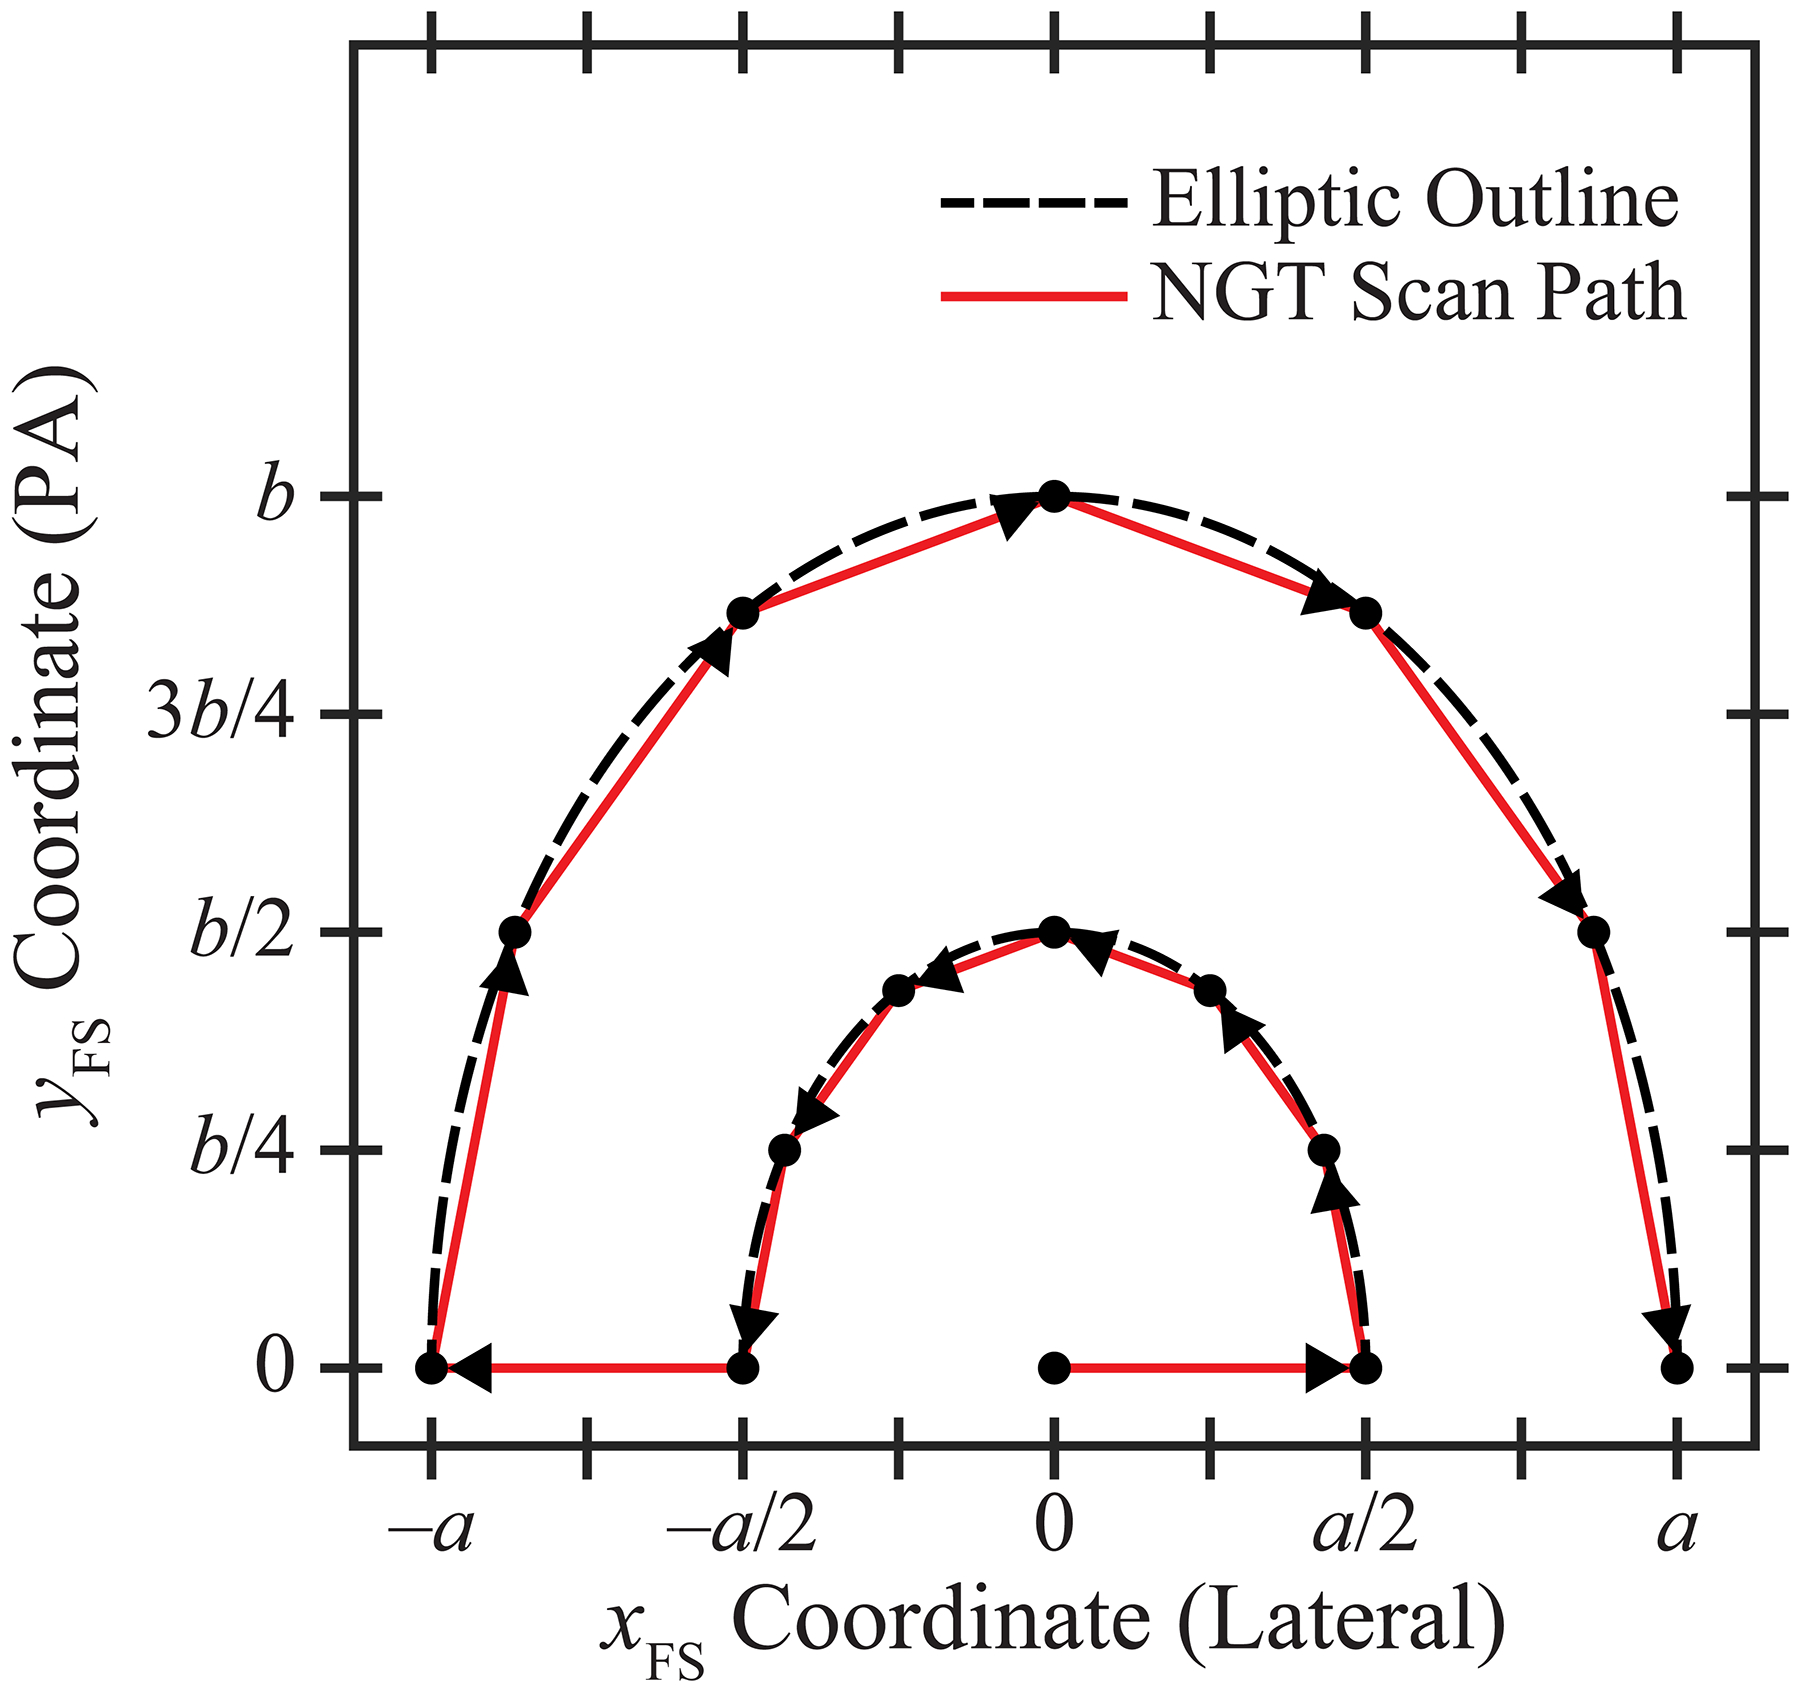
In this trajectory, there are five source positions along the chest wall and 10 additional source positions in the PA direction. The parameters a and b control the range of source motion in each direction.
For the purpose of this paper, we assume that the source positions are displaced around each half-ellipse in 30° increments and that there is an additional source position at the centroid of the ellipses. Hence there are 15 projection images. We define the centroid at the midpoint of the chest wall; this matches the central source position in a conventional DBT scan. The x- and y-coordinates of the focal spot (FS) can be described in terms of the projection number (n) based on the equations
| (1) |
| (2) |
where n varies between 1 and 15 in integer steps. Figure 2 illustrates the ordering of the FS positions, as shown by the arrows. In all projections, the source-to-support distance is 621.0 mm and the source-to-image distance (SID) is 652.0 mm.
If Eqs. (1)–(2) were used in the special case b = 0, there would be three overlapping FS coordinates at the point (0, 0); i.e., the midpoint of the chest wall. For this reason, a different motion needs to be considered to simulate the conventional acquisition geometry. In this paper, this motion is simulated with equal spacing between source positions; namely, xFS = a · (n – 8) / 7. The range of source motion is thus 2a in the x direction, similar to Eq. (1). It should be noted that the SID is held constant in the NGT system for all acquisition geometries. Therefore, the simulation of the conventional motion differs from a clinical system in which the source rotates in a circular arc in the plane of the chest wall.
For these simulations, a is varied between 50.0 and 150.0 mm in 5.0 mm increments (or 21 steps), and b is varied between 0 and 200.0 mm in 10.0 mm increments (also 21 steps). This results in 441 acquisition geometries that are simulated. We determine the optimum acquisition geometry for each phantom using the approach described in Section 2.3.
2.3. Image Analysis
Reconstructions were calculated with Briona™ (Real Time Tomography, LLC, Villanova, PA) with an in-plane pixelation of 0.085 mm × 0.085 mm and a slice spacing of 0.50 mm. Subsequently, the reconstructions were re-scaled to the voxel size of the phantom with bicubic interpolation.
Receiver operating characteristic (ROC) curves were then calculated by using thresholding to segment the two tissue types.18 Each voxel was classified as fibroglandular tissue (FGT) if the signal exceeds a user-specified threshold. All other voxels were classified as adipose tissue (AT). We define the true positive rate (TPR) as the ratio of the number of voxels classified correctly as FGT to the total number of fibroglandular voxels in the input phantom. The false positive rate (FPR) is the ratio of the number of voxels classified incorrectly as FGT to the total number of adipose voxels in the input phantom. ROC curves were generated by calculating TPR and FPR at all possible thresholds. The area under the ROC curve (AUC) was calculated as a figure-of-merit to identify the acquisition geometry that maximizes the image quality for each phantom.
3. RESULTS
3.1. Results for Conventional and NGT Designs
Figure 3 illustrates the central slice in the reconstruction for the conventional and NGT designs for one phantom (#2). Both figures presume that the range of source motion in the x direction is 200.0 mm; i.e., a = 100.0 mm. As one would expect from previous work3–6, there is a blurring artifact at positions distal to the chest wall in the conventional design [Figure 3(a)]. It is difficult to discern the spacings between the two tissue types at these positions. By contrast, in the NGT design with PA source motion (b = 90 mm), the relative contrast is improved [Figure 3(b)].
Figure 3.

(a) In the central slice of the reconstruction for phantom #2, there is loss of image quality in the PA direction in the conventional design, as shown by the blurring artifact. (b) The NGT design offers better image quality in the PA direction (b = 90 mm).
To analyze these results more quantitatively, the signal in each tissue type is visualized with a histogram in Figure 4. These histograms are created using all slices in the reconstruction, not just the central slice shown in Figure 3. The signal (I) has been re-scaled with Z-score normalization based on the mean (μ) and standard deviation (σ) for each tissue type. Eq. (3) describes this transformation. The origin is shifted halfway between the means of each distribution. Also, the signal is normalized by the pooled standard deviation.
| (3) |
Figure 4.
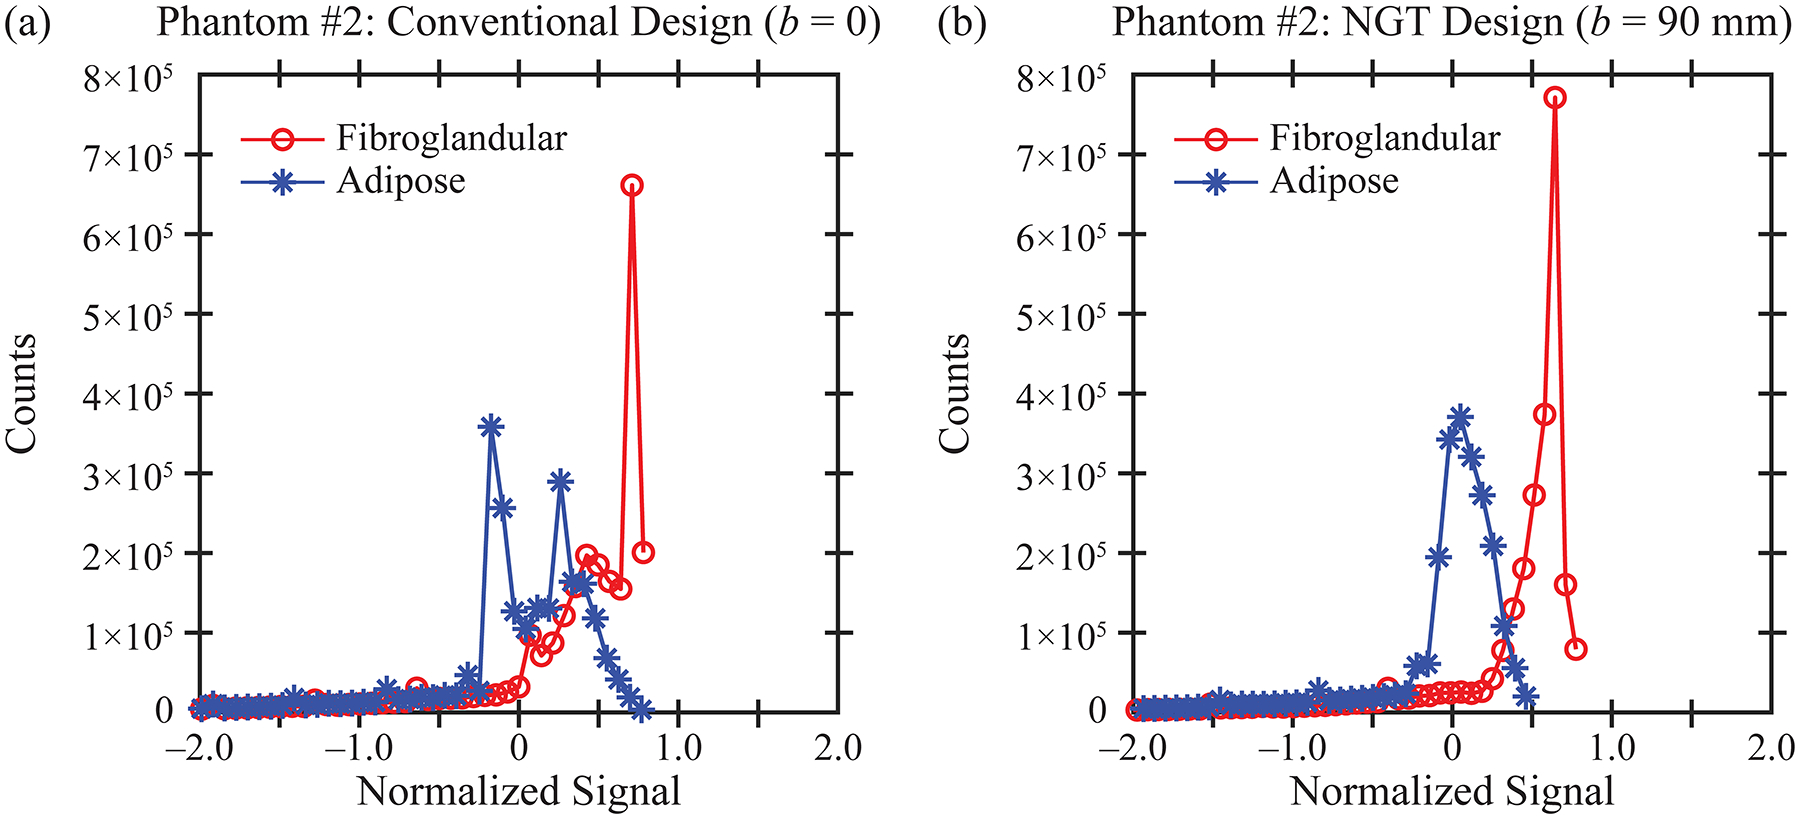
Using the reconstruction obtained with phantom #2, the histograms for the signal in each tissue type (fibroglandular and adipose) are calculated. The separation between the two tissue types is more pronounced in the NGT design (b) than in the conventional design (a).
In Figure 4, the distributions are plotted to within ± two units of the pooled standard deviation. As can be seen from this figure, the histograms are highly skewed to the left, and therefore, the tails in the extreme left have been truncated.
For image quality to be high, there needs to be a clear separation between the FGT and AT histograms. This separation can be quantified in terms of a ROC curve [Figure 5(b)]. Each point on the ROC curve is calculated using a different threshold to segment the two tissue types. The NGT design for which b = 90 mm offers an improvement in image quality (AUC = 0.85) relative to the conventional design (AUC = 0.76). In Section 3.2, AUC is analyzed in all 441 acquisition geometries in order to identify the optimum scan parameters for each phantom.
Figure 5.
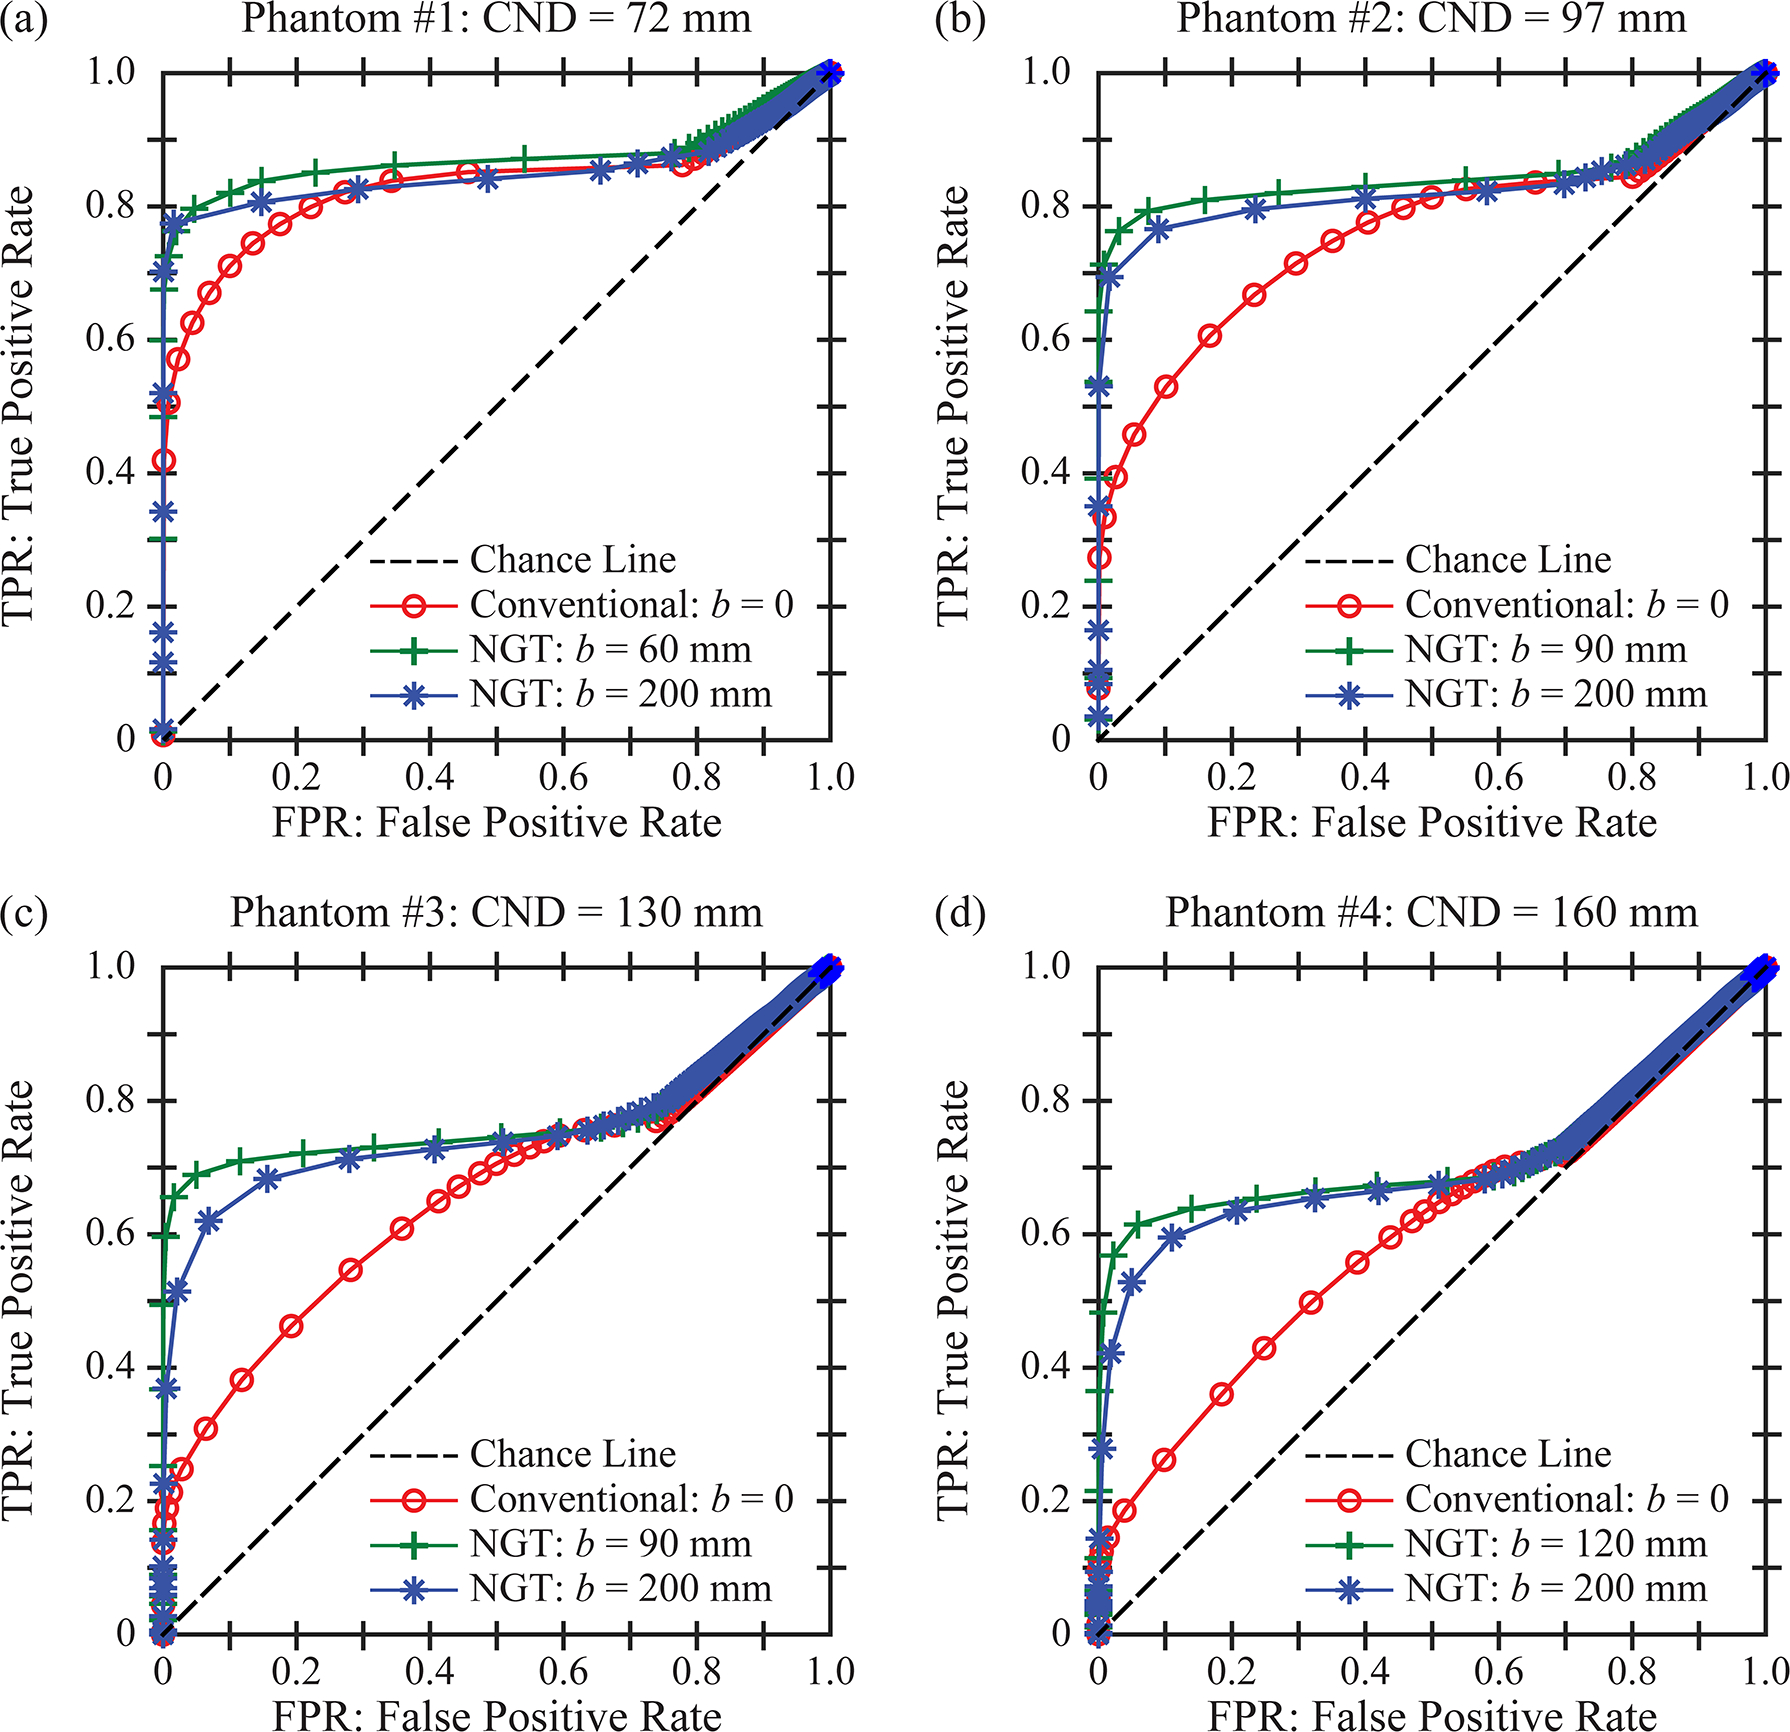
The reconstruction is analyzed as a binary classification task. A threshold is used to segment the two tissue types (fibroglandular and adipose). For each phantom, ROC curves are calculated for three acquisition geometries by varying the threshold, assuming a = 100.0 mm. The three acquisition geometries differ in terms of the range of PA source motion; i.e., the conventional design, the NGT design with the highest AUC, and the NGT design with the broadest range of PA source motion.
3.2. Optimization of the Acquisition Geometry
Figure 6 shows a surface plot of AUC as a function of the scan parameters (a and b) for each phantom. These plots first illustrate that the image quality is effectively independent of the parameter a; i.e., the range of source motion perpendicular to the input frequency. The parameter b, which controls the range of motion in the PA direction, has a more pronounced effect on AUC.
Figure 6.
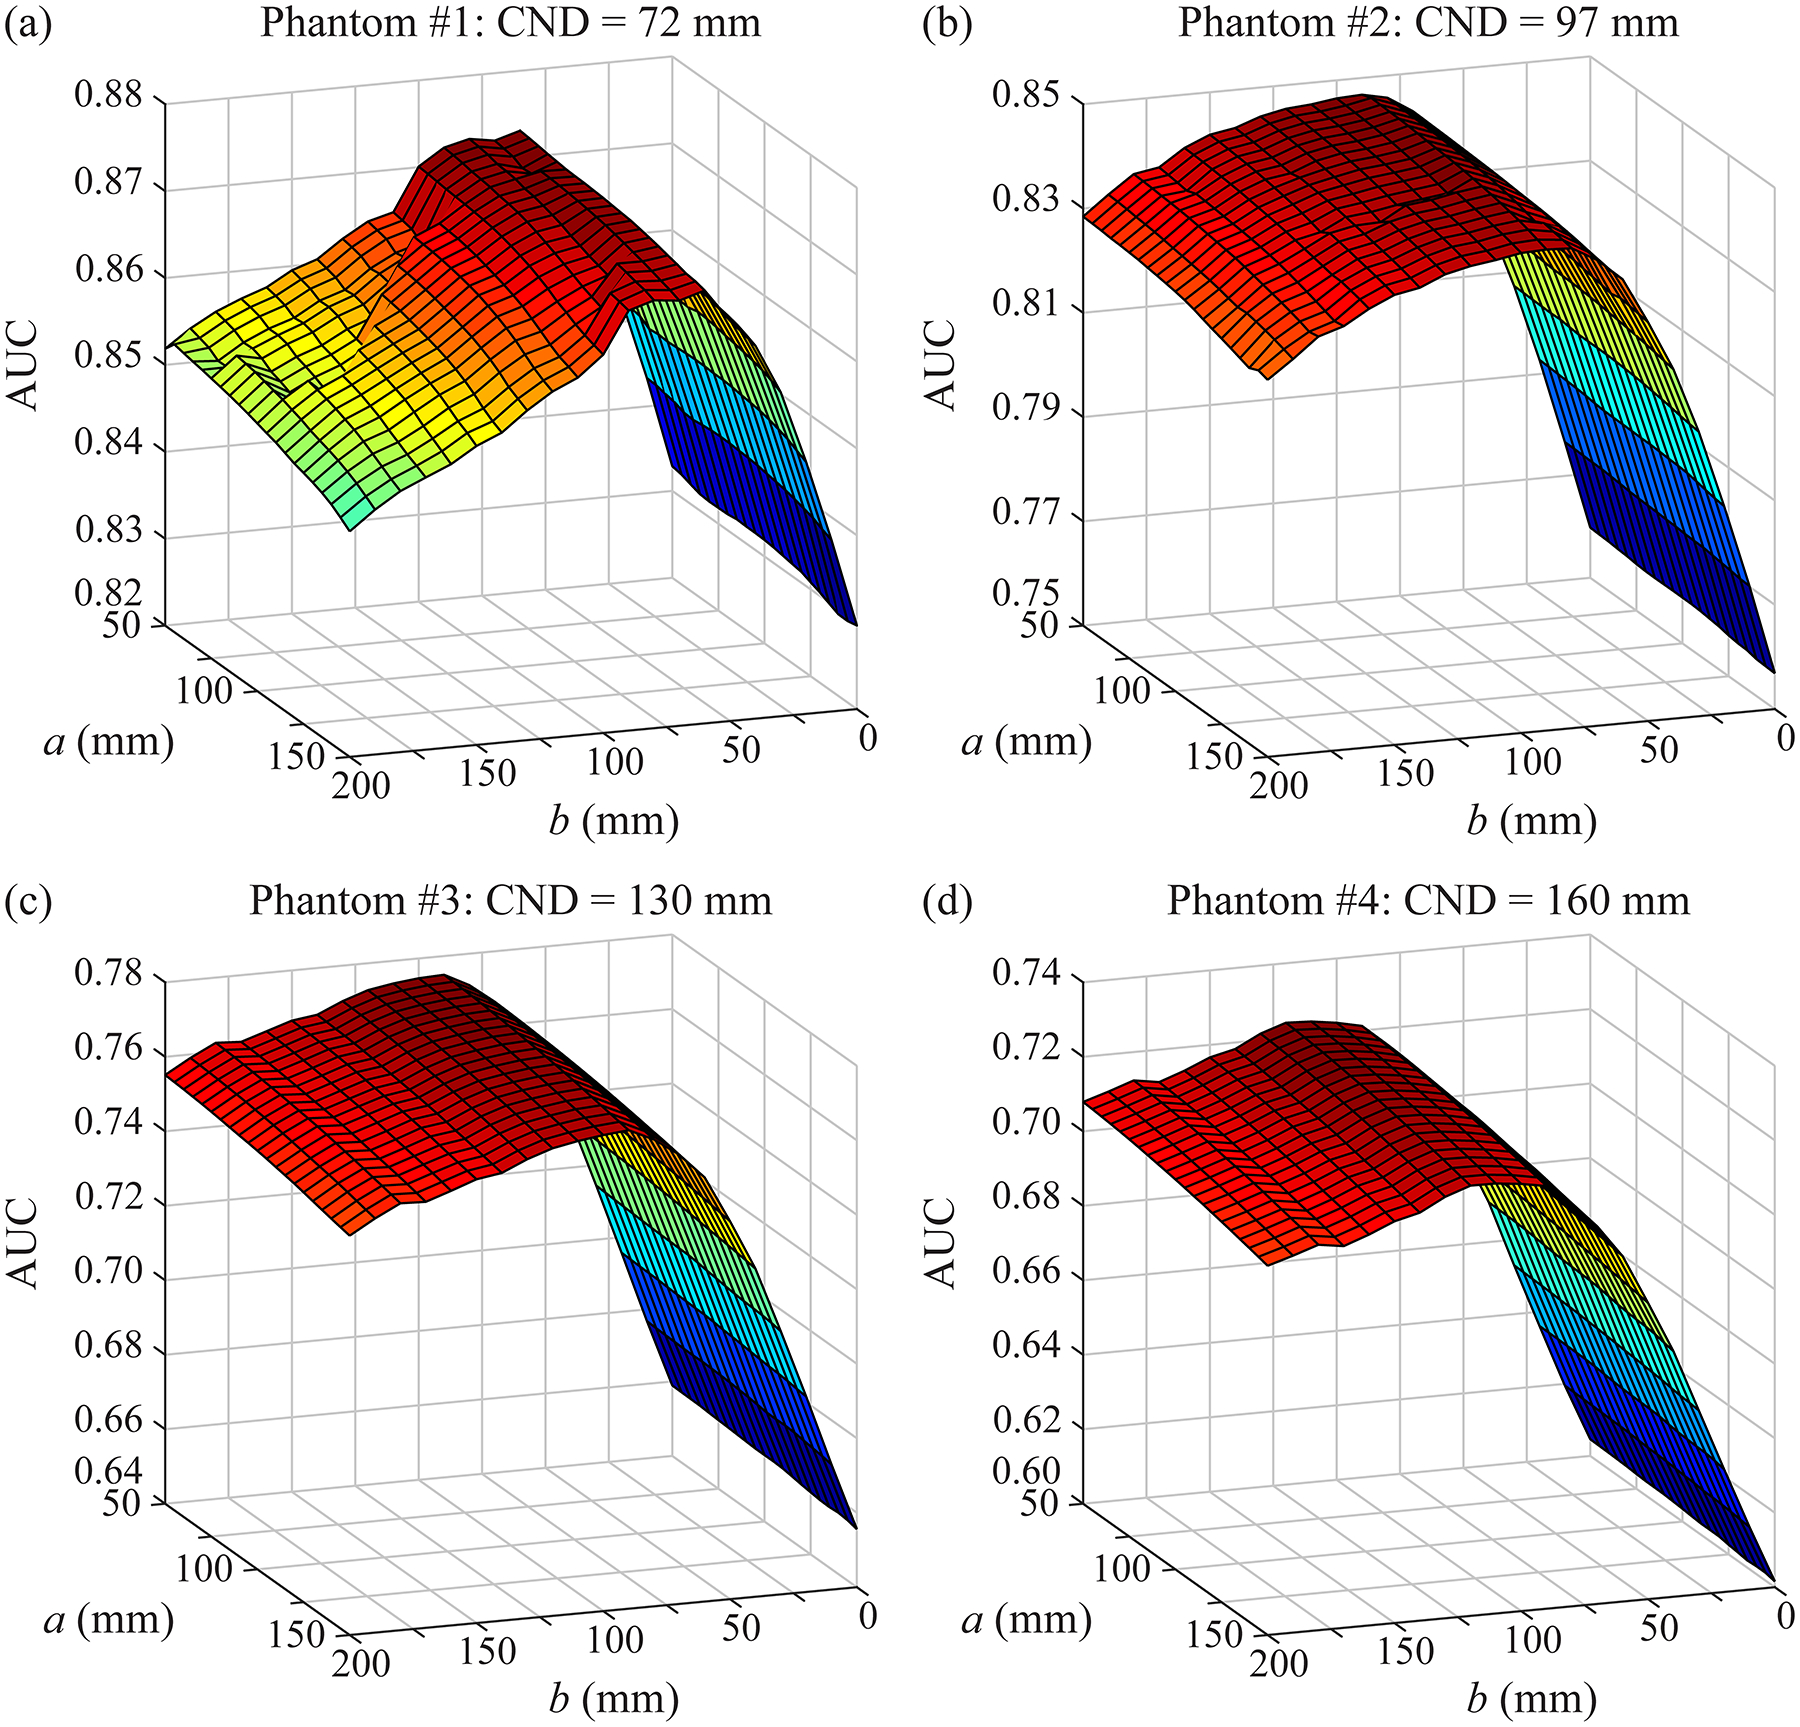
For each phantom, the AUC is plotted as a function of the scan parameters. These results are used to identify the optimum acquisition geometry for each phantom. In these simulations, the input frequency is oriented in the PA direction. The parameter a controls the range of source motion in the perpendicular direction; this parameter has only a small effect on AUC. By contrast, the parameter b needs to be customized to each phantom to optimize the image quality. It should be noted that the range of values in the vertical axis differs between subplots.
Figure 6 can be used to calculate the value of b that maximizes AUC. Assuming that a = 100.0 mm, the optimum values of b are 60, 90, 90, and 120 mm for phantoms #1 to #4, respectively. These optimum values are correlated with CND; Pearson’s correlation coefficient is 94%. These results illustrate the benefit of personalizing the source motion based on the dimensions of the phantom.
For each phantom, the ROC curve for the optimum geometry is compared against the conventional geometry in Figure 5. We continue to make the assumption that a = 100.0 mm. As shown, there is an improvement in AUC; namely, ΔAUC = 0.040, 0.088, 0.115, and 0.118 for phantoms #1 to #4, respectively. Figures 5–6 demonstrate that the phantoms with larger dimensions have inherently lower AUC. This result is expected from previous work, which showed that increasing the thickness of the phantom results in less relative contrast in the reconstruction.4
In addition, the ROC curves for the broadest range of PA motion (b = 200.0 mm) are shown in Figure 5. This motion is also characterized by an improvement over the conventional geometry; namely, ΔAUC = 0.019, 0.068, 0.095, and 0.101 for the four respective phantoms.
4. DISCUSSION AND CONCLUSION
In this paper, virtual Defrise phantoms are created in the shape of breasts under compression. There are two tissue types in the phantom (FGT and AT). Consequently, the reconstruction can be analyzed voxel-by-voxel as a binary classification task with a ROC curve. We find that the source motion needs to be customized to the dimensions of the phantom to maximize the AUC. Specifically, as the CND increases, the source needs to traverse a broader range of motion in the PA direction. Since the scan time is proportionate with the path length of the source motion, these results suggest that the phantoms with the broadest CND will require the longest scan time.
Figures 5–6 show that the improvement over the conventional geometry is preserved as the range of PA motion increases beyond the optimum value. However, this comes with the trade-off of increasing the scan time, and therefore, increasing the potential for blurring due to patient motion.19 Another disadvantage of a longer scan time is prolonging the discomfort associated with breast compression.
One limitation of this paper is that, based on the orientation of the input frequency, image quality is investigated in only one direction (PA). There was no analysis of image quality in the conventional tube travel direction (x). Previous work has demonstrated that image quality is indeed dependent on the range of source motion in this direction. For example, a narrow range of source motion has been shown to be beneficial in calcification imaging.20 Future work needs to investigate how the source motion can be optimized based on the imaging task.
The results of this paper were determined using a limited number of phantoms. In future work, additional phantoms with different sizes, shapes, and internal compositions should be analyzed, including anthropomorphic phantoms21–23 with more complex fibroglandular distributions. Future work also needs to investigate whether the CND could be estimated from a low-dose scout image; in a clinical exam, the CND is not known a priori as is the case with a phantom. The source motion could be customized around the dimensions obtained from the scout image.
ACKNOWLEDGEMENT
The authors acknowledge the early work of Margaret Nolan, Elizabeth Kobe, Sushmitha Yarrabothula, and Lucy Chai at the University of Pennsylvania on this topic. We also thank Johnny Kuo, Susan Ng, and Peter Ringer of Real Time Tomography for technical assistance with Briona™. Andrew D. A. Maidment is a shareholder of Real Time Tomography, and is a member of the scientific advisory board.
Support was provided by the following grants: W81XWH-18-1-0082 from the Department of Defense Breast Cancer Research Program, IRSA 1016451 from the Burroughs Wellcome Fund, 1R01CA196528 from the National Institute of Health, and IIR13264610 from Susan G. Komen®. In addition, equipment support was provided by Analogic Inc., Barco NV, and Real Time Tomography. The content is solely the responsibility of the authors and does not necessarily represent the official views of the funding agencies.
REFERENCES
- 1.Hsieh J. Chapter 10: Multislice and Cone-beam CT. Computed Tomography: Principles, Design, Artifacts, and Recent Advances. Third ed. Bellingham, WA: SPIE Press; 2015:423–486. [Google Scholar]
- 2.Becker AE, Hernandez AM, Schwoebel P, Boone JM. Multisource x-ray system for artifact reduction in dedicated breast CT. Paper presented at: 14th International Workshop on Breast Imaging (IWBI 2018) 2018; Atlanta, GA. [Google Scholar]
- 3.Acciavatti RJ, Chang A, Woodbridge L, Maidment ADA. Optimizing the Acquisition Geometry for Digital Breast Tomosynthesis Using the Defrise Phantom. Paper presented at: SPIE Medical Imaging 2014; San Diego, CA. [Google Scholar]
- 4.Acciavatti RJ, Mannherz W, Nolan M, Maidment ADA. An Alternate Design for the Defrise Phantom To Quantify Resolution in Digital Breast Tomosynthesis. Paper presented at: SPIE Medical Imaging 2017; Orlando, FL. [Google Scholar]
- 5.Maidment TD, Vent TL, Ferris WS, Wurtele DE, Acciavatti RJ, Maidment ADA. Comparing the Imaging Performance of Computed Super Resolution and Magnification Tomosynthesis. Paper presented at: SPIE Medical Imaging 2017; Orlando, FL. [Google Scholar]
- 6.Eben JE, Vent TL, Choi CJ, et al. Development of a Next Generation Tomosynthesis System. Paper presented at: SPIE Medical Imaging 2018; Houston, TX. [Google Scholar]
- 7.Rodriguez-Ruiz A, Agasthya GA, Sechopoulos I. The compressed breast during mammography and breast tomosynthesis: in vivo shape characterization and modeling. Physics in Medicine and Biology. 2017;62:6920–6937. [DOI] [PMC free article] [PubMed] [Google Scholar]
- 8.Siewerdsen JH, Moseley DJ, Burch S, et al. Volume CT with a flat-panel detector on a mobile, isocentric C-arm: Pre-clinical investigation in guidance of minimally invasive surgery. Medical Physics. 2005;32(1):241–254. [DOI] [PubMed] [Google Scholar]
- 9.Schafer S, Nithiananthan S, Mirota DJ, et al. Mobile C-arm cone-beam CT for guidance of spine surgery: Image quality, radiation dose, and integration with interventional guidance. Medical Physics. 2011;38(8):4563–4574. [DOI] [PMC free article] [PubMed] [Google Scholar]
- 10.Dang H, Stayman JW, Sisniega A, et al. Statistical reconstruction for cone-beam CT with a post-artifact-correction noise model: application to high-quality head imaging. Physics in Medicine and Biology. 2015;60:6153–6175. [DOI] [PMC free article] [PubMed] [Google Scholar]
- 11.Sisniega A, Zbijewski W, Xu J, et al. High-fidelity artifact correction for cone-beam CT imaging of the brain. Physics in Medicine and Biology. 2015;60:1415–1439. [DOI] [PubMed] [Google Scholar]
- 12.Xu J, Sisniega A, Zbijewski W, et al. Modeling and design of a cone-beam CT head scanner using task-based imaging performance optimization. Physics in Medicine and Biology. 2016;61:3180–3207. [DOI] [PubMed] [Google Scholar]
- 13.Ouadah S, Jacobson M, Stayman JW, Ehtiati T, Weiss C, Siewerdsen JH. Task-Driven Orbit Design and Implementation on a Robotic C-Arm System for Cone-Beam CT. Paper presented at: SPIE Medical Imaging 2017; Orlando, FL. [DOI] [PMC free article] [PubMed] [Google Scholar]
- 14.Gang GJ, Stayman JW, Ehtiati T, Siewerdsen JH. Task-driven image acquisition and reconstruction in cone-beam CT. Physics in Medicine and Biology. 2015;60:3129–3150. [DOI] [PMC free article] [PubMed] [Google Scholar]
- 15.Acciavatti RJ, Rodriguez-Ruiz A, Vent TL, et al. Analysis of Volume Overestimation Artifacts in the Breast Outline Segmentation in Tomosynthesis. Paper presented at: SPIE Medical Imaging 2018; Houston, TX. [DOI] [PMC free article] [PubMed] [Google Scholar]
- 16.Barufaldi B, Higginbotham D, Bakic PR, Maidment ADA. OpenVCT: A GPU-Accelerated Virtual Clinical Trial Pipeline for Mammography and Digital Breast Tomosynthesis. Paper presented at: SPIE Medical Imaging 2018; Houston, TX. [Google Scholar]
- 17.Feng SSJ, Sechopoulos I. Clinical Digital Breast Tomosynthesis System: Dosimetric Characterization. Radiology. 2012;263(1):35–42. [DOI] [PMC free article] [PubMed] [Google Scholar]
- 18.Bakic PR, Ng S, Ringer P, Carton A-K, Conant EF, Maidment ADA. Validation and Optimization of Digital Breast Tomosynthesis Reconstruction using an Anthropomorphic Software Breast Phantom. Paper presented at: SPIE Medical Imaging 2010; San Diego, CA. [Google Scholar]
- 19.Acciavatti RJ, Maidment ADA. Optimization of Continuous Tube Motion and Step-and-Shoot Motion in Digital Breast Tomosynthesis Systems with Patient Motion. Paper presented at: SPIE Medical Imaging 2012; San Diego, CA. [Google Scholar]
- 20.Chan H-P, Goodsitt MM, Helvie MA, et al. Digital Breast Tomosynthesis: Observer Performance of Clustered Microcalcification Detection on Breast Phantom Images Acquired with an Experimental System Using Variable Scan Angles, Angular Increments, and Number of Projections Views. Radiology. 2014;273(3):675–685. [DOI] [PMC free article] [PubMed] [Google Scholar]
- 21.Pokrajac DD, Maidment ADA, Bakic PR. Optimized generation of high resolution breast anthropomorphic software phantoms. Medical Physics. 2012;39(4):2290–2302. [DOI] [PMC free article] [PubMed] [Google Scholar]
- 22.Chui JH, Pokrajac DD, Maidment ADA, Bakic PR. Towards Breast Anatomy Simulation Using GPUs. Lecture Notes in Computer Science. 2012;7361:506–513. [Google Scholar]
- 23.Bakic PR, Pokrajac DD, Caro RD, Maidment ADA. Realistic Simulation of Breast Tissue Microstructure in Software Anthropomorphic Phantoms. Lecture Notes in Computer Science. 2014;8539:348–355. [Google Scholar]