

Summary
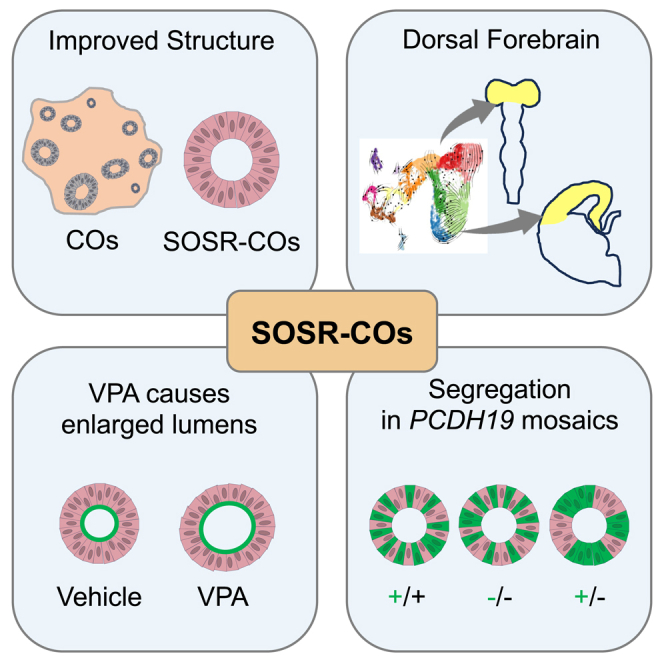
Brain organoid methods are complicated by multiple rosette structures and morphological variability. We have developed a human brain organoid technique that generates self-organizing, single-rosette cortical organoids (SOSR-COs) with reproducible size and structure at early timepoints. Rather than patterning a 3-dimensional embryoid body, we initiate brain organoid formation from a 2-dimensional monolayer of human pluripotent stem cells patterned with small molecules into neuroepithelium and differentiated to cells of the developing dorsal cerebral cortex. This approach recapitulates the 2D to 3D developmental transition from neural plate to neural tube. Most monolayer fragments form spheres with a single central lumen. Over time, the SOSR-COs develop appropriate progenitor and cortical laminar cell types as shown by immunocytochemistry and single-cell RNA sequencing. At early time points, this method demonstrates robust structural phenotypes after chemical teratogen exposure or when modeling a genetic neurodevelopmental disorder, and should prove useful for studies of human brain development and disease modeling.
Keywords: neural tube defects, PCDH19, epilepsy, induced pluripotent stem cells, neurodevelopment, cortical spheroid, neurulation, valproic acid, mosaicism, dorsal forebrain
Graphical abstract
Highlights
-
•
Robust protocol for producing single-rosette brain organoids
-
•
Reproducible cell diversity restricted to forebrain identity
-
•
Clear neural tube defect structural phenotypes with teratogen exposure such as valproic acid
-
•
Mosaic PCDH19 segregation phenotype similar to rodent disease modeling studies
In this article, Tidball and colleagues characterize a new single-rosette brain organoid model. They use this model to identify robust structural phenotypes of early brain developmental abnormalities, including drug-induced neural tube defects and PCDH19 clustering epilepsy cell segregation.
Introduction
In 2008, Yoshiki Sasai’s group first developed 3-dimensional cortical structures from mouse embryonic stem cells (ESCs) and later from human ESCs (hESCs) (Eiraku et al., 2008; Kadoshima et al., 2013). This method patterns a sphere of ESCs called an embryoid body (EB) into neuroepithelial tissue. Cells self-organize within the EB to form cortical neural rosette structures. These organizing centers are radially structured with a central lumen and represent in vitro correlates of neural tube formation. While embryos only have a single neural tube, these 3-dimensional (3D) in vitro models contain many organizing centers (i.e., rosettes). Other groups developed similar techniques to generate what began to be termed human brain or cerebral organoids, but in each case multiple rosettes form (Lancaster et al., 2013; Paşca et al., 2015).
Cortical organoids have been used to study human brain development, explore network formation and neuronal electrophysiology, model genetic disorders and CNS-relevant viral infections, and for toxicology studies. However, exploring structural changes in cortical organoids is challenging due to variability in morphology. The structural heterogeneity and multiple organizing centers (neural rosettes) seen in brain organoids do not occur in some non-neural organoid systems. For example, intestinal (Spence et al., 2011) and pancreatic (Huang et al., 2015) organoids have single lumen structures around which they organize. One main difference between these methods is that non-CNS organoids typically begin with patterning a 2-dimensional (2D) culture of pluripotent stem cells followed by 3D induction on a thick hydrogel of extracellular matrix (ECM) proteins. Similarly, in vivo neurodevelopment begins with patterning of the neural plate, a 2D structure, followed by neurulation to form the 3D neural tube. Therefore, we hypothesized that initiating brain organoid formation from a 2D neuroepithelium (Chambers et al., 2009) would result in brain organoids with a single neural rosette organizing center. To achieve single-rosette organoids, other groups have used micro-patterning with ECM hydrogel or manual isolation from 2D culture (Karzbrun et al., 2021; Knight et al., 2018; Lee et al., 2017; Wang et al., 2022). However, we sought a technique more readily accessible and scalable.
We developed a protocol for cutting small, equal-sized fragments of dual-SMAD inhibitor differentiated neuroepithelium and transferring them onto Geltrex, an ECM-like material. We found rapid self-organization of organoids with single luminal centers expressing apical markers. We call these structures self-organizing single-rosette cortical organoids (SOSR-COs) fitting with new consensus nomenclature guidelines (Pașca et al., 2022). The consistency in size and architecture of early SOSR-COs (day 6–20) allowed for refined measurements for modeling both neural tube defect (NTD)-like chemical teratogenic effects and a genetic neurodevelopmental disorder caused by mosaic expression of protocadherin-19 (PCDH19). At later time points, SOSR-COs continue inside-out lamination that occurs during cortical development and express markers of the normal complement of deep and superficial cortical layer neurons, followed by astrocytes.
Results
2D to 3D transition results in single-rosette brain organoids
We reasoned that starting with a human pluripotent stem cell (hPSC) monolayer might allow us to generate cortical organoids that initially develop with a single-rosette organizing center. Our previous 2D neuronal differentiations of induced PSCs (iPSCs) used four inhibitors (DMH1, XAV939, SB431542, and cyclopamine) to generate excitatory cortical-like neurons (Tidball et al., 2020). While most monolayer dual-SMAD inhibition protocols last 8–12 days (Chambers et al., 2009), we found consistent “rolling-up” and detachment of the monolayer between days 5–7 of differentiation. Therefore, we chose day 4 to initially test converting the 2D cultures to 3D by cutting the monolayer to reproducibly generate ∼125-μm squares that we replated onto a thick 100% Geltrex layer (Figures 1A–1E). Similar techniques have been used to induce 3D cultures since the 1980s (Barcellos-Hoff et al., 1989). Within 24 h, the neuroepithelial squares rounded up into spheres with a central apical lumen (Figure 1D and Video S1). Live-imaging of SOSR-CO formation with the apical lumen labeled with zonula occludens-1 (ZO-1)-EGFP demonstrated migration of fluorescence labeling from the edges to a central lumen in 6 h, a finding consistent with a neurulation-like event (Video S2). The efficiency of single lumen formation across three control human iPSC lines was 84% ± 9% at 6 days in vitro (Figures S1A–S1C). However, SOSR-COs with two lumens had an overall area that was 2.2 times larger than the average for single lumen SOSR-COs (Figure S1D, plotted as diameter), and a linear regression of the relationship between lumen number and SOSR-CO area showed a slope of 13,500 μm2 while the average area of single lumen SOSR-COs was 12,400 μm2 (Figure S1E). These data suggest that multiple lumens are caused by the fusion of multiple monolayer fragments and that the single neural rosette/lumen efficiency for individual fragments is higher than 84%.
Figure 1.

Two-dimensional to three-dimensional transition results in SOSR-COs demonstrating characteristics of early cortical development
(A) Schematic of SOSR-CO differentiation timeline. The top half describes the media components while the bottom half is the culture format.
(B–E) Phase micrographs of SOSR-COs at important stages including neuroepithelial monolayer (B), monolayer cutting (C), early SOSR-CO formation on extracellular matrix (D), and an SOSR-CO in suspension at day 14 (E).
(F–L) Confocal micrographs of whole-mount day 6 (F–H), day 8 (I and J), or day 13 (K and L) SOSR-COs immunostained for the designated proteins. (F’ and G’) Orthogonal sections of z series from corresponding confocal micrographs. (G) SOSR-COs labeled by ZO1-EGFP fusion protein and HCS CellMask Deep Red stain to fill all cells. (H) F-actin labeled with Phalloidin-Alexa488. (H and J) Arrowheads indicate mitotic cells at the apical surface labeled either for TPX2 or DNA.
(M–P) Confocal micrographs of cryosectioned SOSR-COs immunostained for neural markers on days 20–22. DCX indicates a doublecourtin promoter-driven mCherry. pVIM, phospo-vimentin (S55). Nuclei were stained with bis-benzamide (DNA, blue) for (I)–(P), and days of differentiation are indicated in the upper right corner of each image. All scale bars, 100 μm.
We next assessed SOSR-COs for the development of early ventricular zone (VZ), subventricular zone (SVZ), and cortical plate-like structures. Day 6–8 SOSR-COs showed homogeneous neuroepithelial marker expression of SOX2, PAX6, and Nestin with radially organized tubulin networks (Figures 1F, 1I, and 1K). The inner lumens labeled with the apical markers ZO-1 (Figures 1F and 1G) and PKC-z (Figures 1J and 1L) demonstrating correct inner apical polarization, and neural stem cells displayed potential interkinetic nuclear migration with mitotic cells (TPX2+) positioned at the apical surface (Figures 1H and 1J arrowheads). Orthogonal sections of confocal z series displayed a clearly 3D structure that is roughly spherical (Figures 1F’ and 1G’). On day 7, the SOSR-COs exhibited significant peripheral cell death, but the addition of CHIR99021 (CHIR) from days 6–10 blocked much of the cell death (data not shown) and allowed rapid SOSR-COs growth (Figure S1F). Similar CHIR pulses have been used previously in human brain organoid cultures to expand rosette size (Lancaster et al., 2017; Qian et al., 2016), and likewise, this pulse in SOSR-COs resulted in rapid expansion of the PAX6-positive cells while maintaining a large central lumen (Figures 1K and 1L).
Continued SOSR-CO maturation after removal from ECM
To allow continued expansion, we removed the SOSR-COs from Geltrex between days 9 and 11. A diameter >250 μm was optimal for cell survival and maintenance of the single rosette at this stage. The SOSR-COs were transferred to low-attachment 96-well plates for suspension culture with CHIR99021 included for the first 24 h to increase cell survival. Brain-derived neurotrophic factor (BDNF) and neurotrophin-3 (NT3) were added to the culture medium from this time until day 35. The 96-well plates allowed for the isolation of individual SOSR-COs to avoid unintentional fusion. Daily SOSR-CO live-imaging enabled longitudinal growth monitoring and demonstrated growth kinetic reproducibility between lines and batches for the first 35 days (Figure S1F). At 1-month, 3-month, and 5-month timepoints, SOSR-COs had mean diameters of 756 ± 7 μm, 976 ± 95 μm, and 1120 ± 290 μm, respectively (n = 3, 3, and 4 independent experiments, respectively, with three different iPSC lines [one line/experiment]) (Figure S1G).
SOSR-COs demonstrate lamination characteristic of human cortical development
Day 22 SOSR-COs displayed an evenly distributed layer of neurogenesis at the periphery as shown by the expression of mCherry driven by the doublecortin (DCX) promoter (Figures 1M–1O). A VZ-like region persisted in the interior adjacent to the lumen that consisted of PAX6+ cells with phospho-Vimentin-labeled dividing radial glia (RG) on the lumen surface (Figure 1O). A second proliferative zone appeared more superficially that likely reflects dividing intermediate progenitor cells (IPCs) in the nascent SVZ (Figure 1O) as the IPC marker TBR2 (EOMES) labeled a ring of cells in this same relative position (Figure 1P). The SOSR-COs continued to show a clear layer of TBR2+ cells just outside the PAX6+ VZ through 6 weeks in culture (Figures 2A–2C), similar to the TBR2+ SVZ of the developing cortex, and these cells were detected by singlecell RNA sequencing (scRNA-seq) up to at least 5 months (Figure 5R). Cells throughout the SOSR-COs expressed FOXG1 at 1 month (Figure 2D).
Figure 2.

SOSR-COs have neurodevelopmentally consistent cortical lamination patterns
(A–C) Three-, 4-, and 6-week SOSR-COs immunostained for the radial glial marker PAX6 (green) and intermediate progenitor marker TBR2 (red). ZO-1 immunolabeling outlines the apical lumen, and bis-benzamide nuclear stain (DNA) is in blue.
(D) Four-week SOSR-CO immunostained for the forebrain marker FOXG1 and deep-layer neuronal marker, CTIP2.
(E–H) SOSR-COs at several timepoints immunostained for Reelin (green), ZO1 (white in E and F), and HOPX (red in H). Bis-benzamide nuclear stain (DNA) is in blue.
(I–K) SOSR-COs immunostained for cortical layer markers CTIP2, SATB2, BRN2, or CUX1. The boxed areas in (G), (J), and (K) are magnified in the insets.
(L) Eight-week SOSR-COs begin to express the oRG marker HOPX with radially oriented processes.
(M and N) SOSR-COs at 5 months express the astrocyte marker GFAP (M) or S100β (N) on the outer edge and the mature neuronal marker MAP2ab throughout. Distinct phospho-vimentin (S55)-positive, S100β-negative cells are further indication of oRGs in 5-month SOSR-COs (N). Dashed curved lines in (D–F), (I), (K), and (L) mark the apical surface of the lumen, and dotted curved lines present in most panels denote the outer edge of the SOSR-COs. Scale bars, 100 μm.
Figure 5.

Single-cell RNA sequencing for three separate 5-month SOSR-COs from line AICS-0023
(A) UMAP plots for 5-month SOSR-COs with color coding of identified clusters.
(B) Bar graph showing the percentage of cells found in each cluster of the three 5-month SOSR-COs. The legend at right displays the cell type identity for each cluster.
(C) Cartoon of developing dorsal cortex layers with the color-coded identity of each cluster labeled.
(D–F) UMAP plots for each of the three 5-month SOSR-COs. Red dots are for the specified SOSR-CO while gray dots are from the other two SOSR-COs.
(G–D’) Individual UMAP plots of the specified genes for each of the three 5-month SOSR-COs. The region each marker identifies is listed above the gene name. Regions that are cluster identities are color-coded to match (A)–(C).
Neuronal layering of the SOSR-COs followed the typical pattern for cortical development. First, Reelin+ cells were found in the most superficial layer by week 6, persisted for at least 5 months, and remained located on the SOSR-COs periphery (Figures 2E–2H), analogous to Reelin+ Cajal-Retzius cells located in the marginal zone of the developing cortex. Reelin+ cells also appeared in 1-, 3-, and 5-month scRNA-seq data (Figures 3X, 4B’, and 5U). By 6 weeks, we observed many cells expressing the deep-layer cortical marker CTIP2 (BCL11B) peripheral to the PAX6+ proliferative zone with more superficial layer SATB2+ cells intermingled (Figure 2I). After 5 months, SOSR-COs show clear separation of CTIP2+ and SATB2+ cell layers, similar to other organoid protocols and developing human fetal brain (Qian et al., 2020), with robust expression of the upper layer neuronal markers BRN2 and CUX1 mainly peripheral to the SATB2+ layer (Figures 2J and 2K). Therefore, our model shows developmentally regulated timing and positioning of cortical layer markers consistent with in vivo human cortical development. However, due to loss of the single-rosette structure after about 1 month, the layering thickness was variable within and between organoids. Notably, the highest fidelity neurodevelopmentally normative layering occurred in SOSR-COs displaying continued expression of Reelin+ cells on their exterior, consistent with the importance of these cells in normal “inside-out” cortical development (Ogawa et al., 1995).
Figure 3.

Single-cell RNA sequencing for four separate 1-month SOSR-COs from line AICS-0023
(A) UMAP plots for 1-month SOSR-COs with color coding of identified clusters.
(B) Bar graph showing the percentage of cells found in each cluster of the four 1-month SOSR-COs. The legend at right displays the cell type identity for each cluster.
(C) Cartoon of developing telencephalon with the color-coded identity of each cluster labeled.
(D–G) UMAP plots for each of the four 1-month SOSR-COs. Red dots are for the specified SOSR-CO while gray dots are from the other three SOSR-COs.
(H–E’) Individual UMAP plots of selected genes from each of the four 1-month SOSR-COs. The region each marker identifies is listed above the gene names. Regions that are cluster identities are color-coded to match (A)–(C).
Figure 4.

Single-cell RNA sequencing for six separate 3-month SOSR-COs from line AICS-0023
(A) UMAP plots for 3-month SOSR-COs with color coding of identified clusters.
(B) Bar graph showing the percentage of cells found in each cluster of the six 3-month SOSR-COs. The legend at right displays the cell type identity for each cluster.
(C) Cartoon of developing dorsal telencephalon layers with the color-coded identity labeled for each cluster found in 3-month SOSR-COs.
(D–I) UMAP plots for each of the six 3-month SOSR-COs. Red dots are for the specified SOSR-CO while gray dots are from the other five SOSR-COs.
(J–G′) Individual UMAP plots of the specified genes for each of the six 3-month SOSR-COs. The region each marker identifies is listed above the gene names. Regions that are cluster identities are color-coded to match (A)–(C).
The presence of superficial cortical neurons should follow the appearance of outer RG (oRG), which primarily give rise to these neuronal subtypes in primate development (Nowakowski et al., 2016). Indeed, HOPX+ cells, a quintessential oRG marker, arose in 2-month SOSR-COs (Figure 2L). HOPX expression was minimal in 1-month SOSR-COs by scRNA-seq but was present in ∼30% of RG by 3 months and persisted for at least 5 months (Table S2; Figures 2H, 4X, and 5Q). Astrogenesis occurs very late in the developing cortex, and, likewise, we found little evidence of astrocytes present in 3-month SOSR-COs by scRNA-seq (Figures 4V and 4W). We did observe robust expression of the astrocyte markers GFAP and S100β in 5-month SOSR-COs, mostly on the periphery (Figures 2M and 2N). Many phospho-vimentin expressing cells were S100β negative on the interior of the 5-month SOSR-COs, again suggesting the presence of oRG (Figure 2N). While we see both markers and structures consistent with typical cortical development, after 1 month the SOSR-CO structures became somewhat more heterogeneous with multiple lumens/VZs in all SOSR-COs by 3 months and lack of lumens/VZs at 5 months (Figures S2A–S2D); nonetheless, our cortical layer marker expression demonstrated that normal developmental layering still occurred. The layering remained somewhat heterogeneous and inconsistent, similar to previous CO techniques, indicating that further advances in organoid technology are likely needed to maintain homogeneous structure in later stages of cortical organoid development.
SOSR-COs are electrophysiologically active and mature over time
We next examined whether neurons in 3- or 5-month SOSR-COs were electrophysiologically active. First, dissociated neurons from 3-month SOSR-COs were plated onto glass coverslips, labeled with lentiviral calcium/calmodulin-dependent protein kinase II-alpha (CAMKIIα)-driven EGFPs and cultured for 5 weeks. Whole-cell patch-clamp recordings showed that the neurons had depolarized resting membrane potentials (−33 ± 14 mV) but were able to fire trains of action potentials when injected with pulses of depolarizing current (Figures S3A–S3C). We also performed acute slice recordings on the SOSR-COs at 5.5 months (Figures S3D–S3I). These slices were from SOSR-COs labeled with a lentivirus containing a CamKIIα promoter-driven EGFP. At this time point, cells had more mature properties including more hyperpolarized resting membrane potentials (−51 ± 15 mV). We observed spontaneous action potential firing in two of six neurons, post-synaptic currents and were able to evoke firing with current injection. We next cultured SOSR-COs on multielectrode array recording plates at ∼100 days and recorded for approximately 8 weeks. The SOSR-COs showed an expected increase in action potential firing and burst activity over time (Figures S3J–S3M). Therefore, neurons from SOSR-COs are electrophysiologically active at 3 months and show increasing maturation and activity through at least 5 months.
SOSR-COs have reproducible cell type diversity
To further characterize cell types and variability between individual SOSR-COs, we performed scRNA-seq of SOSR-COs at 1, 3, and 5 months using four, six, and three individual SOSR-COs per time point, respectively. For these scRNA-seq experiments, the commercially available AICS-0023 iPSC line was used to explore intra-line variability because of its robust validation. To look at inter-line variability, we performed additional scRNA-seq at 1 month and 3 months for two additional control iPSC lines (one male and one female; three SOSR-COs each) with similar results (Figures S4 and S5). The number of post quality control cells used for analysis of each SOSR-CO is listed in Table S1. For the four 1-month SOSR-COs, we live-imaged from days 9–30 (Video S3) and found that average growth kinetics were indistinguishable from 38 additional organoids imaged in the same batch (data not shown). At each of the three timepoints, UMAP plots formed distinct clusters that were reproducible between individual SOSR-COs (Figures 3, 4, and 5). One-month SOSR-COs formed seven distinct gene expression clusters that were well reproduced in the four individual SOSR-COs except for minor differences in SOSR-CO-B (Figures 3A–3G). Similarly, 3-month SOSR-COs separated into seven distinct cell type clusters with remarkable consistency across the six different SOSR-COs, although some distinct differences in SOSR-CO-A arose with more cells in progenitor clusters and fewer in neuronal clusters (Figures 4A–4I). The 5-month SOSR-COs had a greater number of cell type clusters, 13, with continued reproducibility among the three individual SOSR-COs (Figures 5A–5F). Cross-correlation analysis of each cluster between samples at the 1- or 3-month timepoints showed a remarkable level of transcriptomic similarity when using the top 50 markers of each cluster (Figures S6A and S6B), except in the unidentified cell cluster 7. Thus, both the proportions of each cell type and the transcriptomes within each cell type cluster are similar between individual SOSR-COs.
To identify the cell types in each cluster, we first relied on markers of RG progenitors (VIM and FABP7) and neurons (STMN2) (Figures 3H–3J, 4J–4L, 5G, and 5H). Almost all RG (clusters 1–3, Figure 3A) expressed the dorsal forebrain markers EMX2 and LHX2 (Figures 3L and 3M), with only a portion (clusters 1 and 3) expressing FOXG1 and PAX6 (Figures 3K and 3N), two other forebrain markers, but this increased with time for FOXG1 (Figures 4M and 5I). We checked for ventral forebrain marker expression and found that cluster 4 expressed markers of the lateral ganglionic eminence (LGE), GSX2 and ASCL1, while there was no expression of the medial ganglionic eminence marker, NKX2.1 (Figures 3P,3Q, and 4S). GSX2 and ASCL1 were absent at 3 months (Figure 4R and data not shown). We also observed almost no expression of midbrain (EN1 and PAX2), hindbrain (GBX2 and IRX2), or hippocampal markers (Figures 3R–3U, 4T, 4U, and 4Z). The cortical hem, while a part of the dorsal forebrain, expresses little or no FOXG1 or PAX6, but does express EMX2 and LHX2 (De Clercq et al., 2018; Shinozaki et al., 2004). We confirmed the hypothesis that the FOXG1-negative cluster 6 is cortical hem by observing clear expression of RSPO2, a cortical hem specific marker (La Manno et al., 2021), and the roof plate marker LMX1A (Figures 3V, 3W, 4O, and 5K). The cortical hem is a major contributor of Cajal-Retzius cells (Meyer, 2010); therefore, these progenitors are likely the source of most RELN-expressing cells found by immunostaining (Figures 2E–2H) and scRNA-seq (Figures 3X, 4B’, and 5U). At 3 and 5 months, RSPO2 expression in progenitors was mutually exclusive with the forebrain progenitor marker SFRP1 (Figures 4N and 5J). We further confirmed cortical hem by OTX2 staining, which was in rosettes and mutually exclusive with PAX6 (Figure S2F). OTX2 was only expressed in cortical hem, choroid plexus, and LGE clusters in our scRNA-seq (Figures S2I, S2K and S2L). Previous studies have shown that early exposure to CHIR99021 in brain organoids causes an increase in cortical hem and Cajal-Retzius cells (Amin et al., 2023). Cross-correlation between clusters at the three different timepoints show high similarity, particularly of the three different progenitor clusters (clusters 1–3) (Figures S6E–S6G).
The RELN-expressing clusters at 3 and 5 months expressed other Cajal-Retzius markers, including LHX1 (Figures 4C’ and 5V). Cells expressing the choroid plexus marker transthyretin (TTR) were seen at 1 and 3 months in the same cluster as the cortical hem (Figures 3O and 4P). The choroid plexus anlage is found next to the cortical hem in the developing cortex; therefore, expression of other transcripts may be similar between these cell types leading to a shared cluster. In 5-month SOSR-COs, the TTR expressing choroid plexus cells make their own distinct cluster (cluster 2, Figure 5L). OTX2-positive regions showed clear choroid plexus-like structures in SOSR-COs (Figure S2E, S2G, S2H, and S2J). Cluster 1 cells in 1-month SOSR-COs express markers of cortical RG, and cell cycle stage-specific transcript analysis determined that it is defined by markers of M and S phase cells, MKI67 and PCNA, respectively (Figure S7). We color-coded the regional identity of each cluster on a map of the developing telencephalon in Figure 3C.
Within the neuronal clusters, we expected mainly excitatory cortical neurons as shown by the marker TBR1 (Figures 3A’, 4D’, and 5W). However, about 25% of the early-born neurons in 1-month SOSR-COs were GABAergic neurons as defined by GAD2 and DLX2 expression (Figure 3Y; Table S2). These neurons likely originate from the LGE-like dividing cells expressing GSX2 (Figure 3P). At 3 and 5 months, however, GAD2+ cells account for less than 1% of all cells (Figures 4A’ and 5N). Therefore, while some LGE-derived neurons exist in our SOSR-COs, they are a very small fraction at later timepoints. Co-expression of PAX6 and DLX2, which occurs in this cluster, is found in GABAergic neurons that migrate to the olfactory bulb via the rostral migratory stream (Brill et al., 2008). At 5 months, besides DLX and GAD genes, the top differentially expressed genes for the GABAergic neuron cluster were SCGN and SP8 (Table S2). A recent publication suggests that GABAergic cells co-expressing these markers are from the LGE and migrate to the olfactory bulb (Alzu’bi and Clowry, 2020). Taken together, we believe the GABAergic neurons are from the pallial/subpallial boundary of the dorsal LGE. These cells do not completely disappear since we have a small population of GABAergic cells at 3 and 5 months (although they do not form their own cluster at 3 months). We assume these cells become a small percentage at these time points because of the dramatic expansion of excitatory cortical neuron populations. TBR2/EOMES expressing IPCs (Figures 3Z, 4Y, and 5R) did not resolve into their own cluster at any of the timepoints but were grouped with cells expressing markers of immature, migrating neurons including BHLHE22, NHLH1, NEUROD1, and NeEUROD6 (Table S2). Interestingly, IPCs are located in the only region of their respective clusters that are negative for the pan-neuronal marker STMN2 (Figures 3J, 3Z, 4L,4Y, 5H, and 5R).
Cortical layer-specific markers appeared in distinct clusters following typical developmental timing. Starting at 1 month, layer one RELN-expressing cells and deep-layer TBR1, BCL11B (CTIP2), and FEZF2 neurons were present (Figures 3X, 3A’–3C’, 4D’–4F’, 5W, 5Y, and 5Z). Layer four markers SATB2 and RORB appeared at 3 and 5 months, respectively (Figures 3D’, 4G’, 5A’, and 5B’). The superficial, layer two, three neuronal markers POU3F2 (BRN2) and CUX2 are only present in 5-month SOSR-COs (Figures 5C’ and 5D’). Astrocytes are the last cell type produced by dorsal RG in the developing cortex. Accordingly, markers of astrocytes, including GFAP and S100B, are not present until 5 months (Figures 5O and 5P). This coincides with the increase in HOPX expressing oRG known to give rise to superficial neurons and astrocytes in the human cortex (Figure 5Q). The progression over time is also visualized by dot matrix plots of selected genes or as a pseudo-time trajectory overlay of the UMAP plots (Figures S6C, S6D, and S6H–S6K). The pseudo-time trajectory plots show the transition of pan-mitotic progenitors into either cortical or cortical hem progenitors. Cortical hem progenitors give rise to Cajal-Retzius neurons at 1 month but become an isolated cluster of choroid plexus cells at 3 and 5 months and the likely reason we do not see hippocampal neurons. The cortical progenitors become intermediate progenitors followed by immature neurons and finally more mature neuron clusters. Therefore, by 5 months in culture, most pallial apical RG and cortical hem lineages are present in SOSR-COs and appear in a typical neurodevelopmental progression. The main variability we see in cell identity between SOSR-COs and between differentiations is in the level of cells with cortical hem identity at 1 month, with SOSR-CO-B (Figure 3B) and those from the additional iPSC lines (Figure S4B) having little to no cortical hem cells, while all other SOSR-COs showed relatively high numbers of cortical hem and derivative cells (Figures 3, 4, and 5). Since WNT signaling is important for generating the cortical hem identity (Amin et al., 2023), timing and concentration of the WNT agonist, CHIR99021, may need to be fine-tuned for individual cell lines to include or exclude this cell type.
While we saw late-born, superficial neurons and continued electrophysiological maturation in SOSR-COs at 5 months, we only observed the functional maturation markers GRIN2B and RBFOX3 in early-born, deep-layer neurons (Figures 5S and 5T). OSTN, another marker of neuronal maturity, was not expressed in any of the cells sequenced at 5 months. Therefore, our cells likely have not reached complete neuronal maturity and likely need either additional time in culture or the addition of cortical interneurons for more complete maturation and neural oscillation development seen in previous studies (Samarasinghe et al., 2021; Trujillo et al., 2019).
We also compared the percentage of cells expressing typical cortical progenitor (SOX2, PAX6), intermediate progenitor (EOMES/TBR2), and deep-layer neuronal markers (TBR1, BCL11B/CTIP2, SATB2) from our scRNA-seq data across the three different cell lines for 1 and 3 months and for AICS-0023 at 5 months (Figure S7H). Progenitor markers peak at 1 month (46% and 48%, respectively). Intermediate progenitors remain low throughout (5%–8%). Early deep-layer neurons (TBR1, BCL11B) peak at 3 months (45% and 56%, respectively), while later deep-layer neurons (SATB2) peak at 5 months (45%).
SOSR-COs offer a platform for studying NTDs
We next explored the translational potential of SOSR-COs for studying human neurodevelopmental disorders. NTDs are a potential teratogenic adverse consequence of pharmaceuticals used during pregnancy. Proper neural tube formation depends upon the apical constriction of neuroepithelial cells (Figure 6A), a process that occurs via the canonical SHROOM3/Rho-kinase/non-muscle myosin II pathway (Hildebrand, 2005) (Figure 6J). To determine if this mechanism underlies SOSR-CO formation during 2D to 3D conversion, we explored the effects of adding a Rho-kinase inhibitor, Y-27632, or a non-muscle myosin inhibitor, blebbistatin, to the culture medium on day 4 of differentiation immediately after placing the monolayer fragments on Geltrex. SOSR-COs were examined 48 h later for the tight-junction marker ZO-1 and microtubule network marker acetylated-tubulin. In vehicle-treated SOSR-COs, the tight-junction network formed a spherical lumen with small apical surfaces and a radially oriented microtubule network (Figures 6B and 6F). SOSR-COs treated with each inhibitor, in contrast, displayed disorganization of the tight junctions and microtubules (Figures 6C, 6D, 6G, and 6H). Quantification of normalized SOSR-CO lumen area (lumen area/SOSR-CO area) showed a robust increase after exposure to blebbistatin (Figure 6K). Incubation with Y-27632 caused lumen disorganization that was too severe for adequate quantification. These findings show that apical constriction is important for SOSR-CO formation and suggest that they follow the normal mechanism of neurulation.
Figure 6.

Teratogenic compound exposure results in dysmorphic SOSR-COs with enlarged lumens
(A) Schematic of cellular and structural changes during neurulation.
(B–I) Confocal micrographs of whole-mount day 6 SOSR-COs expressing ZO-1-EGFP fusion protein (green) with either nestin (red) and PAX6 (blue) (B–E) or acetyl-tubulin (red) and SOX2 (blue) (F–I). SOSR-COs were exposed to vehicle (B and F) or inhibitors of the apical constriction pathway, either blebbistatin (C and G, 10 μM), Y-27632 (D and H, 20 μM), or the teratogenic antiseizure medication, valproic acid (E and I, 400 μM).
(J) Schematic of important genes in apical constriction and the mode of action for both inhibitors.
(K–M) Quantification of normalized lumen area (lumen area/SOSR-CO area, square root transformed). (K) Normalized lumen area was determined for three unrelated control (C) lines with either vehicle or blebbistatin treatment with a single batch for each line. Data are color-coded by line with C1-magenta, C2-green, C3-blue. In (L), data points are individual SOSR-COs from six independent experiments exposed to 0, 200, or 400 μM valproic acid. Each individual experiment also showed a significant increase for both 200 and 400 μM valproic acid. n = 139, 127, and 123, respectively. In (M), data points are individual SOSR-COs from three independent experiments, n = 36 per group, and a valnoctamide (VCD) group was added. Unpaired t test was used for two-group comparisons, and one-way ANOVA test with Tukey post hoc was used for more than two groups. ∗∗∗∗p < 0.0001, and ns p > 0.05. Error bars are mean ± SD for (K), (L), and (M). Scale bars are 100 μm.
After establishing this methodology, we applied the SOSR-CO platform to a well-established neuroteratogenic drug, valproic acid. Valproic acid has been used for decades as an effective antiseizure medication, but it is also a potent neuroteratogen with a high risk of NTDs when given to pregnant women (Robert and Guibaud, 1982). ZO-1-EGFP fusion protein-expressing SOSR-COs exposed to valproic acid from days 4–6 showed a dose-dependent increase in normalized lumen area at 200-μM and 400-μM doses in each of six independent experiments and as a combined dataset (Figure 6L), with representative images of 400 μM valproic acid treatment shown in Figures 6E and 6I. Last, in three additional independent experiments we treated with either 400 μM valproic acid or 400 μM valnoctamide (VCD), a valproic acid derivative with similar antiseizure activity but no teratogenicity in mice (Radatz et al., 1998). In these experiments, valproic acid significantly increased the lumen area but VCD had no effect (Figure 6M), supporting the idea that SOSR-COs model the teratogenic mechanism of valproic acid. Together, these findings suggest that SOSR-COs are a useful platform for modeling human NTDs.
SOSR-COs recapitulate abnormal cell segregation associated with mosaic PCDH19 expression
We next explored whether SOSR-COs are useful for modeling alterations of the developing cortex in a genetic neurodevelopmental disorder. Protocadherin-19 (PCDH19) clustering epilepsy (PCE) is a severe childhood developmental and epileptic encephalopathy caused by inherited or de novo, heterozygous loss-of-function variants in the X-linked PCDH19 gene (Dibbens et al., 2008; Kolc et al., 2019). Intriguingly, pathogenic variants only lead to epilepsy and intellectual disability in heterozygous females and mosaic males, but not in hemizygous mutant males who are largely asymptomatic carriers (de Lange et al., 2017). The prevailing hypothesis is that a mosaic pattern of wild-type (WT) and mutant PCDH19-expressing cell populations in the developing brains of heterozygous females caused by random X-inactivation (or in mosaic males) is necessary for the pathology. Because PCDH19 is involved in homophilic cell-cell interactions during development (Hoshina et al., 2021; Pederick et al., 2018), the inability of WT and mutant PCDH19-expressing cells to interact is thought to cause disease. This hypothesis is supported by findings in female heterozygous PCDH19 knockout (KO) mice in which mutant and WT PCDH19-expressing cells segregated into distinct columns in the VZ, SVZ, and cortex (Hoshina et al., 2021; Pederick et al., 2018).
To determine whether mosaic cell segregation can be modeled in vitro using human brain organoids, we first generated male lines with frameshift mutations in PCDH19, along with isogenic controls, by simultaneous CRISPR gene-editing and iPSC reprogramming (Tidball et al., 2017, 2018). We confirmed loss of PCDH19 mRNA expression in the KO lines by qRT-PCR (Figures S8A and S8B). Each KO and isogenic control line was then GFP-labeled by stable integration. To model a PCE mosaic male, equal amounts of single-cell dissociated EGFP-labeled WT and unlabeled PCDH19 KO iPSCs were mixed 1 day prior to beginning organoid differentiation. For comparison, mixtures of labeled and unlabeled cells of the same genotype (WTGFP/WT or KOGFP/KO) were used to generate organoids (Figures 7A–7C). Both SOSR-COs and multi-rosette brain organoids, the latter generated using the spin-Ω method (Qian et al., 2016), were cultured in parallel. At day 20, mixed WTGFP/KO SOSR-COs (Figure 7G), but not spin-Ω cortical organoids (Figure 7D), showed robust cell segregation that also was not evident in any of the non-mosaic WTGFP/WT or KOGFP/KO mixed conditions using either brain organoid method (Figures 7E, 7F, 7H, and 7I). This robust phenotype was consistent across multiple SOSR-COs in four independent experiments as quantified by blinded counting of the number of EGFP stripes in organoid cryosections, which showed stripes in all WT/KO mixes (mean 6.4 ± 3.1) while the WT/WT and KO/KO had stripes in only three out of 52 SOSR-COs (Figure 7J). Additionally, we imaged live mixed WTGFP/KO and WTGFP/WT SOSR-COs and found similar striping in the mosaic with conventional epifluorescence microscopy (Figures 7K and 7L). Quantification of the coefficient of variation of the GFP signal in the center of each organoid (one-sixth of total SOSR-CO radius) showed a significant 2-fold increase in the WTGFP/KO group across six independent experiments (p < 0.0001) (Figure 7M). This image feature is driven by the striping pattern we observe. Furthermore, the phenotypes were reproduced in multiple batches (Figures S8C–S8D’) and with a female hESC line with similar WT and homozygous CRISPR-KO mixing (Figures S8E–S8G’’). These data indicate that a structural, developmental brain abnormality associated with a genetic neurodevelopmental disorder is readily modeled using SOSR-COs.
Figure 7.

SOSR-COs recapitulate the early cell segregation phenotype found in mouse models of PCE
(A–C) Schematics depicting the hypothesized structural outcomes of brain organoids derived from different mixtures (simulating mosaicism in A) of GFP+ and unlabeled isogenic WT and KO cell lines based on previous data from mouse models (Hoshina et al., 2021; Pederick et al., 2018).
(D–F) Confocal micrographs of multi-rosette brain organoids generated according to previously published methods (Dang et al., 2021; Qian et al., 2016) for each of the three genotype mixtures: WTGFP/KO (D), WTGFP/WT (E), and KOGFP/KO (F).
(G–I) SOSR-COs were generated in parallel with the same three mixtures: WTGFP/KO (G), WTGFP/WT (H), and KOGFP/KO (I). Green arrows and blue arrowheads (in G) indicate segregated stripes of only WT or only KO cells, respectively, in the mosaic SOSR-CO. All organoids were immunostained for GFP (green) and ZO-1 (red), with bis-benzamide nuclear stain (blue).
(J) Quantification of the number of GFP stripes in SOSR-COs from imaged slices with each mosaic or non-mosaic mix. n = 24, 28, and 27 SOSR-COs across four independent experiments.
(K and L) Six individual SOSR-COs per genotype mixture with WTGFP/KO mixtures (K) from a single batch showing a clear segregation phenotype, and WTGFP/WT mixtures (L) showing no segregation phenotype.
(M) Quantified coefficient of variation of GFP pixel signal intensity in the center (at one-sixth of total radius) of each SOSR-CO image (as collected in K and L). n = 92 and 122, respectively, across six independent experiments. Each dot is an individual SOSR-CO. Error bars are means ± SD. Statistical analysis performed using Kruskal-Wallis test with Dunn’s multiple comparison (J) or Mann-Whitney (M). ∗∗∗∗p < 0.0001, ns p > 0.05. All images are from day 20 spin-Ω organoids (D)–(F) or SOSR-COs (G)–(I), (K), (L). Scale bars, 100 μm.
Discussion
Here we describe the simple, efficient production of an SOSR-CO brain organoid model with early single-rosette structure and dorsal forebrain identity. We show that SOSR-COs have reproducible growth kinetics, VZ/SVZ-like structures, and cellular diversity over 5 months in culture. SOSR-COs also demonstrate robust, reproducible structural abnormalities in early development after chemical teratogen exposure or in modeling a genetic neurodevelopmental disorder.
Two groups have used geometric restriction in a micropatterned substrate for a short period of time (9 or 12 days, respectively) to generate single-rosette 3D neural tube-like structures (Karzbrun et al., 2021; Knight et al., 2018). Our SOSR-CO model is produced without this complicated approach and can be grown for at least 5 months in culture with continued maturation and production of late-born cortical cell types (i.e., superficial layer neurons and astrocytes). Two other reports describe the production of single-rosette organoids by picking 2D rosettes and growing them in suspension (Lee et al., 2017; Wang et al., 2022). While this method offers useful features and shows excellent electrophysiological maturation of neurons, our protocol allows for simple generation of thousands of early organoids without the need for manual rosette isolation and facilitates robust, early structural analyses.
Several features of our method likely underlie the high reproducibility and fidelity of the early SOSR-CO structure and cell diversity compared with previous brain organoid techniques. First, patterning likely occurs more efficiently in a cell monolayer than a 3D EB because of equal access of the entire monolayer to the patterning molecules and nutrients in the media. The reproducible size and growth of SOSR-COs at early time points probably reflects the size constraint imposed by monolayer cutting. The loss of structural homogeneity after 1 month in culture likely reflects the lack of apical RG processes extending to the basal surface from loss of ECM after removal from Geltrex. Without this scaffold, neuronal migration and positioning are likely impaired, similar to that seen in other human CO protocols.
Unlike existing CO methods, SOSR-COs follow a normal developmental transition from a 2D organization to a 3D neural tube-like structure. The ability to monitor the exact timing of neurulation and lumen structure in whole-mount or live SOSR-COs allows for simple investigation of compounds that lead to NTDs. Exposure to the Rho-kinase or non-muscle myosin inhibitors (Y-27632 and blebbistatin) resulted in larger, more variably sized apical endfeet surface areas leading to dysmorphic lumens. In the context of in vivo neurodevelopment, these structural abnormalities would likely result in NTDs and, in fact, mouse in utero exposure to either compound results in severe NTDs (Escuin et al., 2015; Wei et al., 2001). Furthermore, an antiseizure medication that is teratogenic in humans, valproic acid, resulted in the same lumen enlargement while its non-teratogenic derivative, valnoctamide, did not. Prior studies treated multi-rosette brain organoids with valproic acid after several weeks when rosettes had already formed (Cui et al., 2020; Zang et al., 2022). Since rosette formation is stochastic in multi-rosette organoids, acute treatment similar to our synchronously forming SOSR-COs is not possible. Thus, SOSR-COs should prove useful for studying mechanisms underlying NTDs and for CNS teratogen screening. We have further characterized the mechanisms of valproic acid teratogenicity in SOSR-COs as well as the knockout of an NTD gene, SHROOM3, in a recent publication (Takla et al., 2023).
Similarly, SOSR-COs revealed a robust morphological phenotype in modeling a genetic neurodevelopmental disorder. The early segregation phenotype in PCE has previously only been shown in mouse models (Hoshina et al., 2021; Pederick et al., 2018). We were able to recapitulate this mosaic cell segregation pattern robustly in SOSR-COs but not using a multi-rosette CO method. This finding suggests that the single-rosette nature of SOSR-COs greatly enhanced the ability to detect early structural differences.
Reproducibility of the SOSR-CO cell diversity and early structure has the potential to decrease the heterogeneity that impedes detailed pathogenic studies in the CO field. While attaining uniform laminar structure in the later stages of brain organoid development will likely necessitate additional advances, our methodology provides a scalable, accessible single-rosette starting point. We have shown that SOSR-COs have a remarkable ability to model early neurological disorders at the stages of neurulation and cortical plate formation. Therefore, this protocol fills a needed role for modeling diseases of early neurodevelopment, especially NTDs, and offers a platform for testing precision therapies.
Experimental procedures
Resource availability
Corresponding author
Further information and requests for resources and reagents should be directed to the lead contact, Jack M. Parent (parent@umich.edu).
Materials availability
Unique reagents generated in this study are available from the lead contact with a materials transfer agreement.
Data and code availability
-
•
All original code has been deposited at Github and is publicly available as of the date of publication: https://github.com/qianqianshao/SOSRS
-
•
Any additional information required to reanalyze the data reported in this paper is available from the lead contact upon request.
SOSR-CO differentiation
All hPSC experiments were conducted following prior approval from the University of Michigan Human Pluripotent Stem Cell Research Oversight (HPSCRO) Committee. iPSC lines were passaged using Accutase (Innovative cell) and replated onto Geltrex-coated (1:50 dilution in DMEM/F12) 12-well plates at 3–4 × 10⁵ cells/well in mTeSR1 with 10 μM Rho-kinase inhibitor (Y-27632; Tocris, 1254). Medium without the inhibitor was replaced daily until the cells reached 80%–100% confluency. The medium was then changed to 3N (50:50 DMEM/F12:neurobasal with N2 and B27 supplements) (Shi et al., 2012) without vitamin A with 2 μM DMH1 (Tocris, 4126), 2 μM XAV939 (Cayman Chemical, 13596), and 10 μM SB431542 (Cayman Chemical, 13031) (2 mL of media per well). Daily 75% media changes with 1 μM cyclopamine (Cayman Chemical, 11321) added began on day 1. On day 4, the monolayer was cut into squares using the StemPro EZ passage tool, and 1 mL of conditioned media was reserved. The squares were incubated for 1 min with L7 hPSC passaging solution (Lonza). After aspirating the L7 solution, the squares were sprayed off the bottom of the culture plate with the 1 mL of preconditioned culture media with a P1000 micropipette. An additional 2 mL of fresh culture medium with the four inhibitors was added for a final volume of 3 mL. Approximately 200 μL of resuspended squares were then transferred into each well of a 96-well plate preincubated at 37°C for 20 min with 35 μL of 100% Geltrex solution/well. Up to 16 wells can be made using one monolayer. Higher densities will result in fusion between nearby SOSR-COs forming multi-rosette doublets or “strings.” After 48 h, daily 50% media changes were performed. On day 6 (2 days after cutting), the four inhibitors were no longer added but replaced with 3 μM CHIR99021. After 3 to 4 additional days of culture, the organoids were individually removed using the STRIPPER Micropipetter (Cooper Surgical) with 275-μm tips and plated individually in the wells of a low-adherence U-bottom 96-well plate with 200 μL of 3N medium without vitamin A with 3 μM CHIR99021, BDNF (20 ng/mL), and NT3 (20 ng/mL). The ideal diameter for picking the SOSR-COs is ∼250 μM. Starting 2 days later, half-media changes of 3N with vitamin A, BDNF (20 ng/mL), and NT3 (20 ng/mL) were repeated every other day. After 35 days of differentiation, 3N media with vitamin A (but without BDNF and NT3) was used for half-media changes every other day. At this time, SOSR-COs were transferred from the low-adherence 96-well plates to low-adherence 24-well plates for a necessary increase in media volume due to expanded SOSR-COs size.
Statistical analyses
Prism GraphPad was used for all statistical analyses. In Figure 6, parametric analyses were used for all SOSR-CO lumen measurements based on Prism normality tests of the datasets after log transformation. In Figures 6K, 6L, and 6M, data were analyzed by one-way ANOVA test for significance with Tukey posttest. In Figure S1E, a linear regression was performed to obtain an R2 value and slope. In Figures S8A and S8B, qRT-PCR values were compared by Mann-Whitney test.
For all other experimental procedures, see the supplemental information.
Accession numbers
The accession number for all single cell RNA sequencing data reported in this paper is Gene Expression Omnibus (GEO): GSE181518.
Acknowledgments
Part of this research was made possible through the Allen Cell Collection, available from Coriell Institute for Medical Research. We would like to thank Michael Uhler for the DCX-reporter hESC line, and Michael Uhler, Ranmal Samarasinghe, and M. Carmen Varela who provided important manuscript feedback. This work was funded by NIH/NINDS grants R21NS116250 (A.M.T.), R21HD106580 (A.M.T.), U54NS117170 (J.M.P./L.L.I.), R37NS076752 (L.L.I.), and Insieme per la Ricerca PCDH19 (W.N./J.M.P.).
Author contributions
A.M.T. and J.M.P. conceptualized the experiments, interpreted the results, and wrote the manuscript. A.M.T., L.L.I., and J.M.P. obtained funding. The methodology for generating SOSR-COs was developed by A.M.T. with input from S.P.M.P. SOSR-CO culture and experiments were performed by A.M.T., W.N., T.N.T., J.C.W., J.L.M., S.P.M.P., and R.S. Electrophysiological recordings were performed by R.C., S.J.M., and Y.Y. with supervision by V.G.S., G.G.M., and L.L.I. Single-cell RNA-sequencing analysis and software development was by Q.M. with supervision by J.Z.L.
Declaration of interests
The Regents of the University of Michigan have filed patent# PCT/US2021/028610 as a PCT patent application. Inventors: J.P. and A.T. This patent pertains to any methods, compositions, and kits of making single-rosette brain organoids as described in this manuscript for commercial use.
Published: November 22, 2023
Footnotes
Supplemental information can be found online at https://doi.org/10.1016/j.stemcr.2023.10.020.
Supplemental information
References
- Alzu’bi A., Clowry G.J. Multiple origins of secretagogin expressing cortical GABAergic neuron precursors in the early human fetal telencephalon. Front. Neuroanat. 2020;14:61. doi: 10.3389/fnana.2020.00061. [DOI] [PMC free article] [PubMed] [Google Scholar]
- Amin N.D., Kelley K.W., Hao J., Miura Y., Narazaki G., Li T., McQueen P., Kulkarni S., Pavlov S., Pasca S.P. Generating human neural diversity with a multiplexed morphogen screen in organoids. bioRxiv. 2023 Preprint at. [Google Scholar]
- Barcellos-Hoff M.H., Aggeler J., Ram T.G., Bissell M.J. Functional differentiation and alveolar morphogenesis of primary mammary cultures on reconstituted basement membrane. Development. 1989;105:223–235. doi: 10.1242/dev.105.2.223. [DOI] [PMC free article] [PubMed] [Google Scholar]
- Brill M.S., Snapyan M., Wohlfrom H., Ninkovic J., Jawerka M., Mastick G.S., Ashery-Padan R., Saghatelyan A., Berninger B., Götz M. A dlx2-and pax6-dependent transcriptional code for periglomerular neuron specification in the adult olfactory bulb. J. Neurosci. 2008;28:6439–6452. doi: 10.1523/JNEUROSCI.0700-08.2008. [DOI] [PMC free article] [PubMed] [Google Scholar]
- Chambers S.M., Fasano C.A., Papapetrou E.P., Tomishima M., Sadelain M., Studer L. Highly efficient neural conversion of human ES and iPS cells by dual inhibition of SMAD signaling. Nat. Biotechnol. 2009;27:275–280. doi: 10.1038/nbt.1529. [DOI] [PMC free article] [PubMed] [Google Scholar]
- Cui K., Wang Y., Zhu Y., Tao T., Yin F., Guo Y., Liu H., Li F., Wang P., Chen Y., Qin J. Neurodevelopmental impairment induced by prenatal valproic acid exposure shown with the human cortical organoid-on-a-chip model. Microsyst. Nanoeng. 2020;6:49. doi: 10.1038/s41378-020-0165-z. [DOI] [PMC free article] [PubMed] [Google Scholar]
- Dang L.T., Vaid S., Lin G., Swaminathan P., Safran J., Loughman A., Lee M., Glenn T., Majolo F., Crino P.B., Parent J.M. STRADA-mutant human cortical organoids model megalencephaly and exhibit delayed neuronal differentiation. Dev. Neurobiol. 2021;81:696–709. doi: 10.1002/dneu.22816. [DOI] [PMC free article] [PubMed] [Google Scholar]
- De Clercq S., Keruzore M., Desmaris E., Pollart C., Assimacopoulos S., Preillon J., Ascenzo S., Matson C.K., Lee M., Nan X., et al. DMRT5 together with DMRT3 directly controls hippocampus development and neocortical area map formation. Cerebr. Cortex. 2018;28:493–509. doi: 10.1093/cercor/bhw384. [DOI] [PMC free article] [PubMed] [Google Scholar]
- de Lange I.M., Rump P., Neuteboom R.F., Augustijn P.B., Hodges K., Kistemaker A.I., Brouwer O.F., Mancini G.M.S., Newman H.A., Vos Y.J., et al. Male patients affected by mosaic PCDH19 mutations: five new cases. Neurogenetics. 2017;18:147–153. doi: 10.1007/s10048-017-0517-5. [DOI] [PMC free article] [PubMed] [Google Scholar]
- Dibbens L.M., Tarpey P.S., Hynes K., Bayly M.A., Scheffer I.E., Smith R., Bomar J., Sutton E., Vandeleur L., Shoubridge C., et al. X-linked protocadherin 19 mutations cause female-limited epilepsy and cognitive impairment. Nat. Genet. 2008;40:776–781. doi: 10.1038/ng.149. [DOI] [PMC free article] [PubMed] [Google Scholar]
- Eiraku M., Watanabe K., Matsuo-Takasaki M., Kawada M., Yonemura S., Matsumura M., Wataya T., Nishiyama A., Muguruma K., Sasai Y. Self-organized formation of polarized cortical tissues from ESCs and its active manipulation by extrinsic signals. Cell Stem Cell. 2008;3:519–532. doi: 10.1016/j.stem.2008.09.002. [DOI] [PubMed] [Google Scholar]
- Escuin S., Vernay B., Savery D., Gurniak C.B., Witke W., Greene N.D.E., Copp A.J. Rho-kinase-dependent actin turnover and actomyosin disassembly are necessary for mouse spinal neural tube closure. J. Cell Sci. 2015;128:2468–2481. doi: 10.1242/jcs.164574. [DOI] [PMC free article] [PubMed] [Google Scholar]
- Hildebrand J.D. Shroom regulates epithelial cell shape via the apical positioning of an actomyosin network. J. Cell Sci. 2005;118:5191–5203. doi: 10.1242/jcs.02626. [DOI] [PubMed] [Google Scholar]
- Hoshina N., Johnson-Venkatesh E.M., Hoshina M., Umemori H. Female-specific synaptic dysfunction and cognitive impairment in a mouse model of PCDH19 disorder. Science. 2021;372 doi: 10.1126/science.aaz3893. [DOI] [PMC free article] [PubMed] [Google Scholar]
- Huang L., Holtzinger A., Jagan I., BeGora M., Lohse I., Ngai N., Nostro C., Wang R., Muthuswamy L.B., Crawford H.C., et al. Ductal pancreatic cancer modeling and drug screening using human pluripotent stem cell–and patient-derived tumor organoids. Nat. Med. 2015;21:1364–1371. doi: 10.1038/nm.3973. [DOI] [PMC free article] [PubMed] [Google Scholar]
- Kadoshima T., Sakaguchi H., Nakano T., Soen M., Ando S., Eiraku M., Sasai Y. Self-organization of axial polarity, inside-out layer pattern, and species-specific progenitor dynamics in human ES cell–derived neocortex. Proc. Natl. Acad. Sci. USA. 2013;110:20284–20289. doi: 10.1073/pnas.1315710110. [DOI] [PMC free article] [PubMed] [Google Scholar]
- Karzbrun E., Khankhel A.H., Megale H.C., Glasauer S.M.K., Wyle Y., Britton G., Warmflash A., Kosik K.S., Siggia E.D., Shraiman B.I., Streichan S.J. Human neural tube morphogenesis in vitro by geometric constraints. Nature. 2021;599:268–272. doi: 10.1038/s41586-021-04026-9. [DOI] [PMC free article] [PubMed] [Google Scholar]
- Knight G.T., Lundin B.F., Iyer N., Ashton L.M., Sethares W.A., Willett R.M., Ashton R.S. Engineering induction of singular neural rosette emergence within hPSC-derived tissues. Elife. 2018;7 doi: 10.7554/eLife.37549. [DOI] [PMC free article] [PubMed] [Google Scholar]
- Kolc K.L., Sadleir L.G., Scheffer I.E., Ivancevic A., Roberts R., Pham D.H., Gecz J. A systematic review and meta-analysis of 271 PCDH19-variant individuals identifies psychiatric comorbidities, and association of seizure onset and disease severity. Mol. Psychiatr. 2019;24:241–251. doi: 10.1038/s41380-018-0066-9. [DOI] [PMC free article] [PubMed] [Google Scholar]
- La Manno G., Siletti K., Furlan A., Gyllborg D., Vinsland E., Mossi Albiach A., Mattsson Langseth C., Khven I., Lederer A.R., Dratva L.M., et al. Molecular architecture of the developing mouse brain. Nature. 2021;596:92–96. doi: 10.1038/s41586-021-03775-x. [DOI] [PubMed] [Google Scholar]
- Lancaster M.A., Corsini N.S., Wolfinger S., Gustafson E.H., Phillips A.W., Burkard T.R., Otani T., Livesey F.J., Knoblich J.A. Guided self-organization and cortical plate formation in human brain organoids. Nat. Biotechnol. 2017;35:659–666. doi: 10.1038/nbt.3906. [DOI] [PMC free article] [PubMed] [Google Scholar]
- Lancaster M.A., Renner M., Martin C.-A., Wenzel D., Bicknell L.S., Hurles M.E., Homfray T., Penninger J.M., Jackson A.P., Knoblich J.A. Cerebral organoids model human brain development and microcephaly. Nature. 2013;501:373–379. doi: 10.1038/nature12517. [DOI] [PMC free article] [PubMed] [Google Scholar]
- Lee C.-T., Chen J., Kindberg A.A., Bendriem R.M., Spivak C.E., Williams M.P., Richie C.T., Handreck A., Mallon B.S., Lupica C.R., et al. CYP3A5 mediates effects of cocaine on human neocorticogenesis: studies using an in vitro 3D self-organized hPSC model with a single cortex-like unit. Neuropsychopharmacology. 2017;42:774–784. doi: 10.1038/npp.2016.156. [DOI] [PMC free article] [PubMed] [Google Scholar]
- Meyer G. Building a human cortex: the evolutionary differentiation of Cajal-Retzius cells and the cortical hem. J. Anat. 2010;217:334–343. doi: 10.1111/j.1469-7580.2010.01266.x. [DOI] [PMC free article] [PubMed] [Google Scholar]
- Nowakowski T.J., Pollen A.A., Sandoval-Espinosa C., Kriegstein A.R. Transformation of the radial glia scaffold demarcates two stages of human cerebral cortex development. Neuron. 2016;91:1219–1227. doi: 10.1016/j.neuron.2016.09.005. [DOI] [PMC free article] [PubMed] [Google Scholar]
- Ogawa M., Miyata T., Nakajima K., Yagyu K., Seike M., Ikenaka K., Yamamoto H., Mikoshiba K. The reeler gene-associated antigen on Cajal-Retzius neurons is a crucial molecule for laminar organization of cortical neurons. Neuron. 1995;14:899–912. doi: 10.1016/0896-6273(95)90329-1. [DOI] [PubMed] [Google Scholar]
- Paşca A.M., Sloan S.A., Clarke L.E., Tian Y., Makinson C.D., Huber N., Kim C.H., Park J.-Y., O'rourke N.A., Nguyen K.D., et al. Functional cortical neurons and astrocytes from human pluripotent stem cells in 3D culture. Nat. Methods. 2015;12:671–678. doi: 10.1038/nmeth.3415. [DOI] [PMC free article] [PubMed] [Google Scholar]
- Pașca S.P., Arlotta P., Bateup H.S., Camp J.G., Cappello S., Gage F.H., Knoblich J.A., Kriegstein A.R., Lancaster M.A., Ming G.-L., et al. A nomenclature consensus for nervous system organoids and assembloids. Nature. 2022;609:907–910. doi: 10.1038/s41586-022-05219-6. [DOI] [PMC free article] [PubMed] [Google Scholar]
- Pederick D.T., Richards K.L., Piltz S.G., Kumar R., Mincheva-Tasheva S., Mandelstam S.A., Dale R.C., Scheffer I.E., Gecz J., Petrou S., et al. Abnormal cell sorting underlies the unique X-linked inheritance of PCDH19 epilepsy. Neuron. 2018;97:59–66.e5. doi: 10.1016/j.neuron.2017.12.005. [DOI] [PubMed] [Google Scholar]
- Qian X., Nguyen H.N., Song M.M., Hadiono C., Ogden S.C., Hammack C., Yao B., Hamersky G.R., Jacob F., Zhong C., et al. Brain-region-specific organoids using mini-bioreactors for modeling ZIKV exposure. Cell. 2016;165:1238–1254. doi: 10.1016/j.cell.2016.04.032. [DOI] [PMC free article] [PubMed] [Google Scholar]
- Qian X., Su Y., Adam C.D., Deutschmann A.U., Pather S.R., Goldberg E.M., Su K., Li S., Lu L., Jacob F., et al. Sliced human cortical organoids for modeling distinct cortical layer formation. Cell Stem Cell. 2020;26:766–781.e9. doi: 10.1016/j.stem.2020.02.002. [DOI] [PMC free article] [PubMed] [Google Scholar]
- Radatz M., Ehlers K., Yagen B., Bialer M., Nau H. Valnoctamide, valpromide and valnoctic acid are much less teratogenic in mice than valproic acid. Epilepsy Res. 1998;30:41–48. doi: 10.1016/s0920-1211(97)00095-8. [DOI] [PubMed] [Google Scholar]
- Robert E., Guibaud P. Maternal valproic acid and congenital neural tube defects. Lancet. 1982;2:937. doi: 10.1016/s0140-6736(82)90908-4. [DOI] [PubMed] [Google Scholar]
- Samarasinghe R.A., Miranda O.A., Buth J.E., Mitchell S., Ferando I., Watanabe M., Allison T.F., Kurdian A., Fotion N.N., Gandal M.J., et al. Identification of neural oscillations and epileptiform changes in human brain organoids. Nat. Neurosci. 2021;24:1488–1500. doi: 10.1038/s41593-021-00906-5. [DOI] [PMC free article] [PubMed] [Google Scholar]
- Shi Y., Kirwan P., Smith J., Robinson H.P.C., Livesey F.J. Human cerebral cortex development from pluripotent stem cells to functional excitatory synapses. Nat. Neurosci. 2012;15:477–486.S1. doi: 10.1038/nn.3041. [DOI] [PMC free article] [PubMed] [Google Scholar]
- Shinozaki K., Yoshida M., Nakamura M., Aizawa S., Suda Y. Emx1 and Emx2 cooperate in initial phase of archipallium development. Mech. Dev. 2004;121:475–489. doi: 10.1016/j.mod.2004.03.013. [DOI] [PubMed] [Google Scholar]
- Spence J.R., Mayhew C.N., Rankin S.A., Kuhar M.F., Vallance J.E., Tolle K., Hoskins E.E., Kalinichenko V.V., Wells S.I., Zorn A.M., et al. Directed differentiation of human pluripotent stem cells into intestinal tissue in vitro. Nature. 2011;470:105–109. doi: 10.1038/nature09691. [DOI] [PMC free article] [PubMed] [Google Scholar]
- Takla T.N., Luo J., Sudyk R., Huang J., Walker J.C., Vora N.L., Sexton J.Z., Parent J.M., Tidball A.M. A shared pathogenic mechanism for valproic acid and SHROOM3 knockout in a brain organoid model of neural tube defects. Cells. 2023;12:1697. doi: 10.3390/cells12131697. [DOI] [PMC free article] [PubMed] [Google Scholar]
- Tidball A.M., Dang L.T., Glenn T.W., Kilbane E.G., Klarr D.J., Margolis J.L., Uhler M.D., Parent J.M. Rapid generation of human genetic loss-of-function iPSC lines by simultaneous reprogramming and gene editing. Stem Cell Rep. 2017;9:725–731. doi: 10.1016/j.stemcr.2017.07.003. [DOI] [PMC free article] [PubMed] [Google Scholar]
- Tidball A.M., Lopez-Santiago L.F., Yuan Y., Glenn T.W., Margolis J.L., Clayton Walker J., Kilbane E.G., Miller C.A., Martina Bebin E., Scott Perry M., et al. Variant-specific changes in persistent or resurgent sodium current in SCN8A-related epilepsy patient-derived neurons. Brain. 2020;143:3025–3040. doi: 10.1093/brain/awaa247. [DOI] [PMC free article] [PubMed] [Google Scholar]
- Tidball A.M., Swaminathan P., Dang L.T., Parent J.M. Generating loss-of-function iPSC lines with combined CRISPR indel formation and reprogramming from human fibroblasts. Bio. Protoc. 2018;8 doi: 10.21769/BioProtoc.2794. [DOI] [PMC free article] [PubMed] [Google Scholar]
- Trujillo C.A., Gao R., Negraes P.D., Gu J., Buchanan J., Preissl S., Wang A., Wu W., Haddad G.G., Chaim I.A., et al. Complex oscillatory waves emerging from cortical organoids model early human brain network development. Cell Stem Cell. 2019;25:558–569.e7. doi: 10.1016/j.stem.2019.08.002. [DOI] [PMC free article] [PubMed] [Google Scholar]
- Wang Y., Chiola S., Yang G., Russell C., Armstrong C.J., Wu Y., Spampanato J., Tarboton P., Ullah H.M.A., Edgar N.U., et al. Modeling human telencephalic development and autism-associated SHANK3 deficiency using organoids generated from single neural rosettes. Nat. Commun. 2022;13:5688–5725. doi: 10.1038/s41467-022-33364-z. [DOI] [PMC free article] [PubMed] [Google Scholar]
- Wei L., Roberts W., Wang L., Yamada M., Zhang S., Zhao Z., Rivkees S.A., Schwartz R.J., Imanaka-Yoshida K. Rho kinases play an obligatory role in vertebrate embryonic organogenesis. Development. 2001;128:2953–2962. doi: 10.1242/dev.128.15.2953. [DOI] [PubMed] [Google Scholar]
- Zang Z., Yin H., Du Z., Xie R., Yang L., Cai Y., Wang L., Zhang D., Li X., Liu T., et al. Valproic acid exposure decreases neurogenic potential of outer radial glia in human brain organoids. Front. Mol. Neurosci. 2022;15 doi: 10.3389/fnmol.2022.1023765. [DOI] [PMC free article] [PubMed] [Google Scholar]
Associated Data
This section collects any data citations, data availability statements, or supplementary materials included in this article.
Supplementary Materials
Data Availability Statement
-
•
All original code has been deposited at Github and is publicly available as of the date of publication: https://github.com/qianqianshao/SOSRS
-
•
Any additional information required to reanalyze the data reported in this paper is available from the lead contact upon request.