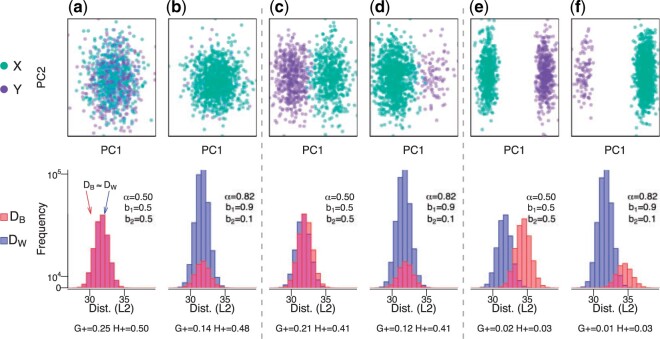
Fig. 1.
The  discordance metric varies as function of
  (proportion of within-cluster distances), which is a function of the group balance. We randomly sampled
  = 1000 observations with 500 features from a mixture distribution
  with
with  being the probability of an observation coming from
  and
and  coming from
  with (a,b) no mean difference (
 ) (or a “null” setting), (c,d) a small mean difference (
 ), and (e,f) a large mean difference (
 ). We simulate data with (a,c,e) balanced groups (
 = 0.5) and (b,d,f) imbalanced groups (
 = 0.9). For each simulation, the top row contains observations belonging to a group (
 and
and  ) along the first two principal components (PCs) and the bottom row contains histograms of the within- (
 ) and between- (
 ) cluster distances (Euclidean) for the balanced and imbalanced groups. Refer to Figure S1 of the Supplementary material available at Biostatistics online for an illustration of (and Section 2.4.1 for the explicit relationship between) the proportion of within-cluster distances (
 ) and the group balance (
 ). For each simulation, the bottom row includes
  and the two discordance metrics
  and
and  . Generally, values close to zero represent more concordance, while a larger values represent more discordance.

