

Abstract
The placenta is a dynamic organ that must perform a remarkable variety of functions during its relatively short existence in order to support a developing fetus. These functions include nutrient delivery, gas exchange, waste removal, hormone production, and immune barrier protection. Proper placenta development and function are critical for healthy pregnancy outcomes, but the underlying genomic regulatory events that control this process remain largely unknown. We hypothesized that mapping sites of transcriptional enhancer activity and associated changes in gene expression across gestation in human placenta tissue would identify genomic loci and predicted transcription factor activity related to critical placenta functions. We used a suite of genomic assays [i.e., RNA-sequencing (RNA-seq), Precision run-on-sequencing (PRO-seq), and Chromatin immunoprecipitation-sequencing (ChIP-seq)] and computational pipelines to identify a set of >20 000 enhancers that are active at various time points in gestation. Changes in the activity of these enhancers correlate with changes in gene expression. In addition, some of these enhancers encode risk for adverse pregnancy outcomes. We further show that integrating enhancer activity, transcription factor motif analysis, and transcription factor expression can identify distinct sets of transcription factors predicted to be more active either in early pregnancy or at term. Knockdown of selected identified transcription factors in a trophoblast stem cell culture model altered the expression of key placental marker genes. These observations provide a framework for future mechanistic studies of individual enhancer–transcription factor–target gene interactions and have the potential to inform genetic risk prediction for adverse pregnancy outcomes.
Keywords: placenta, trophoblast, stem cell, gene expression, transcription factor, genomics, RNA-sequencing (RNA-seq), chromatin immunoprecipitation-sequencing (ChIP-seq)
Mapping sites of transcriptional enhancer activity and associated gene expression in human placenta across gestation identifies genomic loci and predicted transcription factor activity related to critical placenta functions.
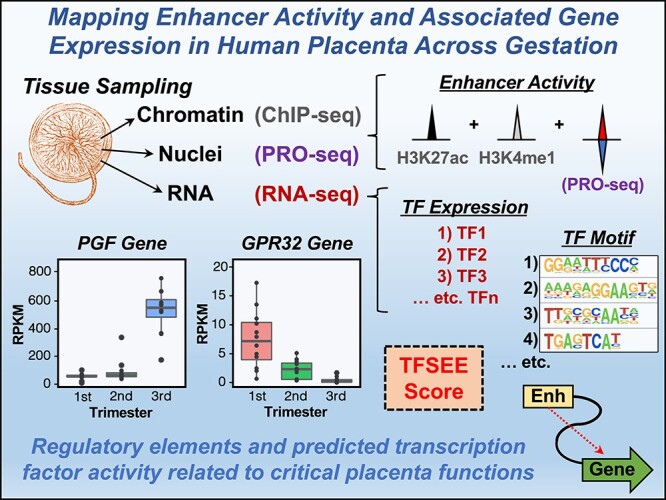
Graphical Abstract
Graphical Abstract.
Introduction
The placenta is a dynamic organ that performs a remarkable variety of functions, including nutrient delivery, gas exchange, waste removal, hormone production, and immune barrier functions [1, 2]. Many of these functions take place within the floating villi of the placenta where maternal blood comes into direct contact with the syncytiotrophoblast (ST) [3, 4] The ST is formed as underlying cytotrophoblasts differentiate and fuse to form this multinucleated layer that increases in surface area over the course of pregnancy [5]. As villi develop into their highly branched mature forms, the relative proportion of cytotrophoblasts and their trophoblast stem cell (TSC) precursors decreases [3, 4]. Altered villous maturation has been associated both with preterm birth and stillbirth [6, 7]. Furthermore, release of soluble vasoactive factors from the placenta plays a role in the development of preeclampsia [8, 9].
While proper placenta development and function is critical for healthy pregnancy outcomes, the underlying genomic regulatory events that control this process are only beginning to be understood [10–12]. In this regard, a number of studies using microarrays [13–16], bulk RNA-seq [17–19], and single cell RNA-seq (scRNA-seq) [20–27] have examined aspects of how gene expression in the placenta changes over time in normal or pathologic pregnancies [10, 12, 28]. A number of studies have focused on differences in gene expression in placenta tissue in response to disease [12, 22, 27–33], while others have used genomic profiling to define distinct cell types in the placenta [10, 11, 21, 33–37]. Fewer studies, however, have examined how diverse genomic features [e.g., transcription, histone modification, DNA methylation, transcription factor (TF) binding, chromatin accessibility, and chromatin interactions] change over the course of normal development. This is partly due to the limited accessibility of placenta tissue from early pregnancy samples, which results in an incomplete picture of gene regulation, and its associated epigenomic events such as enhancer formation. Nonetheless, current genomics technologies can facilitate the analysis of these genomic features in available tissues, including those features that define transcriptional enhancers [11, 38–40].
Enhancers are genomic regulatory elements that function as nucleation sites for the binding of sequence-specific TFs and the formation of regulatory complexes that can communicate with the promoters of target genes [41]. Enhancers are characterized by common molecular features such as (1) an open or accessible chromatin environment; (2) enrichment of a common set of histone modifications, such as histone H3 lysine 4 (H3K4) monomethylation and histone H3 lysine 27 (H3K27) acetylation; (3) binding of TFs, coregulators, and chromatin remodeling enzymes; and (4) looping to target gene promoters [41, 42]. Enhancers are also actively transcribed, producing enhancer RNAs (eRNAs) [42]. Differential accumulation of these molecular features defines distinct classes of enhancers that specify distinct gene regulatory mechanisms and biological outcomes. Enhancer transcription and eRNAs are thought to function by (1) promoting the recruitment of TFs and coregulators and regulating their activities; (2) facilitating RNA polymerase II (RNAPII) pause-release to promote transcription elongation; and (3) driving enhancer–promoter looping [42]. The NIH ENCODE and Roadmap epigenomics projects have annotated enhancer elements from a limited set of placenta samples on the basis of chromatin accessibility (Deoxyribonuclease-sequencing; DNase-seq) or histone modifications.
Our lab and others have shown that enhancer transcription and the production of eRNAs are the most specific marker of active enhancers [43–45]. The sites of enhancer transcription can be identified by mapping short unstable eRNA transcripts from nuclear run-on assays, such as precision run-on sequencing (PRO-seq) data. This technique uses biotinylated ribonucleotides in an in vitro transcription reaction from isolated nuclei followed by pull-down and sequencing to identify sites of active transcription. This approach, however, has not yet been applied to the study of enhancers in human placenta tissue. In this work, we used a multi-faceted approach combining genomic and computational analyses to define changes in the enhancer landscape and gene expression across gestation in normal pregnancy, using samples from all three trimesters. While machine learning approaches have been applied to predict new placenta-specific enhancers from existing genomic data [46], our work approximately doubles the number of available samples with experimentally determined enhancer annotations and does so using enhancer transcription, a more stringent marker of enhancer activity.
Materials and methods
Source of placenta tissue
Placenta tissue was collected from patients who provided informed consent; it was obtained in a de-identified manner from a tissue bank at UT Southwestern under an approved IRB protocol (term samples) or from Advanced Bioscience Resources, Alameda, CA (early pregnancy samples). The latter was obtained prior to January 1, 2019. Tissue was from otherwise normal, uncomplicated pregnancies collected at the time of scheduled cesarean delivery or elective pregnancy termination. Samples were taken from multiple sites for each placenta, using four quadrant biopsies from term placenta and approximating this strategy to the extent permitted from early pregnancy tissues. The maternal decidual surface and fetal amnionic surfaces were excluded or removed, with sampling performed from the region of floating villi in the interior of the placenta. Tissue was rinsed in PBS, flash-frozen, and stored at −80°C until processed. Multiple tissue samples were pooled from an individual placenta for extraction of RNA, nuclei, or chromatin in order to achieve more representative sampling across multiple locations in a single placenta.
RNA extraction and RNA-seq library construction
Frozen tissue was pulverized using a liquid nitrogen–chilled hammer mill and then homogenized in Trizol. Following chloroform-mediated phase separation, the total RNA was purified from the aqueous phase using RNeasy columns (Qiagen, 74104) according to the manufacturer’s protocol. The RNA concentration was quantified using a NanoDrop, and the quality was assessed by RNA ScreenTape (Agilent). The total RNA was stored at −80°C until processed. Following standards defined by the Genome-Tissue Expression (GTEx) project [47], only samples with an RNA integrity number (RIN) score > 6 were used for library construction. Ten micrograms of total RNA were used as input for polyA RNA-seq library construction as previously described [48].
Nuclei extraction and PRO-seq library construction
Frozen tissue was pulverized using a liquid nitrogen–chilled hammer mill, homogenized in ice-cold Swelling Buffer [10 mM Tris–HCl pH 8, 2 mM magnesium acetate, 3 mM calcium chloride, 0.25 mM DTT, and 1x cOmplete protease inhibitor cocktail (Roche, 11697498001)], and passed through a 40 micron filter. The nuclei were released from the pulverized tissue in Lysis Buffer (Swelling Buffer containing 10 mM NaCl, 300 mM sucrose, and 0.5% NP-40), washed three times in Lysis Buffer, and flash-frozen in Nuclei Freezing Buffer (50 mM Tris–HCl pH 8.3, 5 mM magnesium chloride, 0.1 mM EDTA, 40% glycerol) in aliquots of 5 × 10⁶ nuclei. Nuclear run-on was performed at 37°C for 5 min using biotin-labeled CTP [49]. PRO-seq libraries were constructed following the protocol of Mahat and colleagues [49].
Chromatin preparation and ChIP-seq library construction
Frozen tissue was pulverized using a liquid nitrogen–chilled hammer mill, crosslinked with 1% formaldehyde in a volume of 10 mL, quenched by addition of 5 mL of 2.5 M glycine for 5 min at 4°C, washed generously in ice-cold PBS, and homogenized in Farnham Lysis Buffer (5 mM PIPES pH 8, 85 mM KCl, 0.5% NP-40, 1 mM DTT, 1x cOmplete protease inhibitor cocktail), as described [50]. The nuclei were collected by brief centrifugation and resuspended in SDS Lysis Buffer (50 mM Tris–HCl pH 7.9, 1% SDS, 10 mM EDTA, 1 mM DTT, 1x cOmplete protease inhibitor cocktail) by pipetting and incubating on ice for 10 min. The chromatin was sheared to ~200 bp DNA fragments by sonication using a Bioruptor sonicator (Diagenode) for 24–28 cycles of 30 s on and 30 s off. Fragment size was verified by agarose gel electrophoresis before quantification of protein concentrations using a BCA protein assay kit (Pierce, 23225). One hundred micrograms of soluble chromatin was precleared with Protein A Dynabeads (Invitrogen, 10001D) before incubation overnight with 2.5 μg of antibody: H3K4me1 (Abcam, ab8895) or H3K27ac (Abcam, ab4729). ChIP-seq libraries were constructed as described previously [51].
Next-generation sequencing
The genomic libraries with compatible barcodes were pooled and sequenced on the Illumina NextSeq 500 in a 75 bp single-end format. The libraries were sequenced to an average depth as follows: RNA-seq ~52 M reads per sample; PRO-seq: ~73 M reads per sample; and ChIP-seq ~32 M reads per sample.
Analysis of RNA-seq data
Quality check and preprocessing RNA-seq libraries
The raw data were subjected to QC analyses using the FastQC tool [52]. The reads were then mapped to the human genome (hg38) using the spliced reader aligner TopHat version.2.0.13 [53]. Uniquely mappable reads were converted into bigWig files using BEDTools (version 2.17.0) for visualization in the Integrative Genomics Viewer (version 2.9.4). Transcriptome assembly was performed using cufflinks (version 2.2.172) [54] with default parameters using the aligned reads. The transcripts were merged into distinct, non-overlapping sets using cuffmerge, followed by cuffdiff to call the differentially regulated transcripts.
Data normalization
Using cuffdiff, FPKMs and fragment counts were scaled via the median of the geometric means of fragment counts across all libraries, as described by Anders and Huber [55]. The resulting normalized FPKM values were used to compare the genes regulated in the three trimesters with linked enhancer transcription via statistical methods implemented in R, such as Pearson correlation analysis, linear regression of FPKM versus gestational age in weeks, and differences in mean FPKM value between groups using t-tests with correction using the Benjamini–Hochberg procedure. The Benjamini–Hochberg procedure was used to adjust p-values for multiple hypothesis testing. The normalized FPKM values were also used in subsequent downstream analyses, including differential expression by trimester, correlation with gestational age, and integrated analysis with ChIP-seq and PRO-seq data as described below.
Gene Ontology enrichment analysis
Pathways associated with genes that increase or decrease in the placenta across pregnancy were identified using Gene Ontology (GO) annotations [56] for GO biological process gene sets and the PANTHER enrichment analysis tool [57].
Analysis of ChIP-seq data
The reads were trimmed using Cutadapt (version 1.9.1) [58] and mapped to the hg38 reference genome using Bowtie (version 1.0.0) [59]. Output files were converted into BED files using SAMTools (version 0.1.19) [60] and BEDTools (version 2.17.0) [61]. The aligned reads were used to measure library complexity using BEDTools (v 2.17.0) [61] and met minimum ENCODE data quality standards [62]. Using aligned reads as input, we used MACS (version 2.1.0) software [63] to call peaks from ChIP-seq data using the default p-value and input condition as a control. Uniquely mapped reads were visualized on the UCSC genome browser as bigWig files generated using BEDTools [61].
Analysis of PRO-seq data and prediction of enhancers using dREG
Quality check and preprocessing PRO-seq libraries using Proseq2.0
The quality of the data was confirmed using FastQC software [52]. The PRO-seq libraries were analyzed using Proseq2.0 pipeline [64] and aligned to human reference genome hg38 with ~72% average alignment percentage. The aligned bam files were converted into bigwig format using deeptools (v2.3.5) [65] and bedGraphToBigWig [66] program to visualize in the UCSC genome browser [67].
Identification of enhancers using dREG
The unnormalized bigwig files generated from Proseq2.0 were used to predict enhancers/transcription regulatory elements (TREs) using the dREG package on the dREG computational gateway [68]. We then built a universe of transcripts by merging the dREG peak calls from individual samples across each gestational age and stratifying the boundaries to remove overlaps/redundancies occurring from the union of all the dREG peak calls using BEDtools merge (v2.17.0) [61]. Next, we calculated the RPKM of the union of TREs or peak calls by collecting the read counts from bedtools multicov [61] and filtering the results to identify a subset of short intergenic transcripts >5 kb away from the 5′ or 3′ ends of annotated genes using bedtools intersect [61]. The final universe of expressed distal TREs (n = 20 502) combined from all samples was determined from the PRO-seq data using an RPKM cutoff ≥2 in at least 1 out of the 36 samples across the gestational age.
Identification of TF motifs using MEME
We performed de novo motif analyses on a 1 kb region (±500 bp) surrounding the TRE summit for expressed TREs in each sample using the command-line version of MEME [69]. The following parameters were used for motif prediction: (1) zero or one occurrence per sequence (− mod zoops); (2) number of motifs (−nmotifs 15); (3) minimum, maximum width of the motif (− minw 8, −maxw 15); and (4) search for motif in given strand and reverse complement strand (− revcomp). The predicted motifs from MEME were matched to known motifs using Tomtom [70] using the Jaspar 2018 database [71].
Predicting trimester-specific TFs using Total Functional Score of Enhancer Elements
We used the Total Functional Score of Enhancer Elements (TFSEE) algorithm as described previously [72, 73] to combine PRO-seq, RNA-seq, and ChIP-seq data with TF motif information to predict the TFs that drive the formation of active enhancers in placenta across gestation. In order to use the TFSEE pipeline, we obtained the following information for the final universe of expressed distal TREs (n = 20 502) in 15 samples that had PRO-seq, RNA-seq, and ChIP-seq data available: (1) enhancer transcription values using PRO-seq; (2) histone modification enrichment values at the enhancers using ChIP-seq (H3K4me1 and H3K27ac); (3) motif search results; and (4) TF expression values using RNA-seq. The TFSEE algorithm was then applied to determine the enhancer activity by normalizing the enhancer transcription and histone modification enrichment and then integrating with the motif predictions and TF expression to calculate the final TFSEE score [72, 73]. To identify trimester-specific TFs, we performed hierarchical clustering by Pearson correlation and the average linkage method. The rank order of the TFs that were enriched between the clades comprising trimesters I and II versus trimester III was calculated as described [72, 73].
Enhancer single-nucleotide polymorphism analysis
The NHGRI-EBI genome-wide association study (GWAS) catalog was downloaded on 9/1/2020 and contained 130 789 single-nucleotide polymorphisms (SNPs) associated with any outcome by GWAS. The bedtools intersect function [61] was used to count the number of SNPs overlapping either the annotated genes (GENCODE transcripts) or the placenta enhancers identified in this study. SNP density was calculated by dividing the entire SNP catalog by the total genome size or the resulting overlapping SNPs by the size of these regions in base pairs to generate SNPs per million base pairs.
Data visualization
Data from the different sequencing methodologies were visualized and compared in browser track representations using the Integrative Genomics Viewer (IGV; Broad Institute). After data analysis using the relevant statistical tools or packages in R, visual representations in the form of boxplots, bar graphs, and dot plots were generated in R using the ggplot2 package [74]. Heatmaps were generated using Java Tree View [75] or the heatmap function in R.
Trophoblast stem cell culture and differentiation
Growth and differentiation
A TSC line developed by Okae et al. [76] was cultured under conditions that they optimized. For TSC propagation, the cells were grown on collagen-coated plates in basal medium [DMEM/F12 supplemented with 0.003% BSA, 1x ITS-X (Wako Chemicals, 094–06761), 0.1 mM β-mercaptoethanol] supplemented with 0.05 μg/mL EGF (Sigma, E9644), 0.002% FBS, 1.5 μg/mL ascorbic acid, 0.0125% valproic acid (HDAC inhibitor; Wako Chemicals, 227–01071), 5 μM Y27632 (ROCK inhibitor; Stemcell Technologies, 72,304), 2 μM CHIR99021 (Wnt activator; Wako Chemicals, 034-23103), 0.5 μM A83-01 (TGF-β inhibitor; Wako Chemicals, 035-24113), and 1 μM SB431542 (TGF-β inhibitor; Wako Chemicals, 031-24291). Differentiation toward the ST lineage was performed in 2D culture using basal medium supplemented with 4% KnockOut Serum Replacement (ThermoFisher, 10828010), 2.5 μM Y27632, and 2 μM forskolin (Sigma, F6886).
Marker analyses, morphologic visualization, and confirmations
Gene markers of ST differentiation (CGB, ERVW-1, CYP19A1, GCM1) were assessed following 1–5 days of culture in differentiation medium using Taqman probes as described below. For visualization of morphology changes, TSCs were plated in collagen-coated chamber slides and grown under TSC propagation or ST differentiation conditions as described above. Membranes were stained with Di-8-ANNEPPS (ThermoFisher, D3167) and nuclei visualized with DAPI. Fresh cell stocks were regularly replenished from the original stocks every few months, verified for cell type identity using the GenePrint 24 system (Promega, B1870), and confirmed as mycoplasma-free every 3 months using a commercial testing kit.
RNAi-mediated TF depletion in TSCs
We used two approaches to knockdown TFs in the TSCs and SCs: (1) lentiviral-mediated delivery of shRNA constructs (to knockdown ZBTB7C and SNAI2) and (2) lipofectamine-mediated delivery of siRNAs (to knockdown GCM1).
Lentiviral-mediated delivery of shRNA constructs
For the former, we used shRNA constructs targeting human SNAI2 mRNA (TRCN0000284362) or human ZBTB7C mRNA (TRCN0000235012), or a control shRNA (SHC002), all of which were purchased from Sigma. We generated lentiviruses by transfection of the constructs described above, together with (i) an expression vector for the VSV-G envelope protein (pCMV-VSV-G, Addgene plasmid no. 8454); (ii) an expression vector for GAG-Pol-Rev (psPAX2, Addgene plasmid no. 12260); and (iii) a vector to aid with translation initiation (pAdVAntage, Promega) into 293 T cells using Lipofectamine 3000 Reagent (Invitrogen, L3000015) according to the manufacturer’s protocol. The resulting viruses were collected in the culture medium, concentrated by using a Lenti-X concentrator (Clontech, 631231), and used to infect TSC cells seeded at a density of 2 × 10⁵. Stably transduced cells were selected with puromycin (Sigma, P9620; 2.5 μg/mL) in cell culture medium.
Lipofectamine-mediated delivery of siRNAs
In a 6-well plate, 0.5 × 10⁶ TSCs were seeded. After attachment, the cells were transfected using Lipofectamine RNAiMAX reagent (Invitrogen,13778150) according to the manufacturer’s instruction. Briefly, 30 pmole of siRNA in 150 μL optiMEM and 9 μL of RNAiMAX in 150 μL optiMEM were combined, incubated for 5 min, and dispensed into a single well. Seventy-two hours after transfection, the cells were collected for analysis.
Reverse transcription-quantitative PCR
Total RNA was extracted from cultured cells using an RNAeasy kit (Qiagen, 74104), quantified by using a NanoDrop; mRNA expression was analyzed using the following approaches.
Standard reverse transcription-quantitative PCR
Complementary DNA pools were prepared from TSCs using the RNeasy kit (Qiagen), followed by reverse transcription using MMLV reverse transcriptase (Promega, M150B) with oligo(dT) primers (Sigma-Aldrich). The cDNA was treated with 3 units of RNase H (Ambion) for 30 min at 37°C and then analyzed by qPCR using the primer sets listed below and a LightCycler 480 real-time PCR thermocycler (Roche) for 45 cycles. The delta–delta Ct (2–∆∆Ct) method was used to analyze comparative fold changes in the gene expression level [77].
MAFK Forward 5’-CTGCGCTCCAAGTACGAGGCG-3’
MAFK Reverse 5’-TCGGTGGACTTGACGATGGTGA-3’
MAFB Forward 5’-AGACGCCTACAAGGTCAAGTGC-3’
MAFB Reverse 5’-CGACTCACAGAAAGAACTCGGG-3’
SNAI2 Forward 5’-TTTTCCAGACCCTGGTTGCTT-3’
SNAI2 Reverse 5’-GAGCCCTCAGATTTGACCTGT-3’
IRF1 Forward 5’-GAGGAGGTGAAAGACCAGAGCA-3’
IRF1 Reverse 5’-TAGCATCTCGGCTGGACTTCGA-3’
ZBTB7C Forward 5’-GGAGAAGCCATACATGTGCACC-3’
ZBTB7C Reverse 5’-ACGAACTTGGCGTTGCAGTGGA-3’
TFAP2A Forward 5’-GACCTCTCGATCCACTCCTTAC-3’
TFAP2A Reverse 5’-GAGACGGCATTGCTGTTGGACT-3’
Taqman assay
RNA was reverse-transcribed using the High Capacity cDNA Reverse Transcription kit (ThermoFisher, 4368814). Quantitative PCR was performed using Taqman probes listed below (ThermoFisher), Taqman Fast Advanced Master Mix (ThermoFisher, 4444554), and 10 ng cDNA template in a 384-well format. Amplification and detection were performed using a LightCycler 480 real-time PCR thermocycler (Roche), and fold changes in expression were calculated using the delta–delta Ct (2–∆∆Ct) method [77].
Taqman CGB3 assay Hs00361224_gH
Taqman CYP19A1 assay Hs00903411_m1
Taqman ERVW-1 assay Hs00205893_m1
Taqman GCM1 assay Hs00172692_m1
Taqman HLA-G assay Hs00365950_g1
Western blotting
Nuclear extracts were prepared from either undifferentiated or differentiated trophoblast as described previously [78]. The protein concentrations of the extracts were quantified using a Bradford assay (Biorad, 500-0006). Ten micrograms of total protein were run on 12% acrylamide SDS-PAGE gels and transferred to nitrocellulose membranes by wet transfer for 120 min. Blocking, incubation with antibodies, and washing of blots were done in TBST buffers, with blocking for 1 h in 3% milk, incubation with primary antibody overnight, and HRP-conjugated secondary antibody (Bethyl Labs; 1:6 000 dilution) for 1 h. Signals were visualized by chemiluminescence with SuperSignal Pico Plus regent (ThermoFisher, 1863096) and imaged on the ChemiDoc system (BioRad).
Genomic data set availability
The following new data sets generated for this study are available from the NCBI’s Gene Expression Omnibus (GEO) database (http://www.ncbi.nlm.nih.gov/geo/) using accession number GSE222035.
Results
Collection and processing of normal placenta samples for genomic analyses
In order to identify changes in gene expression and associated changes in the enhancer landscape during normal pregnancy, we prepared multidimensional genomic libraries from a set of placenta samples representing normal development across all three trimesters of pregnancy. The 12 samples collected per trimester were balanced for fetal sex (Figure 1A and B). Samples were obtained with informed consent from patients with otherwise uncomplicated pregnancies undergoing scheduled cesarean delivery (not in labor) or from patients undergoing elective termination (without known fetal anomalies). As reflected in the sample characteristics (Figure 1B), our intention to model placenta development across “normal” pregnancy resulted in a gap of accessible tissue from the time of viability to term.
Figure 1.

Multidimensional placenta genomic profiling across gestation enables enhancer annotation linked to gene expression. (A) Schematic representation of placenta tissue sample processing for genomic assays. We collected first-, second-, and third-trimester placenta tissue from otherwise normal, uncomplicated pregnancies at the time of elective pregnancy termination or scheduled cesarean delivery. Samples were taken from multiple sites for each placenta and multiple tissue fragments were pooled on a per-sample basis for extraction of RNA, nuclei, or chromatin to prepare genomic libraries for deep sequencing assays (RNA-seq, ChIP-seq, PRO-seq). (B) Gestational age, sex, and libraries constructed from the placenta tissues collected. Sex was determined based on Y chromosome markers from RNA-seq. EGA, estimated gestational age in weeks. Exact gestational ages for the third-trimester placentas are as follows: P08 - 39w1d; P09 - 39w1d; P10 - 39w0d; P11 - 39w2d; P12 - 39w0d; P13 - 39w0d; P21 - 39w0d; P32 - 39w0d; P47 - 39w1d; P48 - 39w3d; P49 - 39w0d; P50 - 39w0d, where “w” is weeks and “d” is days. Due to the nature of the collections for the first and second trimester placental samples, we do not have data more granular than gestational age in weeks. (C) Genome browser tracks showing ChIP-seq (H3K27ac, H3K4me1), PRO-seq, and RNA-seq from a 39-week placenta sample showing the promoter region and a putative enhancer (both marked with hatched boxes) near the placenta growth factor (PGF) gene (the gene schematic is shown).
We isolated RNA, chromatin, or nuclei (Figure 1A) from bulk placenta tissue samples due to the input requirements for the nuclear run-on reactions used in our enhancer mapping strategy. This represents a tradeoff between the ability to assign findings to specific cell types (as with single-cell methodologies) and the types of assays and information that can be obtained with limiting amounts of starting material. As many critical placenta functions occur at the maternal–fetal interface of the ST surface, we focused on the floating villi in the interior of the placenta, which make up the greatest portion of the placenta by volume and surface area. Although this sampling generates a composite signature from multiple cell types (primarily trophoblasts, fetal vessels, and placental macrophages), complexity was reduced by excluding the fetal surface and associated membranes, as well as the decidual surface with associated maternal tissue, extravillous trophoblasts, and decidual immune cell populations.
Determining gene expression and enhancer landscapes in normal placenta
To determine changes in gene expression in placental villi, RNA-seq and precision run-on sequencing [49] libraries were constructed from all 36 samples and sequenced to an average depth of ~52 and ~ 73 M million mapped reads, respectively. We identified transcription units from the PRO-seq data using dREG [79]. We then defined active enhancer regions for all samples based on enhancer transcription from PRO-seq, which we and others have shown to be a highly specific marker of active enhancers [72]. To isolate likely enhancers from other transcription units, the transcripts were filtered for location in intergenic regions >5 kb away from the transcription start sites (TSSs) of known genes as annotated by GENCODE [80]. An RPKM threshold cutoff of >2 in at least 1 sample was applied to reduce background noise and false positives. This filtering resulted in a universe of 20 502 enhancers across all samples, with between ~2 500 and ~ 10 000 enhancers identified in each of the 36 samples (Supplementary Table S1). We further characterized the predicted enhancers using chromatin immunoprecipitation (ChIP-seq) for H3K27ac and H3K4me1 in a representative subset of five samples per trimester. The multiple layers of genomic information facilitated the identification of enhancers located near genes related to placenta function, such as the gene encoding placenta growth factor (PGF) (Figure 1C).
Placenta gene expression is dynamic across pregnancy
Next, we sought to explore changes in gene expression across gestation using two different approaches. In the first approach, we identified genes whose expression (in RPKM) was either positively or negatively correlated with gestational age in weeks, using Pearson R > 0.7 or < −0.7, and a significant p-value for the correlation after Bonferroni correction for multiple hypothesis testing (p < 2.17 × 10⁻⁶ for 23 000 tested associations) (Supplementary Table S2). This analysis resulted in 1152 genes with decreased expression across gestation and 2482 genes that increased across gestation. Examples of such genes are shown in Figure 2A and B (MTHFD1 and CYP19A1). MTHFD1 encodes an enzyme in the DNA synthesis pathway downstream from folate, whereas CYP19A1 encodes the aromatase enzyme involved in estrogen synthesis in STs. To visualize overall trends in gene expression that increased or decreased across gestation, the expression of individual genes within a sample were z-score-normalized, binned into five groups of increasing gestational age, and plotted as box plots (Figure 2C and D).
Figure 2.
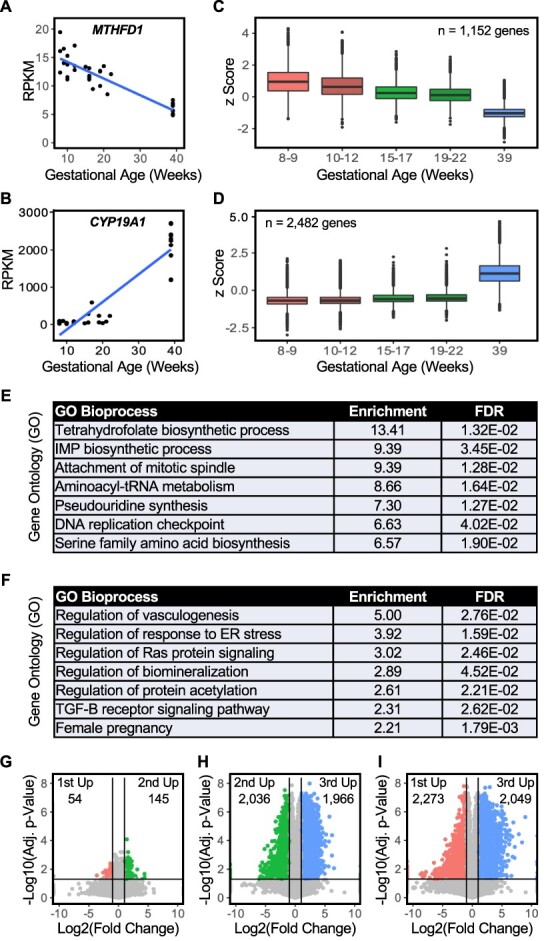
Gene expression is dynamic across pregnancy. RNA-seq analysis of placenta gene expression across gestation. Differential expression analyses identified 3634 genes whose expression correlated with gestation age in weeks. (A–D) Analysis of individual genes whose expression decreases (MTHFD1; A) or increases (CYP19A1; B) across gestation shown as scatter plots with linear regression. Box plots (C and D) show trends for all genes where expression is negatively correlated (C) or positively correlated (D) with increasing gestational age. (E and F) Gene ontology analysis for sets of genes whose expression decreases (E) or increases (F) across gestation. (G–I) Pairwise analyses of gene expression between trimesters identifies more significant gene expression differences for the third trimestercompared to the first or second trimesters than between the first and second trimesters.
We performed GO analyses for genes correlated with gestational age (Figure 2E and F; Supplementary Table S3). For the set of genes more highly expressed early in pregnancy, there was enrichment for terms associated with DNA synthesis, DNA replication, and cell division. This period of cell proliferation in early pregnancy may be associated with a pool of self-renewing TSCs that decreases in proportion or activity later in pregnancy. In support of this idea, we observed that the gene encoding telomerase (TERT) was expressed in 10 out of the 12 first-trimester samples (0.1–0.4 RPKM) and absent in later samples. Interestingly, for the set of genes more highly expressed later in pregnancy, GO analysis identified terms related to vasculogenesis and TGFβ signaling (Figure 2F). Vasculogenesis is required for the dramatic expansion of the fetal capillary network in mature villi [81]. Moreover, inhibition of TGFβ is critical for maintaining the TSC phenotype in culture, and thus, signaling through this pathway may be important for differentiation. Indeed, TGFβ has been implicated in both syncytium formation and regulating invasiveness of extravillous trophoblasts [82].
We also performed pairwise comparisons of samples grouped by trimester as an alternate approach for determining gene expression changes across pregnancy. Figure 2G–I shows genes whose expression exhibits greater than a 2-fold difference (vertical lines) between trimesters based on a significant t-test p-value with Benjamini–Hochberg correction (see also Supplementary Table S4). These data again show that the most substantial differences in gene expression are between term and early pregnancy.
Finally, we explored the possibility that the relative proportion of cell types, as well as changes in gene expression within a given cell type, could change across gestation and that both processes might contribute to the signal obtained from bulk tissue analysis. We used gene signatures from single-cell RNA-seq obtained from The Human Protein Atlas database enriched in cytotrophoblasts (420 genes), STs (790 genes), and extravillous trophoblasts (680 genes). By comparing the average expression of these gene sets in our RNA-seq datasets from the gestational age epochs defined in Figure 2C and D, we observed that the extravillous trophoblast and cytotrophoblast signals do not significantly change between gestational age groups, while the ST signal is significantly increased in the third trimester, as would be expected (Supplementary Fig. S1).
Linking placenta gene expression to enhancer activity across pregnancy
After demonstrating that gene expression in the placenta is dynamic and reflects known placenta functions, we sought to link placenta gene expression with the enhancer landscape. We associated the 20 502 enhancers that we defined by their PRO-seq transcription signature with the nearest neighboring gene (Figure 3A). To assess whether the genes identified in this analysis are the same as those identified in Figure 2 using only RNA-seq, we determined the relationship between nearest neighboring genes and the enriched enhancers determined by both approaches. Although only a minority of the genes overlap, in all cases where overlap exists, the number of genes overlapping (i.e., identified independently by both differential RNA-seq and nearest neighbor enhancer activity) is significant by the hypergeometric distribution test (i.e., when compared to the probability of overlap for randomly selected gene lists in sets of the same size) (Supplementary Table S5 and Supplementary Figure S2). We then determined gene ontologies for the associated genes using the Genomic Regions Enrichment of Annotations Tool (GREAT) [83]. As shown in Figure 3B, the top GO bioprocesses for the nearest neighboring genes were terms related to placenta development. In a more detailed analysis, we overlapped the 20 502 enhancers in our data set with the 961 227 cis-regulatory elements (cCREs) annotated by ENCODE and found that our data set still contains 3 550 unique enhancer regions. GREAT analysis for this subset, like the entire set (Figure 3B), shows GO terms related to placenta development (Supplementary Table S6). This suggests that our transcription-based enhancer analysis efficiently identifies genomic regions relevant to the control of placenta-specific gene expression.
Figure 3.
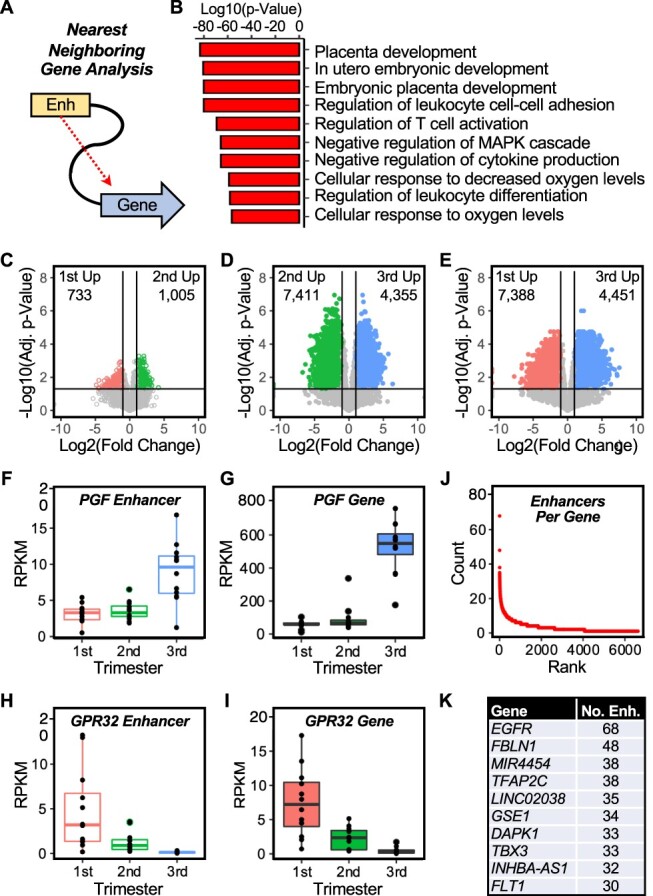
Enhancer activity is dynamic across pregnancy, and associates with genes related to placenta function and disease. Analysis of the transcription of putative placenta enhancers defined by PRO-seq across gestation. This analysis identified a total of 20 502 enhancers. (A) Schematic analysis of the “nearest neighboring gene” analysis used to associate enhancers with target genes. (B) Gene ontology analysis of the nearest neighboring genes to the putative placenta enhancers defined by PRO-seq. (C–E) Pairwise analyses of enhancer transcription between trimesters identifies more significant enhancer transcription differences for the third trimester compared to the first and second trimesters. (F–I) Examples of genes whose enhancer transcription (F and H) correlates with nearest neighboring gene expression (G and I) across gestation. PGF (F and G), both enhancer transcription and nearest neighboring gene expression increase; GPR32 (H and I), both enhancer transcription and nearest neighboring gene expression decrease. (J and K) Enhancers per gene analysis. (J) Rank order plot of the number of putative placenta enhancers per differentially expressed gene across gestation. Most genes had only one or two potential enhancers identified from nearest neighboring gene analysis. (I) Genes with the highest potential for enhancer-mediated regulation include TFs and cell signaling molecules associated with trophoblast differentiation (TFAP2C, EGFR) and disease (FLT1).
Next, we determined if the enhancer landscape, like the gene expression landscape, is dynamic across gestation. We examined changes in enhancer transcription in pairwise comparisons between trimesters similar to the analyses we did for gene expression above. As we observed for gene expression, the biggest differences in the active enhancer landscape were between early and late pregnancy (Figure 3C–E; Supplementary Table S7). When we focused on genes with placenta-enriched expression relative to other tissues, we observed dynamic changes in enhancer activity that correlated with changes in nearest neighboring gene expression by trimester. This was evident for the genes encoding placenta growth factor (PGF; Figure 3F and G) and GPR32 (GPR32, a G-protein coupled receptor enriched in trophoblasts; Figure 3H and I) (for additional genes, see Supplementary Tables 1–3 and 7).
Enhancers act in cell type– and tissue type–specific manners to fine tune the expression of genes important for those systems. We hypothesized that genes particularly important for placenta function may be linked to multiple enhancer elements. We determined the number of enhancers per gene for the ~6 000 genes linked to a nearest neighboring enhancer from above. While the majority of linked genes have only one or two nearby enhancers, a small number of genes are linked to dozens of enhancers (Figure 3J). Notably, the gene with the most linked enhancers, encoding epidermal growth factor receptor (EGFR) (Figure 3K), is important for trophoblast function and is altered in cases of intrauterine growth restriction [84]. Likewise, FLT1 (encoding vascular endothelial growth factor receptor 1), another gene linked to many enhancers, is dysregulated in preeclampsia [85]. These findings suggest the possibility that enhancer dysfunction could play a role in adverse pregnancy outcomes.
Placental enhancers and disease associations
Genome-wide association studies have identified many thousands of SNPs associated with disease outcomes or other population variants. About half of these SNPs map to genomic regions outside of annotated transcripts, often corresponding to enhancer regions. To explore the possibility that enhancer loci identified in our analyses could be linked to disease phenotypes, we mapped disease-associated SNP density within enhancer elements relative to genes (GENCODE transcripts) using SNPs from a publicly available catalog [86]. We found that GWAS SNPs are enriched in the placental enhancers that we identified (Figure 4A), including one located upstream of FLT1, a gene whose expression increases in the second and third trimesters versus the first trimester (Figure 4B). Although GWAS associations are understudied in pregnancy relative to other disease states, the most robust GWAS SNP association for preeclampsia, rs4769613 (replicated in two studies [87, 88]), maps to the FLT1 enhancer region (Figure 4C–E; enhancer number 22). Interestingly, activity at the rs4769613-containing enhancer (determined by transcription levels), like FLT1 expression varies with gestational age (Figure 4B and C) and is positively correlated (though weakly) with FLT1 gene expression (Figure 4D; Supplementary Table S8). Similar results were observed with another preeclampsia-associated SNP, rs7318880 (Figure 4C–E; also in enhancer number 22) [89], providing independent identification of additional genetic variation at this enhancer associated with placenta-related disease and strengthening the biological plausibility of this enhancer serving a functional role in the placenta.
Figure 4.
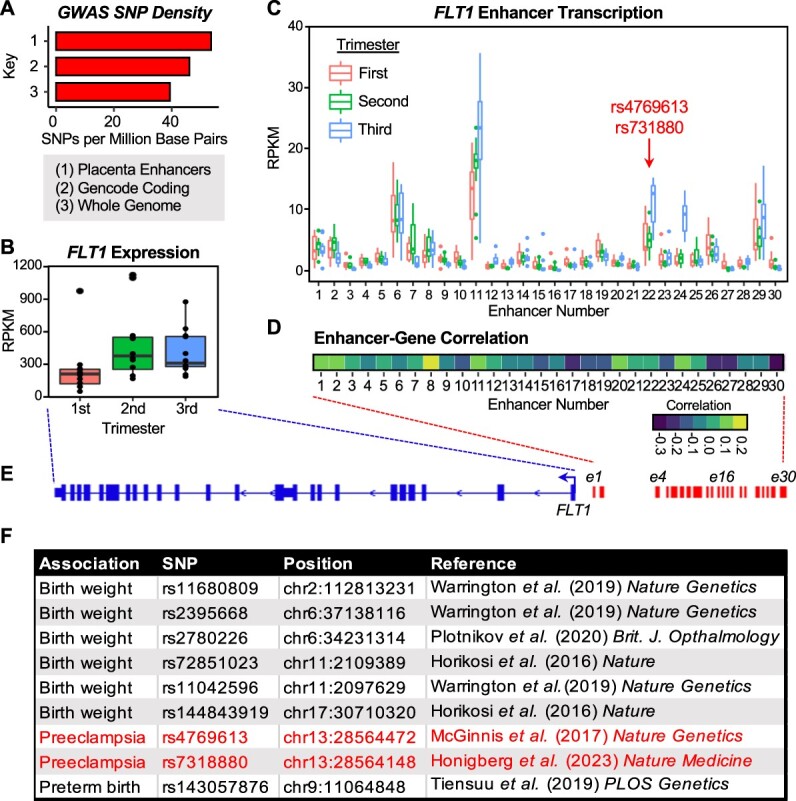
Placenta enhancers associate with risk for disease and pregnancy outcomes. (A) Single-nucleotide polymorphisms associated with disease in genome-wide association studies (GWASs) are enriched in enhancers relative to genomic background. Single-nucleotide polymorphisms in placenta enhancers defined by PRO-seq versus all GENCODE coding genes and the whole genome. (B) Expression across gestation of Fms related receptor tyrosine kinase 1 (FLT1), a gene that is linked to enhancers and is dysregulated in preeclampsia, from RNA-seq data. (C) Transcription levels of 30 putative enhancers located near the FLT1 gene determined by PRO-seq. Two previously reported SNPs associated with preeclampsia (rs4769613 [87, 88]; rs7318880 [89]) map to a putative FLT1 enhancer (e22). (D) Correlation of the transcription of putative FLT1 enhancers with FLT1 expression. A scale bar is shown. (E) Schematic diagram of the FLT1 gene and 30 putative enhancers (e1 through e30). (F) Additional SNPs associated with pregnancy outcomes, which map to enhancers identified in this study.
To further explore the link between genetic variation in enhancer regions and placenta function, we overlapped the location of eQTLs for gene expression in placenta tissue reported by Peng et al. [90] with the enhancers that we defined. Of the 1216 eQTLs from extragenic regions of the genome reported in that study, 80 of these map to enhancer regions we identified. These 80 enhancers and the cognate genes linked to the eQTLs are listed in Supplementary Table S9. Additional GWAS SNPs associated with pregnancy outcomes mapping within our enhancer data set are summarized in Figure 4F [87, 91–94]. Of note, these associations are between the fetal genome and the outcome of interest. Maternal GWASs linked to pregnancy outcomes via the placenta are more difficult to detect since only half of the SNPs in the placenta would be expected to derive from the maternal genome.
Predicting the transcription factors that promote enhancer formation and drive placental biology
Enhancer formation and activity is due to the binding of TFs at these loci. We sought to integrate enhancer activity (enhancer transcription by PRO-seq; H3K27ac and H3K4me1 enrichment by ChIP-seq), TF motif sequence information, and TF expression (by RNA-seq) to identify the TFs most likely mediating enhancer formation and biological outcomes in the placenta (Figure 5A). To accomplish this, we used a computational model developed in our lab, the TFSEE [72, 73]. Using the subset of 15 samples (5 per trimester) for which the required input data were available (PRO-seq, H3K27ac and H3K4me1 ChIP-seq, and RNA-seq), we determined enhancer activity scores for each enhancer in each sample (Figure 5A).
Figure 5.
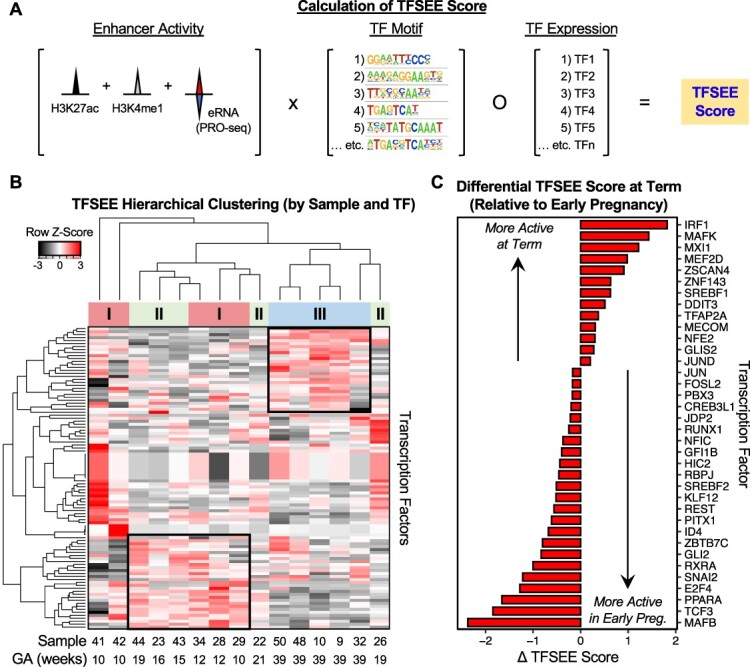
Integrated genomics predicts TF activity at enhancers across gestation. (A) Schematic for determination of TFSEE scores from multidimensional genomic datasets. For each enhancer, the top 20 conserved motifs were identified and linked to TF binding motifs with an associated p-value using MEME [69]. Transcription factor expression was multiplied by this matrix to yield a TFSEE score for each TF identified on a per sample basis. (B) Unsupervised hierarchical clustering identifies TFs where the TFSEE score is increased at term (top-right black box) or early pregnancy (bottom-left black box). (C) Differential TFSEE scores for individual TFs at term relative to early pregnancy. We identified TFs with statistically different TFSEE scores between early and late pregnancy (t-test, p < 0.05). We ranked the TFs by differential TFSEE score (TFSEElate − TFSEEearly) to identify those most likely to function at different times in pregnancy (“active in early pregnancy” and “active at term” as indicated).
For each enhancer, the top 20 conserved motifs were identified and linked to TF binding motifs with an associated p-value using MEME [69]. Finally, TF expression was multiplied by this matrix to yield a TFSEE score for each TF identified on a per-sample basis. Unsupervised hierarchical clustering of TFSEE scores largely grouped early pregnancy (first and second trimester) samples together, distinct from term pregnancy samples (Figure 5B). Given this empirical clustering pattern, we then identified TFs with statistically different TFSEE scores between early and late pregnancy (t-test, p < 0.05). We ranked the TFs by the differential TFSEE score (TFSEElate – TFSEEearly) to identify those most likely to function at specific times during pregnancy, including MAFB, SNAI2, and ZBTB7C active in early pregnancy, as well as IRF1, MAFK, and TFAP2A active at term (Figure 5C; Supplementary Table S10). Interestingly, pairs of TFs were identified on opposite ends of the TFSEE differential (MAFK vs. MAFB; SREBF1 vs. SREBF2), suggesting possible competition between related TFs for binding to common enhancer elements at different times during gestation.
Exploring the expression, activity, and function of TFSEE–identified transcription factors in trophoblast stem cells
To explore the expression, activity, and function of selected TFSEE-identified TFs in a defined cell system, we used the TSC culture protocol developed by Okae and colleagues [76] under stem cell propagation conditions [e.g., in the presence of EGF, ascorbic acid, valproic acid, ROCK inhibitor (Y27632), Wnt activator (CHIR99021), ALK-5 inhibitor (A83–01), and TGFβ inhibitor (SB431542)]. In some cases, we also stimulated differentiation of the TSCs toward the ST lineage (e.g., in differentiation medium including Y27632 and forskolin for 1–5 days, replacing the medium every 2 days). We verified the differentiation of TSCs to STs by (1) morphology (loss of mononuclear cell membranes staining due to cell fusion) (Figure 6A), (2) appropriate expression of ST-specific marker genes (including CG3B, CYP19A1, ERVW-1, and GCM1) (Figure 6B and C), and (3) minimal expression of an extravillous trophoblast (EVT) marker gene (HLA-G) (Figure 6C and D).
Figure 6.

Expression of TFSEE-identified TFs from placenta in TSCs and STs. In vitro differentiation of TSCs to STs using a culture system developed by Okae and colleagues [76]. (A) Verification of the differentiation of TSCs to STs based on cell morphology. Staining for mononuclear cell membranes and DNA as indicated. Scale bar = 5 μm. (B–D) Verification of the differentiation of TSCs to STs based on marker gene expression by RT-qPCR. (B) Expression of ST-specific marker genes (Chorionic gonadotropin subunit beta 3, CG3B; Cytochrome P450 family 19 subfamily A member 1, CYP19A1; Endogenous retrovirus group W member 1, ERVW-1; and Glial cells missing transcription factor 1, GCM1). (C) Key showing the marker genes representing the ST lineage and the extravillous trophoblast lineage. (D) Minimal expression of an extravillous trophoblast marker gene (Major histocompatibility complex class I G, HLA-G) in STs. Significance was determined by Student t-test; * = p < 0.05, n.s. = not significant. (E) Heatmap TF expression for multiple cell lines and replicates under TSC propagation conditions (two replicates each of two cell lines) or ST differentiation conditions (two or three replicates each of two cell lines). The TFs are grouped based on their expression (“up in early pregnancy” and “up at term” as indicated). (F) Expression of key TF proteins during a 5-day time course of differentiation from TSCs to STs determined by Western blotting of nuclear extracts. The results from the TFSEE analyses are shown for comparison (“active in early pregnancy” and “active at term” as indicated).
In further analyses, we examined the expression of the TFSEE-identified TFs in the published RNA-seq data sets from the Okae et al.’s paper [76]. The heatmap in Figure 6E shows the expression of selected TFs from that study for multiple cell lines and replicates under TSC propagation conditions (two replicates each of two cell lines) or ST differentiation conditions (two or three replicates each of two cell lines), focusing on the TFs highlighted in Figure 5C. The TFSEE scores from our analyses (Figure 5C) and the TF mRNA expression from the RNA-seq data (Figure 6E) trended similarly in some cases (i.e., early pregnancy vs. term; TSC vs. STs), but overall, the relationships were modest. This observation is unsurprising since TF mRNA expression is only one of a number of parameters that drives TFSEE score (Figure 5A).
Next, we examined the expression (protein and mRNA) of the selected TFs noted above (i.e., MAFB, SNAI2, and ZBTB7C active in early pregnancy, as well as IRF1, MAFK, and TFAP2A active at term) during a time course of differentiation from TSCs to STs by Western blotting and reverse transcription-quantitative PCR (RT-qPCR), respectively. The nuclear levels of IRF1, MAFK, and TFAP2A protein were low in TSCs, maximal by Day 3 of differentiation, and then tapered off by Day 5 (Figure 6F). In contrast, the nuclear levels MAFB, SNAI2, and ZBTB7C protein were elevated in TSCs and continued to increase during differentiation, but less dramatically than for IRF1, MAFK, and TFAP2A (Figure 6F). The expression levels of the IRF1, MAFK, and TFAP2A mRNAs from RNA-seq and RT-qPCR followed the expression levels of the proteins, but the expression levels of the MAFB, SNAI2, and ZBTB7C mRNAs exhibited some variability and disconnect between the mRNA and protein levels for some TFs (Supplementary Figure S3). Nonetheless, the protein and mRNA expression data tracked with and segregated the “more active in early pregnancy” (i.e., MAFB, SNAI2, and ZBTB7C) and “more active at term” (i.e., IRF1, MAFK, and TFAP2A) TFSEE-defined TFs, as expected.
Finally, we explored the activity and function of two TFs, ZBTB7C and SNAI2, which are predicted by TFSEE to be more active in early pregnancy, but are expressed both in TSCs and throughout the time course of differentiation (Figure 6F). To do so, we used an RNAi-mediated knockdown perturbation-response assay in undifferentiated TSCs. Knockdown of ZBTB7C reduced the expression of a number of ST marker mRNAs, including GCM1, but had no effect on the expression of HLA-G mRNA, a marker of EVTs (Figure 7A). In contrast, knockdown of SNAI2 had little effect on most of the same markers, but it did cause a reduction in the levels of GCM1 mRNA (Figure 7A). As a control, we knocked down GCM1 and assayed for the expression of marker genes. We observed a significant reduction in the levels of CGB3 and ERVW-1 mRNA, markers of the ST lineage (Supplementary Figure S4). Our results indicate that TFSEE can identify functionally relevant TFs in placenta whose perturbation can alter the expression of marker genes in TSCs.
Figure 7.

Activity and function of TFSEE-identified TFs in TSCs. Perturbation-response assays in undifferentiated TSCs, with shRNA-mediated knockdown of mRNAs encoding TFSEE-identified TFs, ZBTB7C and SNAI2. The expression of mRNAs encoding the knocked down TFs, as well as a set of EVT (HLA-G) and ST (CGB3, CYP19A1, ERVW-1, and GCM1) markers was assessed by RT-qPCR. Significance was determined by Student t-test; * = p < 0.05, ** = p < 0.01, and *** = p < 0.001, n.s. = not significant. (A) Effects of knockdown of ZBTB7C. (B) Effects of knockdown of SNAI2.
Discussion
In this work, we have provided a detailed analysis of the normal human placental transcriptome—both for steady-state RNA and active transcription—across gestation. In addition, we have used a computational algorithm called TFSEE to define the TFs that are likely to drive key aspects of placental biology during each trimester. Specifically, we have shown that (1) gene transcription and mRNA expression in the placenta across gestation is dynamic; (2) enhancer activity defined by enhancer transcription is also dynamic; (3) active enhancers in the placenta are located near genes relevant to placenta function; (4) placental enhancers are subject to genetic variation associated with disease; (5) integrated genomic data analysis using TFSEE identifies TFs that are predicted to change in activity across gestation, which may be missed by solely focusing on TF expression; (6) the expression of TFs predicted from TFSEE analysis are altered during the differentiation of TSCs to STs; and (7) knockdown of selected identified TFs in a TSC culture model altered the expression of key placental marker genes. These observations provide a framework for future mechanistic studies of individual enhancer–TF–target gene interactions and have the potential to inform genetic risk prediction for adverse pregnancy outcomes.
Connecting enhancer activity and gene expression to placenta function through gene ontology
Our analyses demonstrate how enhancer activity and gene expression can be used to understand placenta biology using the functions of individual genes or the ontologies of sets of genes. This can provide information that connects specific TFs to specific functions at different stages of placental development. For example, we showed that MTHFD1, a gene encoding an enzyme involved in the pathway of DNA synthesis downstream from folate, and thymidylate synthase (not shown) are more highly expressed in early pregnancy, consistent with the sensitivity of early trophoblasts to methotrexate [95] and reflected in the gene ontology analysis for pathways enriched in early pregnancy (Figure 2A, C, and E). In contrast, CYP19A1 (Figure 2B), a gene encoding the aromatase enzyme involved in estrogen synthesis in STs, increases across gestation, consistent with the ~100 fold increase in estrogen levels across pregnancy due to production in the placenta (Figure 2B and D).
Also associated with increased gestational age are genes related to vasculogenesis (Figure 2F), consistent with the dramatic expansion of the fetal capillary network in mature villi. The “female pregnancy” term in Figure 2F represents the production of known placenta-derived gene products, such as the pregnancy-specific glycoprotein (PSG) family members and hormones including CRH, which peaks in the third trimester. There were also several terms related to endoplasmic reticulum (ER) stress and the unfolded protein response. Placental ER stress has been associated with intrauterine growth restriction [96]. These findings in normal tissue at term could reflect the increased stress an aging placenta experiences, as well as an increased risk for stillbirth when pregnancy proceeds post-term and fetal demands outstrip the ability of the placenta to respond.
Finally, we found evidence for a rapidly dividing population of cells with active enhancers and the expression of marker genes associated with stem cells in early pregnancy relative to term (Figure 5C). These results suggest that genomics analyses from a mixed cell population can still yield insights about a limited cell type in that population. In this regard, we confirmed that TFs identified by our combinatorial genomics approach from placenta tissue were also altered in a cell culture model of TSC differentiation. These included TFs active in early pregnancy (i.e., MAFB, SNAI2, and ZBTB7C) and at term (i.e., IRF1, MAFK, and TFAP2A) (Figure 6A), which may define subsets of TFs that control TSC propagation or differentiation into STs, respectively.
Connecting enhancer activity and gene expression to specific transcription factors
In gene-specific analyses, we explored the activity and function of selected TFSEE-identified TFs in TSCs grown in culture [76]. These included ZBTB7C and SNAI2, TFs that are predicted by TFSEE to be more active in early pregnancy, but are expressed both in TSCs and throughout the time course of differentiation (Figure 6F). Our results using an RNAi-mediated knockdown perturbation-response assay in undifferentiated TSCs indicate that TFSEE can identify functionally relevant TFs in placenta whose perturbation can alter the expression of marker genes in TSCs.
Connecting enhancer activity to disease through GWAS SNPs
Linking enhancer activity and gene expression through correlation analysis can generate testable hypothesis about the regulation of particular genes important to placenta function. Many genomic studies rely on combining genomic features from data sets generated in different samples in order to generate regulatory predictions. The data sets of enhancer annotations generated in this study, including both enhancer activity and gene expression from the same sample, along with histone modification data from a significant subset of those samples, will be a rich resource for mining associations between regulatory regions and predicted target genes.
With regard to understanding disease, we demonstrated that our enhancer annotations can provide context for the functional understanding of GWAS SNPs as they emerge. Such annotations serve to narrow the sequence space of interest when generating hypotheses about the relationship between genetic variation and disease outcomes. They could also suggest functional regions in linkage disequilibrium with lead SNPs, which might explain the SNPs that are responsible for the effects of the association. These associations could be tested in future studies using functional genomics approaches targeting both the enhancer via emerging functionalized dCas9 reagents, and the TFs predicted by motif analysis and expression patterns in knock out/knock down approaches.
Limitations of the study
While this study represents an advance over previous studies with respect to the numbers and types of samples analyzed, as well as the suite of genomic assays used, it is not without limitations. Regarding the biological systems that we used, one obvious limitation is the absence of placenta collections from gestational age from 22 to 39 weeks for practical, technical, legal, and ethical reasons. While this limited our ability to fully examine gene expression across gestation, we were able to describe general trends by gestational age or trimester within the limits of available samples, as well as connect enhancer activity to gene expression in this particular biological system.
Another limitation is the tissue sampling that we used, especially with the larger, term placentas, which may result in the sampling of different proportions of cell types. In this regard, it was challenging to assign TFs to cell type–specific processes given the mixed cell population and observational constraints of using human tissue. Changes in the relative proportions of cytotrophoblasts (decreasing) and STs (increasing) can be demonstrated histologically over the course of gestation. Collecting pure populations of trophoblasts could reduce the heterogeneity associated with bulk tissue samples that contain multiple cell types, though perhaps at the expense of losing information about the cell state in vivo.
In addition, we found that making comparisons between early versus late gestation placentas, and TSCs versus STs was not straightforward, limiting our ability to model molecular pathways from the placenta in cultured cells. In this regard, it is unclear why TFs with greater predicted activity in early pregnancy (i.e. MAFB, SNAI2, and ZBTB7C) would have similar or increased expression in STs compared to TSCs, although the effects could be explained by differences in TF activity or accessibility of binding sites. Finally, regarding the application of TFSEE, we note that TF mRNA levels may not accurately represent protein abundance or activity. As such, TFSEE may exclude TFs relevant to placenta biology under these circumstances.
Supplementary Material
Acknowledgment
The trophoblast stem cell line was generously shared by Hiroaki Okae via the laboratory of Michael Soares. We appreciate the technical support of Vanessa Schmid in the McDermott Next Generation Sequencing Core facility for optimizing sequence reads from diverse genomic library types. Venkat Malladi provided helpful discussions in application of the TFSEE methodology to human tissue and general computational biology expertise. Shanivi Srikonda and David Turnell assisted with screening antibodies for Western blot experiments in trophoblast stem cells during differentiation.
Footnotes
† Grant Support: This work was supported by a grant from the National Institutes of Health (NIH)/National Institute of Child Health and Human Development (NICHD) Reproductive Scientist Development Program to DMO, a grant from the Burroughs Wellcome Fund Next Gen Pregnancy Initiative (NGP10107) to WLK., a grant from the NIH/National Human Genome Research Institute (NHGRI) (UM1 HG011996) to WLK, and funds from the Cecil H. and Ida Green Center for Reproductive Biology Sciences Endowment to WLK.
Contributor Information
David M Owen, Laboratory of Signaling and Gene Regulation, Cecil H. and Ida Green Center for Reproductive Biology Sciences, University of Texas Southwestern Medical Center, Dallas, TX, USA; Division of Basic Research, Department of Obstetrics and Gynecology, University of Texas Southwestern Medical Center, Dallas, TX, USA; Division of General Obstetrics and Gynecology, Department of Obstetrics and Gynecology, University of Texas Southwestern Medical Center, Dallas, TX, USA.
Minjung Kwon, Laboratory of Signaling and Gene Regulation, Cecil H. and Ida Green Center for Reproductive Biology Sciences, University of Texas Southwestern Medical Center, Dallas, TX, USA; Division of Basic Research, Department of Obstetrics and Gynecology, University of Texas Southwestern Medical Center, Dallas, TX, USA.
Xuan Huang, Laboratory of Signaling and Gene Regulation, Cecil H. and Ida Green Center for Reproductive Biology Sciences, University of Texas Southwestern Medical Center, Dallas, TX, USA; Division of Basic Research, Department of Obstetrics and Gynecology, University of Texas Southwestern Medical Center, Dallas, TX, USA.
Anusha Nagari, Laboratory of Signaling and Gene Regulation, Cecil H. and Ida Green Center for Reproductive Biology Sciences, University of Texas Southwestern Medical Center, Dallas, TX, USA; Division of Basic Research, Department of Obstetrics and Gynecology, University of Texas Southwestern Medical Center, Dallas, TX, USA.
Tulip Nandu, Laboratory of Signaling and Gene Regulation, Cecil H. and Ida Green Center for Reproductive Biology Sciences, University of Texas Southwestern Medical Center, Dallas, TX, USA; Division of Basic Research, Department of Obstetrics and Gynecology, University of Texas Southwestern Medical Center, Dallas, TX, USA.
W Lee Kraus, Laboratory of Signaling and Gene Regulation, Cecil H. and Ida Green Center for Reproductive Biology Sciences, University of Texas Southwestern Medical Center, Dallas, TX, USA; Division of Basic Research, Department of Obstetrics and Gynecology, University of Texas Southwestern Medical Center, Dallas, TX, USA.
Conflict of interest
The authors have declared that no conflict of interest exists.
Data availability
The genomic datasets generated for this study can be accessed from the NCBI’s Gene Expression Omnibus (GEO) repository (www.ncbi.nlm.nih.gov/geo/) using accession number GSE222035. All other data generated in this study are available within the article and its supplementary data files. The pipelines and scripts used for the computational analyses are available on GitHub at: https://github.com/Kraus-Lab/Transcriptome-changes-in-Placenta.
Authors’ contributions
DMO—Conceptualization, Methodology, Validation, Formal analysis, Investigation, Writing—original draft preparation, Visualization, Project administration, Funding acquisition. MK—Methodology, Formal analysis, Investigation, Writing—original draft preparation, Visualization, XH—Methodology, Investigation. AN—Software, Formal analysis, Data Curation, Visualization. TN—Formal analysis, Visualization, Writing – review and editing. WLK—Conceptualization, Methodology, Writing—review and editing, Visualization, Supervision, Project administration, Funding acquisition.
References
- 1. Cindrova-Davies T, Sferruzzi-Perri AN. Human placental development and function. Semin Cell Dev Biol 2022; 131:66–77. [DOI] [PubMed] [Google Scholar]
- 2. Burton GJ, Fowden AL. The placenta: a multifaceted, transient organ. Philos Trans R Soc Lond B Biol Sci 2015; 370:20140066. [DOI] [PMC free article] [PubMed] [Google Scholar]
- 3. Huppertz B, Ghosh D, Sengupta J. An integrative view on the physiology of human early placental villi. Prog Biophys Mol Biol 2014; 114:33–48. [DOI] [PubMed] [Google Scholar]
- 4. Menkhorst E, Winship A, Van Sinderen M, Dimitriadis E. Human extravillous trophoblast invasion: intrinsic and extrinsic regulation. Reprod Fertil Dev 2016; 28:406–415. [DOI] [PubMed] [Google Scholar]
- 5. Knofler M, Haider S, Saleh L, Pollheimer J, Gamage T, James J. Human placenta and trophoblast development: key molecular mechanisms and model systems. Cell Mol Life Sci 2019; 76:3479–3496. [DOI] [PMC free article] [PubMed] [Google Scholar]
- 6. Khong TY. The pathology of placenta accreta, a worldwide epidemic. J Clin Pathol 2008; 61:1243–1246. [DOI] [PubMed] [Google Scholar]
- 7. Jaiman S, Romero R, Pacora P, Jung E, Bhatti G, Yeo L, Kim YM, Kim B, Kim CJ, Kim JS, Qureshi F, Jacques SM, et al. Disorders of placental villous maturation in fetal death. J Perinat Med 2020;48:345–368. [DOI] [PMC free article] [PubMed] [Google Scholar]
- 8. Staff AC . The two-stage placental model of preeclampsia: An update. J Reprod Immunol 2019; 134-135:1–10. [DOI] [PubMed] [Google Scholar]
- 9. Gathiram P, Moodley J. Pre-eclampsia: its pathogenesis and pathophysiolgy. Cardiovasc J Afr 2016; 27:71–78. [DOI] [PMC free article] [PubMed] [Google Scholar]
- 10. Li H, Huang Q, Liu Y, Garmire LX. Single cell transcriptome research in human placenta. Reproduction 2020; 160:R155–R167. [DOI] [PMC free article] [PubMed] [Google Scholar]
- 11. Jaremek A, Jeyarajah MJ, Jaju Bhattad G, Renaud SJ. Omics approaches to study formation and function of human placental syncytiotrophoblast. Front Cell Dev Biol 2021; 9:674162. [DOI] [PMC free article] [PubMed] [Google Scholar]
- 12. Cox B, Leavey K, Nosi U, Wong F, Kingdom J. Placental transcriptome in development and pathology: expression, function, and methods of analysis. Am J Obstet Gynecol 2015; 213:S138–S151. [DOI] [PubMed] [Google Scholar]
- 13. Mikheev AM, Nabekura T, Kaddoumi A, Bammler TK, Govindarajan R, Hebert MF, Unadkat JD. Profiling gene expression in human placentae of different gestational ages: an OPRU network and UW SCOR study. Reprod Sci 2008; 15:866–877. [DOI] [PMC free article] [PubMed] [Google Scholar]
- 14. Sood R, Zehnder JL, Druzin ML, Brown PO. Gene expression patterns in human placenta. Proc Natl Acad Sci U S A 2006; 103:5478–5483. [DOI] [PMC free article] [PubMed] [Google Scholar]
- 15. Leavey K, Benton SJ, Grynspan D, Kingdom JC, Bainbridge SA, Cox BJ. Unsupervised placental gene expression profiling identifies clinically relevant subclasses of human preeclampsia. Hypertension 2016; 68:137–147. [DOI] [PubMed] [Google Scholar]
- 16. Soncin F, Khater M, C To, Pizzo D, Farah O, Wakeland A, Arul Nambi Rajan K, Nelson KK, Chang CW, Moretto-Zita M, Natale DR, Laurent LC, et al. Comparative analysis of mouse and human placentae across gestation reveals species-specific regulators of placental development. Development 2018; 145. [DOI] [PMC free article] [PubMed] [Google Scholar]
- 17. Saben J, Zhong Y, McKelvey S, Dajani NK, Andres A, Badger TM, Gomez-Acevedo H, Shankar K. A comprehensive analysis of the human placenta transcriptome. Placenta 2014; 35:125–131. [DOI] [PMC free article] [PubMed] [Google Scholar]
- 18. Kim J, Zhao K, Jiang P, Lu ZX, Wang J, Murray JC, Xing Y. Transcriptome landscape of the human placenta. BMC Genomics 2012; 13:115. [DOI] [PMC free article] [PubMed] [Google Scholar]
- 19. Sober S, Reiman M, Kikas T, Rull K, Inno R, Vaas P, Teesalu P, Marti JM, Mattila P, Laan M. Extensive shift in placental transcriptome profile in preeclampsia and placental origin of adverse pregnancy outcomes. Sci Rep 2015; 5:13336. [DOI] [PMC free article] [PubMed] [Google Scholar]
- 20. Nelson AC, Mould AW, Bikoff EK, Robertson EJ. Single-cell RNA-seq reveals cell type-specific transcriptional signatures at the maternal-foetal interface during pregnancy. Nat Commun 2016; 7:11414. [DOI] [PMC free article] [PubMed] [Google Scholar]
- 21. Liu Y, Fan X, Wang R, Lu X, Dang YL, Wang H, Lin HY, Zhu C, Ge H, Cross JC, Wang H. Single-cell RNA-seq reveals the diversity of trophoblast subtypes and patterns of differentiation in the human placenta. Cell Res 2018; 28:819–832. [DOI] [PMC free article] [PubMed] [Google Scholar]
- 22. Pique-Regi R, Romero R, Tarca AL, Sendler ED, Xu Y, Garcia-Flores V, Leng Y, Luca F, Hassan SS, Gomez-Lopez N. Single cell transcriptional signatures of the human placenta in term and preterm parturition. Elife 2019; 8:e52004. [DOI] [PMC free article] [PubMed] [Google Scholar]
- 23. Suryawanshi H, Morozov P, Straus A, Sahasrabudhe N, Max KEA, Garzia A, Kustagi M, Tuschl T, Williams Z. A single-cell survey of the human first-trimester placenta and decidua. Sci Adv 2018; 4:eaau4788. [DOI] [PMC free article] [PubMed] [Google Scholar]
- 24. Vento-Tormo R, Efremova M, Botting RA, Turco MY, Vento-Tormo M, Meyer KB, Park JE, Stephenson E, Polanski K, Goncalves A, Gardner L, Holmqvist S, et al. Single-cell reconstruction of the early maternal-fetal interface in humans. Nature 2018; 563:347–353. [DOI] [PMC free article] [PubMed] [Google Scholar]
- 25. Pavlicev M, Wagner GP, Chavan AR, Owens K, Maziarz J, Dunn-Fletcher C, Kallapur SG, Muglia L, Jones H. Single-cell transcriptomics of the human placenta: inferring the cell communication network of the maternal-fetal interface. Genome Res 2017; 27:349–361. [DOI] [PMC free article] [PubMed] [Google Scholar]
- 26. Tsang JCH, Vong JSL, Ji L, Poon LCY, Jiang P, Lui KO, Ni YB, To KF, Cheng YKY, Chiu RWK, Lo YMD. Integrative single-cell and cell-free plasma RNA transcriptomics elucidates placental cellular dynamics. Proc Natl Acad Sci U S A 2017; 114:E7786–E7795. [DOI] [PMC free article] [PubMed] [Google Scholar]
- 27. Yang Y, Guo F, Peng Y, Chen R, Zhou W, Wang H, OuYang J, Yu B, Xu Z. Transcriptomic profiling of human placenta in gestational diabetes mellitus at the single-cell level. Front Endocrinol (Lausanne) 2021; 12:679582. [DOI] [PMC free article] [PubMed] [Google Scholar]
- 28. Gong S, Gaccioli F, Dopierala J, Sovio U, Cook E, Volders PJ, Martens L, Kirk PDW, Richardson S, Smith GCS, Charnock-Jones DS. The RNA landscape of the human placenta in health and disease. Nat Commun 2021; 12:2639. [DOI] [PMC free article] [PubMed] [Google Scholar]
- 29. Ashary N, Bhide A, Chakraborty P, Colaco S, Mishra A, Chhabria K, Jolly MK, Modi D. Single-cell RNA-seq identifies cell subsets in human placenta that highly expresses factors driving pathogenesis of SARS-CoV-2. Front Cell Dev Biol 2020; 8:783. [DOI] [PMC free article] [PubMed] [Google Scholar]
- 30. Chen J, Du L, Wang F, Shao X, Wang X, Yu W, Bi S, Chen D, Pan X, Zeng S, Huang L, Liang Y, et al. Cellular and molecular atlas of the placenta from a COVID-19 pregnant woman infected at midgestation highlights the defective impacts on foetal health. Cell Prolif 2022; 55:e13204. [DOI] [PMC free article] [PubMed] [Google Scholar]
- 31. Founds SA, Terhorst LA, Conrad KP, Hogge WA, Jeyabalan A, Conley YP. Gene expression in first trimester preeclampsia placenta. Biol Res Nurs 2011; 13:134–139. [DOI] [PMC free article] [PubMed] [Google Scholar]
- 32. Lien YC, Zhang Z, Barila G, Green-Brown A, Elovitz MA, Simmons RA. Intrauterine inflammation alters the transcriptome and metabolome in placenta. Front Physiol 2020; 11:592689. [DOI] [PMC free article] [PubMed] [Google Scholar]
- 33. Zhou W, Wang H, Yang Y, Guo F, Yu B, Su Z. Trophoblast cell subtypes and dysfunction in the placenta of individuals with preeclampsia revealed by single cell RNA sequencing. Mol Cells 2022; 45:317–328. [DOI] [PMC free article] [PubMed] [Google Scholar]
- 34. Li J, Wang Q, An Y, Chen X, Xing Y, Deng Q, Li Z, Wang S, Dai X, Liang N, Hou Y, Yang H, et al. Integrative single-cell RNA-seq and ATAC-seq analysis of mesenchymal stem/stromal cells derived from human placenta. Front Cell Dev Biol 2022; 10:836887. [DOI] [PMC free article] [PubMed] [Google Scholar]
- 35. Mallery CS Jr, Carrillo M, Mei A, Correia-Branco A, Kashpur O, Wallingford MC. Cellular complexity of hemochorial placenta: stem cell populations, insights from scRNA-seq, and SARS-CoV-2 susceptibility. Curr Stem Cell Rep 2021; 7:185–193. [DOI] [PMC free article] [PubMed] [Google Scholar]
- 36. Zhou X, Xu Y, Ren S, Liu D, Yang N, Han Q, Kong S, Wang H, Deng W, Qi H, Lu J. Single-cell RNA-seq revealed diverse cell types in the mouse placenta at mid-gestation. Exp Cell Res 2021; 405:112715. [DOI] [PubMed] [Google Scholar]
- 37. Suryawanshi H, Max K, Bogardus KA, Sopeyin A, Chang MS, Morozov P, Castano PM, Tuschl T, Williams Z. Dynamic genome-wide gene expression and immune cell composition in the developing human placenta. J Reprod Immunol 2022; 151:103624. [DOI] [PubMed] [Google Scholar]
- 38. Zhu H, Sun H, Yu D, Li T, Hai T, Liu C, Zhang Y, Chen Y, Dai X, Li Z, Li W, Liu R, et al. Transcriptome and DNA methylation profiles of mouse fetus and placenta generated by round spermatid injection. Front Cell Dev Biol 2021; 9:632183. [DOI] [PMC free article] [PubMed] [Google Scholar]
- 39. Liu Z, Ji Q, Ren J, Yan P, Wu Z, Wang S, Sun L, Wang Z, Li J, Sun G, Liang C, Sun R, et al. Large-scale chromatin reorganization reactivates placenta-specific genes that drive cellular aging. Dev Cell 2022; 57:1347–1368.e12. [DOI] [PubMed] [Google Scholar]
- 40. Lu S, Wang J, Kakongoma N, Hua W, Xu J, Wang Y, He S, Gu H, Shi J, Hu W. DNA methylation and expression profiles of placenta and umbilical cord blood reveal the characteristics of gestational diabetes mellitus patients and offspring. Clin Epigenetics 2022; 14:69. [DOI] [PMC free article] [PubMed] [Google Scholar]
- 41. Catarino RR, Stark A. Assessing sufficiency and necessity of enhancer activities for gene expression and the mechanisms of transcription activation. Genes Dev 2018; 32:202–223. [DOI] [PMC free article] [PubMed] [Google Scholar]
- 42. Hou TY, Kraus WL. Spirits in the material world: enhancer RNAs in transcriptional regulation. Trends Biochem Sci 2021; 46:138–153. [DOI] [PMC free article] [PubMed] [Google Scholar]
- 43. Hah N, Murakami S, Nagari A, Danko CG, Kraus WL. Enhancer transcripts mark active estrogen receptor binding sites. Genome Res 2013; 23:1210–1223. [DOI] [PMC free article] [PubMed] [Google Scholar]
- 44. Yao L, Liang J, Ozer A, Leung AK, Lis JT, Yu H. A comparison of experimental assays and analytical methods for genome-wide identification of active enhancers. Nat Biotechnol 2022; 40:1056–1065. [DOI] [PMC free article] [PubMed] [Google Scholar]
- 45. Zhu Y, Sun L, Chen Z, Whitaker JW, Wang T, Wang W. Predicting enhancer transcription and activity from chromatin modifications. Nucleic Acids Res 2013; 41:10032–10043. [DOI] [PMC free article] [PubMed] [Google Scholar]
- 46. Zhang J, Simonti CN, Capra JA. Genome-wide maps of distal gene regulatory enhancers active in the human placenta. PloS One 2018; 13:e0209611. [DOI] [PMC free article] [PubMed] [Google Scholar]
- 47. GTEx-Consortium . The genotype-tissue expression (GTEx) project. Nat Genet 2013; 45:580–585. [DOI] [PMC free article] [PubMed] [Google Scholar]
- 48. Zhong S, Joung JG, Zheng Y, Chen YR, Liu B, Shao Y, Xiang JZ, Fei Z, Giovannoni JJ. High-throughput illumina strand-specific RNA sequencing library preparation. Cold Spring Harb Protoc 2011; 2011:940–949. [DOI] [PubMed] [Google Scholar]
- 49. Mahat DB, Kwak H, Booth GT, Jonkers IH, Danko CG, Patel RK, Waters CT, Munson K, Core LJ, Lis JT. Base-pair-resolution genome-wide mapping of active RNA polymerases using precision nuclear run-on (PRO-seq). Nat Protoc 2016; 11:1455–1476. [DOI] [PMC free article] [PubMed] [Google Scholar]
- 50. Murakami S, Nagari A, Kraus WL. Dynamic assembly and activation of estrogen receptor alpha enhancers through coregulator switching. Genes Dev 2017; 31:1535–1548. [DOI] [PMC free article] [PubMed] [Google Scholar]
- 51. Franco HL, Nagari A, Kraus WL. TNFα signaling exposes latent estrogen receptor binding sites to alter the breast cancer cell transcriptome. Mol Cell 2015; 58:21–34. [DOI] [PMC free article] [PubMed] [Google Scholar]
- 52. Andrews S. FastQC: a quality control tool for high throughput sequence data. 2015. http://www.bioinformatics.babraham.ac.uk/projects/fastqc/. [Google Scholar]
- 53. Kim D, Pertea G, Trapnell C, Pimentel H, Kelley R, Salzberg SL. TopHat2: accurate alignment of transcriptomes in the presence of insertions, deletions and gene fusions. Genome Biol 2013; 14:R36. [DOI] [PMC free article] [PubMed] [Google Scholar]
- 54. Trapnell C, Williams BA, Pertea G, Mortazavi A, Kwan G, van Baren MJ, Salzberg SL, Wold BJ, Pachter L. Transcript assembly and quantification by RNA-Seq reveals unannotated transcripts and isoform switching during cell differentiation. Nat Biotechnol 2010; 28:511–515. [DOI] [PMC free article] [PubMed] [Google Scholar]
- 55. Anders S, Huber W. Differential expression analysis for sequence count data. Genome Biol 2010; 11:R106. [DOI] [PMC free article] [PubMed] [Google Scholar]
- 56. Ashburner M, Ball CA, Blake JA, Botstein D, Butler H, Cherry JM, Davis AP, Dolinski K, Dwight SS, Eppig JT, Harris MA, Hill DP, et al. Gene ontology: tool for the unification of biology. The Gene Ontology Consortium Nat Genet 2000; 25:25–29. [DOI] [PMC free article] [PubMed] [Google Scholar]
- 57. Mi H, Muruganujan A, Ebert D, Huang X, Thomas PD. PANTHER version 14: more genomes, a new PANTHER GO-slim and improvements in enrichment analysis tools. Nucleic Acids Res 2019; 47:D419–D426. [DOI] [PMC free article] [PubMed] [Google Scholar]
- 58. Martin M. Cutadapt removes adapter sequences from high-throughput sequencing reads. EMBnetjournal 2011; 17:10–12. [Google Scholar]
- 59. Langmead B, Trapnell C, Pop M, Salzberg SL. Ultrafast and memory-efficient alignment of short DNA sequences to the human genome. Genome Biol 2009; 10:R25. [DOI] [PMC free article] [PubMed] [Google Scholar]
- 60. Li H, Handsaker B, Wysoker A, Fennell T, Ruan J, Homer N, Marth G, Abecasis G, Durbin R. Genome project data processing S. The sequence alignment/map format and SAMtools. Bioinformatics 2009; 25:2078–2079. [DOI] [PMC free article] [PubMed] [Google Scholar]
- 61. Quinlan AR, Hall IM. BEDTools: a flexible suite of utilities for comparing genomic features. Bioinformatics 2010; 26:841–842. [DOI] [PMC free article] [PubMed] [Google Scholar]
- 62. Landt SG, Marinov GK, Kundaje A, Kheradpour P, Pauli F, Batzoglou S, Bernstein BE, Bickel P, Brown JB, Cayting P, Chen Y, DeSalvo G, et al. ChIP-seq guidelines and practices of the ENCODE and modENCODE consortia. Genome Res 2012; 22:1813–1831. [DOI] [PMC free article] [PubMed] [Google Scholar]
- 63. Feng J, Liu T, Qin B, Zhang Y, Liu XS. Identifying ChIP-seq enrichment using MACS. Nat Protoc 2012; 7:1728–1740. [DOI] [PMC free article] [PubMed] [Google Scholar]
- 64. Chu T, Wang Z, Chou S-P, Danko CG. Discovering transcriptional regulatory elements from run-on and sequencing data using the Web-based dREG gateway. Protoc Bioinformatics 2019; 66:e70. [DOI] [PMC free article] [PubMed] [Google Scholar]
- 65. Ramirez F, Ryan DP, Gruning B, Bhardwaj V, Kilpert F, Richter AS, Heyne S, Dundar F, Manke T. deepTools2: a next generation web server for deep-sequencing data analysis. Nucleic Acids Res 2016; 44:W160–W165. [DOI] [PMC free article] [PubMed] [Google Scholar]
- 66. Kent WJ, Zweig AS, Barber G, Hinrichs AS, Karolchik D. BigWig and BigBed: enabling browsing of large distributed datasets. Bioinformatics 2010; 26:2204–2207. [DOI] [PMC free article] [PubMed] [Google Scholar]
- 67. Lee BT, Barber GP, Benet-Pages A, Casper J, Clawson H, Diekhans M, Fischer C, Gonzalez JN, Hinrichs AS, Lee CM, Muthuraman P, Nassar LR, et al. The UCSC genome browser database: 2022 update. Nucleic Acids Res 2022; 50:D1115–D1122. [DOI] [PMC free article] [PubMed] [Google Scholar]
- 68. Wang Z, Chu T, Choate LA, Danko CG. Identification of regulatory elements from nascent transcription using dREG. Genome Res 2019; 29:293–303. [DOI] [PMC free article] [PubMed] [Google Scholar]
- 69. Bailey TL, Elkan C. Fitting a mixture model by expectation maximization to discover motifs in biopolymers. Proc Int Conf Intell Syst Mol Biol 1994; 2:28–36. [PubMed] [Google Scholar]
- 70. Gupta S, Stamatoyannopoulos JA, Bailey TL, Noble WS. Quantifying similarity between motifs. Genome Biol 2007; 8:R24. [DOI] [PMC free article] [PubMed] [Google Scholar]
- 71. Khan A, Fornes O, Stigliani A, Gheorghe M, Castro-Mondragon JA, van der Lee R, Bessy A, Cheneby J, Kulkarni SR, Tan G, Baranasic D, Arenillas DJ, et al. JASPAR 2018: update of the open-access database of transcription factor binding profiles and its web framework. Nucleic Acids Res 2018; 46:D1284. [DOI] [PMC free article] [PubMed] [Google Scholar]
- 72. Franco HL, Nagari A, Malladi VS, Li W, Xi Y, Richardson D, Allton KL, Tanaka K, Li J, Murakami S, Keyomarsi K, Bedford MT, et al. Enhancer transcription reveals subtype-specific gene expression programs controlling breast cancer pathogenesis. Genome Res 2018; 28:159–170. [DOI] [PMC free article] [PubMed] [Google Scholar]
- 73. Malladi VS, Nagari A, Franco HL, Kraus WL. Total functional score of enhancer elements identifies lineage-specific enhancers that drive differentiation of pancreatic cells. Bioinformatics and Biology Insights 2020(in press); 14:117793222093806. [DOI] [PMC free article] [PubMed] [Google Scholar]
- 74. Wickham H. ggplot2:Elegant Graphics for Data Analysis. New York, NY: Springer; 2009. [Google Scholar]
- 75. Saldanha AJ. Java Treeview--extensible visualization of microarray data. Bioinformatics 2004; 20:3246–3248. [DOI] [PubMed] [Google Scholar]
- 76. Okae H, Toh H, Sato T, Hiura H, Takahashi S, Shirane K, Kabayama Y, Suyama M, Sasaki H, Arima T. Derivation of human trophoblast stem cells. Cell Stem Cell 2018; 22:50–63.e6. [DOI] [PubMed] [Google Scholar]
- 77. Livak KJ, Schmittgen TD. Analysis of relative gene expression data using real-time quantitative PCR and the 2(-Delta C(T)) method. Methods 2001; 25:402–408. [DOI] [PubMed] [Google Scholar]
- 78. Gibson BA, Zhang Y, Jiang H, Hussey KM, Shrimp JH, Lin H, Schwede F, Yu Y, Kraus WL. Chemical genetic discovery of PARP targets reveals a role for PARP-1 in transcription elongation. Science 2016; 353:45–50. [DOI] [PMC free article] [PubMed] [Google Scholar]
- 79. Chu T, Wang Z, Chou SP, Danko CG. Discovering transcriptional regulatory elements from run-on and sequencing data using the web-based dREG gateway. Curr Protoc Bioinformatics 2019; 66:e70. [DOI] [PMC free article] [PubMed] [Google Scholar]
- 80. Frankish A, Diekhans M, Ferreira AM, Johnson R, Jungreis I, Loveland J, Mudge JM, Sisu C, Wright J, Armstrong J, Barnes I, Berry A, et al. GENCODE reference annotation for the human and mouse genomes. Nucleic Acids Res 2019; 47:D766–D773. [DOI] [PMC free article] [PubMed] [Google Scholar]
- 81. Coan PM, Ferguson-Smith AC, Burton GJ. Developmental dynamics of the definitive mouse placenta assessed by stereology. Biol Reprod 2004; 70:1806–1813. [DOI] [PubMed] [Google Scholar]
- 82. Caniggia I, Grisaru-Gravnosky S, Kuliszewsky M, Post M, Lye SJ. Inhibition of TGF-beta 3 restores the invasive capability of extravillous trophoblasts in preeclamptic pregnancies. J Clin Invest 1999; 103:1641–1650. [DOI] [PMC free article] [PubMed] [Google Scholar]
- 83. Kim DJ, Lee NE, Park JS, Park IJ, Kim JG, Cho HJ. Organic electrochemical transistor based immunosensor for prostate specific antigen (PSA) detection using gold nanoparticles for signal amplification. Biosens Bioelectron 2010; 25:2477–2482. [DOI] [PubMed] [Google Scholar]
- 84. Faxen M, Nasiell J, Blanck A, Nisell H, Lunell NO. Altered mRNA expression pattern of placental epidermal growth factor receptor (EGFR) in pregnancies complicated by preeclampsia and/or intrauterine growth retardation. Am J Perinatol 1998; 15:9–13. [DOI] [PubMed] [Google Scholar]
- 85. Foidart JM, Schaaps JP, Chantraine F, Munaut C, Lorquet S. Dysregulation of anti-angiogenic agents (sFlt-1, PLGF, and sEndoglin) in preeclampsia--a step forward but not the definitive answer. J Reprod Immunol 2009; 82:106–111. [DOI] [PubMed] [Google Scholar]
- 86. Buniello A, MacArthur JAL, Cerezo M, Harris LW, Hayhurst J, Malangone C, McMahon A, Morales J, Mountjoy E, Sollis E, Suveges D, Vrousgou O, et al. The NHGRI-EBI GWAS Catalog of published genome-wide association studies, targeted arrays and summary statistics 2019. Nucleic Acids Res 2019; 47:D1005–D1012. [DOI] [PMC free article] [PubMed] [Google Scholar]
- 87. McGinnis R, Steinthorsdottir V, Williams NO, Thorleifsson G, Shooter S, Hjartardottir S, Bumpstead S, Stefansdottir L, Hildyard L, Sigurdsson JK, Kemp JP, Silva GB, et al. Variants in the fetal genome near FLT1 are associated with risk of preeclampsia. Nat Genet 2017; 49:1255–1260. [DOI] [PubMed] [Google Scholar]
- 88. Kikas T, Inno R, Ratnik K, Rull K, Laan M. C-allele of rs4769613 near FLT1 represents a high-confidence placental risk factor for preeclampsia. Hypertension 2020; 76:884–891. [DOI] [PubMed] [Google Scholar]
- 89. Honigberg MC, Truong B, Khan RR, Xiao B, Bhatta L, Vy HMT, Guerrero RF, Schuermans A, Selvaraj MS, Patel AP, Koyama S, Cho SMJ, et al. Polygenic prediction of preeclampsia and gestational hypertension. Nat Med 2023; 29:1540–1549. [DOI] [PMC free article] [PubMed] [Google Scholar]
- 90. Peng S, Deyssenroth MA, Di Narzo AF, Lambertini L, Marsit CJ, Chen J, Hao K. Expression quantitative trait loci (eQTLs) in human placentas suggest developmental origins of complex diseases. Hum Mol Genet 2017; 26:3432–3441. [DOI] [PMC free article] [PubMed] [Google Scholar]
- 91. Warrington NM, Beaumont RN, Horikoshi M, Day FR, Helgeland O, Laurin C, Bacelis J, Peng S, Hao K, Feenstra B, Wood AR, Mahajan A, et al. Maternal and fetal genetic effects on birth weight and their relevance to cardio-metabolic risk factors. Nat Genet 2019; 51:804–814. [DOI] [PMC free article] [PubMed] [Google Scholar]
- 92. Plotnikov D, Williams C, Guggenheim JA. Association between birth weight and refractive error in adulthood: a Mendelian randomisation study. Br J Ophthalmol 2020; 104:214–219. [DOI] [PubMed] [Google Scholar]
- 93. Horikoshi M, Beaumont RN, Day FR, Warrington NM, Kooijman MN, Fernandez-Tajes J, Feenstra B, van Zuydam NR, Gaulton KJ, Grarup N, Bradfield JP, Strachan DP, et al. Genome-wide associations for birth weight and correlations with adult disease. Nature 2016; 538:248–252. [DOI] [PMC free article] [PubMed] [Google Scholar]
- 94. Tiensuu H, Haapalainen AM, Karjalainen MK, Pasanen A, Huusko JM, Marttila R, Ojaniemi M, Muglia LJ, Hallman M, Ramet M. Risk of spontaneous preterm birth and fetal growth associates with fetal SLIT2. PLoS Genet 2019; 15:e1008107. [DOI] [PMC free article] [PubMed] [Google Scholar]
- 95. Hilgers RD, Standefer JC, Rutledge JM, Ampuero F. Trophoblastic cell sensitivity to 8-day chemotherapy in nonmetastatic gestational trophoblastic neoplasia. Gynecol Oncol 1984; 17:386–393. [DOI] [PubMed] [Google Scholar]
- 96. Burton GJ, Yung HW, Cindrova-Davies T, Charnock-Jones DS. Placental endoplasmic reticulum stress and oxidative stress in the pathophysiology of unexplained intrauterine growth restriction and early onset preeclampsia. Placenta 2009; 30:43–48. [DOI] [PMC free article] [PubMed] [Google Scholar]
Associated Data
This section collects any data citations, data availability statements, or supplementary materials included in this article.
Supplementary Materials
Data Availability Statement
The genomic datasets generated for this study can be accessed from the NCBI’s Gene Expression Omnibus (GEO) repository (www.ncbi.nlm.nih.gov/geo/) using accession number GSE222035. All other data generated in this study are available within the article and its supplementary data files. The pipelines and scripts used for the computational analyses are available on GitHub at: https://github.com/Kraus-Lab/Transcriptome-changes-in-Placenta.