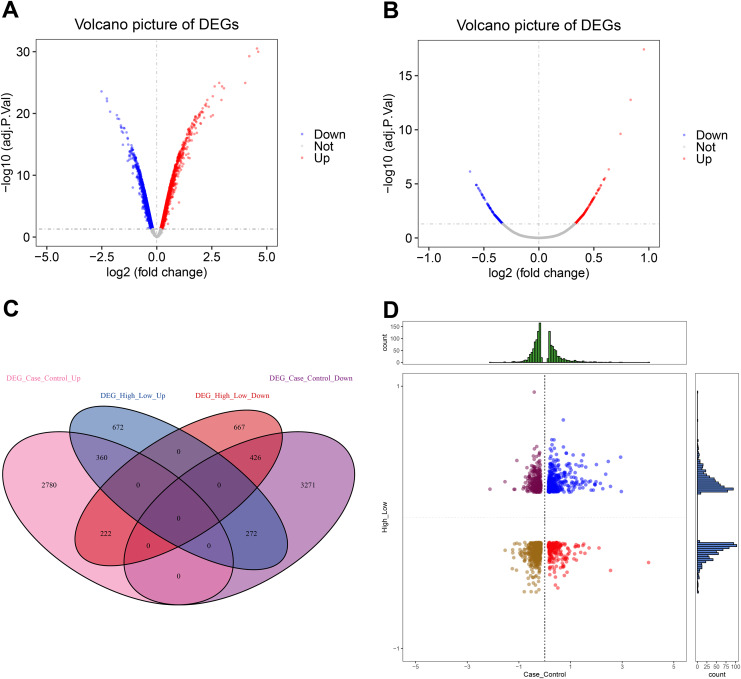
Figure 2. Global regulation of Cxcl10 in polycystic ovarian failure (POF).
(A) Differentially expressed genes (DEGs) in the POF control group; (B) Volcano map of the DEGs in the high- and low-expression POF groups. Larger absolute values of logFC indicate greater differences in the multiple of gene expression between sample groups, while −log10P.adjust indicate the significance of expression differences. The larger the ordinate, the more significant the difference expression; (C) overlap between DEGs in the POF-control group and the high- and low- CXCL10 expression group using Plot Venn; (D) CXCL10-dysregulated genes in POF assessed using QuadrantPlot; blue represents DEGs with high expression (logFC > 0) in POF-Control and high expression (logFC > 0) in high- and low-expression of CXCL10. Red represents high expression (logFC > 0) in the POF-Control and low expression in in high- and low-expression of CXCL10 (logFC < 0). Brown-yellow represents low expression in POF-Control (logFC < 0) and low expression in CXCL10 (logFC < 0). Dark red represents low expression in POF-Control (logFC < 0) and high to low expression in CXCL10 (logFC > 0).

