

Abstract
Context:
The Big Five model is a well-accepted model of personality but there is scant research on the factor structure of personality from Asian populations. It is unclear whether the Big Five personality model can account for cross-cultural variation in personality structures.
Aim:
To explore the factor structure of personality by analyzing the Big Five personality factors in a sample from Karnataka, South India.
Settings and Design:
This was a cross-structural observational study conducted in Udupi and Mangalore.
Methods and Material:
400 community participants (200 women) from diverse socio economic backgrounds were recruited for the study and were assessed on either an English or Kannada version of the BFI-2-S. The reliability of the translated version of BFI-2-S was established.
Statistical Analysis Used:
Exploratory factor analysis using Principal Component Analysis with Varimax Rotation and Kaiser Normalization was carried out.
Results:
Factor Analysis revealed a four-factor and a five-factor solution that varied distinctly from the original Big Five. None of the identified factors fit into the original five factors. The four-factor solution explained 36.86% of the variance and the five-factor solution explained 41.74%. The five factors were named as – Social Effectiveness, Interpersonal Ability, Altruism, Emotional Instability, and Innovativeness. The translated tool showed good temporal stability.
Conclusions:
The Five factors identified in the present study differ from the Big Five model or the General Factor of Personality. This raises questions about the cross-cultural validity of the Big Five model as well as highlighting the need to adopt more culturally adaptive methods of assessing personality.
Keywords: Big five, BFI-2, cross-cultural variance, factor structure, India, OCEAN, personality
INTRODUCTION
The study of personality was a pivotal area of interest throughout most of history. Attempts to understand personality and its development spanned the course of centuries, and continue to this day. The variations of personality among individuals are so vast that even after years of research, there is a lot more yet to be known. Goldberg,[1] through his lexical project, developed a set of 1,710 English personality-descriptive adjectives from self-ratings of American and Australian college students. Throughout the 1980s, various models of factor analysis were used to obtain a generally stable five-factor structure which is now referred to as ‘Big Five’. This set into motion a series of studies that expanded the model, and its prospective use as the Big-Five markers were established. One of the landmark theories of personality is the Five Factor Model (FFM) of Personality, developed by Robert McCrae and Paul Costa.[2] These five factors were – the Big Five (OCEAN) - including Openness to Experience (O), Conscientiousness (C), Extraversion (E), Agreeableness (A), and Neuroticism (N). Herein, Openness to Experience refers to the degree to which an individual is willing to seek new experiences and is interested in the unusual and extraordinary, as opposed to exhibiting greater caution and preferring routine. Conscientiousness represents a domain with systematic and stable individuals at one end, and impulsive and careless individuals on the other. Extraversion signifies the extent to which an individual seeks or prefers the company of others instead of preferring solitude and privacy. Agreeableness is the dimension that measures the approachability and friendliness of an individual or the extent to which they can be uncooperative or detached. Lastly, Neuroticism measures one's tendency for emotional turmoil through stress, depression, anger, and the like, as opposed to emotional stability. The Big Five model outlined a pattern for personality inventory that has made it one of the most widely accepted personality models. The Five Factor Model has been extrapolated to understand personality pathologies and to predict susceptibility to common mental disorders like depression and anxiety.
Advocates of the FFM assert that the five factors are statistically independent (orthogonal) and represent the most fundamental elements of personality. However, the orthogonal nature of the Big Five was questioned over time, and attempts were made to discover correlations between the five factors. Further factor analytic studies led to the identification of the meta-traits of Stability and Plasticity (Alpha and Beta).[3] The HEXACO (HEXACO - Honesty-Humility. Emotionality. Extraversion. Agreeableness, Conscientiousness. Openness to Experience)[4] model of personality proposed the existence of six factors of personality, by virtue of the additional Honesty-Humility dimension. Furthermore, the Big Seven model (Tellegen and Waller's (1987) brought to the table seven higher order factors, specifically including the factors of Positive and Negative Valence, and Self-Evaluation. Findings such as these posed a challenge to the Big Five and necessitated further investigation before accepting it as a universal model of personality.[5] Musek's[6] study comprising Slovenian participants, using versions of the Big Five Inventory (BFI) and the International Personality Item Pool – 300 (IPIP-300), led to a hierarchical model of personality. The study resulted in the identification of a single general factor at the highest level of the personality structure hierarchy, which explained 50.20% of the Big Five scale variance for Big Five Inventory (BFI) data. It also explained 23.58% of the variance in an inter-correlation matrix for 44 BFI items. This general factor constituted the highest, third-order of personality. Stability and Plasticity (or Alpha and Beta) constituted the second-order, and the five traits of the Big Five, constituted the first-order. Therefore, it suggested a pyramidal structure for the levels of personality, with GFP being at the top, followed by the Big Two and the Big Five. The study also suggested that the hierarchy must be extended by adding lower stages to the Big Five, which are the Big Five facets, items, and specific responses. This identified the existence of a “Big One” within the five-factor model of personality a “superfactor”, known as the General Factor of Personality (GFP). A high score in GFP may indicate a socially desirable personality. Therefore, GFP is often criticized to be a result of the social desirability bias.[7] However, there is some evidence which shows that eliminating the effects of social desirability does not significantly affect the GFP variance.[8]
Another assumption about FFM is that it is biologically based and universal, and therefore the impact of language and cultural variations is minimal. Cross-cultural studies of FFM from various countries, speaking diverse languages with varying socio-cultural environments have supported this claim.[2,9,10] A factor analysis from 199 bilinguals in the age group of 17-80 years (English and Shona - a Zimbabwean language), who were administered with an English version of the Adjectives Checklist (ACL) and a Revised NEO personality Inventory (NEO-PI-R), revealed high re-test reliability and cross-language correlations and that resembled the original OCEAN model, arguing in favor of cross-cultural generalizability.[11] The ACL correlations mostly backed the translation's construct validity; however, the domain of Openness was the least strong when translated. On the other hand, analysis from 600 Iranian university students, using the Persian version of the questionnaire lent support to the GFP argument.[12] Similarly, conducted an analysis[13] in Tsimane forager farmers from the Bolivian Amazon, which also lent support to GFP raising arguments against generalizability of the FFM. A recent large scale online survey from 22 countries using the IPIP-NEO-120 reported that countries accounted for less than 2% variation in personality traits. Although the study included participants from Low and Middle Income Countries (LMIC) and had non-student participants as well, the online nature of the survey in English means that the participants from LMIC comprised only a subsection of the population who are bilingual and had access to the internet.[14]
Indian studies with 200-300 students reproduced the five-factor solution with some variations in factors E, A, and O.[15,16] Conversely, an analysis of 1117 socio-culturally diverse Indian adolescents from two linguistic backgrounds from two different Indian states yielded very little support for the FFM. The study suggested a three-factor solution; however, only Neuroticism emerged as a meaningful pattern.[17] Similarly, another study suggested a six-factor solution based on their analysis of 279 students, using an indigenous personality measure and a Chinese NEO-PI-R.[18] These studies indicate a cultural inconsistency in the FFM.
Existing research on the factor structure of personality is mostly from Western, Educated, Industrialised, Rich, Democracies (WEIRD-countries)[19] and student populations. Even LMIC studies mostly look at student populations or participants from higher socio-economic strata. Interestingly, research with diverse participants does not necessarily follow a five-factor model or a one-factor model. This highlights the need for personality research with a representative, heterogeneous population. The Indian population is a mosaic of varying socio-economic backgrounds, and thus it becomes an appropriate population for personality research. It adds valuable data to existing research and sets the stage for a more thorough examination of the relationship between diversity and personality. Considering these present study was planned with the aim of ascertaining the factor structure of personality by analyzing the Big Five personality factors in a sample from the Mangalore, Udupi and Manipal populations of Karnataka state in southern India. The primary objective of the study was to explore the factor structure of personality in a socioeconomically diverse sample, from the Mangalore, Udupi and Manipal population. The secondary objectives were to translate the Short Form of the Big Five Inventory -2 (BFI-2-S) into Kannada and to establish the psychometric property of reliability.
SUBJECTS AND METHODS
Study design and site
This was a cross sectional observational study conducted over nine months from June 2019 to February 2020 in Mangalore, Manipal and Udupi in Karnataka state in the southern part of India. The study protocol was approved by the Institutional Ethics Committee (IEC: 422/2019). This was conducted in two phases: In phase one, a back-to-back translation method was used to translate The Big Five Inventory 2 – Short Form (BFI - 2 – S)[20] into Kannada. In phase two of the study, data collection proceeded. Herein, people were individually approached by the investigator.
Assessment tools
Socio-demographic information, including age, gender, level of education, occupation, and monthly income was also collected from participants using a Performa developed for the study.
The Big Five Inventory 2 – Short Form[20] (BFI-2-S): Consent was sought from the author to use the tool. The Big Five Inventory -2 (BFI-2) is a major revision of the first BFI, and BFI-2-S is the short form of the BFI-2 and is a self-rated tool. It reduces the 60 items of the long-form to 30. Out of these 30 items, 15 are scored positively while the other 15 follow reverse scoring (R). At the level of the Big Five domains (O - Openness to Experience, C – Conscientiousness, E - Extraversion, A - Agreeableness and N - Neuroticism), the BFI-2-S retains around 90% of the BFI-2 domain scales’ reliability and external validity. The five domains of the test have 6 items each. In each domain, the score can range from 1 to 30. The domain of Conscientiousness measures the extent to which an individual is meticulous and diligent. It includes the facets of Organization (Items 3R and 18), Productiveness (Items 8R and 23) and Responsibility (Items 13 and 28R). Individuals who are highly conscientious tend to be methodical, prolific and disciplined, whereas those who score low on this domain are often unsystematic, inefficient and disorganized. Agreeableness is a domain that is reflective of an individual's level of social harmony. Compassion (Items 2 and 17R), Respectfulness (Items 7R and 22) and Trust (Items 12 and 27R) are the facets within this domain. A highly agreeable person is empathetic, courteous and generally optimistic, as opposed to being unkind, disrespectful and cynical. The tool also measures the domain of Neuroticism, which refers to the extent of emotional instability that an individual is susceptible to. It comprises the facets of Anxiety (Items 5 and 19R), Depression (Items 9 and 24R) and Emotional Volatility (Items 14R and 29). A high score in this domain indicates the likelihood of increased apprehension, moroseness, and moodiness, whereas a low score includes individuals who are generally calm, hopeful, and emotionally stable. Openness to Experience is a domain that accounts for one's general curiosity, interest, and sense of exploration. It includes the facets of Aesthetic Sensitivity (Items 5 and 20R), Intellectual Curiosity (Items 10R and 25), and Creative imagination (Items 15 and 30R). A high score in this domain is characteristic of individuals who are adventure-seeking, inquisitive, and innovative; meanwhile, a low score indicates individuals who tend to be unimaginative, indifferent, and lack an appreciation for art. Lastly, Extraversion is a domain that measures the extent to which an individual derives energy from external sources. It comprises the facets of Sociability (Items 1R and 16), Assertiveness (Items 6 and 21R), and Energy Level (Items 11 and 26R). Extroverted individuals are likely to be outgoing, self-assured, and lively, as opposed to introverted individuals, who are more likely to be reserved, introspective and solitary.
Participants
Individuals residing in Manipal, Udupi and Mangalore, who were aged 25 years and above and those who could understand Kannada/English were approached by the first author. The age cut off of 25 years and above was chosen because the locality has a large number of pre-professional student population in the range of 18-24 years. Convenient sampling methodology was adopted where people in the community from diverse occupational backgrounds were approached. The participants were divided into two groups (200 each, with 100 women in each category) on the basis of academic achievement and Socio-Economic Status (SES).
The inclusion criteria for Group 1 included individuals with an education level below 10th grade who had low-income/unorganized jobs and with an annual family income below rupees 2,50,000 who would meet the lower socio-economic status criteria as per Modified Kuppuswamy's classification.[21] Group 1 comprised semi-literate participants who knew the Kannada language and were from the lower SES. This included homemakers from low socio economic households, as well as participants with varying low-income or unorganized-sector jobs such as assistants in shops and offices, autodrivers, domestic workers and the like.
Inclusion criteria for Group 2 were, individuals with an education level above 12th grade who were well versed in English also who had jobs from the organized sector and with annual family income above rupees 2,50,000, who would meet the upper socio-economic status criteria as per Modified Kuppuswamy's classification.[21] Individuals with gross sensory, motor and cognitive impairments were excluded from the study. Group 2 comprised of literate participants from a well-to-do background. This included professional course students and homemakers, as well as participants with various jobs in the organized sector and professional careers, such as advocates, academicians, healthcare professionals, office jobs, and the like.
Individuals with gross sensory, motor, and cognitive impairments and non-consenting individuals were excluded from the study.
Process
In Phase One, the English form of BFI – 2 – S was translated into Kannada (Version 1), which was reviewed by two bilingual language experts. Their suggestions were then incorporated into Version 2 of the Kannada form. This form was then translated back into English, and compared to the original form, after which, it was handed over to the bilingual language experts. Their suggestions were incorporated into the final Kannada form (Version 3). The questionnaires were then administered to a section of the sample to assess applicability. The section of the sample included 10 people from Group One, with 5 men and 5 women; and 10 people from Group Two, with 5 men and 5 women. Difficulties of the pilot test were discussed, and appropriate changes were made and the final version was generated.
In Phase 2 of the study, 400 participants (200 women) above the age of 25 years who could read understand and speak Kannada/English were recruited. The first author approached potential participants and sought informed consent. Many participants from Group 1 who were semi-literate were not able to read the items fully and would take time to complete the sentences. The first author read the items one by one while participants marked their responses in their own copy of BFI-2-S. Since several participants from Group 1 also had difficulties in writing, the first author read out the items and marked their responses in the appropriate copy. The comfort, privacy and safety of the participants were ensured during administration. Additionally, a section of 40 participants (20 from each group, with 10 men and 10 women) re-administered the test after one week, to assess temporal stability.
Statistical analysis
The data was analyzed using out Statistical Package for Social Sciences (SPSS 25.0). Cronbach's Alpha was used to test the reliability. Variance of the scores in items of the tool and variance of scores of the participants, to whom the tool was administered, was compared for exploring internal consistency. The higher the result of Cronbach's alpha, the better is the internal consistency. The internal consistency refers to the extent to which the items of a tool are related to each other. The results of this test gave an idea of how close the scores measured by the tool were, to the true score.
Pearson's Correlation coefficient was used to calculate test-retest reliability. Test-retest reliability measures the external consistency of the tool. External consistency involves identifying the extent to which the results of a tool vary from one administration to another. Test-retest clarified the temporal stability of the tool and established whether the results were consistent over time or not. Differences within and between the groups were studied using one-way Analysis of Variance (ANOVA).
Exploratory Factor Analysis was done to identify the fundamental structure underlying a set of variables. For the purpose of this study, Principal Component Analysis with Varimax rotation and Kaiser Normalization were used. Principal Component Analysis was used so that it reduced a set of potentially correlated variables to a smaller set of linearly uncorrelated variables. Varimax rotation helped to convert the factors obtained through Principal Component Analysis into factors that were easier to interpret. Kaiser normalization aided in the process of rotation by first normalizing the factor loadings and then de-normalizing them after rotation.
RESULTS
The study comprised a total of 400 participants between the ages of 25 and 92 years. Within the 400, the first group included 200 people from a lower socio-economic background, and the second group included 200 people from a relatively higher socio-economic background. Participants from Group 1 had an education level below 10th grade, worked in the low-income or unorganized sectors and earned less than Rs. 2,50,000 per annum. Some examples of the sub-sections of the population included in Group 1 were auto-drivers, domestic helpers and restaurant workers. Meanwhile, participants from Group 2 had an education level of 12th grade or above, worked in the organized sector and belonged to a household that earned more than Rs. 2,50,000 per annum. Examples of the sub-sections of the population included in Group 2 are Healthcare Professionals, Lawyers and Business owners. Within each group of 200 participants, 100 were male, and 100 were female. All the participants were from Manipal, Udupi and Mangalore areas, of Karnataka state, and these are Urban areas.
Statistical properties of the BFI-2-S in the total sample are depicted in Table 1. The mean scores on the five domains ranged from 16 to 22. Except for neuroticism, the skewness values were negative, which indicates a greater number of larger values in the distribution. Skewness values range between -0.5 to +0.5, which indicates that the distribution is approximately symmetric. The kurtosis values for the data were less than 3 and are indicative of platykurtic distribution.
Table 1.
Statistical properties of BFI-2-S and Mean scores and standard deviations of the five dimensions of the Five Factor Model, between males and females from Groups 1 and 2
| Domains | Group 1 BFI-2-S Kannada |
Group 2 BFI-2-S English |
Total |
||||
|---|---|---|---|---|---|---|---|
| Males (n=100) |
Females (n=100) |
Males (n=100) |
Females (n=100) |
n=400 |
Skewness | Kurtosis | |
| Mean (SD) | Mean (SD) | Mean (SD) | Mean (SD) | Mean (SD) | |||
| O | 20.43 (3.41) | 20.45 (3.23) | 19.06 (4.41) | 19.84 (3.85) | 19.95 (3.79) | -0.307 | 0.730 |
| C | 22.08 (4.25) | 21.93 (4.35) | 19.69 (5.14) | 20.67 (4.56) | 21.09 (4.68) | -0.071 | -0.492 |
| E | 20.13 (4.06) | 19.68 (3.56) | 18.16 (4.18) | 19.10 (3.92) | 19.27 (3.99) | -0.202 | 0.116 |
| A | 22.82 (4.08) | 23.20 (3.6) | 21.54 (5.05) | 21.83 (4.72) | 22.35 (4.44) | -0.316 | -0.518 |
| N | 16.30 (4.26) | 17.34 (4.52) | 17.59 (5.14) | 17.88 (4.38) | 17.28 (4.61) | 0.043 | -0.384 |
SES: Socio Economic Status, SD: Standard Deviation, O: Openness to Experience, C: Conscientiousness, E: Extraversion, A: Agreeableness, N - Neuroticism
Mean and standard deviations for the five domains of OCEAN by gender and Socio-Economic Status were as in Table 1. The mean differences between all the sections were only marginal. In Group 1, women had a slightly higher mean score than the men in Agreeableness and Neuroticism domains. Whereas in Group 2, women had marginally higher mean scores under all five domains. Between the two groups, Group 2 tended to have relatively lower scores than Group 1 in most dimensions except for Neuroticism, in which Group 2 had a slightly higher mean score.
When the original tool was compared to its Kannada translation, there was a slight difference between the mean scores which is shown in Table 2. The mean scores on the five domains in the English version ranged from 16 to 24, and in the Kannada version, it ranged from 17 to 22. Except for neuroticism in English and Conscientiousness in Kannada, the skewness values were negative. This indicated a greater number of larger values in the distribution. Skewness values ranged between -0.5 to +0.5 in both versions, which indicated that the distribution was approximately symmetric. The kurtosis values for the data, for both the English version and the Kannada translation, were less than 3 and were therefore indicative of platykurtic distribution.
Table 2.
Comparison of statistical properties between English and Kannada versions of BFI-2-S
| Domains | Group 1 BFI-2-S Kannada |
Group 2 BFI-2-S English |
||||
|---|---|---|---|---|---|---|
| Mean (SD) | Skewness | Kurtosis | Mean (SD) | Skewness | Kurtosis | |
| Openness to Experience | 19.45 (4.15) | -0.48 | 0.34 | 20.44 (3.32) | 0.28 | 0.82 |
| Conscientious-ness | 20.18 (4.88) | 0.16 | -0.60 | 22 (4.29) | -0.23 | -0.089 |
| Extraversion | 18.63 (4.08) | -0.16 | -0.06 | 19.9 (3.82) | -0.20 | 0.372 |
| Agreeableness | 21.69 (4.89) | -0.24 | -0.85 | 23.01 (3.85) | -0.17 | -0.411 |
| Neuroticism | 17.74 (4.77) | -0.05 | -0.56 | 16.82 (4.41) | 0.11 | -0.10 |
SES: Socio Economic Status, SD: Standard Deviation
Internal consistency
The internal consistency for the five personality factors was analyzed using Cronbach's alpha and is depicted Table 3. Agreeableness, Neuroticism and Conscientiousness scales had Cronbach's alpha ranging between 0.6 and 0.7. The domains of Openness to Experience and Extraversion had Cronbach's alpha values of less than 0.5. In general, these results indicated poor or questionable internal consistency for the scales. The domains of Agreeableness, Neuroticism and Conscientiousness had a mean inter-item correlation between 0.15 and 0.5, which indicated that the items had reasonable homogeneity and sufficient uniqueness. Openness to Experience and Extraversion had a mean inter-item correlation below 0.15, which meant that the items did not correlate with each other and therefore, might not be measuring the same construct. Overall, the internal consistency of the five factors was low, especially in the domains of Openness to Experience and Extraversion, in both, the English version and the Kannada translation.
Table 3.
Internal consistency of BFI-2-S English and Kannada
| Domains | Group 1 BFI -2-S Kannada |
Group 2 BFI-2-S English |
||
|---|---|---|---|---|
| Cronbach's alpha | Mean inter-item correlation | Cronbach's alpha | Mean inter-item correlation | |
| Openness to Experience | 0.39 | 0.09 | 0.33 | 0.07 |
| Conscientiousness | 0.63 | 0.22 | 0.67 | 0.26 |
| Extraversion | 0.34 | 0.08 | 0.48 | 0.14 |
| Agreeableness | 0.67 | 0.25 | 0.69 | 0.21 |
| Neuroticism | 0.58 | 0.18 | 0.66 | 0.24 |
The test-retest method was used to assess the temporal stability of the tool and is depicted in Table 4. Both versions of the BFI were re-administered to 40 participants - 20 from each group, after two weeks. Pearson's correlations for test-retest reliability were in the range between .8 and .96, indicative of good test-retest reliability for all five subscales.
Table 4.
Test-retest reliability of BFI (n=40)
| Domain | Test Mean (SD) | Retest Mean (SD) | Correlation |
|---|---|---|---|
| Openness to Experience | 19.53 (3.58) | 19.86 (4.04) | 0.912** |
| Conscientiousness | 21.4 (3.37) | 21.23 (3.93) | 0.894** |
| Extraversion | 18.7 (3.82) | 18.85 (3.62) | 0.891** |
| Agreeableness | 22.7 (4.45) | 22.78 (4.57) | 0.963** |
| Neuroticism | 18.13 (4.57) | 18 (5.04) | 0.963** |
**Correlation significant at 0.01 level
Factor analysis of the BFI-2-S
An exploratory factor analysis using Principal Component Analysis was used to study the structural framework of the items. Kaiser Meyer Olkin sampling adequacy (0.781) and Bartlett's test of sphericity were significant at P < 0.001 indicating that the data was suitable for factor analysis. There were 10 Eigen values that were more than 1. However, Initial Eigen values show that first 5 factors explained 16.8%, 8.3%, 6.1%, 5.6%, and 4.9% of the variance respectively. The factor 5 was at the ‘elbow’ of the scree plot in Figure 1 and ‘leveling off’ at the elbow of the scree plot offers a five factor solution. The five factor solution explained 41.7% of the variance. The items were both positively and negatively loaded to the factors. Some of the items were cross-loaded under other factors, but they were assigned to the factor with the highest value. The factors and their corresponding loading are reported in Table 5.
Figure 1.
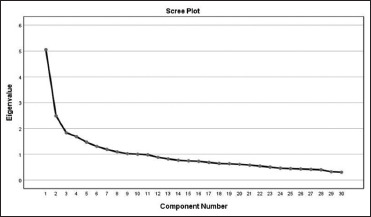
Scree plot
Table 5.
Variance explanation of the items of BFI -2-S and Rotated Component Matrix with four factors (n=400)
| Item (Number) | Domain | Facet | Factors |
||||
|---|---|---|---|---|---|---|---|
| 1 | 2 | 3 | 4 | 5 | |||
| Feels secure, comfortable with self (24) | N | Depression | -0.738 | -0.203 | |||
| Is persistent, works until the task is finished (23) | C | Productiveness | 0.644 | 0.245 | 0.248 | ||
| Is relaxed, handles stress well (19) | N | Respectfulness | -0.564 | 0.442 | |||
| Is respectful, treats others with respect (22) | A | Anxiety | 0.519 | 0.207 | 0.429 | ||
| Has few artistic interests (20) | O | Aesthetic Sensitivity | -0.496 | ||||
| Keeps things neat and tidy (18) | C | Organization | 0.454 | 0.300 | |||
| Tends to be quiet (1) | E | Sociability | -0.447 | ||||
| Is complex, a deep thinker (25) | O | Intellectual Curiosity | 0.410 | -0.305 | 0.341 | 0.393 | |
| Is emotionally stable, not easily upset (14) | N | Emotional Volatility | -0.345 | -0.229 | 0.305 | ||
| Is full of energy (11) | E | Energy Level | 0.674 | -0.239 | |||
| Is dominant, acts as a leader (6) | E | Assertiveness | 0.567 | -0.457 | |||
| Is original, comes up with new ideas (15) | O | Creative Imagination | 0.556 | 0.338 | |||
| Is outgoing, sociable (16) | E | Socialization | 0.223 | 0.490 | |||
| Assumes the best about people (12) | A | Trust | 0.378 | 0.456 | 0.241 | ||
| Is reliable, can always be counted on (13) | C | Responsibility | 0.381 | 0.446 | 0.382 | ||
| Is less active than other people (26) | E | Energy Level | 0.421 | 0.364 | -0.287 | ||
| Is fascinated by art, music, or literature (5) | O | Aesthetic Sensitivity | 0.297 | ||||
| Can be cold and uncaring (17) | A | Compassion | 0.574 | ||||
| Tends to find fault with others (27) | A | Trust | 0.563 | ||||
| Is sometimes rude to others (7) | A | Respectfulness | 0.524 | ||||
| Can be somewhat careless (28) | C | Responsibility | 0.476 | ||||
| Is compassionate, has a soft heart (2) | A | Compassion | 0.265 | 0.250 | 0.441 | 0.268 | |
| Worries a lot (4) | N | Anxiety | 0.753 | ||||
| Is temperamental, gets emotional easily (29) | N | Emotional Volatility | 0.227 | 0.579 | |||
| Tends to feel depressed, blue (9) | N | Depression | 0.571 | ||||
| Has difficulty getting started on tasks (8) | C | Productiveness | 0.262 | -0.484 | 0.314 | ||
| Prefers to have others take charge (21) | E | Assertiveness | 0.252 | -0.217 | -0.418 | 0.213 | |
| Has little interest in abstract ideas (10) | O | Intellectual Curiosity | 0.628 | ||||
| Has little creativity (30) | O | Creative Imagination | -0.314 | 0.281 | 0.620 | ||
| Tends to be disorganised (3) | C | Organization | 0.306 | 0.203 | 0.211 | 0.348 | |
| Eigen values | 5.054 | 2.487 | 1.835 | 1.684 | 1.463 | ||
| % Variance | 16.845 | 8.289 | 6.115 | 5.612 | 4.878 | ||
A=Agreeableness, C=Conscientiousness, E=Extraversion, N=Neuroticism, O=Openness to Experience. Extraction Method: Principal Component Analysis. Rotation Method: Varimax with Kaiser Normalisation
Description of factors
Factor One contained two positively loaded items from the domain of Conscientiousness, one from Agreeableness and one from Openness to Experience. It also included three negatively loaded items from Neuroticism and one each from Openness to Experience and Extraversion. This factor seemed to share similarities with Musek's[6] General Factor of Personality, which was associated with overall social effectiveness, as well as higher motivation, self-esteem, emotionality and well-being. Factor One fits well within this explanation of the GFP. This factor was named Social Effectiveness.
Factor Two comprised positively loaded items, mostly from the domains of Extraversion and Openness to Experience. It also had one item each from the domains of Agreeableness and Conscientiousness. All these items were indicative of high interpersonal ability. Therefore, this factor was named Interpersonal Ability.
Factor Three primarily encompassed positively loaded items from Agreeableness and one item from Conscientiousness. A compassionate, respectful and trusting individual could be described as affable, but with the added trait of responsibility, the former traits become more proactive. The Oxford Dictionary[22] defined Altruism as “the fact of caring about the needs and happiness of other people and being willing to do things to help them, even if it brings no advantage to yourself”. Being willing to proactively help requires a sense of personal responsibility. Thus, this factor was named as Altruism.
Factor Four comprised positively loaded items from the domain of Neuroticism. It also contained negatively loaded items from the domains of Conscientiousness and Extraversion. This directly explained a state of emotional instability, and productivity and self-esteem were often affected in those who suffer from such instability. Therefore, this factor indicated Emotional Instability.
Factor Five included two items from the domain of Openness to Experience and one from Conscientiousness. These items, when combined, suggest an individual who was imaginative and inventive. This factor was labeled as Innovativeness.
DISCUSSION
The psychometric assessment of the tools revealed good reliability in terms of temporal stability. The poor internal consistency of the subdomains in test is expected in the light of poor factor fit of the current study to the original OCEAN model. Factor analysis results suggested a five-factor solution that explained 41.74% of the variance. This could be compared to other factor analytical studies such as the original five factors that are said to account for 56% of the normal personality trait sphere[23]; Musek's[6] GFP explains 50.20% of the variance; the GFP extracted by van der Linden et al.[13] explained 49.3% of the variance in a Tsimane population, but it only explained 19.7% of the variance in WEIRD participants; and the six factors by Cheung et al.[18] explained 50% of the total variance.
The most crucial finding of this study was that the factor structure obtained had deviated from the original distribution of the FFM. This indicated that the factors described by the Big Five were not entirely congruent with an Indian population, and thus questions the universality of five factor model. Some of the possible explanations for this are as follows: Several items of the tool, specifically those pertaining to Openness to Experience, did not hold cultural relevance. For example, the item, “Is fascinated by art, music, or literature” does not necessarily describe openness to experience in an Indian population, especially in the lower SES. This group largely encompassed people who suffer from poverty and the aesthetic activities of Openness domain might not be of personal significance. Consequently, exploring the meaning of each of these domains within a cross-cultural context becomes necessary. A hierarchical analysis[24] supported this finding, as it reported that small differences in the O factor were found in their five-factor solution, with respect to more intellectual variables being represented as opposed to imaginative variables. Another explanation comes from the type and method of administration of the tool. During administration, it was noticed that both groups were not as familiar with the concept of rating scales as Western populations usually are. In spite of repeated explanations and examples, most participants found it difficult to quantify their behavior. This was starker in Group One. Moreover, owing to their education-level, administering a self-report questionnaire proved to be quite challenging. Most participants faced difficulties in writing down their responses and preferred to answer the items in an interview format. This, in turn, increased the chances of social desirability influencing their responses. Hence, while taking up the issue of cross-cultural adaptability, the mode of assessment also needs to be looked into. Nevertheless, it was possible to extract a meaningful factor structure from the data obtained. Each of the factors in the five-factor solution is discussed below.
Factor One revealed traits that are generally considered socially desirable in an Indian context. It included higher levels of organization, productiveness, respectfulness and intellectual curiosity. Additionally, it is also related to lower levels of sociability, anxiety, depression and emotional volatility and aesthetic sensitivity. Indian ethos values individuals who can make efficient contributions to society and the facets of organization, productiveness and intellectual curiosity specifically predict this ability. Meanwhile, respectfulness has always been an indispensable element of Indian culture. As for the negatively loaded traits, aesthetic sensitivity tends to have cultural connotations of ostentatiousness, which is considered to be undesirable more often than not. Similarly, sociability is often considered to be a trait that could hinder one's efficiency and productiveness. Furthermore, the expression of anxiety, depression and emotional volatility is ordinarily discouraged in collectivistic cultures, and hence a lower score in this facet also contributes to a socially desirable profile. This factor seemed to share core similarities with the concept of the GFP as identified by Musek.[6] He associated it with overall social effectiveness as well as higher motivation, self-esteem, emotionality and well-being. Factor One fits well within this explanation of the GFP. Thus, high scores in this factor indicated Social Effectiveness.
Factor Two largely related to Extraversion, trust, responsibility, aesthetic sensitivity and creative imagination. The combination of these factors illustrated a clear picture of a person with good interpersonal and managerial skills. Collectivistic cultures often place emphasis on a capable leader, and the presence of higher assertiveness, energy, trust and responsibility is expected in such a leader. Moreover, all these traits, along with sociability, aesthetic sensitivity and creativity are indicative of high interpersonal ability. Therefore, this factor was named Interpersonal Ability.
Factor Three encompassed traits, such as compassion, respectfulness and trust, as well as responsibility. These are highly valued traits in collectivistic cultures because of the role they play in maintaining social harmony. A compassionate, respectful and trusting individual can be described as affable or cordial, however, with the added trait of responsibility, the former traits are elevated, and they become more proactive. Caring about other people without personal gain is accounted for by the traits of compassion, respectfulness and trust. Meanwhile, being willing to proactively help requires a sense of personal responsibility. This factor was named Altruism.
Factor Four positively related to Neuroticism, through higher levels of anxiety depression and emotional volatility. This factor was the closest to the original domains as it contained all the facets under Neuroticism. The study by Kunnel John et al.[17] that analyzed 1117 Indian adolescents supports this finding, as it found Neuroticism to be the only factor that emerged in a meaningful pattern. Additionally, this factor also negatively related to productiveness from the Conscientiousness domain and assertiveness from the Extraversion domain. This directly explains a state of emotional instability, as productivity and self-esteem are often affected in those who tend to be emotionally volatile, depressed, or anxious. Therefore, high scores in this factor indicated Emotional Instability.
Factor Five was explained by the traits of intellectual curiosity creative imagination and organization. These traits, when combined, suggest an individual who is imaginative and inventive, as evinced by several studies.[25,26] The trait of organization helps bring intellectual curiosity and creativity together in a productive manner, to create something new and advantageous. Thus, a high score in this factor was indicative of Innovativeness.
CONCLUSION
From this study, it could be concluded that the generalizability of the FFM is certainly arguable. The meaning of the dimensions of the model changes in different cultural contexts. When the factor structure of personality is explored in Indian participants, a distinct model emerges, with factors more congruent with Indian culture. Moreover, it can be concluded that the question of cross-cultural applicability is not limited to models of personality alone, but the methods of testing as well. Existing tools were designed to assess personality in educated populations that have some understanding of how the administration of these tools works. Thus, a comprehensive foray into cultural inclusiveness in personality research is the need of the hour.
The merits of this study are mostly because of the socioeconomically diverse sample. Moreover, the participants were above the age of 25, and therefore had well-established personalities. The study also attempted to establish a Kannada translation of the tool, and used the back-translation method in adherence with WHO guidelines. The limitations of this study are due to the short study period of less than a year, which made it difficult to recruit a larger sample. Additionally, Group One (Lower SES) faced significant difficulties with the self-report format and insisted on an interview format, which increased the potential for social desirability. Furthermore, some of the items in the tool did not hold the same significance for an Indian population as they did for Western ones.
Recommendations for the future include replicating the study on a larger scale with a bigger sample size, and at a pan-India level. Furthermore, explorations of the cross-cultural adaptability of the Big Five must be carried out in different parts of the world, especially in Eastern countries. Additionally, the dimensions of the model can be specifically explored within a cross-cultural context. Methods of administering the tool to a semi-educated or uneducated population in a more accurate manner must also be explored. Lastly, to arrive at a more comprehensive model of Indian personality, lexical hypothesis projects can be taken up with Indian personality-descriptive adjectives. The items developed from these words would be more culturally congruent and would result in a model of personality that is entirely indigenous.
Financial support and sponsorship
Nil.
Conflicts of interest
There are no conflicts of interest.
REFERENCES
- 1.Goldberg LR. From ace to zombie: Some explorations in the language of personality. In: Spielberger CD, Butcher JN, editors. Advances in Personality Assessment. vol 1. Hillsdale NJ: Lawrence ErIbaum; 1982. pp. 203–34. [Google Scholar]
- 2.McCrae RR, Costa PT., Jr Personality trait structure as a human universal. Am Psychol. 1997;52:509–16. doi: 10.1037//0003-066x.52.5.509. [DOI] [PubMed] [Google Scholar]
- 3.Digman JM. Higher-order factors of the big five. J Pers Soc Psychol. 1997;73:1246–56. doi: 10.1037//0022-3514.73.6.1246. [DOI] [PubMed] [Google Scholar]
- 4.Ashton MC, Lee K, Perugini M, Szarota P, de Vries RE, Di Blas L, et al. A six-factor structure of personality-descriptive adjectives: Solutions from psycholexical studies in seven languages. J Pers Soc Psychol. 2004;86:356–66. doi: 10.1037/0022-3514.86.2.356. [DOI] [PubMed] [Google Scholar]
- 5.Tellegen A, Waller NG. Re-examining basic dimensions of natural language trait descriptors Paper presented at the 95th annual convention of the American Psychological Association [Google Scholar]
- 6.Musek J. A general factor of personality: Evidence for the big one in the five-factor model. J Res Pers. 2007;41:1213–33. [Google Scholar]
- 7.Pettersson E, Turkheimer E, Horn EE, Menatti AR. The general factor of personality and evaluation. Eur J Pers. 2012;26:292–302. [Google Scholar]
- 8.Erdle S, Rushton JP. Does self-esteem or social desirability account for a general factor of personality (GFP) in the Big Five? Pers Individ Differ. 2011;50:1152–4. [Google Scholar]
- 9.Church AT, Katigbak MS. The five-factor model in the Philippines: Investigating trait structure and levels across cultures. In: McCrae RR, Allik J, editors. The Five-Factor Model of Personality Across Cultures. Kluwer Academic/Plenum Publishers; 2002. pp. 129–54. [Google Scholar]
- 10.Palsson TS, Christensen SWM, Pape MH, Hirata RP, Rafn T, Skou ST. Cross-cultural adaptation of the Danish version of the Big Five Inventory - a dual-panel approach. Scand J Pain. 2020;20:397–406. doi: 10.1515/sjpain-2019-0066. [DOI] [PubMed] [Google Scholar]
- 11.Piedmont RL, Bain E, McCrae RR, Costa PT. The applicability of the five-factor model in a sub-Saharan culture: The NEO-PI-R in Shona. In: McCrae RR, Allik J, editors. The Five-Factor Model of Personality Across Cultures. Kluwer Academic/Plenum Publishers; 2002. pp. 155–73. [Google Scholar]
- 12.Erdle S, Aghababaei N. Evidence for the general factor of personality (GFP) in the Big Five from 600 Iranians. Pers Individ Diff. 2012;53:359–61. [Google Scholar]
- 13.van der Linden D, Dunkel CS, Figueredo AJ, Gurven M, von Rueden C, Woodley Of Menie MA. How universal is the general factor of personality? An analysis of the big five in forager farmers of the Bolivian Amazon. J Cross Cult Psychol. 2018;49:1081–97. doi: 10.1177/0022022118774925. [DOI] [PMC free article] [PubMed] [Google Scholar]
- 14.Kajonius P, Mac Giolla E. Personality traits across countries: Support for similarities rather than differences. PLoS One. 2017;12:e0179646. doi: 10.1371/journal.pone.0179646. doi:10.1371/journal.pone.0179646. [DOI] [PMC free article] [PubMed] [Google Scholar]
- 15.Lodhi PH, Deo S, Belhekar VM. The Five-Factor model of personality: Measurement and correlates in the Indian context. In: McCrae RR, Allik J, editors. The Five-Factor Model of Personality Across Cultures. Kluwer Academic/Plenum Publishers; 2002. pp. 227–48. [Google Scholar]
- 16.Singh K, Jha SD. The Positive personality traits questionnaire: Construction and estimation of psychometric properties. Psychol Stud. 2010;55:248–55. [Google Scholar]
- 17.Kunnel John R, Xavier B, Waldmeier A, Meyer A, Gaab J. Psychometric evaluation of the BFI-10 and the NEO-FFI-3 in Indian adolescents. Front Psychol. 2019;10:1057. doi: 10.3389/fpsyg.2019.01057. [DOI] [PMC free article] [PubMed] [Google Scholar]
- 18.Cheung FM, Leung K, Zhang JX, Sun HF, Gan YQ, Song WZ, et al. Indigenous Chinese personality constructs: Is the five-factor model complete? J Cross-Cult Psychol. 2001;32:407–33. [Google Scholar]
- 19.Henrich J, Heine SJ, Norenzayan A. The weirdest people in the world? Behav Brain Sci. 2010;33:61–83. doi: 10.1017/S0140525X0999152X. discussion 83-135. [DOI] [PubMed] [Google Scholar]
- 20.Soto CJ, John OP. Short and extra-short forms of the Big Five Inventory–2: The BFI-2-S and BFI-2-XS. J Res Pers. 2017;68:69–81. [Google Scholar]
- 21.Sharma R. Revised Kuppuswamy's socioeconomic status scale: Explained and updated. Indian Pediatr. 2017;54:867–70. [PubMed] [Google Scholar]
- 22. [Last accessed on 2023 Aug 03]. Available from: https://www.oxfordlearnersdictionaries.com/definition/english/altruism .
- 23.Boyle GJ, Stankov L, Cattell RB. Measurement and statistical models in the study of personality and intelligence. In: Saklofske DH, Zeidner H, editors. International Handbook of Personality and Intelligence. Plenum Press; 1995. pp. 417–46. [Google Scholar]
- 24.Ashton MC, Lee K, Goldberg LR. A hierarchical analysis of 1,710 English personality-descriptive adjectives. J Pers Soc Psychol. 2004;87:707–21. doi: 10.1037/0022-3514.87.5.707. [DOI] [PubMed] [Google Scholar]
- 25.Sarooghi H, Libaers DP, Burkemper AC. Examining the relationship between creativity and innovation: A meta-analysis of organizational, cultural, and environmental factors. J Bus Ventur. 2015;30:714–31. [Google Scholar]
- 26.Çelik P, Storme M, Davila A, Myszkowski N. Work-related curiosity positively predicts worker innovation. J Manag Dev. 2016;35:1184–94. [Google Scholar]