

Abstract
This study aimed to evaluate the association between polymyxin B (PMB) exposure and acute kidney injury (AKI) and analyze the risk factors for PMB‐induced AKI in critically ill patients. Plasma concentrations of PMB were determined using an ultraperformance liquid chromatography–tandem mass spectrometer in intensive care unit patients who were administered PMB. Univariate and multivariate analyses were conducted to identify risk factors. A receiver operating characteristic curve was constructed to assess the discriminant power of the factors and to identify the cutoff value for AKI. The white blood cell count and estimated area under the concentration–time curve (AUC) of patients administered PMB were independent risk factors for PMB‐induced AKI, where AUC were calculated using a first‐order pharmacokinetic equation based on the mid‐dosing interval concentration (C1/2t) and peak concentration. The area under the receiver operating characteristic curve of the final model was 0.805 (95% confidence interval, 0.690–0.921). The cutoff value for the combined predictor was 0.57. Alternatively, when using C1/2t, which was strongly correlated with AUC, as the only independent risk factor, the analysis showed that the 3.47 μg/ml threshold provides favorable differentiation between the AKI and non‐AKI groups. These results provide insightful information for therapeutic drug monitoring–guiding PMB dosing in clinical practice.
Study Highlights.
WHAT IS THE CURRENT KNOWLEDGE ON THE TOPIC?
Although several studies have identified risk factors for polymyxin B (PMB)–induced acute kidney injury (AKI), such as sex, age, and weight, they have considered the link between PMB exposure and AKI.
WHAT QUESTION DID THIS STUDY ADDRESS?
Compared with the trough and peak concentrations, mid‐dosing interval concentration (C1/2t) may be more important for the early prediction of PMB‐induced AKI.
WHAT DOES THIS STUDY ADD TO OUR KNOWLEDGE?
White blood cell count and the estimated area under the curve based on the C1/2t and peak concentration using a first‐order pharmacokinetic equation were independent risk factors for PMB‐induced AKI. A C1/2t of 3.47 μg/ml was observed to be an alternative cutoff value for predicting PMB‐induced AKI.
HOW MIGHT THIS CHANGE DRUG DISCOVERY, DEVELOPMENT, AND/OR THERAPEUTICS?
Contrary to previous studies and recommendations, our study demonstrated that C1/2t may be a critical concentration point for predicting AKI.
INTRODUCTION
In recent years, multidrug‐resistant gram‐negative bacteria (MDR‐GNB) have become an increasing threat to human health, particularly Pseudomonas aeruginosa, Acinetobacter baumannii, and Enterobacteriaceae. 1 Because of the lack of other effective antibiotics, polymyxins have become the last resort for treating infections caused by MDR‐GNB. 2 Among the polymyxins, polymyxin B (PMB) and colistin are commonly used in clinical practice owing to their satisfactory efficacy and relatively low nephrotoxicity. A systematic review and meta‐analysis has reported that PMB has lower nephrotoxicity than colistin and that no significant difference in mortality was observed between patients treated with the two drugs. 3 However, PMB has more significant advantages than colistin and is widely used in intensive care units. PMB is a polypeptide antibiotic that alters outer membrane permeability of bacterial cells. Commercially available PMB is a mixture in which polymyxin B1 (PMB1) and polymyxin B2 (PMB2) are the major components, accounting for >85% of the mixture.
Despite decades of clinical use, the most common adverse clinical effect of PMB is dose‐dependent nephrotoxicity, which mainly manifests as acute kidney injury (AKI) and acute renal tubular necrosis. The incidence of AKI in patients receiving PMB ranges from 20% to 60%. 4 , 5 , 6 , 7 Several studies have demonstrated the risk factors for PMB‐induced AKI, including sex, age, weight, loading dose, daily dosage, duration of treatment, baseline serum creatinine, infection site, and concomitant antibiotic use. 8 , 9 , 10 , 11 , 12 , 13 However, these studies did not consider the relationship between PMB exposure and AKI.
In 2019, international agencies and academic organizations jointly issued international consensus guidelines for the optimal use of polymyxins. The guidelines recommend achieving a target for the area under the concentration–time curve (AUC) within 24 h at a steady state of 50 to 100 mg·h/L, corresponding to an average steady‐state plasma concentration of 2 to 4 mg/L to reduce the risk of AKI. 14 However, the recommended targets are mainly based on in vitro and animal data rather than clinical results. 15 Recently, two studies have evaluated the association between plasma concentrations of PMB and AKI; however, the results are inconsistent. Han et al. 16 reported on the association between PMB plasma concentration and AKI development and suggested that the trough concentration of PMB should be controlled at <3.13 mg/L to reduce the risk of AKI. Interestingly, Deng et al. 17 reported that the peak concentration rather than the trough concentration of PMB and PMB1 is a significant predictor for the development of AKI. If the peak concentration of PMB1 was >5.23 mg/ml, the probability of AKI would be >50%. The inconsistent findings motivated us to explore the relationship between PMB exposure in vivo and AKI.
Furthermore, a recent study reported that the intermediate concentration of the dosing interval may be the best choice for predicting the adverse effects of antibiotics. 18 In the two studies mentioned previously, only trough and peak concentrations were collected, and therefore the relationship between mid‐dosing interval concentration (C1/2t) of PMB and AKI could not be assessed. Moreover, although the guidelines advise the range of AUC values, how to estimate the AUC with a limited sample strategy remains unclear. The relationship between the AUC estimated using different methods and PMB‐induced AKI remains unknown. Therefore, further research on the relationship between PMB exposure and AKI is required.
This study primarily aimed to identify the relationship between PMB exposure and AKI and determine the cutoff value of PMB when both AUC and plasma concentrations including C1/2t were considered. We also analyzed the risk factors for PMB‐induced AKI in critically ill patients.
METHODS
Study design and ethics
This single‐center, real‐world cohort study was conducted in patients admitted in the intensive care unit of Nanjing Drum Tower Hospital from August 2020 to July 2022. The study protocol was approved by the Ethics Committee of Nanjing Drum Tower Hospital (no. 2021‐466‐01). The inclusion criteria were as follows: (1) adult patients (>18 years) who received intravenous PMB (sulfate; polymyxin B injection, Shanghai First Biochemical Pharmaceutical Co., Ltd., China), (2) patients with confirmed MDR‐GNB infections, (3) PMB was used for at least 2 days, and (4) plasma concentrations were monitored. The exclusion criteria were as follows: (1) baseline serum creatinine of >1.5 mg/dl or renal replacement therapy was used before PMB treatment; (2) maintenance dose of PMB was changed during treatment; and (3) critical data were missed, such as serum creatinine.
Clinical data and sample collection
Demographic characteristics, PMB therapy, baseline routine laboratory examination data, infection sites, pathogens, concomitant nephrotoxic drugs, comorbidities, prognoses, and adverse events were obtained from the hospital information system. Concomitant nephrotoxic drugs included tigecycline, carbapenems, vancomycin, and cefoperazone/sulbactam. Serious and treatment‐emergent adverse events included infectious shock, respiratory failure, respiratory cardiac arrest, and thoracic hemorrhage. Nonserious adverse events included ventilatory dysfunction, aggravation of infection, elevated troponin levels, and progressive elevation of bilirubin levels. Creatinine clearance was estimated using the Cockcroft–Gault equation. 19 According to Kidney Disease: Improving Global Outcomes, AKI was defined as an increase of ≥0.3 mg/dl in serum creatinine level within 48 h, a >1.5 times increase in serum creatinine level within 7 days, or a urine output of <0.5 ml/kg/h for >6 h. 20
The present study did not interfere with the physicians' decisions to administer PMB. The physician determined the dose according to the patient's body weight and the pharmaceutical instructions. A loading dose was typically administered at the time of PMB treatment initiation to quickly achieve a steady‐state serum concentration that provides effective infection control. Generally, 2.5 mg/kg was administered as the loading dose, followed by a 2.5–3 mg/kg/day maintenance dose in two divided doses. However, some patients were not administered a loading dose because of the risk of AKI or other clinical causes.
After at least 48 h of therapy, when steady‐state plasma concentrations were approximately reached even when a loading dose was not administered, three blood samples were collected from each patient: trough concentration (Cmin) of PMB before the next administration, C1/2t 6 h after administration, and peak concentration (Cmax) of PMB immediately after the end of administration. All blood samples were centrifuged at 885 g for 10 min, and the supernatant was obtained and stored at −80°C until analysis.
Quantification of PMB concentrations
Quantification of the PMB concentration is a regular clinical laboratory test for patients treated with PMB, and an internal quality assessment was performed. Briefly, PMB1 and PMB2 plasma concentrations were determined using an ultraperformance liquid chromatography–tandem mass spectrometer (Qlife Lab 9000 UPLC system), and the PMB plasma concentration was calculated as the sum of PMB1 and PMB2. A Phenomenex Kinetex XB‐C18 (2.6 μm, 3.0 × 50 mm) was used for chromatographic separation. Mobile Phase A consisted of 0.1% formic acid in water and Mobile Phase B consisted of acetonitrile. The gradient elution was performed as follows: 0~1 min, 1%~30%B; 1~2.5 min, 30%~98%B; and 2.5~3 min, 98%B. Column temperature and flow rate were 40°C and 0.3 ml/min. The PMB peaks in blank samples were <2% of the lower limit of quantitation level for PMB1 and PMB2. The calibration curve demonstrated a good linear relationship with correlation coefficients of 0.998 and 0.999 in the range of 35–14,000 ng/ml for PMB1 and 15–6000 ng/ml for PMB2, respectively. For PMB1, the intrabatch and interbatch precisions of the quality control samples ranged from 2.1% to 6.1%, and the corresponding accuracy ranged from −1.1% to 8.1%. For PMB2, the intrabatch and interbatch precisions of quality control samples ranged from 2.3% to 11.9%, and the corresponding accuracy ranged from −1.2% to 7.4%.
Estimation of PMB AUC
The trapezoidal area method and first‐order pharmacokinetic equation method were used to estimate AUC in this study. 21 For the first‐order pharmacokinetic equation method, we employed a formula based on the one‐compartment model with linear elimination because it can adequately explain the pharmacokinetics of PMB. 22 Two timed steady‐state plasma concentrations (Cmin–Cmax) or three‐timed steady‐state plasma concentrations (Cmin–C1/2t–Cmax) are used in the trapezoidal area method. Any two timed steady‐state plasma concentrations (Cmin–Cmax, Cmin–C1/2t, or C1/2t–Cmax) are used in the first‐order pharmacokinetic equation method. The relevant formulas are as follows:
| (1) |
Equation (1) uses the trapezoidal area method to estimate the AUC, where t i and t i−1 are adjacent sampling times, and c i and c i−1 are the corresponding plasma concentrations.
| (2) |
| (3) |
Equations (2) and (3) use the first‐order pharmacokinetic equation method to estimate AUC, which refers to Equations (1) and (4) from Pai et al. 21 Ke is the elimination rate constant, C1 and C2 represent any two of the three concentrations, and t is the interval between the two concentrations. Where t' is infusion time, Ceoiʹ and Ct are the theoretical approximate steady‐state peaks and trough concentrations.
Data analysis
Continuous variables with normal distribution are described as means ± standard deviations (SDs), and a Student's t‐test was used to compare the two groups. Continuous variables with non‐normal distribution are presented as medians and interquartile ranges, and the Mann–Whitney U test was used to compare the two groups. Categorical variables are summarized as frequencies and percentages, and comparisons among groups were performed using the chi‐square test or Fisher's exact test.
A logistic regression analysis was performed to determine the risk factors associated with AKI. Variables with p < 0.05 in the univariate analysis were included in the multivariate analysis. The forward stepwise method was used to determine risk factors in the multivariate analysis. The Hosmer–Lemeshow test was adopted to evaluate the goodness of fit of logistic regression models, and a nonsignificant test (p ≥ 0.05) indicated a good fit. 23
A receiver operating characteristic (ROC) curve was constructed to assess the discriminant power of the factors and to identify the cutoff value for AKI. Areas under the curve of 0.7–0.79 were considered a satisfactory performance and those of 0.8–0.89 was considered optimum performance. 24 The Youden index is used to measure overall diagnostic effectiveness, ranging between 0 and 1, with a value of 1 indicating perfect diagnostic effectiveness and 0 indicating an ineffective test. 25 Pearson correlation analysis was performed to evaluate the relationship between AUC and plasma concentration. Significance was set at p < 0.05. The IBM SPSS Statistics software (Version 25.0) was used for data analysis, and graphs were prepared using GraphPad Prism (Version 9.0).
RESULTS
A total of 90 patients who underwent intravenous PMB were enrolled in this study. After excluding 35 patients (29 patients were undergoing renal replacement therapy or had renal insufficiency at baseline, five patients had dose changes but without therapeutic drug monitoring [TDM], and one patient had missing serum creatinine), 55 patients were finally included in the study. The PMB concentration was measured in 165 blood samples. The mean age of the patients was 61 years, and the median body weight was 62 kg. Of the patients, 64% were men, and the duration of therapy was 4–42 days. The Acute Physiology and Chronic Health Evaluation II and Sequential Organ Failure Assessment scores of patients at baseline were 20.6 ± 5.8 and 6.3 ± 3.0, respectively. Acinetobacter baumannii (n = 38, 69.1%) and Klebsiella pneumoniae (n = 22, 40.0%) were the predominant pathogenic bacteria. Of the patients, 34 received loading doses of 75, 100, 150, or 200 mg. Doses of 100, 150, and 200 mg were used to maintain the desired steady‐state drug concentration. The dosing regimens for the loading and maintenance doses in all patients are detailed in Table 1. The Cmin of PMB ranged from 0.397 to 4.933 μg/ml, and C1/2t of PMB ranged from 1.438 to 7.030 μg/ml, whereas Cmax of PMB ranged from 2.976 to 14.155 μg/ml (Figure 1). The AKI group comprised 30 patients, and 25 were assigned to the non‐AKI group, with an overall AKI incidence of 54.5%. AKI occurred 3–17 days after the start of treatment; 46.7% of patients developed AKI within 7 days and 53.3% developed AKI after 7 days of treatment (Figure 2). Of the 30 patients included in the AKI group, eight patients developed declining renal function, and five patients died, and 15 patients demonstrated improved renal function. Two patients were voluntarily discharged from the hospital. The 30‐day mortality rate was 34.5% (20% in the non‐AKI group vs. 46.7% in the AKI group; p = 0.038). Regarding adverse events, 14 and 10 patients in the AKI and non‐AKI groups, respectively, experienced at least one adverse event during the PMB treatment period. Following are the final treatment outcomes of the 55 patients: nine died, 11 were discharged voluntarily, 34 improved, and one was cured. The detailed demographic and clinical data are presented in Table 1.
TABLE 1.
Characteristics and univariate analysis of patients in the AKI group and non‐AKI group.
| Variable | Overall (n = 55) | Non‐AKI (n = 25) | AKI (n = 30) | p value |
|---|---|---|---|---|
| Baseline demographics | ||||
| Sex | ||||
| Male | 35 (63.6) | 13 (52.0) | 22 (73.3) | 0.101 |
| Female | 30 (36.7) | 12 (48.0) | 8 (26.7) | |
| Age, y | 61.0 ± 16.7 | 60.4 ± 15.6 | 61.4 ± 17.9 | 0.834 |
| Body weight, kg | 62.0 (55.0, 73.0) | 64.0 (50.0, 72.5) | 60.5 (57.3, 73.3) | 0.806 |
| Duration of treatment, days | 11.0 (8.0, 15.0) | 11.0 (8.5, 14.0) | 12.5 (8.0, 15.3) | 0.524 |
| APACHE II score | 20.6 ± 5.8 | 20.6 ± 5.8 | 20.6 ± 5.9 | 0.997 |
| SOFA score | 6.3 ± 3.0 | 6.0 (4.0, 7.5) | 6.0 (4.0, 8.3) | 0.507 |
| PMB treatment | ||||
| Infusion time, h | 0.678 | |||
| 1 | 48 (87.3) | 23 (92.0) | 25 (83.3) | |
| 2 | 5 (9.1) | 2 (8.0) | 3 (10.0) | |
| 2.5 | 2 (3.6) | 0 (0.0) | 2 (6.7) | |
| Loading dose, mg | 0.138 | |||
| 0 | 21 (38.2) | 9 (36.0) | 12 (40.0) | |
| 75 | 3 (5.5) | 3 (12.0) | 0 (0.0) | |
| 100 | 24 (43.6) | 11 (44.0) | 13 (43.3) | |
| 125 | 1 (1.8) | 1 (4.0) | 0 (0.0) | |
| 150 | 6 (10.9) | 1 (4.0) | 5 (16.7) | |
| Maintenance dose, mg | 0.031* | |||
| 100 | 15 (27.3) | 11 (44.0) | 4 (13.3) | |
| 150 | 39 (70.9) | 14 (56.0) | 25 (83.3) | |
| 200 | 1 (1.8) | 0 (0.0) | 1 (3.3) | |
| Laboratory examination data | ||||
| Procalcitonin, g/L | 0.3 (0.1, 1.2) | 0.3 (0.1, 0.7) | 0.4 (0.2, 1.7) | 0.310 |
| White blood cell, 109/L | 9.6 (7.3, 13.4) | 8.5 (5.8, 11.3) | 10.8 (8.1, 17.2) | 0.041* |
| Neutrophil, 109/L | 10.6 ± 10.7 | 7.2 (4.5, 9.9) | 9.5 (5.9, 15.6) | 0.106 |
| Neutrophil % | 82.0 (77.2, 89.1) | 79.6 (75.7, 83.8) | 86.3 (79.4, 91.7) | 0.041* |
| Alanine transaminase, U/L | 27.7 (16.8, 43.2) | 30.0 (14.7, 52.9) | 25.3 (17.2, 41.7) | 0.654 |
| Aspartate transaminase, U/L | 27.2 (20.1, 37.0) | 27.6 (17.7, 44.3) | 26.9 (20.2, 33.8) | 0.630 |
| Alkaline phosphatase, U/L | 104.3 (67.4, 156.7) | 97.4 (66.3, 144.6) | 108.9 (73.6, 165.3) | 0.447 |
| Glutamyl transpeptidase, U/L | 69.2 (27.1, 134.7) | 57.9 (24.0, 113.3) | 91.5 (32.0, 164.8) | 0.190 |
| Total bilirubin, μmol/L | 12.4 (8.2, 22.7) | 12.4 (7.9, 19.7) | 12.8 (8.6, 26.3) | 0.457 |
| Direct bilirubin, μmol/L | 4.6 (2.6, 10.8) | 3.3 (2.3, 9.2) | 5.3 (2.9, 13.5) | 0.217 |
| Total proteins, g/L | 57.8 ± 8.0 | 57.3 (49.5, 64.9) | 57.5 (52.3, 62.9) | 0.594 |
| Serum albumin, g/L | 33.0 (30.2, 35.5) | 33.2 (29.8, 37.0) | 33.0 (30.8, 34.6) | 0.987 |
| Blood urea nitrogen, mmol/L | 10.3 ± 4.9 | 9.1 (6.5, 12.4) | 8.1 (6.9, 14.0) | 0.980 |
| Serum creatinine, μmol/L | 52.0 (35.0, 64.0) | 56.0 (30.0, 67.5) | 51.5 (37.8, 62.3) | 0.618 |
| Uric acid, μmol/L | 176.0 (108.0, 236.0) | 137.0 (102.0, 238.5) | 185.5 (111.0, 242.8) | 0.437 |
| C‐reactive protein, mg/L | 79.6 ± 66.9 | 52.7 (7.5, 100.0) | 86.7 (33.2, 131.0) | 0.052 |
| Estimated glomerular filtration rate, ml/min·1.732/m2 | 162.2 ± 75.9 | 127.3 (101.9, 254.0) | 146.4 (106.1, 194.2) | 0.660 |
| Creatinine clearance, ml/min | 129.6 ± 62.8 | 119.0 (83.1, 175.8) | 127.0 ± 60.9 | 0.839 |
| Infection site | ||||
| Lung | 38 (69.1) | 17 (68.0) | 21 (70.0) | 0.873 |
| Bloodstream | 15 (27.3) | 7 (28.0) | 8 (26.7) | 0.912 |
| Abdomen | 4 (7.3) | 1 (4.0) | 3 (10.0) | 0.740 |
| Others | 9 (16.4) | 6 (24.0) | 3 (10.0) | 0.302 |
| Pathogenic bacteria | ||||
| Klebsiella pneumoniae | 22 (40.0) | 10 (40.0) | 12 (40.0) | 1.000 |
| Acinetobacter baumannii | 38 (69.1) | 19 (76.0) | 19 (63.3) | 0.311 |
| Pseudomonas aeruginosa | 2 (3.6) | 1 (4.0) | 1 (3.3) | 1.000 |
| Concomitant nephrotoxic drugs | 16 (29.1) | 6 (24.0) | 10 (33.3) | 0.448 |
| Comorbidities | ||||
| Hypertension | 25 (45.5) | 12 (48.0) | 13 (43.3) | 0.729 |
| Type 2 diabetes | 9 (16.4) | 4 (16.0) | 5 (16.7) | 1.000 |
| Drug concentrations | ||||
| Cmin(B1), μg/ml | 1.9 ± 0.9 | 1.6 ± 0.7 | 2.1 ± 0.9 | 0.017* |
| Cmin(B2), μg/ml | 0.3 ± 0.2 | 0.3 ± 0.1 | 0.4 ± 0.2 | 0.036* |
| C1/2t(B1), μg/ml | 3.0 ± 1.1 | 2.5 ± 0.8 | 3.4 ± 1.1 | 0.001* |
| C1/2t(B2), μg/ml | 0.6 ± 0.2 | 0.5 ± 0.2 | 0.6 ± 0.2 | 0.003* |
| Cmax(B1), μg/ml | 6.3 ± 1.9 | 5.6 ± 1.8 | 6.9 ± 1.9 | 0.013* |
| Cmax(B2), μg/ml | 1.1 (0.9, 1.3) | 1.0 (0.8, 1.2) | 1.1 (1.0, 1.4) | 0.035* |
| Cmin(B), μg/ml | 2.2 ± 1.0 | 1.9 ± 0.8 | 2.5 ± 1.1 | 0.019* |
| C1/2t(B), μg/ml | 3.6 ± 1.3 | 3.0 ± 0.9 | 4.1 ± 1.3 | 0.001* |
| Cmax(B), μg/ml | 7.5 ± 2.3 | 6.6 ± 2.1 | 8.1 ± 2.2 | 0.014* |
| AUC0–24, trapezoidal area, μg · h/ml | ||||
| Based on Cmin(B), C1/2t(B), and Cmax(B) | 99.1 ± 30.8 | 85.4 ± 24.4 | 110.4 ± 31.3 | 0.002* |
| Based on Cmin(B) and Cmax(B) | 115.9 ± 36.0 | 101.9 ± 30.9 | 127.6 ± 36.2 | 0.007* |
| AUC0–24, first‐order pharmacokinetic equation, μg · h/ml | ||||
| Based on Cmin(B) and Cmax(B) | 104.1 ± 34.4 | 90.2 ± 28.4 | 115.7 ± 35.1 | 0.005* |
| Based on C1/2t(B) and Cmax(B) | 91.9 ± 30.1 | 77.7 ± 21.8 | 103.7 ± 31.2 | 0.001* |
| Based on Cmin(B) and C1/2t(B) | 88.1 ± 32.3 | 72.8 ± 21.2 | 100.7 ± 34.8 | 0.001* |
| Outcome | ||||
| 30‐day mortality | 19 (34.5) | 5 (20.0) | 14 (46.7) | 0.038* |
| Adverse events | 0.623 | |||
| Serious adverse events | 14 (25.5) | 4 (16.0) | 10 (33.3) | |
| No serious adverse events | 10 (18.2) | 6 (24.0) | 4 (13.3) | |
Note: Variables are presented as means ± standard deviations, medians (interquartile ranges), or numbers (percentage).
Abbreviations: AKI, acute kidney injury; APACHE II, Acute Physiology and Chronic Health Evaluation II; AUC0–24, area under the concentration–time curve over a 24‐h period; C1/2t, mid‐dosing interval concentration; Cmax, peak concentration; Cmin, trough concentration; PMB, polymyxin B; PMB1, polymyxin B1; PMB2, polymyxin B2; SOFA, Sequential Organ Failure Assessment.
Significant at p < 0.05.
FIGURE 1.

Distribution of Cmin, C1/2t and Cmax in patients. C1/2t, mid‐dosing interval concentration; Cmax, peak concentration; Cmin, trough concentration.
FIGURE 2.

Date and frequency of polymyxin B–induced acute kidney injury.
Univariate analysis
The univariate analysis identified several factors associated with PMB‐induced AKI. The maintenance dose (p = 0.031), white blood cell count (WBC; p = 0.041), and neutrophil% (p = 0.041) differed significantly between the two groups. In addition, all plasma concentrations measured and the AUC estimated by the different methods were significantly higher (p < 0.05) in the AKI group than in the non‐AKI group.
Multivariate analysis
The multivariate logistic regression analysis revealed that WBC count (odds ratio [OR], 1.123; 95% confidence interval [CI], 1.000–1.260; p = 0.050) and AUC (OR, 1.040; 95% CI, 1.013–1.06; p = 0.003), estimated using a first‐order pharmacokinetic equation based on C1/2t and Cmax (AUC1/2t,max), were independent risk factors for AKI (Table 2). According to the results of the multivariate analysis, the final model is presented in Equation 4, and the Hosmer–Lemeshow test indicated that the model had a better fitting degree (p = 0.749).
| (4) |
TABLE 2.
Multivariate analysis to identify risk factors for polymyxin B–induced acute kidney injury.
| Risk factor | OR | 95% CI | p value |
|---|---|---|---|
| White blood cell, 109/L | 1.123 | 1.000–1.260 | 0.0499 |
| AUC0–24, first‐order pharmacokinetic equation, μg·h/ml | |||
| Based on C1/2t(B) and Cmax(B) | 1.040 | 1.013–1.068 | 0.003 |
Abbreviations: AUC0–24, area under the concentration–time curve over a 24‐h period; C1/2t, mid‐dosing interval concentration; Cmax, peak concentration.
ROC curve analysis
The ROC curve analysis (Figure 3a) revealed that the model had acceptable predictability. The area under the ROC curve (AUROC) of the model was 0.805 (95% CI, 0.690–0.921), which was larger than that of the WBC count (AUROC, 0.661; 95% CI, 0.518–0.805) and AUC1/2t,max (AUROC, 0.757; 95% CI, 0.630–0.885). The Youden index was obtained using the coordinates of the ROC curve, and the maximum value corresponded to the cutoff value. The cutoff value of the model was 0.57, with a sensitivity of 70% and a specificity of 80%. Considering that it may be more convenient to collect a single blood sample during clinical operations, we also analyzed the AUROC of PMB concentrations at different timepoints separately. The results revealed an AUROC of C1/2t (0.747) > Cmax (0.675) > Cmin (0.672), indicating that C1/2t had a better performance in predicting AKI than Cmin and Cmax (Figure 3b). The univariate logistic regression analysis further revealed a correlation between the probability of AKI induction and C1/2t (Figure 4). The optimal cutoff value of C1/2t was 3.47 μg/ml (p = 0.002), with a 66.7% sensitivity and a 72% specificity. The probability of AKI was >50% when C1/2t was ≥3.24 mg/L according to Equation 5.
| (5) |
FIGURE 3.
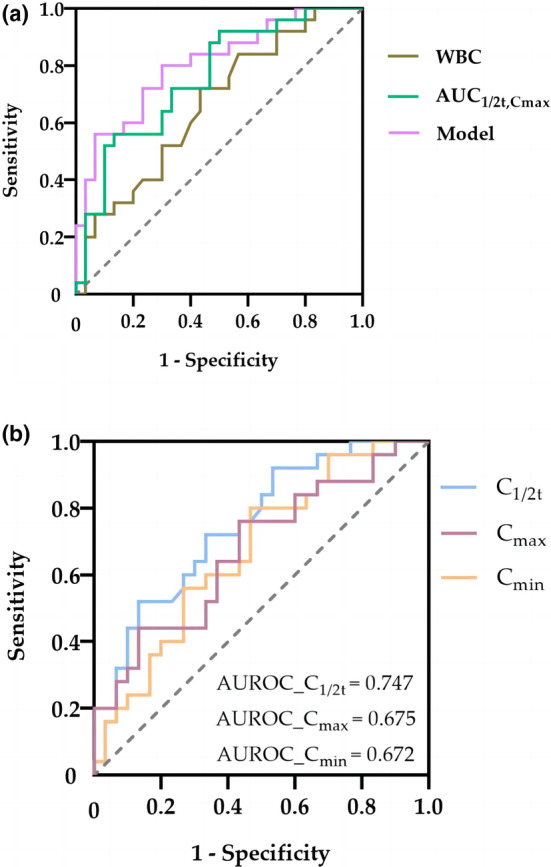
ROC curve of polymyxin B plasma concentrations, the final model, and other factors for predicting AKI. (a) ROC curve of the final model and other factors for predicting AKI. (b) ROC curve of polymyxin B plasma concentrations for predicting AKI. AKI, acute kidney injury; AUC1/2t,max, area under the concentration–time curve estimated using a first‐order pharmacokinetic equation based on C1/2t and Cmax; AUROC, area under the receiver operating characteristic curve; Cmin, trough concentration; C1/2t, mid‐dosing interval concentration; Cmax, peak concentration; ROC, receiver operating characteristic; WBC, white blood cell count.
FIGURE 4.

Univariate logistic regression analysis for the probability of polymyxin B–induced AKI. C1/2t, mid‐dosing interval concentration; AKI, acute kidney injury.
Correlation between AUC and plasma concentration
The Pearson's correlation analysis further revealed a correlation between C1/2t, Cmax, and AUC1/2t,max (Figure 5). Compared with Cmax (r = 0.726), AUC1/2t,max and C1/2t had a higher significant correlation (r = 0.985).
FIGURE 5.

Pearson correlation analysis between the mid‐dosing interval concentration (C1/2t) of polymyxin B, the peak concentration (Cmax) of polymyxin B, and the area under the concentration–time curve (AUC1/2t,max). AUC1/2t,max was estimated using a first‐order pharmacokinetic equation based on C1/2t and Cmax.
DISCUSSION
Currently, PMB‐induced AKI is a major clinical concern. TDM is necessary for the use of PMB, and this study aimed to explore the exposure–AKI cutoff value of PMB to predict AKI. The results indicated WBC count and estimated AUC1/2t,max estimated using a first‐order pharmacokinetic equation were independent risk factors for PMB‐induced AKI. Additionally, C1/2t was strongly correlated with AUC and the threshold of 3.47 μg/ml is an alternative satisfactory choice for predicting AKI.
Several studies have reported the incidence of AKI. Different definitions of AKI and the wide range of PMB doses administered may account for these different results. The incidence of AKI in the current study was 54.5%, which is at the higher end of the aforementioned studies. Great efforts have been made to determine the cause of AKI caused by PMB, and the results have demonstrated that PMB can selectively accumulate in renal proximal convoluted tubule epithelial cells, inducing apoptosis and resulting in decreased kidney function. 26 Additionally, animal studies have revealed that PMB can cause reduced renal blood flow and increased vascular resistance in rats, which may also be related to AKI. 27 The studies on the mechanism of AKI induced by PMB will help guide clinical administration.
The development of AKI during treatment has been reported to be associated with worse prognosis, including higher mortality. 12 We also demonstrated that AKI was significantly associated with 30‐day mortality. A higher incidence of chronic renal failure in patients who develop AKI has been demonstrated in previous studies. 28 Thus, reducing exposure to AKI‐related risk factors is important. The current dosing strategy for PMB is based on the overall weight; however, it may not fully consider the factors affecting drug exposure. The AUC or plasma concentrations may better reflect drug exposure in vivo.
Although TDM is currently recommended for PMB dosing, evidence regarding the association between exposure and PMB‐induced AKI is limited. In the present study, we included plasma concentrations and AUC calculated using the two methods in the analysis. The study indicated that the baseline WBC count and AUC1/2t,max were independent risk factors for AKI development during PMB administration in critically ill patients. WBC count is a known infection indicator, and previous literature has reported that WBC count was positively correlated with the change in renal tubular score. 29 Although WBC count was included in the final multivariable logistic regression model, the univariate analysis demonstrated an AUROC of only 0.661, indicating a relatively low diagnostic value. Previous studies have reported strong associations between AKI and AUC for many antibiotics. D'Amico et al. demonstrated that AUC monitoring had a significant effect on reducing AKI incidence compared with vancomycin trough concentration. 30
Furthermore, our results revealed that more attention should be paid to AUC1/2t,max to reduce AKI in PMB. In addition, the combined predictor based on WBC count and AUC1/2t,max was an excellent predictor of AKI in critically ill patients, with an AUROC of 0.805, which is similar to that of the final models of Han et al. (0.813) and Deng et al. (0.799). 16 , 17 A combined predictor value of >0.57 suggests that the patient was at a higher risk of developing AKI.
In clinical practice, a single sampling strategy is preferred. Therefore, we further analyzed the predictive performance of PMB single plasma concentration in AKI. The univariate analysis revealed that the C1/2t, Cmax, and Cmin were significantly different between the two groups. Among the concentrations at different timepoints, the AUROC of C1/2t (0.747) was close to that of AUC1/2t,max (0.757) and larger than those of Cmin and Cmax, which were lower than 0.7. Another finding of the present study was that C1/2t was strongly correlated with AUC1/2t,max, with r > 0.98. A similar conclusion was drawn by Chen et al., 31 in which the AUROC based on limited sampling concentrations in 42 Chinese patients treated with PMB was evaluated, and blood samples were collected at 0, 1.5, 2, 4, 6, 8, and 12 h after PMB administration. The results indicated that C1/2t was the most accurate predictor of AUC (r 2 = 0.984). 31 Consistently, we identified C1/2t as an important risk factor for PMB‐induced AKI and can be used as an alternative to predict AKI when only one sample can be obtained. Although the current guidelines do not recommend monitoring C1/2t, our results and those of previous clinical studies indicate the importance of C1/2t.
Another important finding of our study was that AKI occurred 3–17 days after PMB administration, and 13.3% of the patients developed AKI on Day 3, which was similar to the results reported by Deng et al. 17 Moreover, a previous study has reported that early AKI is a favorable predictive factor for later AKI. 32 Of the patients, 47% experienced AKI within 7 days, indicating that renal function should be examined at an early stage when using PMB.
This study had several limitations. First, this was a single‐center study, and the number of included patients was limited. Renal insufficiency because PMB administration limited the sample size. Further studies with larger sample sizes should support the robustness of our conclusions. Second, owing to the lack of clinical indicators for patients after the end of treatment, we did not analyze the relationship between PMB exposure and clinical efficacy, which is a direction for future research.
CONCLUSION
Our findings suggest that WBC count and AUC1/2t,max are independent risk factors for PMB‐induced AKI, and the optimal cutoff value of the model was 0.57 to predict AKI. In addition, C1/2t is an important risk factor for PMB‐associated AKI and could be controlled at <3.47 μg/ml during treatment, serving as an alternative to predict AKI.
AUTHOR CONTRIBUTIONS
J.W., Y.L., and S.H. wrote the manuscript. H.Z. and N.Y. designed the research. L.J., J.W., M.W., X.C., and X.L. performed the research. J.W., Y.L., and S.H. analyzed the data.
FUNDING INFORMATION
This project was funded by National Key R&D Program of China (no. 2020YFC2008303), Nanjing Medical Science and Technique Development Foundation (no. YKK17075), and Jiangsu Province Youth Medical Talents Project (no. QNRC2016013).
CONFLICT OF INTEREST STATEMENT
The authors declared no competing interests for this work.
ETHICS STATEMENT
This study was approved by the Ethics Committee of the Drum Tower Hospital affiliated with the Medical School of Nanjing University (no. 2021‐466‐01).
Supporting information
Data S1
Appendix S1
ACKNOWLEDGMENTS
The authors thank all the participants who enthusiastically participated in the research and the Nanjing Drum Tower Hospital's Therapeutic Drug Monitoring Group of the Department of Pharmacy for their great support. We thank Wiley Editing Services for the linguistic editing and proofreading of the manuscript.
Wang J, Li Y, Huang S, et al. Mid‐dosing interval concentration is important for polymyxin B exposure and acute kidney injury in critically ill patients. CPT Pharmacometrics Syst Pharmacol. 2023;12:1911‐1921. doi: 10.1002/psp4.13040
Jing Wang and Yuanchen Li should be considered joint first authors.
Jing Wang and Yuanchen Li contributed equally to this study.
Contributor Information
Na Yang, Email: shillingyang@163.com.
Huaijun Zhu, Email: huaijun.zhu@gmail.com.
REFERENCES
- 1. Srinivas P, Rivard K. Polymyxin resistance in gram‐negative pathogens. Curr Infect Dis Rep. 2017;19:38. [DOI] [PubMed] [Google Scholar]
- 2. Nation RL, Velkov T, Li J. Colistin and polymyxin B: peas in a pod, or chalk and cheese? Clin Infect Dis. 2014;59:88‐94. [DOI] [PMC free article] [PubMed] [Google Scholar]
- 3. Vardakas KZ, Falagas ME. Colistin versus polymyxin B for the treatment of patients with multidrug‐resistant gram‐negative infections: a systematic review and meta‐analysis. Int J Antimicrob Agents. 2017;49:233‐238. [DOI] [PubMed] [Google Scholar]
- 4. Esaian D, Dubrovskaya Y, Phillips M, Papadopoulos J. Effectiveness and tolerability of a polymyxin B dosing protocol. Ann Pharmacother. 2012;46:455‐456. [DOI] [PubMed] [Google Scholar]
- 5. Kubin CJ, Ellman TM, Phadke V, Haynes LJ, Calfee DP, Yin MT. Incidence and predictors of acute kidney injury associated with intravenous polymyxin B therapy. J Infect. 2012;65:80‐87. [DOI] [PubMed] [Google Scholar]
- 6. Oliota AF, Penteado ST, Tonin FS, Fernandez‐Llimos F, Sanches AC. Nephrotoxicity prevalence in patients treated with polymyxins: a systematic review with meta‐analysis of observational studies. Diagn Microbiol Infect Dis. 2019;94:41‐49. [DOI] [PubMed] [Google Scholar]
- 7. Ouderkirk JP, Nord JA, Turett GS, Kislak JW. Polymyxin B nephrotoxicity and efficacy against nosocomial infections caused by multiresistant gram‐negative bacteria. Antimicrob Agents Chemother. 2003;47:2659‐2662. [DOI] [PMC free article] [PubMed] [Google Scholar]
- 8. Chang K, Wang H, Zhao J, et al. Risk factors for polymyxin B‐associated acute kidney injury. Int J Infect Dis. 2022;117:37‐44. [DOI] [PubMed] [Google Scholar]
- 9. Elias LS, Konzen D, Krebs JM, Zavascki AP. The impact of polymyxin B dosage on in‐hospital mortality of patients treated with this antibiotic. J Antimicrob Chemother. 2010;65:2231‐2237. [DOI] [PubMed] [Google Scholar]
- 10. Mendes CA, Cordeiro JA, Burdmann EA. Prevalence and risk factors for acute kidney injury associated with parenteral polymyxin B use. Ann Pharmacother. 2009;43:1948‐1955. [DOI] [PubMed] [Google Scholar]
- 11. Nandha R, Sekhri K, Mandal AK. To study the clinical efficacy and nephrotoxicity along with the risk factors for acute kidney injury associated with parenteral polymyxin B. Indian J Crit Care Med. 2013;17:283‐287. [DOI] [PMC free article] [PubMed] [Google Scholar]
- 12. Rigatto MH, Behle TF, Falci DR, et al. Risk factors for acute kidney injury (AKI) in patients treated with polymyxin B and influence of AKI on mortality: a multicentre prospective cohort study. J Antimicrob Chemother. 2015;70:1552‐1557. [DOI] [PubMed] [Google Scholar]
- 13. Tuon FF, Rigatto MH, Lopes CK, Kamei LK, Rocha JL, Zavascki AP. Risk factors for acute kidney injury in patients treated with polymyxin B or colistin methanesulfonate sodium. Int J Antimicrob Agents. 2014;43:349‐352. [DOI] [PubMed] [Google Scholar]
- 14. Tsuji BT, Pogue JM, Zavascki AP, et al. International consensus guidelines for the optimal use of the polymyxins: endorsed by the American College of Clinical Pharmacy (ACCP), European Society of Clinical Microbiology and Infectious Diseases (ESCMID), Infectious Diseases Society of America (IDSA), International Society for Anti‐infective Pharmacology (ISAP), Society of Critical Care Medicine (SCCM), and Society of Infectious Diseases Pharmacists (SIDP). Pharmacotherapy. 2019;39:10‐39. [DOI] [PMC free article] [PubMed] [Google Scholar]
- 15. Wang P, Zhang Q, Zhu Z, et al. Population pharmacokinetics and limited sampling strategy for therapeutic drug monitoring of polymyxin B in Chinese patients with multidrug‐resistant gram‐negative bacterial infections. Front Pharmacol. 2020;11:829. [DOI] [PMC free article] [PubMed] [Google Scholar]
- 16. Han L, Xu FM, Zhang XS, et al. Trough polymyxin B plasma concentration is an independent risk factor for its nephrotoxicity. Br J Clin Pharmacol. 2022;88(3):1202‐1210. [DOI] [PubMed] [Google Scholar]
- 17. Deng Y, Gu JY, Li X, et al. Does monitoring total and free polymyxin B1 plasma concentrations predict polymyxin B‐induced nephrotoxicity? A retrospective study in critically ill patients. Infect Dis Ther. 2022;11:1591‐1608. [DOI] [PMC free article] [PubMed] [Google Scholar]
- 18. Yang X, Jin L, Luo X, et al. Serum concentration as a predictor of tigecycline‐induced hypofibrinogenemia in critically ill patients: a retrospective cohort study. Int J Infect Dis. 2022;123:136‐142. [DOI] [PubMed] [Google Scholar]
- 19. Bellomo R, Ronco C, Kellum JA, Mehta RL, Palevsky P. Acute renal failure—definition, outcome measures, animal models, fluid therapy and information technology needs the second international consensus conference of the acute dialysis quality initiative (ADQI) group. Crit Care. 2004;8:R204‐R212. [DOI] [PMC free article] [PubMed] [Google Scholar]
- 20. Shields RK, Anand R, Clarke LG, et al. Defining the incidence and risk factors of colistin‐induced acute kidney injury by KDIGO criteria. PloS One. 2017;12(3):e0173286. [DOI] [PMC free article] [PubMed] [Google Scholar]
- 21. Pai MP, Neely M, Rodvold KA, Lodise TP. Innovative approaches to optimizing the delivery of vancomycin in individual patients. Adv Drug Deliv Rev. 2014;77:50‐57. [DOI] [PubMed] [Google Scholar]
- 22. Chen N, Guo J, Xie J, et al. Population pharmacokinetics of polymyxin B: a systematic review. Ann Transl Med. 2022;10(4):231. [DOI] [PMC free article] [PubMed] [Google Scholar]
- 23. Fagerland MW, Hosmer DW, Bofin AM. Multinomial goodness‐of‐fit tests for logistic regression models. Stat Med. 2008;27(21):4238‐4253. [DOI] [PubMed] [Google Scholar]
- 24. Hosmer DW, Lemeshow S. Applied Logistic Regression. 2nd ed. John Wiley and Sons; 2000. [Google Scholar]
- 25. Perkins NJ, Schisterman EF. The Youden index and the optimal cut‐point corrected for measurement error. Biom J. 2005;47(4):428‐441. [DOI] [PubMed] [Google Scholar]
- 26. Abdelraouf K, Chang KT, Yin T, Hu M, Tam VH. Uptake of polymyxin B into renal cells. Antimicrob Agents Chemother. 2014;58:4200‐4202. [DOI] [PMC free article] [PubMed] [Google Scholar]
- 27. Vattimo Mde F, Watanabe M, da Fonseca CD, et al. Polymyxin B nephrotoxicity: from organ to cell damage. PloS One. 2016;11:e0161057. [DOI] [PMC free article] [PubMed] [Google Scholar]
- 28. Gomes EC, Falci DR, Bergo P, Zavascki AP, Rigatto MH. Impact of polymyxin‐B‐associated acute kidney injury in 1‐year mortality and renal function recovery. Int J Antimicrob Agents. 2018;52:86‐89. [DOI] [PubMed] [Google Scholar]
- 29. Dong W, Feng Z, Li L, et al. The role of white blood cells in acute renal ischemia‐reperfusion injury. J Luzou Med College. 1995;18:87‐90. [Google Scholar]
- 30. D'Amico H, Wallace KL, Burgess D, et al. Acute kidney injury associated with area under the curve versus trough monitoring of vancomycin in obese patients. Antimicrob Agents Chemother. 2022;66:e0088621. [DOI] [PMC free article] [PubMed] [Google Scholar]
- 31. Chen W, Liu H, Wang Q, et al. Estimation of the area under the concentration‐time curve of polymyxin B based on limited sampling concentrations in Chinese patients with severe pneumonia. Eur J Clin Pharmacol. 2021;77(1):95‐105. [DOI] [PubMed] [Google Scholar]
- 32. Zeng H, Zeng Z, Kong X, et al. Effectiveness and nephrotoxicity of intravenous polymyxin B in Chinese patients with MDR and XDR nosocomial pneumonia. Front Pharmacol. 2020;11:57. [DOI] [PMC free article] [PubMed] [Google Scholar]
Associated Data
This section collects any data citations, data availability statements, or supplementary materials included in this article.
Supplementary Materials
Data S1
Appendix S1