

Abstract
α-Phosphoglucomutase (αPGM), in its phosphorylated state, catalyzes the interconversion of α-D-glucose 1-phosphate and α-D-glucose 6-phosphate. The αPGM of Lactococcus lactis is a type C2B member of the haloalkanoic acid dehalogenase (HAD) enzyme family, and is comprised of a Rossmann-fold catalytic domain and inserted α/β-fold cap domain. The active site is formed at the domain-domain interface. Herein, we report the results from a kinetic-based study of L. lactis αPGM catalysis which demonstrate enzyme activation by auto-catalyzed phosphorylation of Asp8 with αG1P, the intermediacy of αG1,6bisP in the phospho Ll-αPGM-catalyzed conversion of αG1P to G6P, and the reorientation of the αG1,6bisP intermediate via dissociation to solvent and rebinding. In order to provide insight into the structural determinants of L. lactis αPGM substrate recognition and catalysis, metal cofactor and substrate specificities were determined as were the contributions made by active-site residues towards catalytic efficiency. Lastly, the structure and catalytic mechanism of L. lactis αPGM are compared with those of HAD family phosphomutases L. lactis β-phosphoglucomutase and eukayotic α-phosphomannomutase to provide insight into the evolution of phosphohexomutases from HAD family phosphatases.
Keywords: phosphomannomutase, glucose phosphate, mannose phosphate, substrate recognition, domain association
Graphical Abstract

Introduction
α-Phosphoglucomutase (αPGM), in its phosphosphorylated state, catalyzes the interconversion of α-D-glucose 1-phosphate (αG1P) and D-glucose 6-phosphate (G6P) (Scheme 1). In plants and animals, αPGM functions in energy metabolism and in the synthesis and utilization of starch and glycogen.1, 2 In bacteria, αPGM is also required for the synthesis of glucose-containing polysaccharides used in the formation of the cellular envelope and biofilm.3–6
Scheme 1.

The chemical reaction catalyzed by αPGM and the related pathways.
Whereas the eukaryotic phosphoglucomutase is specific for αG1P/G6P, the mutase of bacteria can also catalyze the interconversion of α-D-mannose 1-phosphate (αM1P) and D-mannose 6-phosphate (M6P) and, therefore, is named αPGM/αPMM.7, 8 In eukaryotes, a second mutase, α-phosphomannomutase (αPMM), is employed in the synthesis of the mannose-containing glycan units of glycoproteins and glycolipids.9–11 Eukaryotic αPGM12 belongs to the α-D-phosphohexomutase enzyme family13,14, as does the αPGM/αPMM of Pseudomonas aeruginosa (Pa-αPGM/αPMM)15. These enzymes are comprised of four structural domains, circularly arranged with the active-site at the center (see Figure 1A). The eukaryote αPMM, on the other hand, is a member of the type C2B clade of the haloalkanoic acid dehalogenase (HAD) enzyme family.16, 17 X-ray crystallographic structural analyses have shown that αPMM is comprised of a conserved Rossmann-fold catalytic domain and an inserted α/β-fold cap domain.18, 19 The domains are connected by two solvated linkers and are therefore mobile. The structure of the αPMM from Leishmania mexicana (Lm-αPMM)19 is depicted in the domain-domain associated and disassociated conformations displayed in Figure 1B to illustrate the location of the active site at the domain-domain interface and the conformational cycling that takes place in a single catalytic turnover. Whereas catalysis takes place from the domain-domain associated state, substrate binding and product release requires opening of the active-site to solvent via domain-domain disassociation.
Figure 1. X-ray crystal structures of representative hexose phosphate mutases.
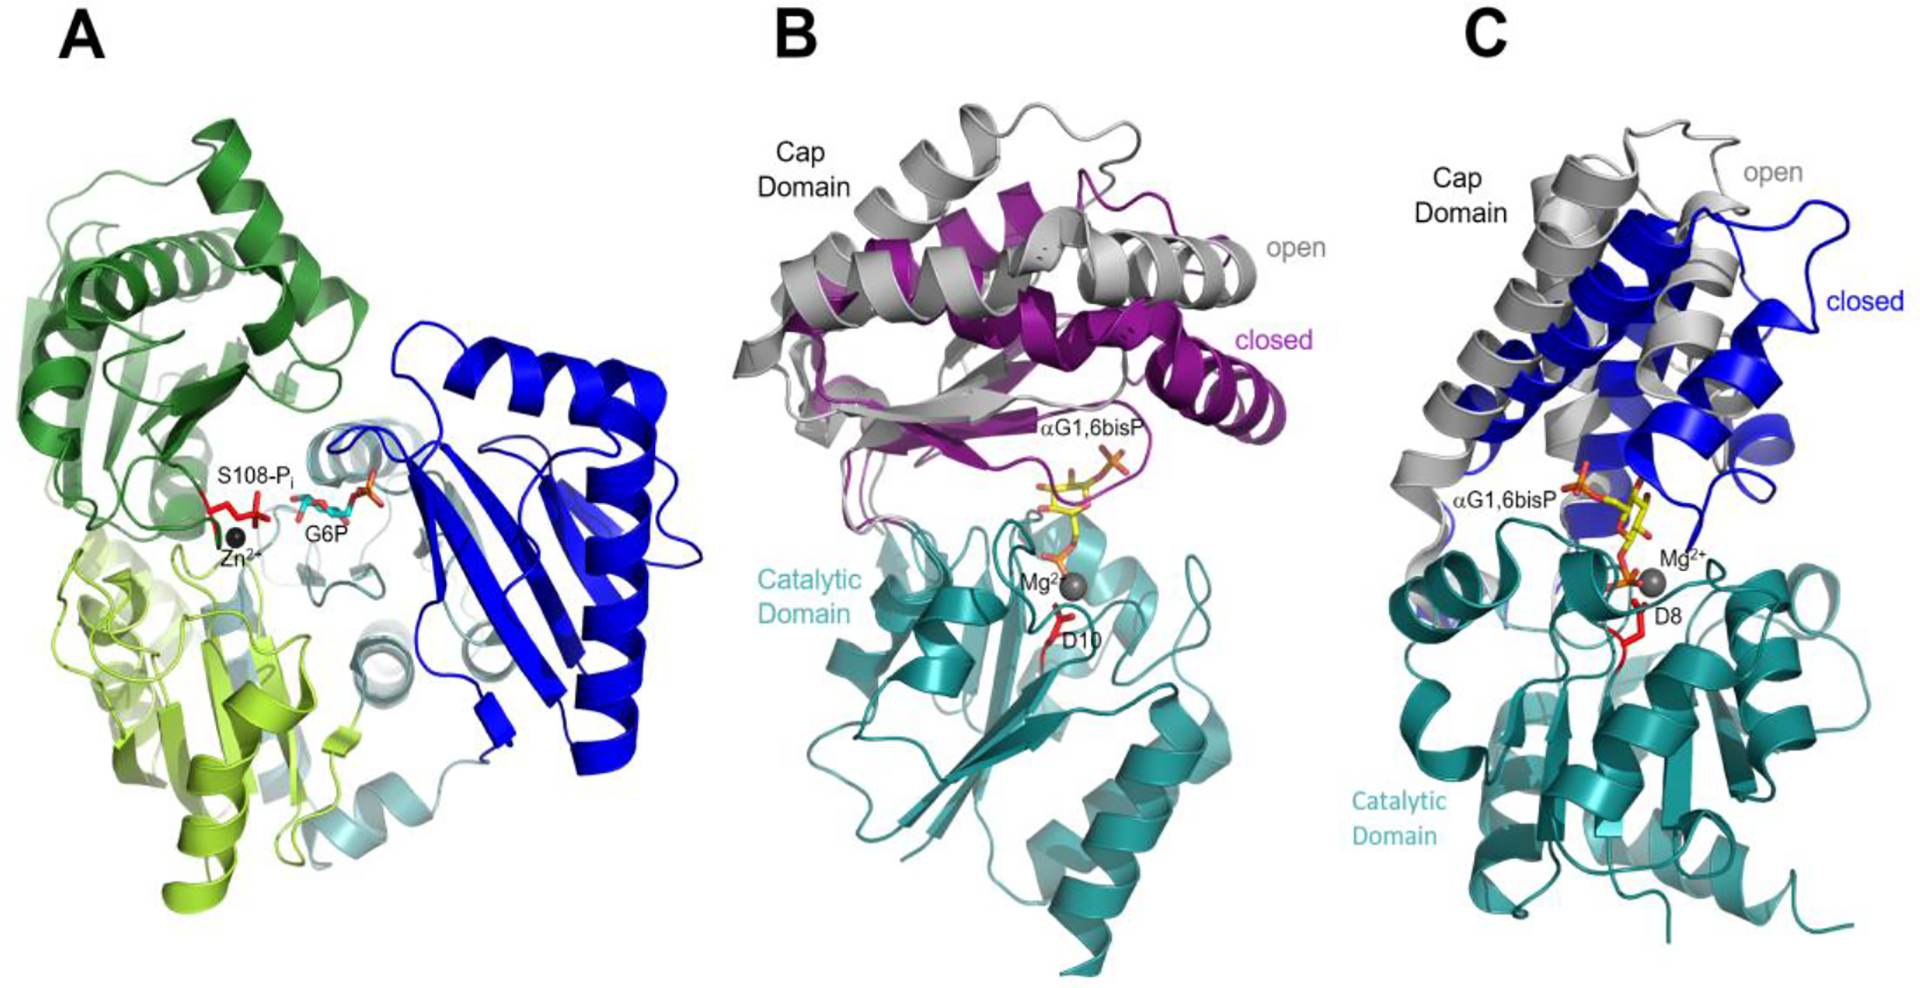
(A) Phosphohexomutase family αPGM/αPMM from Pseudomonas aeruginosa (PDB accession code 1P5G) where the four domains are colored separately, the phosphorylated Ser108 and Zn2+ are shown in red stick and black sphere, respectively, and the G6P ligand is shown in cyan stick (red oxygen, cyan carbon and orange phosphorus). (B) Overlay of the HAD family type C2B Lm-αPMM structures (PDB accession codes 2I55, chains a and b), in which the catalytic domain is colored teal and cap domain of the active-site open conformer is colored gray whereas that of the active-site closed conformer is colored purple. The Asp nucleophile D10 is shown in red stick, the αG1,6bisP ligand in stick with red oxygen, yellow carbon and orange phosphorus, and the Mg2+ cofactor in charcoal sphere. (C) Overlay of the HAD family type C1 Ll-βPGM structures (PDB accession codes 1LVH and 1O08) where the cap domain of the open conformer is colored gray and that of the closed conformer is colored blue. The Asp8 nucleophile, αG1,6bisP ligand and Mg2+ cofactor are represented as in (B).
The bacterium Lactococcus lactis, known for its commercial use in the production of fermented milk products20, is unique in that it encodes two different phosphoglucomutases21, 22, both of which belong to the HAD enzyme family23, 24. One these enzymes, β-phosphoglucomutase (βPGM), catalyzes the conversion of the β-anomer of D-glucose 1-phosphate (βG1P) to G6P.21 The βG1P is derived from phosphorolytic cleavage of the disaccharides maltose and trehalose.25 In an earlier effort, we showed that the L. lactis βPGM (Ll-βPGM) is a type C1 HAD family member.23 The type C1 cap domain differs from the type C2B cap domain in its fold (α-helix bundle vs α/β) and in the site of insertion into the catalytic domain.17 The structure of the Ll-βPGM is depicted in the domain-domain associated vs dissociated conformations provided in Figure 1C. The other L. lactis phosphoglucomutase, Ll-αPGM, supports D-glucose-α−1-uridyldiphosphate synthesis and hence, cell wall biogenesis.22 Unlike Ll-βPGM, but the same as αPMM, Ll-αPGM is a type C2B HAD family member. The recently reported X-ray crystal structure of Ll-αPGM in complex with crystallization reagents glycerol and sulfate24 reveals only the domain-domain associated conformation (Figure 2). However, the cycling of Ll-αPGM between this conformation and the domain-domain disassociated conformation can be inferred from the reported X-ray crystallographic structures of its structural homolog Lm-αPMM represented in Figure 1B.19
Figure 2. Illustration of the locations of the proximal and distal substrate binding sites in Ll-αPGM and the roles of the catalytic residues.

(A) The structure of the Ll-αPGM•glycerol•sulfate complex (PDB accession code 4BND) in the domain-domain associated conformation. The cap domain is colored gray and catalytic domain teal, the glycerol and sulfate ligands are shown in stick (coloring: red oxygen, yellow carbon, orange sulfur) as are the residues of the distal site located in the cap domain (coloring: gray carbon, red oxygen, blue nitrogen) and the catalytic residues of motifs 1–4 (coloring: nucleophile Asp8 red, acid/base Asp10 magenta, the electrophiles Lys 189 blue and Ser41 green, and the Mg2+ ligand Asp212 silver). (B) Schematic depiction of the Ll-αPGM residues that form the four-motif catalytic platform conserved among HAD family phosphotransferases using the color scheme of Figure 2A. Phosphorylated (cyan) D8 (red), the Mg2+ (black) cofactor and the αG1P substrate (cyan) are included. The hydrogen bonds are shown using narrow dashed lines and the coordination bonds to Mg2+ are depicted using wide dashed lines (not all coordination bonds are shown).
Based on the mechanisms of action of eukaryotic αPGM26, bacterial αPGM/αPMM27, and Ll-βPGM28, we presumed that the chemical sequence for catalysis by Ll-αPGM would be initiated by phosphoryl-group transfer from the phosphorylated active-site nucleophile to the substrate to form αG1,6bisP as the reaction intermediate. The active-site nucleophile of the enzymes of the phosphohexomutase family is a serine residue14 (Figure 1A) whereas the nucleophile of the enzymes of the HAD family is an aspartate residue29,30 (Figure 2). In order to form product, and to regenerate the phosphoenzyme, the αG1,6bisP intermediate must first become reoriented in the active site, which allows the phosphoryl group originating from the substrate to be transferred to the active site nucleophile. As depicted by cartoon in Figure 3, the substrate phosphoryl group is bound by the cap domain at a location termed the “distal site” whereas phosphoryl-group transfer from the aspartylphosphate residue occurs at the “proximal site” of the catalytic domain. The locations of the two sites in HAD family mutases Lm-αPMM and Ll-βPGM are revealed by the X-ray crystallographic structures of the respective αG1,6bisP complexes shown in Figures 1B and 1C.23, 24 The corresponding locations of these two sites in Ll-αPGM are identified in Figure 2A.
Figure 3. A depiction of the Ll-αPGM catalytic cycle.

In the catalytically active state “EP”, the proximal site (yellow shading) Asp8 nucleophile is phosphorylated. The αG1P phosphoryl group is bound at the distal site located on the cap-domain (cyan shading). Phosphoryl-group transfer occurs in the active-site closed conformer and results in the formation of the αG1,6bisP intermediate. The intermediate must change orientation prior to phosphoryl-group transfer to Asp8 and product formation. Shown by the work reported herein, reorientation in Ll-αPGM occurs by dissociation of the intermediate from the active-site into solvent, followed by rebinding.
The residues of the catalytic domain responsible for mediating phosphoryl-group transfer are highly conserved among HAD family phosphotransferases whereas the residues of the cap domain responsible for substrate recognition are variable. The catalytic domain houses four structural motifs, which form the catalytic platform consisting of an Asp nucleophile and Asp general acid/base in motif 1, a Thr/Ser electrophile in motif 2, a Lys in motif 3, and an Asp ligand to the Mg2+ cofactor in motif 4.30 These residues are identified in the Ll-αPGM structure shown in Figure 2A and their assumed roles in catalysis are depicted in Figure 2B. Residues of the cap domain that form the distal substrate binding site are also highlighted in Figure 2A. By binding to both domains, the substrate stabilizes the enzyme in the catalytically active domain-domain associated conformation.
The overall goal of our research program is to gain insight into the process by which the HAD family mutases have evolved from ancestral phosphatases to catalyze intramolecular phosphoryl-group transfer. Herein, the results from a kinetic-based analysis of Ll-αPGM catalysis, which examined substrate recognition, metal-ion activation, enzyme activation by phosphorylation, and the mechanism of αG1,6bisP reorientation are reported. In addition, we compare and contrast the structural determinants and mechanisms of substrate recognition and catalysis operative in the type C2B HAD family Ll-αPGM, with those of the type C1A HAD family Ll-βPGM, the type C2B HAD family αPMM and the α-D-phosphohexomutase family αPGM/αPMM.
MATERIALS and METHODS
General.
αM1P, αG1P, αG1,6bisP, [14C]-αG1P (49.3 mCi/mmol), [14C]-G6P; (231 mCi/mmol), maltose, phosphoenol pyruvate (PEP), adenosine 5’-triphosphate (ATP), adenosine 5’-diphosphate (ADP), β-nicotinamide (NAD), β-adenine dinucleotide phosphate (NADP), buffers, metal ions, column chromatography materials and growth media were purchased from Sigma-Aldrich. Fructose 6-phosphate kinase type VII from Bacillus stearothermophilus, pyruvate kinase type III from rabbit muscle, L-lactate dehydrogenase type XI from rabbit muscle, glucose 6-phosphate dehydrogenase type IX from Baker’s yeast (G6PD), phosphoglucose isomerase from E. coli and phosphomannose isomerase from E. coli were also purchased from Sigma-Aldrich. Plasmid DNA was prepared using the QIAprep Spin Miniprep Kit from QIAGEN, while sequencing and mutagenesis primers were purchased from Life Technology. Enzymes for DNA manipulation were purchased from Promega or New England Biolabs and used with the supplied buffers. E. coli BL21 (DE3) competent cells and the pET 3a expression vector were purchased from Novagen. Ni-NTA columns were obtained from QIAGEN and the PiBlue™ phosphate assay kit was purchased from BioAssay Systems. Recombinant L. lactis βPGM23 and maltose phosphorylase21 were prepared according to published procedures. 31P-NMR spectra were recorded at ambient temperature using a Bruker Avance 500 spectrometer. Protein MALDI mass spectra were measured at the University of New Mexico Mass Spectrometry Facility.
Syntheses of the Hexose 1,6-bisphosphates.
The protocols used for the synthesis of β-D-glucose 1,6-bisphosphate (βG1,6bisP), α-D-mannose 1,6-bisphosphate (αM1,6bisP) and [14C]-αG1,6bisP are reported in Supporting Information.
Purification of the Recombinant Ll-αPGM.
Nde I/BamH I restriction sites were introduced at the 5’ and 3’ termini of the L. lactis αPGM gene (UniProtKB accession code Q9CHZ8) by PCR using genomic DNA as template and the oligonucleotides (5’ to 3’)GTTATAATGTAAGCGTTCATATGAAAAAAATAGGAGA and (5’ to 3’)GCTTCGGTTGGAACGCGGATCCCATCAACAACGTGTG as the N-terminus (+) and C-terminus (−) primers. The resulting PCR product was digested with Nde I and BamH I, and after purification, the desired DNA fragment was ligated to a Nde I/BamH I-linearized pET3a vector. The resulting clone (pET3a-αpgm) was used to transform competent E. coli. BL21(DE3) cells. The cells were grown at 37 °C overnight on a LB-Agar plate containing 50 μM ampicillin. The plasmid DNA of one well-isolated colony was extracted, purified and then shown to contain the desired gene by DNA sequencing (Center for Genetics in Medicine, University of New Mexico School of Medicine). The confirmed clone was then used as a source for expression of recombinant Ll-αPGM. Accordingly, transformed cells were grown at 25 °C in LB media for 6–7 h with mixing at 250 rpm and then used to inoculate 2 L × 3 LB medium containing 50 mg/L ampicillin. The cell culture was incubated at 25 °C to an OD600nm of ~0.7 before the addition isopropyl β-D-1-thiogalactopyranoside (0.4 mM). Following continued growth at 25 °C to an OD600nm ~1.5, the cells were harvested by centrifugation. Twenty grams of wet cells were obtained from a 6 L culture. The cell pellet was suspended in buffer A (50 mM HEPES containing 5 mM MgCl2 and 1 mM dithiothreitol at pH 7.5 and 4 °C) and then passed through a French Pressure cell press at 1500 psi. The supernatant, obtained by centrifugation of the cell-free mixture, was loaded onto a DEAE-Sepharose column (4.5 × 60 cm) equilibrated with buffer A, and then eluted using a 2 L linear gradient of KCl (0–0.6 M) in buffer A at 4 °C. Fractions containing Ll-αPGM, as judged by SDS-PAGE analysis, eluted at ~0.3 M KCl. These were combined, concentrated with an Amicon protein concentrator, and then loaded onto a phenyl Sepharose column (2.5 × 20 cm) equilibrated with 15% ammonium sulfate in buffer A. The column was eluted with buffer A with 5% ammonium sulfate at 4 °C. The homogeneity of the Ll-αPGM-containing fractions was examined by SDS-PAGE chromatography. Fractions judged to be >95% pure were combined and then concentrated to 50 mg/mL. Yield: 10 mg protein per 1 g of cell paste.
Purification of the Recombinant L. lactis femD.
The protocol used for gene cloning, recombinant protein preparation and αG1,6bisP synthase activity testing is reported in Supporting Information.
Determination of the Equilibrium Constant of the αG1P Reaction.
The reaction solution initially containing 0.1 μM Ll-αPGM, 20 μM [14C]-αG1P, 0.2 μM αG1,6bisP, 10 mM MgCl2 and 50 mM HEPES (pH 7.0, 25 °C) was monitored until equilibrium was reached. Aliquots were removed at varying conversion times, combined with 1 M NaOH and the resulting mixtures were passed through a 5-kD filter to remove enzyme. The filtered samples were then subjected to chromatography by using an HPLC equipped with a CarboPAc PA1 Dionex (4 mm × 250 mm) column. The column was eluted at flow rate of 1 mL/min, first with 2 mL of solvent A (54 mM NaOH and 100 mM sodium acetate), then with a linear gradient (15 mL) of solvent A to 53.7% solvent B (75 mM NaOH and 500 mM sodium acetate), and finally with solvent B. The observed retention times are 5 min for αG1P, 15 min for G6P and 30 min for αG1,6bisP. The eluent fractions (1 mL) were collected and their respective 14C-content was determined by liquid scintillation counting. The Keq value was calculated from the ratio of [14C]-G6P to [14C]-αG1P.
Determination of αPGM Steady-State Kinetic Constants.
All kinetic assays were carried out at 25 °C in 50 mM HEPES (pH 7.0) containing 5 mM MgCl2, unless stated otherwise. The formation of G6P was monitored spectrophotometrically by measuring the increase in solution absorbance at 340 nm (Δε = 6.2 mM−1cm−1) resulting from the G6PD-catalyzed reduction of NADP. Ll-αPGM-catalyzed conversion of αM1P to M6P was tested by including phosphomannose isomerase (5 unit/mL) and phosphoglucose isomerase (5 unit/mL) in the assay solution. A typical α-G1P to D-G6P conversion reaction was carried out by adding a specified volume of Ll-αPGM stock solution to a 1 mL assay solution containing αG1P, αG1,6bisP, 5 mM MgCl2, 0.2 mM NADP, 5 units/mL G6PD and 50 mM HEPES (pH 7.0, 25 °C). The initial velocities measured as a function of αG1P concentration were fitted to eq 1, whereas those measured at varied αG1P and activator (αG1,6bisP or αM1,6bisP) concentration (0.5 to 5Km) were fitted to eq 2 where [A] is the αG1P concentration, [B] is the αG1,6bisP (or αM1,6bisP) concentration, V0 is the initial velocity, Vm is the maximum velocity, KA is the Michaelis constant for αG1P, and KB is the Michaelis constant for αG1,6bisP (or αM1,6bisP). kcat was calculated from the ratio of Vmax to the enzyme concentration
| (1) |
| (2) |
pH Rate Profile Determination.
Ll-αPGM steady-state kcat and kcat/Km values were measured as a function of reaction solution pH to define the apparent pKa values of ionizing residues. Data were fitted to eq 3, where Y is kcat or kcat/KM, C is a pH independent value of kcat or kcat/KM, [H+] is the proton concentration, Ka and Kb are the respective apparent ionization constants of essential acid and base residues.
| (3) |
Assay solutions contained a specific amount of Ll-αPGM, αG1P at varying concentration (0.5 to 5 Km), 100 μM αG1,6bisP, 10 mM MgCl2, 200 μM NADP and 5 unit/mL G6PD in buffer at 25 °C. The reaction solutions were buffered at pH 4.5–5.5 with 50 mM acetic acid plus 50 mM 2-(N-morpholino)ethanesulfonic acid (MES), pH 5.5–8.0 with 50 mM HEPES and 50 mM MES, pH 8.0–9.0 with 50 mM HEPES and 50 mM [tris(hydroxymethyl)methylamino]propanesulfonic acid (TAPS), and pH 9.0–9.5 with 50 mM TAPS and 50 mM N-cyclohexyl-3-aminopropanesulfonic acid (CAPSO). Control experiments were carried-out by pre-incubating the enzyme in the respective buffers and then assaying its activity at pH 7.0.
Metal-Ion Activation and Inhibition of Ll-αPGM.
Activation:
Metal-free Ll-αPGM was prepared by dialysis at 4 °C against four changes of 50 mM HEPES (pH 7.0) containing 20 mM EDTA and 1 mM DTT and then against 50 mM HEPES (pH 7.0) containing 1 mM DTT. This procedure removed ~90% of the Ll-αPGM activity, the remaining 10% activity is attributed to the presence of metal ions in the assay solution introduced as contaminants in the reagents. Full catalytic activity was restored to the metal-free Ll-αPGM by inclusion of Mg2+ in the assay solution. The initial velocity of G6P formation was measured as a function of MgCl2, NiCl2, CoCl2, MnCl2, ZnCl2 or LiCl concentration using freshly prepared, metal-free Ll-αPGM, in 1 mL assay solutions containing 50 μM αG1P, 100 μM αG1,6-bisP, 200 μM NADP and 5 unit/mL G6PD in 50 mM HEPES (pH 7.0, 25 °C). The initial velocity data were analyzed by fitting to eq 1, in which [A] is the metal ion concentration, KA is the metal ion activation constant, Vo is the initial velocity and Vm is the maximal velocity. In the case of Zn2+, which showed activation at low concentration and inhibition at high concentration, the initial velocity data measured at low ZnCl2 concentration (2–20 μM) were fitted to eq 1 the data measured at high ZnCl2 concentration (50–600 μM) were analyzed by using eq 4 (vide infra).
Ca2+ Inhibition:
Reaction solutions contained 0.004 μM (metal-free) Ll-αPGM, 10–200 μM MgCl2, 100 μM αG1P, 100 μM αG1,6bisP, 200 μM NADP, 5 unit/mL G6PD, and 0, 10, 20, 40, or 80 μM CaCl2 in 50 mM HEPES (pH 7.0, 25°C). The initial velocity data were fitted to eq 4 where [S] is the αG1P concentration, [I] is the metal cofactor concentration, V0 is the initial velocity, Vmax is the maximum velocity, Km is the Michaelis constant and Ki is the inhibition constant.
| (4) |
Kinetic Analysis of Tungstate Inhibition.
The 1 mL assay solutions contained 0.008 μM Ll-αPGM, αG1P at varying concentration (20–100 μM), 100 μM αG1,6-bisP, 5 mM MgCl2, 200 μM NADP, 5 unit/mL G6PD, and 0, 2, 5 or 10 mM tungstate in 50 mM HEPES (pH 7.0, 25 °C). The initial velocity data were fitted to eq 5 where [S] is the αG1P concentration, [I] is the tungstate concentration, V0 is the initial velocity, Vmax is the maximum velocity, Km is the Michaelis constant and Ki is the inhibition constant.
| (5) |
Spectrophotometric Assay for α-G1,6bisP and G6P Hydrolysis Reactions.
αG1,6bisP hydrolysis.
Reaction solutions initially contained 2 μM Ll-αPGM, 50 μM αG1,6bisP 5 mM MgCl2, in 50 mM HEPES (pH 7.0 and 25 °C) with and without inclusion of 5 unit/mL G6PD and 200 μM NADP. After varying incubation periods, 150 μL aliquots were removed and mixed with 300 μL of PiBlue phosphate assay reagent. The resulting mixture was incubated for 30 min at room temperature before measuring the measure absorbance at 620 nm (ε = 28.4 mM−1cm−1).
G6P hydrolysis.
Reaction solutions initially contained 1 mM Ll-αPGM or Ll-βPGM, 2.5 mM G6P and 5 mM MgCl2 in 50 mM HEPES (pH 7.0, 25 °C). Following specific incubation periods, 10 μL aliquots were removed and mixed with 40 μL of 0.2 M HCl, and then assayed for G6P content using 500 μL of 200 mM NADP and 5 unit/mL G6PD in 50 mM HEPES (pH 7.0 and 25 °C).
31P-NMR Analysis of Ll-αPGM-Catalyzed Reactions.
Reaction solutions initially contained 1 mM Ll-αPGM and 5 mM αG1P, αM1P, αG1,6bisP or αM1,6bisP in 50 mM HEPES (pH 7.0 and 25 °C) containing 5 mM MgCl2. 31P-NMR spectra were measured at 202 MHz after specific incubation periods, using phosphoric acid as the chemical-shift standard.
Transient Kinetic Analysis of Ll-αPGM-catalyzed Single-turnover Reactions.
The time courses for the Ll-αPGM-catalyzed single-turnover reactions were measured using a KinTek rapid-mixing chemical-quench apparatus in conjunction with radiolabelled reactant ([14C]-αG1P or [14C]-αG1,6bisP), HPLC-based separation and scintillation counter-based radiolabel measurement. The single-turnover reaction of [14C]-αG1,6bisP was carried out by mixing a 13 μL solution containing 100 μM Ll-αPGM, 2 mM MgCl2 and 50 mM HEPES (pH 7.0) with a 14 μL solution containing 25 μM [14C]-αG1,6bisP, 2 mM MgCl2 and 50 mM HEPES (pH 7.0). The single-turnover reaction of [14C]-αG1P was carried out by mixing a 13 μL solution containing 40 μM Ll-αPGM, 2 mM MgCl2 and 50 mM HEPES (pH 7.0) with a 14 μL solution containing 10 μM [14C]-αG1P and 10 μM αG1,6bisP, 2 mM MgCl2 and 50 mM HEPES (pH 7.0). The reactions were quenched after specified periods of time with 193 μL 1 M NaOH (if the reaction time was shorter than 75 ms, then additional 1 M NaOH was added to adjust the total volume of the reagent to 193 μL). The resulting mixtures were passed through a 5 kDa filter to remove the enzyme and chromatographed on a HPLC equipped with a CarboPAc PA1 Dionex (4 mm × 250 mm) column. The elution program and product analysis used are the same as those described in the section for determination of the solution equilibrium constant (vide supra). The observed rate constants for the single-turnover reactions were obtained by curve simulation using KINSIM32 and by fitting to eq 6 or eq 7 where k is the first-order rate constant, [P]t and [S]t are the product and substrate concentrations at time “ t ”, [S]max is the initial concentration of substrate and [P]max is the product concentration at equilibrium..
| (6) |
| (7) |
RESULTS and DISCUSSION
Biochemical and Biophysical Properties of Ll-αPGM.
Homogeneous, recombinant Ll-αPGM was prepared in a yield of 10 mg per g of cell paste. The SDS-PAGE gel of the purified enzyme is shown in Figure S1A. The enzyme was stable to storage in buffered stock solution for 12 h at room temperature and for 1 month at −80 °C. Mass spectral analysis defined the subunit molecular mass to be 28,277 Da, in close agreement with the theoretical mass of 28,276 Da.
Because there exists a convenient coupled assay for G6P (G6PD-catalyzed reduction of NADP), and G6P formation from αG1P is thermodynamically favored, Ll-αPGM catalysis was studied in the αG1P to G6P direction. The steady-state kinetic constants for Ll-αPGM-catalyzed conversion of αG1P to G6P in solution with 5 mM MgCl2, 50 μM αG1,6bisP and 50 mM HEPES (pH 7.0, 25 °C), are kcat = 44 ± 1 s−1, Km = 39 ± 3 μM and kcat/Km = 1.1 × 10⁶ M−1s−1. The equilibrium constant for Ll-αPGM-catalyzed conversion of αG1P to G6P, in 50 mM HEPES (pH 7.0, 25 °C) containing 0.2 μM αG1,6bisP and 10 mM MgCl2, was determined to be 13 (the time course is shown in Figure S2). We note here that although it is the G6P α-anomer that is formed on the enzyme, once released into solution, it will undergo rapid conversion to the β-anomer (half-life ~1.5 s) to reach an equilibrium ratio of α:β = 4:6.33 Herein, no distinction is made between the G6P anomers and, thus, the term “G6P” represents one or both anomers.
Hydrogen Ion and Metal Ion Dependency of Ll-aPGM Catalytic Efficiency.
pH Rate Profiles:
The variation in Ll-αPGM turnover rate with reaction solution pH, measured at saturating substrate concentration, is defined by the kcat profile. The kcat/Km profile defines the variation in catalytic efficiency measured at sub-saturating substrate. The observed bell-shaped curves of the log(kcat) and log(kcat/Km) vs pH plots (Figure 4) define an optimal pH range for catalysis centered at pH 7, which was used as the reaction solution pH for the experiments reported herein. The apparent pKa values obtained by data fitting are pKa = 5.6 ± 0.6 and pKb = 8.6 ± 0.1 in the case of the kcat profile and pKa = 5.0 ± 0.6 and pKb = 7.4 ± 0.1 in the case of the kcat/Km profile. No attempt was made to assign these values to specific residues, owing to the multiplicity of reaction steps and ionizing groups associated with the catalytic cycle.
Figure 4. Log plots of the steady-state kcat (•)and kcat/Km (◆) values measured as a function of reaction solution pH for Ll-αPGM-catalyzed conversion αG1P to G6P.

Reaction mixtures contained varying concentrations of αG1P (0.5–10Km), 100 μM αG1,6-bisP, 0.2 mM NADP, 5 unit/mL G6PD, 10 mM MgCl2 and 100 mM buffer at 25 °C.
Metal Ion Specificity:
HAD family phosphomutases and phosphatases require a divalent metal ion to serve as cofactor in catalysis, a role filled in vivo by Mg2+. X-ray crystallographic structures of HAD family phosphotransferases have shown that the cofactor binding sites are largely conserved.34 Although the structure of Ll-αPGM24 was determined in the absence of bound Mg2+, the residues that form the binding site can be inferred from the superimposed structure of the homolog Homo sapien-αPMM isozyme 1 (Hs-αPMM1)18 shown in Figure 5. In Hs-αPMM1, a six-coordinate, octahedral Mg2+ geometry is formed through coordination bonds to the carboxylate group of the Asp nucleophile D19, the main chain carbonyl oxygen atom of the downstream Asp acid/base D21, the carbonyl oxygen of the N218 side chain and three water molecules. E219, N225 and D226 form hydrogen bonds with two of the water ligands, leaving the third water ligand free to exchange with the transferring phosphoryl group. The superimposed structures shown in Figure 5 indicate that Hs-αPMM1 D19 and D21 are conserved in Ll-αPGM as D8 and D10 and that N225 and D226 are conserved as N219 and D220. On the other hand, N218 and E219 in Hs-αPMM1 are replaced by D212 and M213 in Ll-αPGM. Although two of the Mg2+-binding site residues are not conserved, the net charges of the respective binding sites are the same.
Figure 5. Stereoview of the superposition of the Mg2+ binding site residues in Hs-αPMM1 with the corresponding residues in Ll-αPGM.

The Mg2+ cofactor is shown in charcoal sphere, the water molecules in red sphere, and the bonding enzyme residues in stick with carbon atoms colored gray (Hs-αPMM1) or teal (Ll-αPGM), oxygen atoms red, nitrogen atoms blue and the sulfur atom yellow. The Mg2+ coordination bonds are represented by charcoal dashed lines and the hydrogen bonds between water ligands and active-site residues are represented by yellow dashed lines.
The binding affinity of Mg2+ towards Ll-αPGM was examined by measuring the initial velocity of the conversion of αG1P to G6P as a function of Mg2+ concentration. αG1,6bisP was included in the assay to activate the metal-free enzyme by D8 phosphorylation. The plot of initial velocity vs [Mg2+] is shown in Figure S3A and the steady-state kinetic constants derived from the initial velocity data are reported in Table 1. The Mg2+ Kactivation = 29 μM.
Table 1. Steady-state kinetic constants kcat and Kactivation for Ll-αPGM metal ion activation and/or Kinhibition for Ll-αPGM metal ion inhibition.
Reaction solutions contained metal-free Ll-αPGM, metal ion activator/inhibitor at varying concentration, 50 μM αG1P, 100 μM αG1,6bisP, 200 μM NADP, 5 unit/mL G6P dehydrogenase and 50 mM HEPES (pH 7.0; 25°C). Reaction solutions used in the determination of the Ca2+ inhibition also contained 20–200 μM MgCl2. See the experimental section for details.
| Metal ion | kcat (s−1) | Kactivation (μM) | Ki (μM) |
|---|---|---|---|
| Mg2+ | 23.7 ± 0.4 | 29 ± 0.4 | ------- |
| Ni2+ | 19.7 ± 0.5 | 13.3 ± 0.4 | ------- |
| Co2+ | 24.9 ± 0.3 | 5.1 ± 0.3 | ------- |
| Zn2+ | 11.7 ± 0.1 | 1.8 ± 0.1 | ~200 |
| Mn2+ | < 10−5 | ------ | NDa |
| Ca2+ | < 10−5 | ------ | 9.8 ± 0.4 |
| Li+ | < 10−5 |
ND is an abbreviation for “not determined”.
Metal-ion binding sites that are formed by clustered carboxylate residues are known to discriminate between monovalent and divalent metal ions, yet they are less discriminatory between Mg2+ and other divalent metal ions.35, 36 Neves et al22 reported that the inclusion of 5 mM Li+, Zn2+, Ca2+, Ni2+ or Mn2+ in assay solutions containing 50 μM Mg2+ did not increase Ll-αPGM activity. We too discovered that Li+ does not activate Ll-αPGM by showing that the addition of LiCl2 to the assay solution does not restore activity to the Mg2+-free enzyme. Of the divalent metal ions tested using Mg2+-free Ll-αPGM, Co2+, Ni2+, and Zn2+ showed activation but Mn2+ and Ca2+ did not (see Table 1). The kcat values determined for Co2+ (25 s−1), Ni2+ (20 s−1), Zn2+ (12 s−1) and Mg2+ (24 s−1)-activated Ll-αPGM are similar. The Kactivation values measured for Co2+ (5 μM), Ni2+ (13 μM) and Zn2+ (2 μM) reflect slightly higher binding affinities for these divalent metal ions than is observed for Mg2+ (Kactivation = 29 μM). However, the comparatively high concentration of Mg2+ in the cell (~1 mM)37, 38 supports Mg2+ in the role of physiological cofactor.
An interesting observation made during the measurement Zn2+ activation, is that at higher concentrations, Zn2+ inhibits Ll-αPGM catalysis (Figure S3B). However, the affinity for the secondary binding site is too low (Ki ~200 μM) relative to the concentration of uncomplexed Zn2+ in the cell (picomolar)39 for the inhibition to take place under physiological conditions.
Ca2+ displayed linear competitive inhibition vs Mg2+ with a Ki = 9 μM (Figure S3C, Table 1) by competing with the Mg2+ for binding at the cofactor site. Unlike Mg2+, Ca2+ binds to clustered carboxylate residues by forming seven-coordinate complexes in which bidentate coordination of a carboxylate ligand occurs.35 Indeed, this coordination geometry has been previously observed in the Ca2+ complex of the HAD family phosphoserine phosphatase wherein the bidentate coordination to the Asp nucleophile blocks its function.40 However, owing to the predominance of cellular Mg2+, inhibition by Ca2+ does not occur in vivo.40
The Ll-αPGM Catalytic Cycle.
The Ll-αPGM catalytic cycle displayed in Figure 3 begins with the binding of αG1P to the active site of the phosphoenzyme, and is then followed by phosphoryl-group transfer to the substrate C(6)OH to generate αG1,6bisP as the reaction intermediate. In order to form product, αG1,6bisP must first reorient in the active site to place the C(1)-phosphoryl group at the proximal site of the catalytic domain and the C(6)-phosphoryl group at the distal site of the cap domain (Figure 3). Phosphoryl-group transfer from the reoriented αG1,6bisP to the Asp nucleophile D8 forms the product G6P while regenerating the phosphoenzyme. The work described in this section was performed to probe the steps of this cycle.
Steady-state Kinetic Mechanism.
We began our investigation of the catalytic cycle by determining the steady-state kinetic mechanism of Ll-αPGM catalysis. This was accomplished by measuring the variation in the initial velocity of G6P formation as a function of αG1,6bisP and αG1P concentrations. The data obtained, represented by the parallel double reciprocal plot shown in Figure 6A, support a Bi Bi ping-pong mechanism in which αG1,6bisP binds to the dephosphoenzyme and αG1P binds to the phosphoenzyme. The kinetic constants were defined as: αG1,6bisP Km = 12 ± 0.7 μM, αG1P Km = 45 ± 3 μM and kcat = 133 ± 3 s−1. The Michaelis constants are indicators of the concentrations of αG1,6bisP and αG1P required for half maximal reaction velocity. Substrate inhibition was not observed, indicating that αG1P binding to the dephosphoenzyme is not significant in the presence of αG1,6bisP. The tighter binding of αG1,6bisP indicates that both phosphoryl groups make a significant contribution to the binding energy. Consistent with this conjecture, we observed that the phosphate analog, tungstate, is an uncompetitive inhibitor vs αG1P with a Ki = 4.3 ± 0.2 mM (see Figure 6B), indicative of the formation of the dead-end complex E•αG1P•tungstate in which both the proximal and distal phosphoryl-group binding sites are occupied.
Figure 6. Plots of steady-state kinetic data measured for Ll-αPGM activation and inhibition.

(A) Double reciprocal plot of the steady-state initial velocity of (0.002 μM) Ll-αPGM-catalyzed formation of G6P from αG1P at varying concentration (20–200 μM), and in the presence of αG1,6bisP at varying concentration ((○)20, (■)50, and (□) 100 μM). (B) Double reciprocal plot of the steady-state initial velocity of (0.008 μM) Ll-αPGM-catalyzed formation of G6P from αG1P at varying concentration (20–100 μM), and in the presence of tungstate at varying concentration ((●) 0, (■) 2, (□) 5 and (○) 10 mM). The reaction solutions also contained 100 μM αG1,6bisP, 5 mM MgCl2, 0.2 mM NADP, 5 unit/mL G6PD and 50 mM HEPES at pH 7.0 and 25 °C.
Cellular Ll-αPGM Activation:
To enter the catalytic cycle, Ll-αPGM must be phosphorylated. αG1,6bisP is typically included in the in vitro activity assays to serve as the phosphoryl-group donor. However, in order for αG1,6bisP to function in the role of Ll-αPGM activator in L. lactis, it must be biosynthesized in situ. In higher organisms, αG1,6bisP is generated from the reaction of 1,3-diphosphoglycerate with αG1P or G6P, catalyzed by αG1,6bisP synthase.41 A search of the L. lactis genome for the encoding gene was carried out by using the human αG1,6bisP synthase sequence as query. The homolog femD, which shares 36% sequence identity with the synthase, was identified as a candidate of interest. To pursue this lead, we cloned and expressed the L. lactis femD gene in E. coli and isolated the recombinant protein. The SDS-PAGE gel of the purified protein (Figure S1B) indicates a subunit mass of 50 kDa, consistent with the theoretical mass of 50635 Da. femD was tested as a catalyst of the phosphorylation of G6P and αG1P in the presence of 1,3-diphosphoglycerate and Mg2+ at pH 7.0. However, the formation of αG1,6bisP was not detected (kcat < 1 × 10⁻⁴ s−1). Even though the possibility of an undiscovered biosynthetic pathway to αG1,6bisP remained, a more probable alternative was considered, namely that Ll-αPGM is activated via auto-catalytic phosphoryl-group transfer from its substrate.
Accordingly, 31P-NMR techniques were used to test Ll-αPGM activation by αG1P. The reaction solution initially contained 5 mM αG1P, 1 mM Ll-αPGM and 5 mM MgCl2 in 50 mM HEPES (pH 7.0, 25 °C). The 31P-NMR spectrum measured immediately after mixing contained only one signal (4.5 ppm), which was that derived from G6P (Figure S4A). The efficiency of G6P formation was then determined, by using steady-state kinetic methods, to define kcat = 23.1 ± 0.6 s−1, αG1P Km = 600 ± 50 μM and kcat/Km = 3.8 × 10⁴ M−1s−1. For comparison, the kinetic constants determined for the conversion of αG1P to G6P in the presence of 50 μM αG1,6bisP are kcat = 44 ± 1 s−1, αG1P Km = 39 ± 3 μM and kcat/Km = 1.1 × 10⁶ M−1s−1. Although less efficient than αG1,6bisP, αG1P can serve as a phosphoryl-group donor to Ll-αPGM. We posit that once the phosphoenzyme is formed, it binds a second αG1P and phosphorylates it to form αG1,6bisP, and through this process Ll-αPGM enters the catalytic cycle.
Reaction Intermediate:
To demonstrate the intermediacy of αG1,6bisP, the single-turnover reaction of 20 μM Ll-αPGM with 10 μM αG1,6bisP and 5 μM [14C]-αG1P was carried-out. We anticipated that the unlabeled αG1,6bisP would be converted to phosphoenzyme and (unlabeled) G6P plus αG1P. Although ~10 μM dephosphoenzyme remains in solution, it is not expected to effectively compete with the phosphoenzyme for reaction with [14C]-αG1P. The time courses for the consumption of [14C]-αG1P and the formation of [14C]-G6P are shown in Figure 7A, along with the time course for the formation and consumption of [14C]-αG1,6bisP. [14C]-αG1,6bisP forms during the first 20 ms of the reaction, in parallel with formation of [14C]-G6P. Whereas the [14C]-G6P continues to accumulate over the next 300 ms, the amount of [14C]-αG1,6bisP peaks at ~10%, and then slowly decreases as a αG1,6bisP: αG1P: G6P equilibrium distribution of 1: 8: 41 is reached. The rate of formation of E•αG1,6bisP occurs at 63 s−1, matching the rate of 60 s−1 at which it transitions to the EP•G6P complex.
Figure 7. Pre-steady state time courses measured for Ll-αPGM catalysis which illustrate the intermediacy of αG1,6bisP and its efficiency as a phosphoryl group donor to Asp10.

(A) Time course for the Ll-αPGM-catalyzed (20 μM) single-turnover reaction 5 μM [14C]-αG1P in the presence of 10 μM αG1,6bisP in 50 mM HEPES containing 5 mM MgCl2 at pH 7.0 and 25 °C. Key: [14C]-αG1P (□), [14C]-αG1,6bisP (●) and [14C]-G6P (◆).(B) Time course for the Ll-αPGM-catalyzed (50 μM) single turnover reaction of [14C]-αG1,6bisP (12.5 μM) in 50 mM HEPES containing 5 mM MgCl2 at pH 7.0 and 25 °C. Key: [14C]-αG1,6bisP (●), [14C]-G6P (◆), and [14C]-αG1P (□).
Having demonstrated that the E•αG1,6bisP complex is a kinetically competent intermediate in the Ll-αPGM catalytic cycle, we next examined the product distribution resulting from the reaction of αG1,6bisP with the dephosphoenzyme. Accordingly, the time courses for formation of [14C]-αG1P and [14C]-G6P were determined for a single-turnover reaction of 12.5 μM [14C]-αG1,6bisP and 50 μM Ll-αPGM (Figure 7B). [14C]-αG1,6bisP was converted to [14C]-αG1P and [14C]-G6P at a rate of 115 s−1. The reaction rate measured at 100 μM Ll-αPGM is the same as that measured at 50 μM Ll-αPGM (the time courses are reported in Fig S5) and therefore, it is assumed that the phosphoryl-group transfer step, rather than the αG1,6bisP-binding step, is rate limiting. EP•αG1P and EP•G6P form within the first 20 ms at the respective rates of 100 s−1 and 40 s−1. Over the ensuing 200 ms the EP•αG1P converts to E•αG1,6bisP and hence to EP•αG6P, to reach an equilibrium ratio of αG1,6bisP: αG1P: G6P equal to 1:20:90.
Reorientation of the αG1,6bisP Intermediate:
Next, we carried out kinetic experiments to determine the mechanism by which the αG1,6bisP intermediate undergoes reorientation in the active site that is required for product formation. The two models considered are illustrated in Figure 3. In one model, the αG1,6bisP changes orientation by “flipping” while remaining associated with the enzyme. In the other model, the αG1,6bisP diffuses from the open active site into solvent, and then rebinds in the opposite orientation. In order to distinguish between these two models, we used radiolabeled substrate, [14C]-αG1P, to test for exchange of the radiolabeled intermediate [14C]-αG1,6bisP formed on the enzyme, with unlabeled αG1,6bisP present in the solvent.
In the first experiment, a single-turnover reaction of excess phosphoenzyme with 5 μM [14C]-αG1P was carried out in the presence of 5 μM unlabeled 5 αG1,6bisP in order to trap the [14C]-αG1,6bisP released from enzyme via dilution. The time courses measured for the reaction of 20 μM Ll-αPGM, 25 μM αG1,6bisP, and 5 μM [14C]-αG1P are shown in Figure 8A. Data analysis showed that roughly half of the radiolabel is diverted from the [14C]-G6P fraction to the αG1,6bisP fraction, consistent with the mixing of the ~5 μM [14C]-αG1,6bisP formed in the active site with the ~5 μM unlabeled αG1,6bisP in the solvent. The second experiment was carried out under multiple-turnover reaction conditions adapted from those used to test solvent exchange of the αG1,6bisP intermediate formed in the catalytic cycling of Pa-αPGM/αPMM.27 For this purpose, 5 μM Ll-αPGM was used to catalyze the equilibration of the radiolabel contained in 50 μM [14C]-αG1P with 500 μM αG1,6bisP and 500 μM G6P. The maximum amount of enzyme-bound [14C]-αG1,6bisP that can be formed is this reaction is limited to 5 μM. The large excess of unlabeled αG1,6bisP and G6P in solution results in the dilution of the [14C]-αG1,6bisP and [14C]-αG6P released from the enzyme. We note that the rate of equilibration, reflected by the time courses shown in Figure 8B, is slower than that predicted based on the initial velocity and transient kinetic determinations reported above, because αG1,6bisP and G6P sequester Ll-αPGM as the respective E•αG1,6bisP and EP•G6P complexes, which in turn inhibits the formation of the EP•αG1P complex. Nevertheless, the release of [14C]-αG1,6bisP from the enzyme to solvent is apparent. Specifically, the radiolabel is almost equally partitioned between solvent αG1,6bisP and G6P. This result is in stark contrast to that observed for Pa-αPGM/αPMM in which αG1,6bisP reorientation takes place on the enzyme within the interdomain space (see Figure 1A).27, 42
Figure 8. Time courses for Ll-αPGM-catalysis which illustrate the equilibration of the αG1,6bisP intermediate with solvent.

(A) Time course for the single-turnover reaction of 20 μM Ll-αPGM, 25 μM αG1,6bisP, and 5 μM [14C]-αG1P in 50 mM HEPES (pH 7.0, 25 °C) containing 5 mM MgCl2. Key: (□)[14C]-αG1P, (●)[14C]-αG1,6bisP and (◆)[14C]-G6P. The time courses were fitted with a first order rate equation to define the relative rates of formation kobs = 71 ± 2 s−1 for [14C]-αG1,6bis6P and kobs = 8.5 ± 0.3 s−1 for [14C]-αG6P (B) Time course for the multiple-turnover reaction of 5 μM Ll-αPGM, 500 μM G6P, 500 μM αG1,6bisP, and 50 μM [14C]-αG1P in 50 mM HEPES (pH 7.0, 25 °C) containing 5 mM MgCl2. Key: (○)[14C]-αG1P, (Δ)[14C]-αG1,6bisP and (□)[14C]-G6P.
In conclusion, our findings show that the reorientation of the αG1,6bisP intermediate that must occur during the catalytic cycling of Ll-αPGM, proceeds via the αG1,6bisP dissociation-rebinding pathway represented in Figure 3. The reorientation does not occur within the active site nor does it occur within the space encapsulated by the subunits of the biological homodimer as was first proposed by Nogly et al24.
Substrate Specificity.
Mutase vs Phosphatase Activity:
The HAD family phosphoglucomutases and phosphatases share a common catalytic scaffold and chemical mechanism. However, the mutases have evolved to suppress the hydrolysis of the phosphoenzyme intermediate, thus allowing phosphoryl transfer to the substrate to take place rather than phosphoryl-group transfer to solvent water. For the purpose of determining the extent to which phospho-Ll-αPGM suppresses phosphoryl-group transfer to water, Ll-αPGM (2 μM) was reacted with αG1,6bisP (50 μM) in the presence of G6PD and NADP to remove G6P formed as product. The rate of formation of inorganic phosphate (Pi) was monitored to define a turnover rate of 8.0 × 10⁻³ s−1 (Figure 9). This rate is 8,000-fold slower than the rate of phosphoenzyme-catalyzed phosphoryl-group transfer to αG1P (63 s−1).
Figure 9. Determination of the rate of Ll-αPGM-catalyzed phosphate ester hydrolysis in αG1,6bisP.

The time course for orthophosphate (Pi) formation during the incubation of 2 μM Ll-αPGM with 50 μM αG1,6bisP in 50 mM HEPES buffer (pH 7.0, 25°C) containing 5 mM MgCl2, 0.2 mM NADP and 5 unit/mL G6PD (●) is compared with that measured in the absence of NADP and G6PD (□), and with that measured in the absence of Ll-αPGM (◇).
Next, we determined the rate of Ll-αPGM-catalyzed hydrolysis of G6P. Accordingly, the time course for G6P hydrolysis was measured for the reaction of 1 mM Ll-αPGM with 2.5 mM G6P in 50 mM HEPES (pH 7.0, 25 °C) containing 5 mM MgCl2 (see Figure S6). The same reaction was carried-out using Ll-βPGM in place of the Ll-αPGM, so that the phosphatase activities of the two mutases could be compared (Figure S6). The Ll-αPGM turnover rate was calculated to be 8.3 × 10⁻⁵ s−1, which is 20-fold slower than the Ll-βPGM turnover rate of 1.7 × 10⁻³ s−1. In addition, the G6P phosphatase activity of Ll-αPGM is 100-fold lower than its αG1P phosphatase activity (8.0 × 10⁻³ s−1).
Stereospecificity:
The stereospecificity of Ll-αPGM catalysis was examined by comparing the relative substrate activities of αG1P, its anomer βG1P, and its C(2) epimer αM1P. Reaction solutions initially containing 5 μM αPGM, 100 μM αM1P or βG1P, 100 μM αG1,6bisP and 5 mM MgCl2 in 50 mM HEPES (pH 7.0, 25 °C) were monitored for 1 h. During this period, neither βG1P or αM1P was converted to product. Therefore, the turnover rate of these stereoisomers must be <1 × 10⁻⁵ s−1. These results indicate that the phosphoenzyme is unable to catalyze the phosphorylation of the C(6)hydroxyl groups of αM1P and βG1P to form intermediate, and/or that the dephosphoenzyme is unable to catalyze the transfer of the C(1)phosphoryl group from the respective αM1,6bisP and βG1,6bisP intermediates to D8 to form M6P and G6P.
To determine which of the two partial reactions is blocked in the pathways for Ll-αPGM catalysis towards the stereoisomers, we first tested βG1,6bisP and αM1,6bisP as phosphoryl-group donors in activation of Ll-αPGM for catalysis of G6P formation from αG1P. A side-by-side comparison of the time courses for reactions in which 20 μM αG1,6bisP, 100 μM βG1,6bisP or 100 μM αM1,6bisP are present, revealed that βG1,6bisP and αM1,6bisP are less efficient activators than αG1,6bisP, as shown by the observed lag periods in the approach to steady-state (Figure S7).
Next, steady-state kinetic analysis of Ll-αPGM catalysis was carried-out using αG1P as substrate and αM1,6bisP as activator. The double-reciprocal plot of initial velocity vs αG1P concentration at varied αM1,6bisP concentration is parallel (Figure S8). Data fitting defined the αM1,6bisP Km = 75 ± 4 μM, αG1P Km = 88 ± 4 μM and kcat = 29.0 ± 0.8 s−1. Compared to αG1,6bisP (kcat/Km = 1 × 10⁷ M−1s−1), αM1,6bisP (kcat/Km = 4 × 10⁵ M−1s−1) is 30-fold less efficient.
Because αM1P is not a substrate, it follows that αM1,6bisP activates Ll-αPGM by transfer of the phosphoryl group from the C(6) position and not from the C(1) position. In order to validate this conjecture, we used 31P-NMR techniques to monitor the reaction between 5 mM αM1,6-bisP and 1 mM Ll-αPGM in 50 mM HEPES (pH 7.0, 25 °C) containing 5 mM MgCl2. The results show that within 1 h, all αM1,6-bisP had been converted to an equal mixture of αM1P and Pi (Figure S9A). Incubation of 5 mM αM1P with 1 mM Ll-αPGM, under the same conditions, did not result in the transformation αM1P to M6P (Figure S9B). In contrast to αM1,6-bisP, incubation of 5 mM αG1,6-bisP and 1 mM Ll-αPGM in 50 mM HEPES (pH 7.0, 25 °C) containing 5 mM MgCl2, resulted in the conversion of ~20% (~1 mM) of the αG1,6-bisP to the product (G6P) plus Pi derived from its hydrolysis. After 9 h, all αG1,6-bisP had been converted to G6P plus Pi, and after 24 h only Pi remained (Figure S4B).
Taken together, these findings demonstrate that the Ll-αPGM catalyzes the transfer of both phosphoryl groups from αG1,6-bisP to D8, but only the C(6)phosphoryl group from αM1,6bisP. We speculate that the same holds true for βG1,6-bisP and thus, that Ll-αPGM displays relaxed stereospecificity at the distal phosphoryl group binding site in the cap domain but not at the proximal site in the catalytic domain (Figure 2A). In this manner, substrate specificity mirrors that of the HAD family phosphatases, wherein the cap domain displays broad specificity towards the structure of the substrate-leaving group (i.e., the displaced alcohol moiety).30 In comparison, the steric and electrostatic demands of productive binding at the proximal site are stringent. At the proximal site of Ll-αPGM, the transferring phosphoryl group must be properly oriented with respect to the Asp nucleophile D8, the Asp acid/base D10 as well as the Mg2+ cofactor and the electrophilic residues K189 and S41 (Figure 2). We note that Nogly et al24 proposed that a steric clash between the C(2)OH of αM1P and the catalytic domain residue Q43 (shown below in Figure 10) prevents catalytic turnover.
Figure 10. The X-ray structure of the Ll-αPGM/glycerol/sulfate complex (PDB accession code 4BND) in which substrate binding and domain-domain binding residues are identified.

Key: stick coloring is oxygen red, nitrogen blue, carbon teal for motif 1–4 catalytic residues, grey for cap domain ligand binding residues, green for the putative domain-domain binding residues. Glycerol carbon atoms are colored yellow, the sulfate sulfur atom orange. The water molecule is depicted in red sphere. Hydrogen bonds are shown as dashed lines.
Structural Determinants of Substrate Recognition.
The residues that participate in substrate binding and domain-domain association were first identified by X-ray crystallographic structure analysis of Ll-αPGM in complex with glycerol and sulfate ligands.24 In the present study, the contributions of these residues to catalytic efficiency were determined by using site-directed mutagenesis coupled with kinetic analysis of the mutant enzymes. Nogly et al24 proposed that the sulfate ligand is bound in the same region to which the substrate phosphoryl group binds, and that the glycerol ligand is bound in the same region to which the substrate glucose moiety binds. The polar residues that are within hydrogen bond distance of the sulfate and glycerol ligands are identified in the active site structure shown in Figure 10.
The hairpin turn that connects the β8 and β9 strands in the cap domain stands out as an important structural element of the distal phosphoryl-group binding site. The main-chain amide NHs of the turn residues T177, T178 and T179 form an aza crown-like binding motif augmented by the side chain hydroxyl groups, which project into the pocket and form hydrogen bonds with the sulfate ligand. Examination of the Ll-αPGM homologs sharing 36% or greater sequence identity revealed that whereas T178 is stringently conserved, T177 and T179 are conservatively substituted with Ser. Replacement of T179 via site-directed mutagenesis resulted in a 16-fold decrease in the kcat value and a 90-fold decrease in the kcat/Km value (Table 2).
Table 2. Steady-state kinetic constants of Ll-αPGM site-directed mutants.
Reaction solutions contained αG1P at varying concentration (0.5–5 fold Km), 50 μM αG1,6bisP, 5 mM MgCl2, 5 unit/mL G6PD, 200 μM NADP and 50 mM HEPES (pH 7.0, 25 °C).
| Ll-αPGM | kcat (s−1) | Km (μM) | kcat /Km (M−1 s−1) |
Fold-decrease kcat |
Fold-decrease kcat /Km |
|---|---|---|---|---|---|
| wt | 4.4 (± 0.1) × 101 | 39 ± 3 | 1.1 × 10⁶ | ---------- | ------- |
| K17A | 2.7 (± 0.1) × 10−3 | 43 ± 2 | 6.2 × 101 | 1.6 × 10⁴ | 2 × 10⁴ |
| K146A | 2.9 (± 0.1) × 10−3 | 54 ± 5 | 5.4 × 101 | 1.5 × 10⁴ | 2 × 10⁴ |
| R128H | 6.0 (± 0.1) × 10−3 | 51 ± 3 | 1.2 × 10² | 7.3 × 10³ | 1 × 10⁴ |
| N181A | 1.22 ±0.04 | 83 ± 7 | 1.5 × 10⁴ | 3.6 × 101 | 7 × 101 |
| Q139L | 1.7 (±0.2) × 10−1 | 118 ± 4 | 1.4 × 10³ | 2.6 × 10² | 8 × 10² |
| T179L | 2.73 ± 0.03 | 203 ± 6 | 1.3 × 10⁴ | 1.6 × 101 | 9 × 101 |
| Q51L | 6.7 ± 0.2 | 44 ± 5 | 1.5 × 10⁵ | 7 | 7 |
The sulfate ligand of the Ll-αPGM complex also binds to the side chain of the residue K146 (β7-loop) in the cap domain. This residue, in turn, forms a hydrogen bond with the main chain carbonyl oxygen atom of the conserved catalytic domain residue P16 (see Figure 10). Replacement of K146 reduced the kcat 1.5 × 10⁴ –fold and the kcat/Km 2 × 10⁴–fold (Table 2).
The glycerol ligand of the Ll-αPGM complex forms hydrogen bonds to the side chains of residues R128 (β6-turn-β7) and N181 (β9) in the cap domain. N181 is conserved only among αPGMs of the genera Lactococcus. An aspartate residue is observed at this position in all other αPGMs examined. Replacement of N181 by site-directed mutagenesis resulted in a 36-fold decrease in kcat and a 70-fold decrease in kcat/Km (Table 2).
R128 engages in an intricate hydrogen-bond network, in which it bridges the glycerol ligand, the cap domain residue Q139, and the catalytic domain residue Q43. Q43, in turn, forms a hydrogen bond with the carboxyl group of D10, while Q139 forms hydrogen bonds to the conserved cap domain residue S135 and catalytic domain (C1 loop) residue K17. Residues R128, Q139 and K17 are stringently conserved, and their respective contributions to Ll-αPGM catalytic efficiency are large. Specifically, replacement of R128 reduced the kcat 7.3 × 10³–fold and the kcat/Km 1 × 10⁴–fold, replacement of Q139 reduced the kcat 2.6 × 10²–fold and the kcat/Km 8 × 10²–fold, and replacement of K17 reduced the kcat 1.6 × 10⁴–fold and the kcat/Km 2 × 10⁴–fold (Table 2).
As observed in the structure of Ll-αPGM•glycerol•sulfate complex (chain B of the crystallographic dimer)24, D10 appears to be orientated for general acid/base catalysis via hydrogen bond formation with the side chains of Q43 and N51 and with the main-chain amide NH of K17 (Figure 11A). However, it is evident from the structure of the Ll-αPGM•sulfate complex (chain A of the crystallographic dimer) in which the glycerol ligand is absent, that the D10 is not oriented for catalysis and it no longer forms hydrogen bonds to Q51 and K17 (Figure 11A). Whereas replacement of Q51 does not impact catalysis significantly, the replacement of K17 dramatically impairs catalysis (Table 2).
Figure 11. X-ray structures depicting the conformations of the aspartate acid/base observed in Ll-αPGM and in Ll-βPGM, and the substrate binding and domain-domain binding residues of Lm-αPMM and Hs-αPMM1.

(A) Ll-αPGM (PDB entry code 4BND) chain A (carbon, green) with sulfate bound (sulfur, black) and chain B (carbon, gray) with sulfate (sulfur, orange) and bound glycerol (carbon, yellow). Oxygen is colored red and nitrogen blue. (B) Ll-βPGM in the domain-domain associated conformation (PDB accession code 1O08) (carbon, blue) with αG1,6bisP (carbon, yellow and phosphorus, orange) and domain-domain dissociated conformation (PDB accession code 1LVH) (carbon, gray) with D8 phosphorylated (phosphorus, black). The Mg2+ is represented by a charcoal sphere and the oxygen and nitrogen atoms are colored red and blue, respectively. (C) Lm-αPMM•Mg2+•αG1,6bisP complex (PDB accession code 2I55, chain b). Key: stick coloring is oxygen red, nitrogen blue, carbon teal for catalytic domain residues (stick) and grey for cap domain residues (stick). The αG1,6bisP carbon atoms are colored yellow, the phosphorus orange and the Mg2+ is depicted in charcoal sphere. (D) Hs-αPMM1•Mg2+•αM1P complex (PDB accession code 2FUE). Key: same as in (C) except the αM1P carbon atoms are colored yellow and water molecules are shown as red spheres. Hydrogen bonds and coordination bonds are represented using dashed lines.
The potential significance of conformational flexibility in the Ll-αPGM D10 side chain is suggested by the critical role that the side chain flexibility of D10 in Ll-βPGM43 plays in coupling substrate binding to domain-domain association and general acid/base catalysis. The Ll-βPGM D10 side chain is oriented away from the reaction center through hydrogen bonding with the domain-domain hinge-linker residue T16 (see Figure 11B). The T16 side chain is released to abstract a proton from the substrate upon domain-domain association. In this manner, hydrolysis of the D10 acylphosphate group of the phosphorylated Ll-βPGM is suppressed.43 However, because D10 in Ll-αPGM is not located near the domain-domain linkers a different mechanism for suppression of hydrolysis of the phosphorylated enzyme must be operative. Substrate binding in Ll-αPGM is followed by domain-domain association, which in turn is facilitated by hydrogen bonding between the interdomain partners R128-Q43, Q139-K17, K146-P16 and V174-N21 and by hydrogen bonding between substrate and cap domain residues N181, T176, T177, T178 and R128 and catalytic domain residue D10. If domain-domain association or D10 side chain orientation is controlled by the substrate, catalyzed hydrolysis of the D8 acylphosphate group can be avoided.
Divergence of Function Among HAD Family Type C2B Mutases.
In order to gain insight into the evolution of mutase activity within the HAD type C2B clade, the structural determinants of substrate recognition described for Ll-αPGM were compared with those of eukaryote αPMM. The structures of the Lm-αPMM•αG1,6bisP complex19 (Figure 11C) and the Hs-αPMM1•αM1P complex18 (Figure 11D) were used for this purpose. The αPMM counterpart to the cap domain β8-turn-β9 sulfate-binding motif in Ll-αPGM contributes to the distal phosphoryl group-binding site, even though the residues that form the motif are not conserved. Specifically, T177, T178 and T179 in Ll-αPGM are replaced by Q176, I177 and S178 in Lm-αPMM and by M186, I187 and S188 in Hs-αPMM1. We also found that the Ll-αPGM cap domain sulfate-binding residue K146 is replaced by the phosphoryl-group binding residue R140 in Lm-αPMM and R150 in Hs-αPMM1. Likewise, the Asp counterparts to N181 in Ll-αPGM (viz. Lm-αPMM D180 and Hs-αPMM1 D190) are observed to bind the glucose moieties of their respective ligands, and thus display conserved function. The cap domain residue R128 in Ll-αPGM is conserved in Lm-αPMM as R122 and in Hs-αPMM1 as R132. All three arginine residues participate in substrate binding.
On the other hand, significant differences between αPGM and αPMM residue identity and function do exist. For instance, the Ll-αPGM catalytic domain residues Q43 (S46 in Lm-αPMM and S54 in Hs-αPMM1) and K17 (R19 in Lm-αPMM and R28 in Hs-αPMM1) and the cap domain residue Q139 (R133 in Lm-αPMM and R143 in Hs-αPMM1) do not have counterparts of similar function in αPMM. Unlike Q43 in Ll-αPGM, S46 in Lm-αPMM and S54 in Hs-αPMM1 do not participate in the orientation of the Asp acid/base, but instead activate the transferring phosphoryl group. In addition, the hydrogen-bond networks that we have identified in the previous section as facilitators of domain-domain association in Ll-αPGM, do not have network counterparts in the αPMM structures.
In summary, even though the divergence of physiological function in HAD family αPMM and αPGM might be attributed to the presence Q43 in Ll-αPGM, which accommodates αG1P only, and the less bulky serine residue in αPMM24, which accommodates both αG1P and αM1P, the independent evolution of these mutases has resulted in significant differences in residue identity at the proximal and distal phosphoryl-group binding sites. As a consequence, the hydrogen-bond networks that orchestrate substrate-induced domain-domain association and thus, substrate recognition, have also diverged through evolution.
Conclusion.
To summarize, we have provided evidence in support of the formation of phospho Ll-αPGM from αG1P in vivo, and the intermediacy of αG1,6bisP in the conversion of αG1P to G6P. We have shown that αG1,6bisP reorients by dissociation into solvent followed by re-binding. We have also identified hydrogen-bond networks formed between substrate and key active-site residues that may serve to couple substrate binding with domain-domain association and possibly, with D10 positioning and catalysis, thereby avoiding loss of the phosphoenzyme to solvent hydrolysis. Lastly, through comparison of Ll-αPGM to βPGM and αPMM, we have identified aspects of substrate recognition and catalysis that have been conserved, as well as those that have diverged, during the evolution of phosphohexomutase activity within the framework of the HAD family phosphatases.
Supplementary Material
Acknowledgements:
The gratefully acknowledge Ms. Margarita Tararina for preparing the figure graphics.
This work was supported by NIH grant GM61099
Abbreviations used are:
- HAD
haloacid dehalogenase
- PGM
phosphoglucomutase
- PMM
phosphomannomutase
- G1P
D-glucose 1-phosphate
- M1P
D-mannose 1-phosphate
- G6P
D-glucose 6-phosphate
- M6P
mannose 6-phosphate
- G1,6bisP
D-glucose 1,6-bisphosphate
- M1,6bisP
D-mannose 1,6-bisphosphate
- Pi
inorganic phosphate
- HEPES
4-(2-hydroxyethyl)-1-piperazineethanesulfonic acid
- G6PD
glucose 6-phosphate dehydrogenase
- NAD
nicotinamide dinucleotide
- NADP
nicotinamide dinucleotide phosphate
- Ll
Lactococcus lactis
- Lm
Leishmania mexicana
- Hs
Homo sapien
- NMR
nuclear magnetic resonance
- HPLC
high performance liquid chromatography
- SDS-PAGE
sodium dodecyl sulfate polyacrylamide gel electrophoresis
Footnotes
Supporting Information
Contains a supplement to Materials and Methods and Figures S1–S9.
References
- 1.Whitehouse DB; Tomkins J; Lovegrove JU; Hopkinson DA; McMillan WO (1998) A phylogenetic approach to the identification of phosphoglucomutase genes. Mol. Biol. Evol 15, 456–462 [DOI] [PubMed] [Google Scholar]
- 2.Beamer L (2015) Mutations in hereditary phosphoglucomutase 1 deficiency map to key regions of enzyme structure and function. J. Inherit. Metab. Dis 38, 243–256. [DOI] [PubMed] [Google Scholar]
- 3.Grossiord B; Vaughan EE; Luesink E; de Vos WM (1998) Genetics of galactose utilization via the Leloir pathway in lactic acid bacteria. Lait 78, 77–84. [Google Scholar]
- 4.Ramos A; Boels IC; de Vos WM; and Santos H (2001) Relationship between glycolysis and exopolysaccharide biosynthesis in Lactococcus lactis. Appl. Environ. Microbiol 67, 33–41. [DOI] [PMC free article] [PubMed] [Google Scholar]
- 5.Vladimir Lazarevic V; Soldo B; Medico N, Pooley H; Bron S; Dimitri K (2005) Bacillus subtilis α-phosphoglucomutase is required for normal cell morphology and biofilm formation. Applied and Environmental Microbiology 71, 39–45. [DOI] [PMC free article] [PubMed] [Google Scholar]
- 6.Sanfelix-Haywood N; Coll-Marques JM; Yebra MJ (2011) Role of α-phosphoglucomutase and phosphoglucose isomerase activities at the branching point between sugar catabolism and anabolism in Lactobacillus casei. J. Applied Microbiology 111, 433–442. [DOI] [PubMed] [Google Scholar]
- 7.Ye RW; Zielinski NA; Chakrabarty AM (1994) Purification and characterization of phosphomannomutase/phosphoglucomutase from Pseudomonas aeruginosa involved in biosynthesis of both alginate and lipopolysaccharide. J. Bacteriol 176, 4851–4857. [DOI] [PMC free article] [PubMed] [Google Scholar]
- 8.Coyne MJ Jr., Russell KS; Coyle CL; Goldberg JB (1994) The Pseudomonas aeruginosa algC gene encodes phosphoglucomutase, required for the synthesis of a complete lipopolysaccharide core. J. Bacteriol 176, 3500–3507. [DOI] [PMC free article] [PubMed] [Google Scholar]
- 9.Pirard M; Achouri Y; Collet JF; Schollen E; Matthijs G; Van Schaftingen E (1999) Kinetic properties and tissular distribution of mammalian phosphomannomutase isozymes. Biochem. J 339, 201–207 [PMC free article] [PubMed] [Google Scholar]
- 10.Pirard M; Collet JF; Matthijs G; Van Schaftingen E (1997) Comparison of PMM1 with the phosphomannomutases expressed in rat liver and in human cells. FEBS Lett. 411, 251–254 [DOI] [PubMed] [Google Scholar]
- 11.Kepes F; Schekman R (1988) The yeast SEC53 gene encodes phosphomannomutase. J. Biol. Chem 263, 9155–9161. [PubMed] [Google Scholar]
- 12.Liu Y; Ray WJ Jr.; Baranidharan S (1997) Structure of rabbit muscle phosphoglucomutase refined at 2.4 Å resolution. Acta Crystallogr., Sect. D: Biol. Crystallogr 53, 392–405. [DOI] [PubMed] [Google Scholar]
- 13.Shackelford GS; Regni CA; Beamer LJ (2004) Evolutionary trace analysis of the α-D-phosphohexomutase superfamily. Protein Science 13, 2130–2138. [DOI] [PMC free article] [PubMed] [Google Scholar]
- 14.Stiers KM; Muenks; Beamer LJ (2017) Biology, mechanism, and structure of enzymes in the α-D-phosphohexomutase superfamily. Advances in Protein Chemistry and Structural Biology 109, 265–304. [DOI] [PMC free article] [PubMed] [Google Scholar]
- 15.Regni C; Tipton PA; Beamer LJ (2002) Crystal structure of PMM/PGM: an enzyme in the biosynthetic pathway of P. aeruginosa virulence factors. Structure 10, 269–279. [DOI] [PubMed] [Google Scholar]
- 16.Koonin EV & Tatusov RL (1994). Computer analysis of bacterial haloacid dehalogenases defines a large superfamily of hydrolases with diverse specificity. Application of an iterative approach to database search, J. Mol. Biol 244, 125–132. [DOI] [PubMed] [Google Scholar]
- 17.Burroughs M; Allen KN; Dunaway-Mariano D; Aravind L (2006) Evolutionary genomics of the HAD superfamily: understanding the structural adaptations and catalytic diversity in a superfamily of phosphoesterases and allied enzymes. J. Molecular Biol 361, 1003–1034 [DOI] [PubMed] [Google Scholar]
- 18.Silvaggi NR; Zhang C; Lu Z; Dunaway-Mariano D; Allen KN (2006) The X-ray crystal structures of human α-phosphomannomutase 1 reveal the structural basis of congenital disorder of glycosylation type 1a. J. Biol. Chem 281, 14918–14926. [DOI] [PubMed] [Google Scholar]
- 19.Kedzierski L; Malby RL; Smith BJ; Perugini MA; Hodder AN; Ilg T; Colman PM; Handman E (2006). Structure of Leishmania mexicana phosphomannomutase highlights similarities with human isoforms. J. Mol. Biol 363, 215–227. [DOI] [PubMed] [Google Scholar]
- 20.Neves AR, Pool WA, Kok J, Kuipers OP, and Santos H (2005) Overview on sugar metabolism and its control in Lactococcus lactis-The input from in vivo NMR. FEMS Microbiology Reviews 29, 531–554. [DOI] [PubMed] [Google Scholar]
- 21.Levander F; Andersson U; Rådstrom P (2001) Physiological role of β-phosphoglucomutase in Lactococcus lactis. Appl. Environ. Microbiol 67, 4546–4553. [DOI] [PMC free article] [PubMed] [Google Scholar]
- 22.Neves AR; Pool WA; Castro R; Mingote A; Santos F; Kok J; Kulpers OP; Santos H (2006) The α-phosphoglucomutase of Lactococcus lactis is unrelated to the α-D-phosphohexomutase superfamily and is encoded by the essential gene pgmH. J. Biol. Chem 281, 36864–36873. [DOI] [PubMed] [Google Scholar]
- 23.Lahiri S; Zhang G; Dunaway-Mariano D; Allen KN (2002) Caught in the act: the structure of phosphorylated β-phosphoglucomutase from Lactococcus lactis. Biochemistry 41, 8351–8359. [DOI] [PubMed] [Google Scholar]
- 24.Nogly P; Matias PM; de Rosa M; Catro R; Santos H; Neves AR; Archer A (2013) High-resolution structure of an atypical α-phosphoglucomutase related to eukaryotic phosphomannomutases. Acta Cryst D69, 2008–2016. [DOI] [PubMed] [Google Scholar]
- 25.Andersson U; Levander F; Radstrom P (2001) Trehalose-6-phosphate phosphorylase is part of a novel Metabolic pathway for trehalose utilization in Lactococcus lactis. J. Biol. Chem 276, 42707–42713. [DOI] [PubMed] [Google Scholar]
- 26.Ray WJ Jr.; Long JW (1976) Thermodynamics and mechanism of the PO3- transfer process in the phosphoglucomutase reaction. Biochemistry 15, 3993–4006. [DOI] [PubMed] [Google Scholar]
- 27.Naught LE; Tipton PA (2005) Formation and reorientation of glucose 1,6-bisphosphate in the PMM/PGM reaction: transient-state kinetic studies. Biochemistry 44, 6831–6836. [DOI] [PubMed] [Google Scholar]
- 28.Dai J; Wang L; Allen KA; Radstrom P; Dunaway-Mariano D (2006) Conformational cycling in β-phosphoglucomutase catalysis: reorientation of the β-D-glucose 1,6-(bis)phosphate intermediate. Biochemistry 45, 7818–7824. [DOI] [PubMed] [Google Scholar]
- 29.Morais MC; Zhang W; Baker AS; Zhang G; Dunaway-Mariano D; Allen KN (2000) The crystal structure of Bacillus cereus phosphonoacetaldehyde hydrolase: insight into catalysis of phosphorus bond cleavage and catalytic diversification within the HAD enzyme superfamily. Biochemistry 39, 10385–10396. [DOI] [PubMed] [Google Scholar]
- 30.Allen KN; Dunaway-Mariano D (2004) Phosphoryl group transfer: evolution of a catalytic scaffold. Trends Biochem Sci 29, 495–503. [DOI] [PubMed] [Google Scholar]
- 31.Lahiri S; Zhang G; Dunaway-Mariano D; Allen KN (2003) The pentacovalent phosphorus Intermediate of a phosphoryl transfer reaction. Science 299, 2067–2071. [DOI] [PubMed] [Google Scholar]
- 32.Barshop BA; Wrenn RF; Frieden C (1983) Analysis of numerical methods for computer simulation of kinetic processes: development of KINSIM-a flexible, portable system. Anal Biochem 130, 134–145 [DOI] [PubMed] [Google Scholar]
- 33.Bailey JM; Fishman PH; Pentchev PG (1968), Structural studies on mutarotases II: investigations of possible rate-limiting anomerizations in glucose metabolism. J. Biol. Chem 243, 4827–4831. [PubMed] [Google Scholar]
- 34.Zhang G; Morais MC; Dai J, Zhang W; Dunaway-Mariano D; Allen KN (2004) Investigation of metal ion binding in phosphonoacetaldehyde hydrolase identifies sequence markers for metal-activated enzymes of the HAD enzyme superfamily. Biochemistry 43, 4990–4997. [DOI] [PubMed] [Google Scholar]
- 35.Dudev T; Lim C (2007) Effect of Carboxylate-Binding Mode on Metal Binding/Selectivity and Function in Proteins. Acc. Chem. Res 40, 85–93. [DOI] [PubMed] [Google Scholar]
- 36.Needham JV; Chen TY; Falke JJ (1993) Novel ion specificity of a carboxylate cluster Mg(II) binding site: strong charge selectivity and weak size selectivity. Biochemistry 32, 3363–3367. [DOI] [PubMed] [Google Scholar]
- 37.Gupta RK; Benovic JL; Rose ZB (1978) The determination of the free magnesium level in the human red blood cell by 31P NMR. J. Biol, Chem 253, 6172–6176. [PubMed] [Google Scholar]
- 38.Williams RJP (1980) in Calcium-Binding Proteins: Structure and Function (Siegel FL, Carafoli E, Kretsinger RH, MacLennan DH and Wasserman RH Eds.) pp 3–10, Elsevier, Amsterdam. [Google Scholar]
- 39.Maret W (2017) Zinc in Cellular Regulation: The Nature and Significance of “Zinc Signals”. Int. J. Mol. Sci 18, 2285–2297. [DOI] [PMC free article] [PubMed] [Google Scholar]
- 40.Peeraer Y; Rabinjins A; Collet J-F; Van Schaftingen E; De Ranter C (2004) How calcium inhibits the magnesium-dependent enzyme human phosphoserine phosphatase. Eur. J. Biochem 271, 3421–3427. [DOI] [PubMed] [Google Scholar]
- 41.Maliekal P; Sokolova T; Vertommen D; Veiga-de-Cunha M; Van Schaftingen E (2007) Molecular identification of mammalian phosphopentomutase and glucose-1,6-bisphosphate synthase, two members of the α−D-phosphohexomutase family. J. Biol. Chem 282, 31844–31851. [DOI] [PubMed] [Google Scholar]
- 42.Xu J; Sarma AVS; Wei Y; Beamer LJ; Van Doren SR (2017) Multiple ligand-bound states of phosphohexomutase revealed by principal component analysis of NMR peak shifts. Scientific Reports 7, article number: 5343. [DOI] [PMC free article] [PubMed] [Google Scholar]
- 43.Dai J; Finci L; Zhang C; Lahiri S; Zhang G; Peisach E; Allen KN; Dunaway-Mariano D (2009) Analysis of the structural determinants underlying discrimination between substrate and solvent in β-phosphoglucomutase catalysis, Biochemistry 48, 1984–1995. [DOI] [PMC free article] [PubMed] [Google Scholar]
Associated Data
This section collects any data citations, data availability statements, or supplementary materials included in this article.