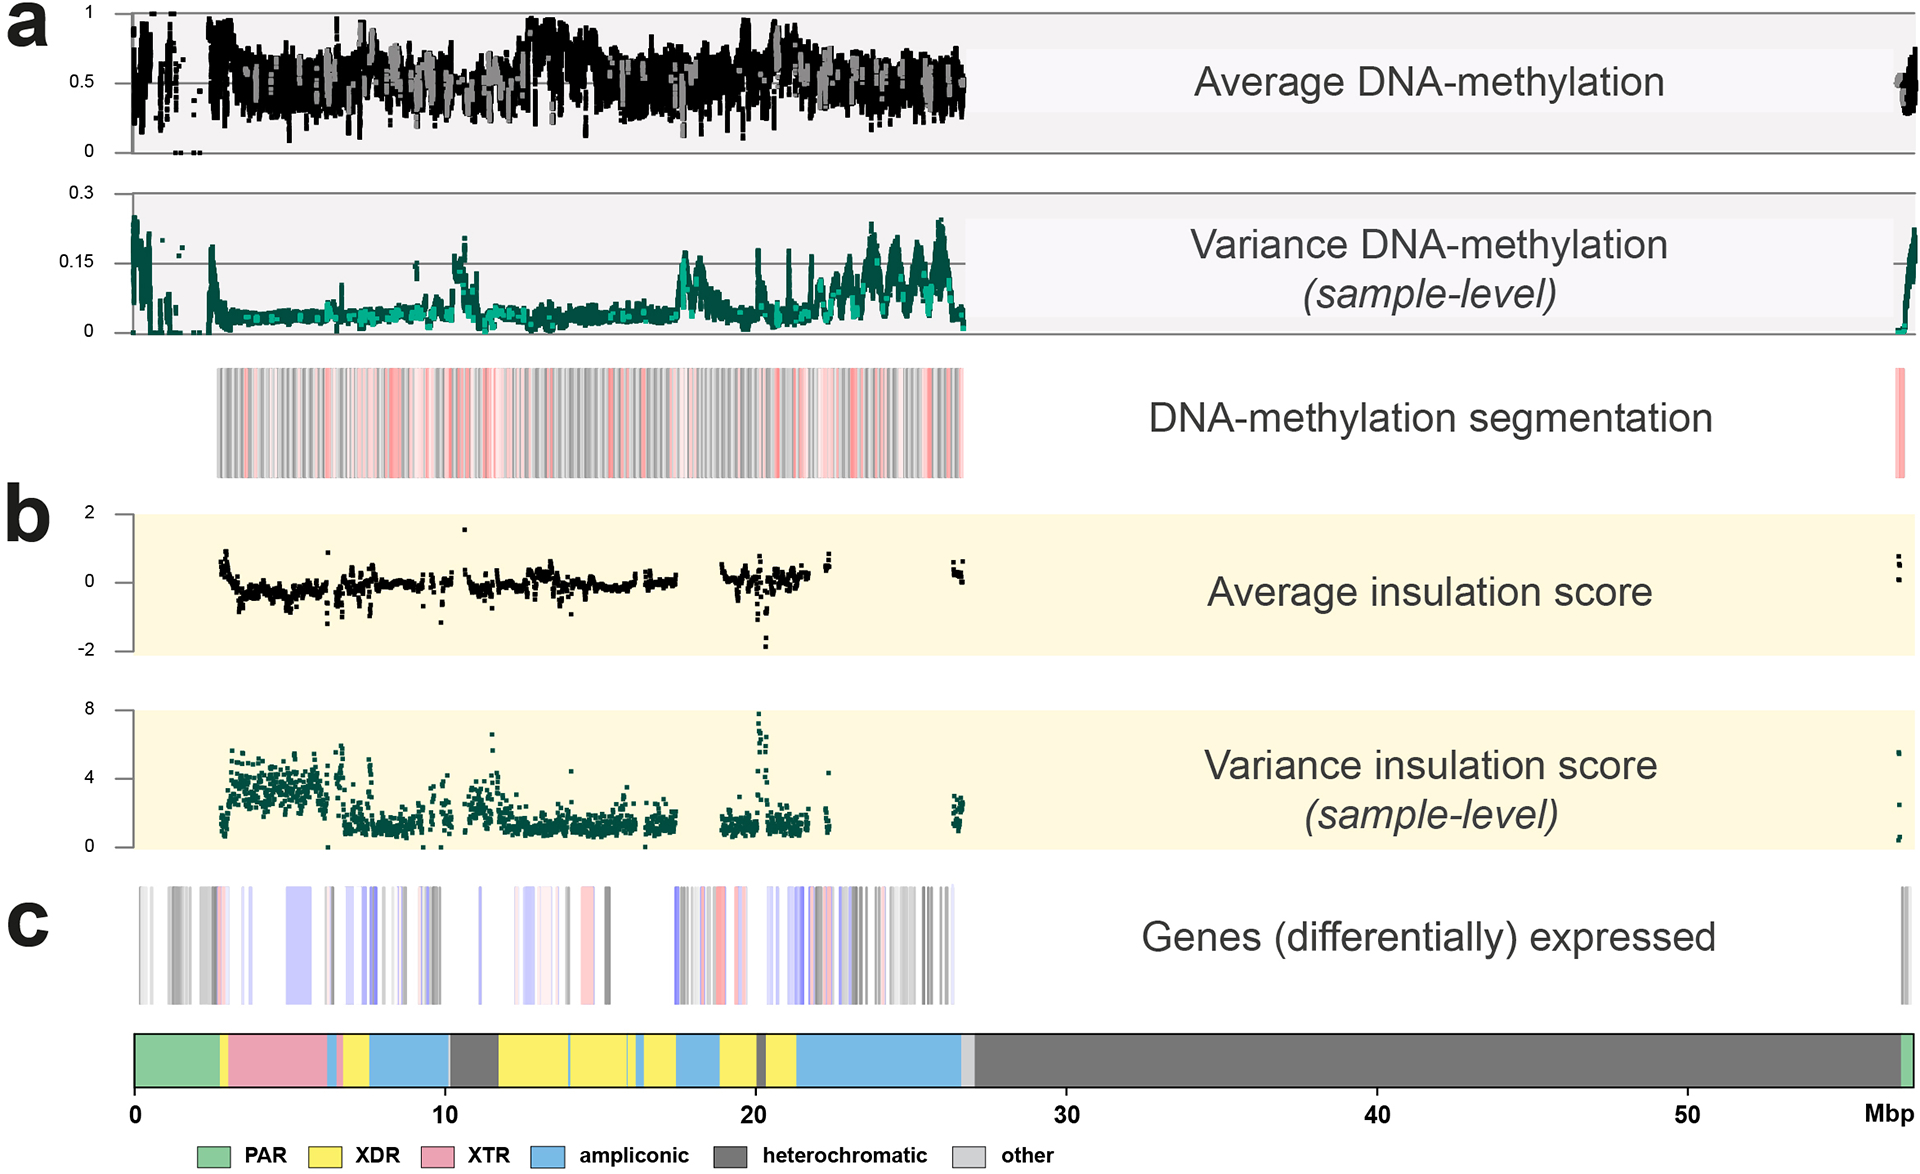
Extended Data Fig. 7. Functional analyses on the Y chromosome with DNA-methylation, RNA expression and HiC information as anchored to GRCh38 Y.

a. The top three panels show DNA-methylation levels and variation over the studied chromosomes (n=41). In black (top dot plot) the average methylation is shown, in green (middle dot plot) the variation in DNAme levels across the studied genomes. The bottom boxplot represents the DNA methylation segmentation using PycoMeth-seg (Methods). In grey shades 2,861 methylation segments, and in red shades the 340 significantly differentially methylated segments (DMS). The CpG sites that fall in a DMS are coloured in a lighter shade in the top two dot plots, the dot plots are in beta-scale, ranging from 0 (not methylated) to 1 (methylated).
b. Average insulation scores (top) and variance of insulation scores between any two samples (bottom) across 40 samples with Hi-C data with 10 kbp resolution. Regions with lower insulation scores are more insulated and more likely to be topologically associating domain (TAD) boundaries, while regions with higher scores are more likely to stay inside TADs (the regions between the two adjacent TAD boundaries). The y-axis represents the average insulation scores ranging from −2 (most insulated) to 2 (least insulated) and the variance insulation scores ranging from 0 (no variance) to 8 (more variance).
c. The Geuvadis based gene-expression analysis, shown are the 205 genes on the Y chromosome (grey shades), the 64 genes expressed in the Geuvadis LCLs (blue shades), of which 22 are differentially expressed (red shades, Supplementary Results ‘Functional analysis’ for additional details).
