

Abstract
Plastic offers a new niche for microorganisms, the plastisphere. The ever-increasing emission of plastic waste makes it critical to understand the microbial ecology of the plastisphere and associated effects. Here, we present a global fingerprint of the plastisphere, analyzing samples collected from freshwater, seawater, and terrestrial ecosystems. The plastisphere assembles a distinct microbial community that has a clearly higher heterogeneity and a more deterministically dominated assembly compared to natural habitats. New coexistence patterns—loose and fragile networks with mostly specialist linkages among microorganisms that are rarely found in natural habitats—are seen in the plastisphere. Plastisphere microbiomes generally have a great potential to metabolize organic compounds, which could accelerate carbon turnover. Microorganisms involved in the nitrogen cycle are also altered in the plastisphere, especially in freshwater plastispheres, where a high abundance of denitrifiers may increase the release of nitrite (aquatic toxicant) and nitrous oxide (greenhouse gas). Enrichment of animal, plant, and human pathogens means that the plastisphere could become an increasingly mobile reservoir of harmful microorganisms. Our findings highlight that if the trajectory of plastic emissions is not reversed, the expanding plastisphere could pose critical planetary health challenges.
Graphical abstract
Public summary
-
•
The plastisphere selectively assembles a microbiome distinct from that of natural habitats.
-
•
New microbial coexistence patterns are yielded in the plastisphere.
-
•
Altered microbial functions in the plastisphere threaten natural ecosystem functioning.
-
•
Enrichment of pathogens in the plastisphere poses a critical challenge to “One Health”.
Introduction
Plastic is a ubiquitous aspect of human life and is a marker of the present, new geological era—the Anthropocene.1,2,3,4,5 The large-scale production, use, and disposal of plastics mean that plastic pollution has become one of the most problematic global environmental issues.2,3,4 Global plastic production has climbed from 1.5 million tons in 1950 to more than 390 million tons in 2021.6 Plastic products generated approximately 6,300 million tons of waste between 1950 and 2015.7 Only a minority of plastic waste can be recycled or incinerated, whereas the vast majority (approximately 80%) ends up in landfills or the natural environment.7 For example, the accumulation of plastic in the Pacific Ocean has created the infamous Great Pacific Garbage Patch, which is three times the size of France and is still expanding.8 However, the size of individual plastic particles can be small enough to reenter the food chain, as shown by the presence of microplastics in plants,9,10,11 animals,12,13 human feces,14,15 and even human placentas.16 The amount of plastic waste in the environment will continue to increase due to the unabated production of plastic and its poor degradability.3,7 As estimated, emissions of plastic waste may reach 12,000 million tons by 2050 if disposal is not effectively controlled.7 By that time, the weight of plastic waste in the seas will far exceed the collective weight of fish,17 and 99% of seabird species will be tainted with plastic.18
Plastics are a persistent, inert, hydrophobic, organic, and long-distance transportable substrate that can be colonized by microorganisms.19,20,21 The resultant ecological system, characterized by diverse microorganisms thriving within the plastic matrix, is commonly known as the “plastisphere.”19,22 The magnitude of plastic waste means that it can harbor significant microbial biomass.19,23 Using marine plastic debris as an example, the biomass on 1 g of marine plastic debris can be nearly an order of magnitude higher than the microbial biomass in 1,000 L of open-ocean seawater.23 It has been estimated that marine plastic debris harbors between 0.01% and 0.2% of the total microbial biomass in the open ocean.19,23 Because we can only account for approximately 1% of the plastic waste released into the ocean, the microbial biomass harbored by the plastisphere could be orders of magnitude larger.19,24
The increasing emission and intractability of plastic waste will lead to a continuous expansion of the plastisphere and a consequent increase in the microbial biomass that it harbors. Microorganisms control many elemental cycles and can affect the health of environments, animals, and humans.25,26,27 Due to the increasing area of the plastisphere,7,19 its significant microbial biomass,19,23 and mobility in the environment,28 it is imperative to explore the microbial ecology of this new habitat and its effects on the functioning of ecosystems. Furthermore, increased microbial exposure, via entry of plastic debris into the food chain,10,28 poses a threat to biological safety and human health. Therefore, elucidating the microbial ecology in the plastisphere is central to predicting and managing the risks posed by plastic pollution, contributing to achieving the “One Health” goal.29
However, individual research programs may not be sufficient to generate a synoptic view of microbial ecology in the plastisphere. A more generalized understanding is required to determine how this newly expanding habitat assembles characteristic microbiomes, and the associated functional implications for ecosystem services, biosecurity, and human health. By combining our field-collected samples with publicly available raw sequences, we constructed a global dataset of plastisphere communities, covering freshwater, seawater, and terrestrial ecosystems. We analyzed the distinctiveness of the plastisphere microbiome in terms of community structure, assembly mechanisms, coexistence patterns, ecologically relevant functions, and potential pathogenic risks, and revealed the resulting ecological threats. Using our macrogenomic data, we validated the results of global sample-based microbial function prediction. Plastic is one representative of man-made surfaces, and plastic pollution is one of the most important ways by which humans exert an impact on planetary health.3 Therefore, an effort was made in this study to reveal the ecology of the plastisphere and the associated effects inherent in plastic pollution, broadening our understanding of human effects on the natural world.
Results
The plastisphere harbors distinct microbial assemblages
After strict data screening, we obtained a final total of 1,013 microbial samples collected from the plastisphere and its associated natural environment (water or soil) and used these to investigate plastisphere ecology in freshwater, seawater, and terrestrial ecosystems (Figure 1A; Tables S1–S3). Rarefaction analyses (Figure S1) showed that the number of samples in our study was sufficient to capture the majority of microorganisms in the plastisphere and in the corresponding natural environment of each ecosystem. Canonical correspondence analysis was carried out to identify the important drivers of the structure of the global microbial meta-community, and we found that the ecosystem identity was the strongest driver, followed by the carrier identity (i.e., the plastisphere or natural environments), and then latitude and study identification (representing study-specific factors such as different methods applied in different studies) (Figure S2). The unconstrained principal-coordinate analysis (PCoA) with permutational multivariate analysis of variance (PERMANOVA) further showed that the plastisphere community was significantly distinct from the natural environmental microbial community (Figures 1B and S3), but the differences in community structure caused by different ecosystems were greater than those caused by the heterogeneity between the plastisphere and the natural environment (Figure S3). The above results suggest that understanding the microbial ecology in the plastisphere should be studied specifically in its corresponding ecosystem. More importantly, although samples in different studies may be collected from different geographical locations in different seasons, and using different research methods, plastisphere samples and environmental samples still tend to form two separate clusters, demonstrating the fundamental differences between the plastisphere and natural habitats. Although the aim of our study was to understand the uniqueness and the associated risks of the plastisphere as a newly expanding habitat by analyzing its difference with natural habitats, we also tested the compositional difference between the plastisphere microbiome and other natural or unnatural biofilms (e.g., glass, natural seston, plant leaves) to further illustrate the distinctiveness of the plastisphere. Results showed that significant compositional differences existed between the plastisphere microbiome and other biofilms, indicating that the plastisphere was indeed a unique ecological niche for microorganisms (see supplemental information for details: Result S1; Figure S4; and Tables S4 and S5).
Figure 1.

A distinct community assembles in the plastisphere from natural environments
(A) Sources of the plastisphere and natural environment samples from freshwater, seawater, and terrestrial ecosystems that were analyzed in this study.
(B) Unconstrained PCoA with PERMANOVA showing that the plastisphere has a distinct microbial community from that of the natural environment (PERMANOVA: ∗∗∗p < 0.001).
(C) Comparisons of β-diversity between the community in the plastisphere and that of the natural environment (∗∗∗p < 0.001; Wilcoxon rank-sum test).
(D) Manhattan plots showing genera with significant differences between the plastisphere and the natural environment in freshwater, seawater, and terrestrial ecosystems. Each circle or triangle represents a single genus. An upward and filled triangle represent a genus significantly enriched in the plastisphere, a downward and empty triangle represents a genus significantly enriched in the natural environment, and a circle represents a genus with nonsignificant difference between the plastisphere and the natural environment (p < 0.05; Wilcoxon rank-sum test).
(E) A source analysis of microorganisms in the plastisphere based on the FEAST tool revealing that the corresponding natural environment contributes the largest part, but only a subset, of the sources of microorganisms in the plastisphere.
(F) Comparison of habitat niche breadths between the plastisphere and the natural environment in each ecosystem (∗∗∗p < 0.001; Wilcoxon rank-sum test).
(G) The MST of the plastisphere and the natural environment in each ecosystem (∗∗∗p < 0.001; Wilcoxon rank-sum test). A higher MST value represents a more stochastic assembly, with 0.5 defining the boundary between a deterministic (MST <0.5)- and stochastic (MST >0.5)-dominated assembly.
Similarities in community composition decreased significantly with increasing geographic distance (Figure S5A), indicating that the microbial community in the plastisphere followed a distance-decay pattern. Compared to the natural environments, the microbial communities in the plastisphere had significantly higher β-diversity (i.e., significantly lower similarity; Figures 1C and S5B).
Members of Gammaproteobacteria, Betaproteobacteria, and Alphaproteobacteria were prevalent within the freshwater plastisphere; members of Alphaproteobacteria, Gammaproteobacteria, and Bacteroidetes were highly abundant in the seawater plastisphere; and members of Actinobacteria, Alphaproteobacteria, and Gammaproteobacteria comprised the majority of the terrestrial plastisphere community (Figures 1D, S6, and S7; Table S6). Most of the taxa exhibited significant differences in relative abundance between the plastisphere and the natural environment (Figures 1D and S8). In the freshwater ecosystem, compared to the natural environment, the plastisphere had a significantly higher abundance of Alphaproteobacteria, Gammaproteobacteria, and Firmicutes, and a lower abundance of Bacteroidetes, Actinobacteria, Betaproteobacteria, and Verrucomicrobia (Figures 1D and S8A; Table S6). In the seawater ecosystem, the abundance of Gammaproteobacteria, Firmicutes, Acidobacteria, and Planctomycetes was higher, whereas that of Bacteroidetes, Actinobacteria, Betaproteobacteria, and Verrucomicrobia was lower in the plastisphere than in the natural environment (Figures 1D and S8B; Table S6). Moreover, in the terrestrial ecosystem, the abundance of Alphaproteobacteria, Betaproteobacteria, Gammaproteobacteria, and Verrucomicrobia was higher, whereas that of Firmicutes, Acidobacteria, and Planctomycetes was lower in the plastisphere (Figures 1D and S8C; Table S6). There were 478 genera commonly present in the plastisphere across the 3 ecosystems, and the number of unique genera in the plastisphere of each ecosystem ranged from 86 to 195 (Figure S9). However, only 26 genera were commonly enriched in the plastisphere across the 3 ecosystems, whereas 134–194 genera were enriched specifically in the plastisphere of each ecosystem (Figure S10), indicating that the plastisphere may play a different role in different ecosystems.
Using a random-forest classification model, we identified a group of biomarker taxa in the plastisphere in each ecosystem (see supplemental information for details: Result S2; Figures S11–S14; and Tables S7–S9). These biomarker taxa represented the most distinct differences in the taxonomic structure between the plastisphere and their corresponding natural habitats. Using these biomarker taxa could distinguish the plastisphere from the natural environment with high accuracy, which once again illustrates a fundamental difference between the plastisphere and natural habitats.
An analysis using the fast expectation maximization for microbial source tracking (FEAST) tool30 was carried out to quantify the effects of environmental and plastisphere environments on the plastisphere community. The results showed that for all three studied ecosystems, the surrounding environment was the most important source of microorganisms, but it contributed only a subset of the residents of the plastisphere (Figures 1E and S15; Table S10), indicating the sheltering effect of the plastisphere and its ability to raft microorganisms in long-distance, cross-ecosystem transport.
The community-level niche breadth and the modified stochasticity ratio (MST) were calculated to reveal the underlying mechanism for community assembly in the plastisphere. The ecological niche breadth was significantly lower in the plastisphere compared to that of the natural environment in all three ecosystems (Figure 1F; Table S11), indicating that microorganisms in the plastisphere were subject to more environmental filtering. The MST model further revealed that the assembly process of the plastisphere community was dominated by determinism (MST <0.5), and stochastic factors played a much less important role in plastisphere community assembly than did microbial community assembly in the corresponding natural environment across all three ecosystems (Figure 1G; Table S12).
The plastisphere yields new patterns of coexistence
To explore the dominant factors driving global microbial cooccurrence patterns, we constructed a global ecological meta-network and found that, consistent with the findings in the structure of the global microbial meta-community, the cooccurrence pattern of the global microbial meta-community was also dominated by ecosystem identity (see supplemental information for details: Result S3; Figures S16 and S17; Tables S13–S15).
Therefore, we further constructed ecological subnetworks in each ecosystem to compare microbial cooccurrence patterns between the plastisphere and the natural environment (Figure 2A; Tables S16 and S17). All of the networks presented nonrandom and scale-free features (R2 of the power law ranging from 0.854 to 0.982; Figure S18). Indexes characterizing the complexity of ecological networks, the number of links, the connectance, the average degree, and the natural connectivity showed a clearly lower level in the plastisphere than in natural environments (Figure 2B; Table S18). By randomly removing a percentage of the nodes, simulating species extinction, we tested the stability of the networks and found that the microbial networks in the plastisphere were consistently less robust than those in the natural environment (Figure 2C; Table S19).
Figure 2.

Microbial ecological networks in the plastisphere and the natural environment
(A) An overview of the ecological networks. Each node represents a unique microbial genus. Each connection between the 2 nodes represents a strong cooccurrence relationship (Spearman’s ρ > 0.6 and p < 0.05). Different colors indicate different modules.
(B) The number of links (Num.L), connectance (Con), average degree (AvgK), and natural connectivity (NC) of the ecological networks in the plastisphere and the natural environment in each ecosystem.
(C) The robustness of the ecological networks in the plastisphere and the natural environment in each ecosystem based on node removal to simulate species extinction.
(D) Venn diagrams showing differences in the composition of the ecological network community between the plastisphere and the natural environment in each ecosystem.
(E) Circos plots showing the composition of the specialist links (only present in the plastisphere) in the ecological network of the plastisphere in each ecosystem.
In addition to the topological properties, we found that the nodes supporting the networks in the plastisphere were largely different from those supporting the networks in the natural environment (Figure 2D). Furthermore, more than 80% of the links between microorganisms in the plastisphere were specialist links (links occurring in the plastisphere but absent from the corresponding natural environment) in each ecosystem (Figure S19). In the freshwater ecosystem, the plastisphere specialist links consisted mainly of associations between members of Alphaproteobacteria, Bacteroidetes, and Gammaproteobacteria (Figure 2E). The plastisphere specialist links in the seawater ecosystem derived mainly from members of Alphaproteobacteria, Gammaproteobacteria, and Bacteroidetes (Figure 2E). Connections between members of Firmicutes and Betaproteobacteria contributed most of the plastisphere specialist links in the terrestrial ecosystem (Figure 2E).
Altered ecologically relevant functional profile in the plastisphere
Ecologically relevant functional signatures in the plastisphere and the natural environment were annotated with the Functional Annotation of Prokaryotic Taxa (FAPROTAX) tool.31 Unconstrained PCoA with PERMANOVA revealed that significantly distinct functional features existed between the plastisphere and the natural environment in all three ecosystems (Figures S20 and S21; Table S20). Notably, the plastisphere in freshwater ecosystems exhibited significantly higher functional potentials related to denitrification, respiration of nitrogen and nitrogen oxides, and nitrate reduction, while having a lower functional potential for nitrification (Figure 3; Table S21). Functions related to the degradation or decomposition of organic compounds, including ligninolysis, oil bioremediation, hydrocarbon degradation, and aromatic hydrocarbon degradation, showed generally higher potentials in the plastisphere (Figure 3; Table S21). Based on databases PlasticDB32 and Microbial Biodegradation of Persistent Organic Pollutants (POPs) Database (mibPOPdb),33 we showed that the potential for plastic and POP degradation was remarkably higher in the plastisphere of all of the studied ecosystems (Figure 3; Table S21).
Figure 3.

Differences in ecologically relevant functions between the plastisphere and the natural environment
Plastic degradation potential is revealed based on the PlasticDB database, POP degradation potential is estimated with the mibPOPdb, and other functional potentials are predicted based on the FAPROTAX platform. A dot represents an estimate of the difference in functional potentials between the plastisphere and the natural environment, and the corresponding bar represents a confidence interval. A red dot with the corresponding bar indicates a significantly higher functional potential in the plastisphere, a blue dot indicates a significantly higher functional potential in the natural environment, and a gray dot indicates a nonsignificant difference in functional potential (∗p < 0.05, ∗∗p < 0.01, ∗∗∗p < 0.001; Wilcoxon rank-sum test).
To validate the robustness of the global sample-based functional evaluations, we further analyzed functional genes related to nitrogen metabolism and organic compound metabolism between the plastisphere and the natural environment, using our own metagenomic samples collected from regional freshwater, seawater, and terrestrial ecosystems. The metagenomic data-based results also showed that the plastisphere in freshwater ecosystems exhibited a significantly higher abundance of genes encoding for denitrification functions (Figure S22; Table S22), whereas functional genes related to organic compound metabolism, such as carbohydrate metabolism (Figure S23; Table S22), plastic degradation (Figure S24; Table S22), and POP degradation (Figure S25; Table S22), showed generally high levels in the plastisphere in all ecosystems.
Increased pathogenic risks in the plastisphere
Using the multiple bacterial pathogen detection (MBPD) tool,34 we evaluated pathogenic risks to animals, plants, and humans from the plastisphere. The MBPD database, designed specifically under the One Health vision, contains 72,685 full-length 16S gene sequences from 1,986 reported bacterial causes of plant, animal, and human diseases.34 By aligning our samples to the MBPD database, a total of 642 pathogenic species (462 animal, 91 plant, and 89 zoonotic) were detected from all of the samples, of which 589 species (418 animal, 83 plant, and 88 zoonotic) were detected in the freshwater ecosystem, 594 species (422 animal, 87 plant, and 85 zoonotic) were detected in the seawater ecosystem, and 529 species (369 animal, 78 plant, and 82 zoonotic) were detected in the terrestrial ecosystem (Table S23). Notably, total abundances of plant pathogens, animal pathogens, and zoonotic pathogens showed a significant increase in the plastisphere (Figure 4; Table S24). A wide range of pathogens underwent upregulation in the plastisphere: 230 of 589 detected pathogens were enriched in the plastisphere in the freshwater ecosystem, 96 of 594 detected pathogens were enriched in the plastisphere in the seawater ecosystem, and 232 of 529 detected pathogens were enriched in the plastisphere in the terrestrial ecosystem (Figure 4; Table S23). In each ecosystem, a significant portion of pathogenic species not occurring in the associated natural environment was detected in the plastisphere (Figure 4; Table S23), emphasizing that the potential of the plastisphere to harbor pathogens for long-distance, cross-ecosystem transport.
Figure 4.

Animal, plant, and zoonotic pathogens in the plastisphere and the natural environment
Potential pathogens were annotated with the MBPD database. Dot plots in the center of the figure show that the total relative abundance of animal, plant, and zoonotic pathogens exhibit significantly high levels in the plastisphere in all of the studied ecosystems (∗p < 0.05, ∗∗∗p < 0.001; Wilcoxon rank-sum test). A dot represents a mean value, and the length of a bar represents the corresponding standard deviation. The circular diagram characterizes the distribution of the monitored pathogens between the plastisphere and the natural environment in each ecosystem. Except for the outermost ring annotating the classification of the pathogens, the diagram has 9 layers, and each of the 3 layers from the inside to the outside characterizes the pathogen distribution between the plastisphere and the natural environment in one ecosystem. From the 3 layers of each ecosystem, the innermost layer characterizes the relative proportion of the mean abundance for each pathogen between the plastisphere and the natural environment, with a red bar representing a higher mean abundance in the plastisphere and a blue bar representing a higher mean abundance in the natural environment. The center layer characterizes the difference test result of the relative abundance of each pathogen between the plastisphere and the natural environment, filling with red means that the pathogen is enriched in the plastisphere, filling with blue means that the pathogen is enriched in the natural environment, and the rest means no significant differences. The third layer characterizes the occurrence of the pathogens unique to the plastisphere, with a gray dot indicating that the pathogen occurs only in the plastisphere but not in the natural environment.
We also analyzed clinical pathogens in the samples specifically using the 16S Pathogenic Identification Process (16SPIP) pipeline35 to further evaluate the human disease risk posed by the plastisphere. The 16SPIP is an effective tool for rapid pathogen detection in clinical samples and also widely applied in environmental samples.36,37,38 A detailed description of the result is presented in Result S4. Briefly, higher clinically pathogenic risks were observed in the plastisphere; the total abundance of clinical pathogens generally showed a higher level in the plastisphere. In each ecosystem, all of the pathogens detected in the natural environment also occurred in the plastisphere, but the plastisphere harbored additional pathogenic species that were not detected in the corresponding natural environment (Figures S26 and S27; Tables S25–S28).
Because aquatic animals, compared to organisms in other ecosystems, are more likely to accidentally ingest plastic debris via filter feeding, we further specifically identified potential fish pathogens in the samples based on the Fish Pathogen Database39 to reveal the threat from the plastisphere to fish health. Results showed that, in all three ecosystems, the total abundance of fish pathogens always demonstrated significantly higher abundance in the plastisphere rather than in the natural environment (Figure S28; Table S29).
Using our metagenomic samples obtained from regional freshwater, seawater, and terrestrial ecosystems, we analyzed genes encoding virulence factors in the plastisphere and the natural environment to illustrate the robustness of our global sample–based pathogenic potential assessment results. We found generally higher levels of genes encoding virulence factors in the plastisphere rather than the natural environment in all of the studied ecosystems (Figure S29; Table S22).
Discussion
Here, we constructed a global catalog of microbial communities from the plastisphere, covering samples from freshwater, seawater, and terrestrial ecosystems. We explored the ecological processes and mechanisms of microbial assembly in the plastisphere. This analysis shows that the human production of plastics is altering the natural microbial world, potentially influencing ecological processes, biosecurity, and human health (Figure 5).
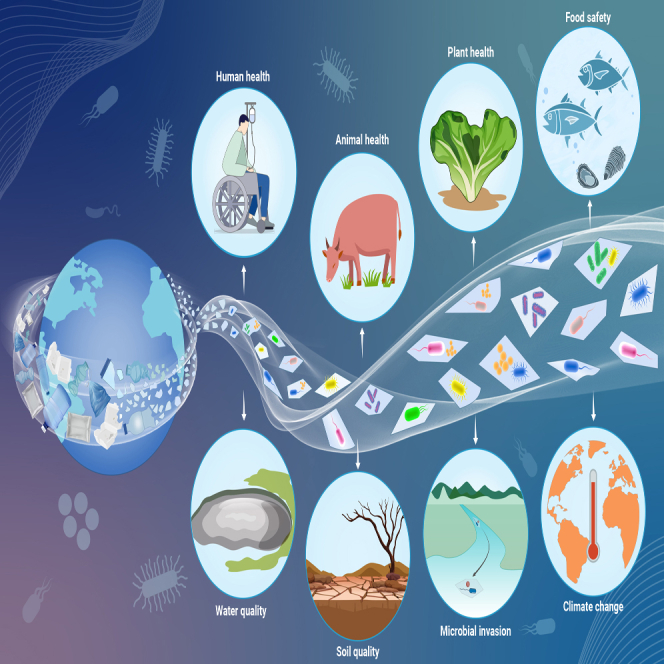
Figure 5.

Schematic diagram showing potential plastisphere threats
The plastisphere, which harbors microorganisms moving across ecosystems, may cause microbial invasions and disturb the stability of ecosystems. The general recruitment of organic-metabolizing bacteria and the altered nitrogen-metabolizing bacteria indicate that the plastisphere has potential effects on ecological processes, environmental quality, and climate change. The enrichment of human pathogens, plant pathogens, and animal pathogens means that the plastisphere poses critical challenges for One Health.
The unique habitat selectively recruits a distinct microbiome with new coexistence patterns
As a habitat, the plastisphere has unique characteristics. First, the substrate of the plastisphere is organic, hydrophobic, buoyant, and persistent.19,20,28 Plastic is composed of organic carbon compounds40,41 that also tend to adsorb organic matter from the environment.28 This provides nutrients for some microorganisms.42 Harmful compounds can be released as plastic degrades—for example, the phthalate plasticizers, bisphenol A, and metal additives such as zinc, copper, and nickel.43 These have potential effects on photosynthesis and community composition.44 Hazardous hydrophobic pollutants such as polychlorinated biphenyls45 and polycyclic aromatic hydrocarbons46 are adsorbed from the ambient environment by the surface of plastic polymers. These exert strong selection pressure on microorganisms.
Consequently, the plastisphere selectively enriches microorganisms.20,47 Microorganisms that can adapt to the unique environment are promoted and those that cannot adapt are inhibited, resulting in the formation of distinct microbial communities in the plastisphere (Figure 1B). The ability of plastics to travel through different environmental media (also referred to as the “plastic cycle”48,49) and the protection afforded to the microbial community by the plastisphere20 allows plastics to carry microorganisms for long distances and between ecosystems.28,50 This unique characteristic is verified in the present study by the source analysis of plastisphere microorganisms, which shows that plastispheres from different ecosystems have common sources and that plastisphere microorganisms can partially originate from the natural environment of other ecosystems (Figure 1E). Based on our field-collected samples, we found that, compared to the ambient microbial community, the plastisphere microbial community was less affected by environmental physicochemical properties (see supplemental information for details: Result S5; Figure S30). Therefore, the plastisphere can act as a vector for transporting microorganisms through different ecosystems. This may be an important driver of differences between the structure of the microbial community, in particular, plastispheres and their corresponding natural environment. This property also makes it possible for the plastisphere to transport invasive species into new environments, which may disturb the stability of natural ecosystems.19,28,51
The second unique characteristic of the plastisphere is its great heterogeneity, which is caused by the complexity and diversity of the plastic pollutants, including complex polymers, additives, and aging time.51,52 The third characteristic of the plastisphere habitat is its high degree of fragmentation and isolation. The combination of these three characteristics explains the significantly increased importance of deterministic processes in the assembly of plastisphere microbial communities (Figure 1G). The unique microenvironmental conditions exert vast selection pressures on microorganisms, the high heterogeneity increases heterogeneous selection, and fragmentation and isolation make it more difficult for microorganisms to disperse among these microhabitats. It is well documented that deterministic and stochastic processes jointly lead to distance-decay patterns in biotic communities, because increases in geographic distance can increase the difficulty of dispersal and are associated with differences in environmental conditions.53,54 The environmental conditions of the plastisphere are shaped by both the plastic substrate55,56 and the physicochemical properties of its ambient environment.20 Different types of plastic can recruit different microbial communities.55,56 Our previous study revealed that the similarity of plastic-type composition also decreased significantly with increasing geographic distance,52 and this finding has been confirmed by subsequent studies.57,58 Therefore, strong dispersal limitation, high environmental selection pressure resulting from the heterogeneity of the substrate, and bulk physicochemical variation combine to generate a significant distance-decay pattern and a high β-diversity of the plastisphere microbiome (Figure 1C).
Associations among microorganisms shape microbial diversity and functions.59,60,61,62 The complexity and stability of microbial networks in the plastisphere are lower than those in the natural environments in all three ecosystems (Figures 2A–2C). Food and resource availability are usually important drivers of network structures.62,63 An adequate supply of resources facilitates the formation of complex networks.62,63 In contrast, harsh and underresourced environments can limit interactions among microorganisms, leading to loose networks.62,63,64,65 In addition to the effects of the above environmental selections, dispersal limitation also mediates microbial coexistence.53,66,67 The strong dispersal limitation of the plastisphere can reduce the chances of species association. Supporting the core ecological theory that complexity begets stability,67 the low complexity of plastisphere networks leads to their low robustness (Figure 2C). Notably, this study reveals that the composition of the nodes supporting the ecological networks is largely different between the plastisphere and the natural environments, and that most of the microbial associations in the plastisphere are specialist links (Figures 2D and 2E). These results demonstrate the fundamental difference between the plastisphere and the natural environment, and once again illustrate the unique environmental properties of the plastisphere, leading to new patterns of coexistence among microorganisms.
The distinct biotope threatens ecosystem functioning and One Health
The plastisphere has significantly distinct functional potentials compared to the natural environment in which it is embedded (Figure 3). Arguably, this affects the normal functioning of the whole ecosystem, especially because the microbial biomass of the plastisphere is often higher than that of the surrounding medium.19 Due to the nature of its organic substrate, the plastisphere domesticates or selects microorganisms with functions related to the decomposition or degradation of organic compounds (Figure 3). For example, higher degradation potentials for hydrocarbons, aromatic hydrocarbons, plastics, and POPs prevail in the plastisphere of all of the ecosystems, a higher ligninolysis potential presents in the plastisphere from the terrestrial ecosystem, which is the most lignin-rich ecosystem, and a higher oil remediation potential exists in the plastisphere in seawater ecosystems, which is the most oil-affected ecosystem (Figure 3).
These results indicate that plastic pollution has the potential to accelerate organic compound metabolism, which is detrimental to the sequestration of organic matter. Our findings provide an in-depth explanation of the observations in previous global investigations that high plastic biodegradation potential occurs in areas with high plastic contamination68 and the accumulation of plastic residues negatively affects soil organic matter in croplands.69,70 Furthermore, the higher decomposition and degradation potentials in the plastisphere also may increase the release of greenhouse gases such as CO2 and CH4, which are the end products of the decomposition and degradation. The functions of denitrification, respiration of nitrogen and nitrogen oxides, as well as nitrate reduction exhibit higher potential in the plastisphere from the freshwater ecosystem (Figure 3), which increases the chances of producing N2O and NO2−.71 N2O is also a strong greenhouse gas with a global warming potential of 298 times that of CO2 on a 100-year timescale,72 whereas NO2− is toxic to aquatic organisms.73 Metabolites from the plastisphere are released directly into the surrounding environment, consequentially disturbing the normal nutrient cycles of the natural ecosystem, as supported by microcosm studies.74,75 The high potential for the metabolism of organic compounds to be altered and for there to be distinct functional signatures related to the nitrogen cycle means that the plastisphere could alter normal biogeochemical flows and help drive changes in climate.20,56,76
In addition to the above-mentioned effects on ecological processes, our findings that potential animal, plant, and human pathogens are enriched in the plastisphere indicate that the plastisphere poses a critical threat to biosecurity and, potentially, human health (Figure 4). Plastic debris–carrying pathogens could directly enter animals, especially aquatic animals via filter feeding,13 which could negatively affect the growth, behavior, and feeding of animals.70,77 There is evidence that even micron-sized plastics can be absorbed and accumulated by terrestrial plants.10,11 The increased exposure of plants to the contaminating pathogens from the plastisphere may be an important cause of reports that plastic residues impair crop yields (an average yield reduction of 3% for every additional 100 kg/ha of plastic film residue)69 and impede the normal growth of plants (e.g., reduced biomass).69,70 The high abundance of human pathogens in the plastisphere means that plastic pollution increases the risk of human exposure to pathogens; moreover, plastic debris absorbed by animals and plants causes an increase in disease risk for humans indirectly.
The discovery that unique pathogens are present in the plastisphere but absent in the corresponding natural environment applied to all of the studied ecosystems (Figure 4) further confirms that plastics can act as vectors, harboring microorganisms for cross-ecosystem transport, in line with a previous in situ sequential incubation study.50 This unique property of plastics poses an invasion risk from pathogens and other microorganisms, greatly increasing the disturbance to natural ecosystems and the uncertainty of infection in animals and humans.19,27,28,50 Therefore, in line with the core notion of One Health,78 the plastisphere can be said to pose a challenge to the health of environments, plants, animals, and humans.
The plastisphere can cause different ecological effects in different ecosystems
Our findings that the plastisphere differentially enriches microbial taxa, elemental metabolic functions, and conditional pathogenic taxa in different ecosystems (Figures 1D, 3, and 4) indicate that the plastisphere could cause different ecological effects under different scenarios. Our previous study52 revealed that the composition of plastic debris varies significantly in different ecosystems due to the great differences in the physical and chemical properties of the environmental substrates and the highly different pollution sources; therefore, the different substrate composition of the plastisphere may be an important cause of the different ecological effects of the plastisphere in different ecosystems.20 In addition, due to the largely different physicochemical properties of different ecosystems, the plastisphere can play different roles for microorganisms in different ecosystems.19,20 For example, in terrestrial ecosystems, soils are usually rich in nutrients for microorganisms, and although the plastisphere can effectively adsorb organic matter, the availability of nutrients may not be an important reason for the enrichment of microorganisms by the plastisphere. However, in aquatic ecosystems, especially in the harsh and nutrient-poor environment of seawater ecosystems, the plastisphere, which is inert organic carbon itself and also can effectively adsorb ambient organic matter,28,40,41 could serve as “nutrient islands” within these nutrient deserts.19 Therefore, the different roles of the plastisphere under different environmental conditions could be another important cause of differentiated microbial taxa or functions enriched by the plastisphere in different ecosystems. Given these findings, plastic pollution is a global problem that requires local pollution control management. Therefore, further efforts are needed to reveal the specific effects of the plastisphere in representative human-influenced areas and to identify areas where plastic pollution should be prioritized for control.
In conclusion, the plastisphere distinguishes itself from natural habitats by selectively recruiting microbial communities and generating new coexistence patterns in which emerging microbial associations occur in loose and fragile networks. The functional implications of such a unique plastisphere assemblage are reflected in its distinct metabolic potential for nitrogen cycling and organic compounds, and great enrichment of animal, plant, and human pathogens, which may perturb the functioning of ecosystems and critically challenge the achievement of One Health. Our results provide a theoretical basis for quantifying the effects of the plastisphere on a number of planetary health issues, such as carbon turnover, greenhouse gas emission, pathogen-related food safety, and biological health, in relationship to the surface area of the plastisphere under the projected trajectory of its production and release. With the plastisphere as an example, understanding how the expansion of man-made surfaces introduced by human civilization is altering the natural microbial world contributes to informed global actions on the consequence of evolving microbiology in the Anthropocene. In the future, quantifying the extent of ecological processes, climate changes, and health events driven by plastic pollution will be necessary to fully assess plastic pollution risks. Given that our findings demonstrate the ability of the plastisphere to foster microbial communities with a heightened capacity for organic compound degradation, if we can establish microbial technologies and products that could effectively degrade plastics via the screening of microorganisms sourced from the plastisphere, it would make a substantial contribution to the solution of global plastic pollution.
Materials and methods
See supplemental information for details.
Data and code availability
The raw sequencing data from the field-collected samples have been deposited in the NCBI under accession identification numbers PRJNA717904 (for the amplicon sequencing data) and PRJNA984432 (for the metagenomic sequencing data). The sources of publicly available data are provided in Table S1. All of the data used in the analysis of this study are provided in Tables S2–S29. R scripts for key analyses in this study are available at https://github.com/Changchao-Li/global_plastisphere_ecology.
Acknowledgments
This work was supported by the Strategic Priority Research Program of the Chinese Academy of Sciences (XDB40020102), the National Natural Science Foundation of China (22193063, 32071523, and 42007229), the State Key Laboratory of Marine Pollution Collaborative Research Fund (SKLMP/CRF/0004 and SKLMP/SCRF/0030), the Hong Kong Branch of the Southern Marine Science and Engineering Guangdong Laboratory (Guangzhou) Open Collaborative Research Fund (SMSEGL20SC02), the Hong Kong LNG Terminal Marine Conservation Enhancement Fund (MCEF20030), and the Start-up Funds of The Hong Kong Polytechnic University (P0036173 and P0038311). C.L. acknowledges support from the Distinguished Postdoctoral Fellowship of The Hong Kong Polytechnic University (1-YWCE). We are grateful to all of the principal investigators for uploading sequencing data as an open access resource. We also thank Mr. Lifei Wang of Shandong University for his contribution in the sampling process, Miss Yanfei Wang of Shanghai University of Electric Power for her input in programming, Prof. Beat Frey of Snow and Landscape Research (WSL) for kindly providing information on the samples, and Prof. Huijun Xie of Shandong University, Prof. Yong-Xin Liu of the Chinese Academy of Agricultural Sciences, and Dr. Robyn J. Wright of Dalhousie University for their constructive comments on the manuscript.
Author contributions
C.L., L. Jin, and J. Liu designed the study; C.L. conducted the field sampling, performed the laboratory work, and collected publicly available data, with D.Z. and J.W. contributing a part of the metagenomic samples; C.L. analyzed the data under the guidance of L. Jin and J. Liu; C.L. L. Jin, and J. Liu prepared the original draft of the manuscript; and the following authors contributed significantly to reviewing and editing: M.R.G., C.Z., Q.C., D.Z., J.W., K.Z., Q.X., P.L., and X.D.L. All of the authors read and approved the final version of the manuscript.
Declaration of interests
The authors declare no competing interests.
Published Online: November 22, 2023
Footnotes
It can be found online at https://doi.org/10.1016/j.xinn.2023.100543.
Contributor Information
Jian Liu, Email: ecology@sdu.edu.cn.
Ling Jin, Email: ling.jin@polyu.edu.hk.
Lead contact website
https://www.polyu.edu.hk/cee/people/academic-staff/dr-ling-jin/.
Supplemental information
References
- 1.Zalasiewicz J., Waters C.N., Ivar do Sul J.A., et al. The geological cycle of plastics and their use as a stratigraphic indicator of the Anthropocene. Anthropocene. 2016;13:4–17. [Google Scholar]
- 2.Law K.L. Plastics in the marine environment. Ann. Rev. Mar. Sci. 2017;9:205–229. doi: 10.1146/annurev-marine-010816-060409. [DOI] [PubMed] [Google Scholar]
- 3.MacLeod M., Arp H.P.H., Tekman M.B., et al. The global threat from plastic pollution. Science. 2021;373:61–65. doi: 10.1126/science.abg5433. [DOI] [PubMed] [Google Scholar]
- 4.Stubbins A., Law K.L., Muñoz S.E., et al. Plastics in the Earth system. Science. 2021;373:51–55. doi: 10.1126/science.abb0354. [DOI] [PubMed] [Google Scholar]
- 5.Long Z., Pan Z., Jin X., et al. Anthropocene microplastic stratigraphy of Xiamen Bay, China: A history of plastic production and waste management. Water Res. 2022;226 doi: 10.1016/j.watres.2022.119215. [DOI] [PubMed] [Google Scholar]
- 6.PlasticsEurope . 2022. Plastics-the Facts 2022: An Analysis of European Plastics Production, Demand and Waste Data. [Google Scholar]
- 7.Geyer R., Jambeck J.R., Law K.L. Production, use, and fate of all plastics ever made. Sci. Adv. 2017;3 doi: 10.1126/sciadv.1700782. [DOI] [PMC free article] [PubMed] [Google Scholar]
- 8.Lebreton L., Slat B., Ferrari F., et al. Evidence that the Great Pacific Garbage Patch is rapidly accumulating plastic. Sci. Rep. 2018;8:4666. doi: 10.1038/s41598-018-22939-w. [DOI] [PMC free article] [PubMed] [Google Scholar]
- 9.Sun X.-D., Yuan X.-Z., Jia Y., et al. Differentially charged nanoplastics demonstrate distinct accumulation in Arabidopsis thaliana. Nat. Nanotechnol. 2020;15:755–760. doi: 10.1038/s41565-020-0707-4. [DOI] [PubMed] [Google Scholar]
- 10.Li L., Luo Y., Li R., et al. Effective uptake of submicrometre plastics by crop plants via a crack-entry mode. Nat. Sustain. 2020;3:929–937. [Google Scholar]
- 11.Luo Y., Li L., Feng Y., et al. Quantitative tracing of uptake and transport of submicrometre plastics in crop plants using lanthanide chelates as a dual-functional tracer. Nat. Nanotechnol. 2022;17:424–431. doi: 10.1038/s41565-021-01063-3. [DOI] [PubMed] [Google Scholar]
- 12.D’Souza J.M., Windsor F.M., Santillo D., et al. Food web transfer of plastics to an apex riverine predator. Global Change Biol. 2020;26:3846–3857. doi: 10.1111/gcb.15139. [DOI] [PubMed] [Google Scholar]
- 13.Li B., Liang W., Liu Q.-X., et al. Fish ingest microplastics unintentionally. Environ. Sci. Technol. 2021;55:10471–10479. doi: 10.1021/acs.est.1c01753. [DOI] [PubMed] [Google Scholar]
- 14.Yan Z., Liu Y., Zhang T., et al. Analysis of microplastics in human feces reveals a correlation between fecal microplastics and inflammatory bowel disease status. Environ. Sci. Technol. 2022;56:414–421. doi: 10.1021/acs.est.1c03924. [DOI] [PubMed] [Google Scholar]
- 15.Zhang J., Wang L., Trasande L., et al. Occurrence of polyethylene terephthalate and polycarbonate microplastics in infant and adult feces. Environ. Sci. Technol. Lett. 2021;8:989–994. [Google Scholar]
- 16.Ragusa A., Svelato A., Santacroce C., et al. Plasticenta: First evidence of microplastics in human placenta. Environ. Int. 2021;146 doi: 10.1016/j.envint.2020.106274. [DOI] [PubMed] [Google Scholar]
- 17.Sardon H., Dove A.P. Plastics recycling with a difference. Science. 2018;360:380–381. doi: 10.1126/science.aat4997. [DOI] [PubMed] [Google Scholar]
- 18.Wilcox C., Van Sebille E., Hardesty B.D. Threat of plastic pollution to seabirds is global, pervasive, and increasing. Proc. Natl. Acad. Sci. USA. 2015;112:11899–11904. doi: 10.1073/pnas.1502108112. [DOI] [PMC free article] [PubMed] [Google Scholar]
- 19.Amaral-Zettler L.A., Zettler E.R., Mincer T.J. Ecology of the plastisphere. Nat. Rev. Microbiol. 2020;18:139–151. doi: 10.1038/s41579-019-0308-0. [DOI] [PubMed] [Google Scholar]
- 20.Li C., Wang L., Ji S., et al. The ecology of the plastisphere: Microbial composition, function, assembly, and network in the freshwater and seawater ecosystems. Water Res. 2021;202 doi: 10.1016/j.watres.2021.117428. [DOI] [PubMed] [Google Scholar]
- 21.Wright R.J., Erni-Cassola G., Zadjelovic V., et al. Marine plastic debris: A new surface for microbial colonization. Environ. Sci. Technol. 2020;54:11657–11672. doi: 10.1021/acs.est.0c02305. [DOI] [PubMed] [Google Scholar]
- 22.Zettler E.R., Mincer T.J., Amaral-Zettler L.A. Life in the “Plastisphere”: Microbial communities on plastic marine debris. Environ. Sci. Technol. 2013;47:7137–7146. doi: 10.1021/es401288x. [DOI] [PubMed] [Google Scholar]
- 23.Mincer T.J., Zettler E.R., Amaral-Zettler L.A. In: Hazardous Chemicals Associated with Plastics in the Marine Environment. Takada H., Karapanagioti H.K., editors. Springer International Publishing; 2016. Biofilms on plastic debris and their influence on marine nutrient cycling, productivity, and hazardous chemical mobility; pp. 221–233. [Google Scholar]
- 24.van Sebille E., Wilcox C., Lebreton L., et al. A global inventory of small floating plastic debris. Environ. Res. Lett. 2015;10 [Google Scholar]
- 25.Sunagawa S., Coelho L.P., Chaffron S., et al. Structure and function of the global ocean microbiome. Science. 2015;348 doi: 10.1126/science.1261359. [DOI] [PubMed] [Google Scholar]
- 26.Shu W.-S., Huang L.-N. Microbial diversity in extreme environments. Nat. Rev. Microbiol. 2022;20:219–235. doi: 10.1038/s41579-021-00648-y. [DOI] [PubMed] [Google Scholar]
- 27.Gillings M.R., Paulsen I.T. Microbiology of the Anthropocene. Anthropocene. 2014;5:1–8. [Google Scholar]
- 28.Bowley J., Baker-Austin C., Porter A., et al. Oceanic hitchhikers – Assessing pathogen risks from marine microplastic. Trends Microbiol. 2021;29:107–116. doi: 10.1016/j.tim.2020.06.011. [DOI] [PubMed] [Google Scholar]
- 29.Zhang X.-X., Liu J.-S., Han L.-F., et al. One Health: new evaluation framework launched. Nature. 2022;604:625. doi: 10.1038/d41586-022-01108-0. [DOI] [PubMed] [Google Scholar]
- 30.Shenhav L., Thompson M., Joseph T.A., et al. FEAST: fast expectation-maximization for microbial source tracking. Nat. Methods. 2019;16:627–632. doi: 10.1038/s41592-019-0431-x. [DOI] [PMC free article] [PubMed] [Google Scholar]
- 31.Louca S., Parfrey L.W., Doebeli M. Decoupling function and taxonomy in the global ocean microbiome. Science. 2016;353:1272–1277. doi: 10.1126/science.aaf4507. [DOI] [PubMed] [Google Scholar]
- 32.Gambarini V., Pantos O., Kingsbury J.M., et al. PlasticDB: a database of microorganisms and proteins linked to plastic biodegradation. Database. 2022;2022:baac008. doi: 10.1093/database/baac008. [DOI] [PMC free article] [PubMed] [Google Scholar]
- 33.Ngara T.R., Zeng P., Zhang H. mibPOPdb: An online database for microbial biodegradation of persistent organic pollutants. iMeta. 2022;1:e45. doi: 10.1002/imt2.45. [DOI] [PMC free article] [PubMed] [Google Scholar]
- 34.Yang X., Jiang G., Zhang Y., et al. MBPD: A multiple bacterial pathogen detection pipeline for One Health practices. iMeta. 2023;2:e82. doi: 10.1002/imt2.82. [DOI] [PMC free article] [PubMed] [Google Scholar]
- 35.Miao J., Han N., Qiang Y., et al. 16SPIP: a comprehensive analysis pipeline for rapid pathogen detection in clinical samples based on 16S metagenomic sequencing. BMC Bioinf. 2017;18:568. doi: 10.1186/s12859-017-1975-3. [DOI] [PMC free article] [PubMed] [Google Scholar]
- 36.Zhao J., Jin L., Wu D., et al. Global airborne bacterial community—interactions with Earth’s microbiomes and anthropogenic activities. Proc. Natl. Acad. Sci. USA. 2022;119 doi: 10.1073/pnas.2204465119. [DOI] [PMC free article] [PubMed] [Google Scholar]
- 37.Li D., Van De Werfhorst L.C., Dunne T., et al. Surf zone microbiological water quality following emergency beach nourishment using sediments from a catastrophic debris flow. Water Res. 2020;176 doi: 10.1016/j.watres.2020.115733. [DOI] [PubMed] [Google Scholar]
- 38.Li D., Van De Werfhorst L.C., Rugh M.B., et al. Limited bacterial removal in full-scale stormwater biofilters as evidenced by community sequencing analysis. Environ. Sci. Technol. 2021;55:9199–9208. doi: 10.1021/acs.est.1c00510. [DOI] [PubMed] [Google Scholar]
- 39.Drønen K., Roalkvam I., Tungland K., et al. How to define fish pathogen relatives from a 16S rRNA sequence library and Pearson correlation analysis between defined OTUs from the library: Supplementary data to the research article “Presence and habitats of bacterial fish pathogen relatives in a marine salmon post-smolt RAS”. Data Brief. 2023;46 doi: 10.1016/j.dib.2022.108846. [DOI] [PMC free article] [PubMed] [Google Scholar]
- 40.Rillig M.C., Lehmann A. Microplastic in terrestrial ecosystems. Science. 2020;368:1430–1431. doi: 10.1126/science.abb5979. [DOI] [PMC free article] [PubMed] [Google Scholar]
- 41.Rillig M.C., Leifheit E., Lehmann J. Microplastic effects on carbon cycling processes in soils. PLoS Biol. 2021;19 doi: 10.1371/journal.pbio.3001130. [DOI] [PMC free article] [PubMed] [Google Scholar]
- 42.Gong J., Kong T., Li Y., et al. Biodegradation of microplastic derived from poly(ethylene terephthalate) with bacterial whole-cell biocatalysts. Polymers. 2018;10 doi: 10.3390/polym10121326. [DOI] [PMC free article] [PubMed] [Google Scholar]
- 43.Hahladakis J.N., Velis C.A., Weber R., et al. An overview of chemical additives present in plastics: Migration, release, fate and environmental impact during their use, disposal and recycling. J. Hazard Mater. 2018;344:179–199. doi: 10.1016/j.jhazmat.2017.10.014. [DOI] [PubMed] [Google Scholar]
- 44.Tetu S.G., Sarker I., Schrameyer V., et al. Plastic leachates impair growth and oxygen production in Prochlorococcus, the ocean’s most abundant photosynthetic bacteria. Commun. Biol. 2019;2:184. doi: 10.1038/s42003-019-0410-x. [DOI] [PMC free article] [PubMed] [Google Scholar]
- 45.Velzeboer I., Kwadijk C.J.A.F., Koelmans A.A. Strong sorption of PCBs to nanoplastics, microplastics, carbon nanotubes, and fullerenes. Environ. Sci. Technol. 2014;48:4869–4876. doi: 10.1021/es405721v. [DOI] [PubMed] [Google Scholar]
- 46.Sørensen L., Rogers E., Altin D., et al. Sorption of PAHs to microplastic and their bioavailability and toxicity to marine copepods under co-exposure conditions. Environ. Pollut. 2020;258 doi: 10.1016/j.envpol.2019.113844. [DOI] [PubMed] [Google Scholar]
- 47.Wang J., Qin X., Guo J., et al. Evidence of selective enrichment of bacterial assemblages and antibiotic resistant genes by microplastics in urban rivers. Water Res. 2020;183 doi: 10.1016/j.watres.2020.116113. [DOI] [PubMed] [Google Scholar]
- 48.Rochman C.M., Hoellein T. The global odyssey of plastic pollution. Science. 2020;368:1184–1185. doi: 10.1126/science.abc4428. [DOI] [PubMed] [Google Scholar]
- 49.Bank M.S., Hansson S.V. The plastic cycle: A novel and holistic paradigm for the Anthropocene. Environ. Sci. Technol. 2019;53:7177–7179. doi: 10.1021/acs.est.9b02942. [DOI] [PubMed] [Google Scholar]
- 50.Song J., Beule L., Jongmans-Hochschulz E., et al. The travelling particles: community dynamics of biofilms on microplastics transferred along a salinity gradient. ISME Commun. 2022;2:35. doi: 10.1038/s43705-022-00117-4. [DOI] [PMC free article] [PubMed] [Google Scholar]
- 51.Amaral-Zettler L.A., Zettler E.R., Slikas B., et al. The biogeography of the Plastisphere: implications for policy. Front. Ecol. Environ. 2015;13:541–546. [Google Scholar]
- 52.Li C., Gan Y., Zhang C., et al. “Microplastic communities” in different environments: Differences, links, and role of diversity index in source analysis. Water Res. 2021;188 doi: 10.1016/j.watres.2020.116574. [DOI] [PubMed] [Google Scholar]
- 53.Jiao S., Yang Y., Xu Y., et al. Balance between community assembly processes mediates species coexistence in agricultural soil microbiomes across eastern China. ISME J. 2020;14:202–216. doi: 10.1038/s41396-019-0522-9. [DOI] [PMC free article] [PubMed] [Google Scholar]
- 54.Feng M., Tripathi B.M., Shi Y., et al. Interpreting distance-decay pattern of soil bacteria via quantifying the assembly processes at multiple spatial scales. MicrobiologyOpen. 2019;8 doi: 10.1002/mbo3.851. [DOI] [PMC free article] [PubMed] [Google Scholar]
- 55.Zhu D., Ma J., Li G., et al. Soil plastispheres as hotspots of antibiotic resistance genes and potential pathogens. ISME J. 2022;16:521–532. doi: 10.1038/s41396-021-01103-9. [DOI] [PMC free article] [PubMed] [Google Scholar]
- 56.Bhagwat G., Zhu Q., O’Connor W., et al. Exploring the composition and functions of plastic microbiome using whole-genome sequencing. Environ. Sci. Technol. 2021;55:4899–4913. doi: 10.1021/acs.est.0c07952. [DOI] [PubMed] [Google Scholar]
- 57.Yuan W., Christie-Oleza J.A., Xu E.G., et al. Environmental fate of microplastics in the world's third-largest river: Basin-wide investigation and microplastic community analysis. Water Res. 2022;210 doi: 10.1016/j.watres.2021.118002. [DOI] [PubMed] [Google Scholar]
- 58.Guo Z., Boeing W.J., Xu Y., et al. Global meta-analysis of microplastic contamination in reservoirs with a novel framework. Water Res. 2021;207 doi: 10.1016/j.watres.2021.117828. [DOI] [PubMed] [Google Scholar]
- 59.Zhou J., Deng Y., Luo F., et al. Functional molecular ecological networks. mBio. 2010;1:e00169-10. doi: 10.1128/mBio.00169-10. [DOI] [PMC free article] [PubMed] [Google Scholar]
- 60.Toju H., Yamamichi M., Guimarães P.R., et al. Species-rich networks and eco-evolutionary synthesis at the metacommunity level. Nat. Ecol. Evol. 2017;1 doi: 10.1038/s41559-016-0024. [DOI] [PubMed] [Google Scholar]
- 61.Raimundo R.L.G., Guimarães P.R., Jr., Evans D.M. Adaptive networks for restoration ecology. Trends Ecol. Evol. 2018;33:664–675. doi: 10.1016/j.tree.2018.06.002. [DOI] [PubMed] [Google Scholar]
- 62.Li C., Jin L., Zhang C., et al. Destabilized microbial networks with distinct performances of abundant and rare biospheres in maintaining networks under increasing salinity stress. iMeta. 2023;2:e79. doi: 10.1002/imt2.79. [DOI] [PMC free article] [PubMed] [Google Scholar]
- 63.Shi S., Nuccio E.E., Shi Z.J., et al. The interconnected rhizosphere: High network complexity dominates rhizosphere assemblages. Ecol. Lett. 2016;19:926–936. doi: 10.1111/ele.12630. [DOI] [PubMed] [Google Scholar]
- 64.Zhou J., Deng Y., Luo F., et al. Phylogenetic molecular ecological network of soil microbial communities in response to elevated CO2. mBio. 2011;2:e00122-11. doi: 10.1128/mBio.00122-11. [DOI] [PMC free article] [PubMed] [Google Scholar]
- 65.Hernandez D.J., David A.S., Menges E.S., et al. Environmental stress destabilizes microbial networks. ISME J. 2021;15:1722–1734. doi: 10.1038/s41396-020-00882-x. [DOI] [PMC free article] [PubMed] [Google Scholar]
- 66.Goberna M., Montesinos-Navarro A., Valiente-Banuet A., et al. Incorporating phylogenetic metrics to microbial co-occurrence networks based on amplicon sequences to discern community assembly processes. Mol. Ecol. Resour. 2019;19:1552–1564. doi: 10.1111/1755-0998.13079. [DOI] [PubMed] [Google Scholar]
- 67.Yuan M.M., Guo X., Wu L., et al. Climate warming enhances microbial network complexity and stability. Nat. Clim. Change. 2021;11:343–348. [Google Scholar]
- 68.Chen B., Zhang Z., Wang T., et al. Global distribution of marine microplastics and potential for biodegradation. J. Hazard Mater. 2023;451 doi: 10.1016/j.jhazmat.2023.131198. [DOI] [PubMed] [Google Scholar]
- 69.Zhang D., Ng E.L., Hu W., et al. Plastic pollution in croplands threatens long-term food security. Glob. Chang. Biol. 2020;26:3356–3367. doi: 10.1111/gcb.15043. [DOI] [PubMed] [Google Scholar]
- 70.Zhang J., Ren S., Xu W., et al. Effects of plastic residues and microplastics on soil ecosystems: A global meta-analysis. J. Hazard Mater. 2022;435 doi: 10.1016/j.jhazmat.2022.129065. [DOI] [PubMed] [Google Scholar]
- 71.Kuypers M.M.M., Marchant H.K., Kartal B. The microbial nitrogen-cycling network. Nat. Rev. Microbiol. 2018;16:263–276. doi: 10.1038/nrmicro.2018.9. [DOI] [PubMed] [Google Scholar]
- 72.Repo M.E., Susiluoto S., Lind S.E., et al. Large N2O emissions from cryoturbated peat soil in tundra. Nat. Geosci. 2009;2:189–192. [Google Scholar]
- 73.Camargo J.A., Alonso Á. Ecological and toxicological effects of inorganic nitrogen pollution in aquatic ecosystems: A global assessment. Environ. Int. 2006;32:831–849. doi: 10.1016/j.envint.2006.05.002. [DOI] [PubMed] [Google Scholar]
- 74.Seeley M.E., Song B., Passie R., et al. Microplastics affect sedimentary microbial communities and nitrogen cycling. Nat. Commun. 2020;11:2372. doi: 10.1038/s41467-020-16235-3. [DOI] [PMC free article] [PubMed] [Google Scholar]
- 75.Yu Y., Li X., Feng Z., et al. Polyethylene microplastics alter the microbial functional gene abundances and increase nitrous oxide emissions from paddy soils. J. Hazard Mater. 2022;432 doi: 10.1016/j.jhazmat.2022.128721. [DOI] [PubMed] [Google Scholar]
- 76.Su X., Yang L., Yang K., et al. Estuarine plastisphere as an overlooked source of N2O production. Nat. Commun. 2022;13:3884. doi: 10.1038/s41467-022-31584-x. [DOI] [PMC free article] [PubMed] [Google Scholar]
- 77.Jacob H., Besson M., Swarzenski P.W., et al. Effects of virgin micro- and nanoplastics on fish: Trends, meta-analysis, and perspectives. Environ. Sci. Technol. 2020;54:4733–4745. doi: 10.1021/acs.est.9b05995. [DOI] [PubMed] [Google Scholar]
- 78.Jack J.C., Gonet J., Mease A., et al. Traditional knowledge underlies One Health. Science. 2020;369:1576. doi: 10.1126/science.abe2401. [DOI] [PubMed] [Google Scholar]
Associated Data
This section collects any data citations, data availability statements, or supplementary materials included in this article.
Supplementary Materials
Data Availability Statement
The raw sequencing data from the field-collected samples have been deposited in the NCBI under accession identification numbers PRJNA717904 (for the amplicon sequencing data) and PRJNA984432 (for the metagenomic sequencing data). The sources of publicly available data are provided in Table S1. All of the data used in the analysis of this study are provided in Tables S2–S29. R scripts for key analyses in this study are available at https://github.com/Changchao-Li/global_plastisphere_ecology.