

Abstract
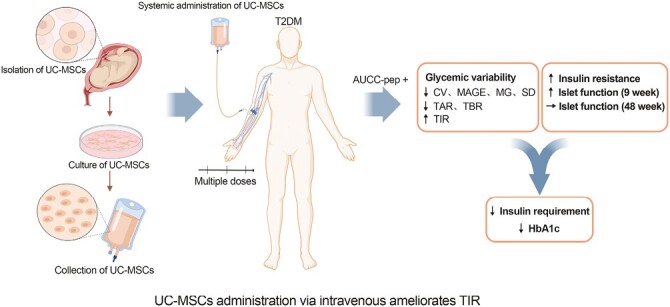
Umbilical cord-derived mesenchymal stem cells (UC-MSCs) have been proved a promising clinical strategy for the treatment of diabetes, and time in range (TIR) has been demonstrated a new metric of glycemic control links to diabetes complications. To further assess the therapeutic effect of UC-MSCs on TIR, a phase II study investigating the efficacy of UC-MSCs in Chinese adults with type 2 diabetes (T2D) assessed by retrospective continuous glucose monitoring (CGM) was conducted. In this randomized and placebo-controlled trial, a total of 73 patients were randomly assigned to receive intravenous infusion of UC-MSCs (n = 37) or placebo (n = 36) 3 times at 4-week intervals and followed up for 48 weeks. The primary endpoint was the changes in TIR and glycosylated hemoglobin (HbA1c). TIR and HbA1c were both significantly improved in UC-MSCs and placebo groups after 48 weeks of therapy compared with baseline. Compared with placebo group, UC-MSCs group exhibited more pronounced changes at 9 and 48 weeks from baseline in TIR (26.54 vs. 15.84 and 21.36 vs. 6.32) and HbA1c (−1.79 vs. −0.96 and −1.36 vs. −0.51). More patients in UC-MSCs group achieved the glycemic control target of TIR ≥ 70% and HbA1c < 7% at 9 and 48 weeks than in placebo group (59.5% vs. 27.8% and 43.2% vs. 11.1%). The C-peptide area under the curve (AUCC-pep) was an independent risk factor associated with efficacy in T2D undergoing UC-MSCs intervention. These results illustrate that UC-MSCs administration via intravenous infusion is an effective approach for ameliorating TIR.
Keywords: type 2 diabetes, umbilical cord-derived mesenchymal stem cells, glycosylated hemoglobin A1c, time in range, glycemic variability
Graphical Abstract
Graphical Abstract.
Significance Statement.
TIR which can reflect the glycemic variability throughout the day has been proved to be an effective supplement to HbA1c. As UC-MSCs approach clinical use for T2DM, its efficacy on TIR needs to be addressed. A randomized and placebo-controlled phase II trial was launched to determine the efficacy of UC-MSCs on TIR of T2DM and to explore the influencing factors. The data showed that UC-MSCs administration via intravenous infusion significantly increased TIR and male patients with higher AUCC-pep were more likely to benefit from UC-MSCs treatment. UC-MSCs transplantation could be a potential therapeutic approach for Chinese adults with T2DM.
Introduction
Type 2 diabetes (T2D) has become one of the common chronic diseases and a serious threat to human health worldwide. In China, 11.2% of adults suffer from diabetes, and the prediabetes prevalence rate is as high as 35.2%.1 Glycosylated hemoglobin (HbA1c) is the traditional method and gold standard for assessing glycemic control in patients with diabetes. However, it does not reflect glycemic variability, which has been proved to be closely related to both diabetic complications and cardiovascular disease outcomes.2,3 Oscillating glucose can have more deleterious effects than constant high glucose on endothelial function and oxidative stress, which are the two key players in the development of cardiovascular complications in individuals with diabetes.4 Therefore, ameliorating chronic hyperglycemia and minimizing glycemic variability are becoming increasingly recognized as the two important aspects of appropriate glycemic control.
Blood glucose monitoring is an important part of the comprehensive management of diabetes. Continuous glucose monitoring (CGM), one type of blood glucose monitoring technology, is becoming increasingly popular in clinical applications because it can provide complete data parameters reflecting the change in blood glucose levels throughout the day by providing ambulatory glucose profiles (AGPs). The main CGM metrics include glucose coefficient of variation (CV), mean amplitude of glycemic excursions (MAGE), mean glucose (MG), standard deviation (SD) of blood glucose values, mean percentage of time in target glucose range 70-179 mg/dL (ie, time in range, TIR), mean percentage of time with hyperglycemia ≥ 180 mg/dL (ie, time above range, TAR) and mean percentage of time with hypoglycemia < 70 mg/dL (ie, time below range, TBR).5 As a new accurate reflection of overall glycemic control, TIR has become an effective supplement to HbA1c and has been proved to be negatively correlated with diabetic chronic complications and cardiovascular death risk.6,7 At present, TIR has been listed as an effective indicator of blood glucose monitoring by the diabetes prevention and treatment guidelines of many countries.
Mesenchymal stem cell transplantation, a promising clinical strategy for the treatment of diabetes, ameliorates hyperglycemia by promoting pancreatic islet β-cell function and alleviating insulin resistance.8-10 Our previous prospective, single-center, randomized, double-blinded, placebo-controlled trial suggested that umbilical cord-derived mesenchymal stem cells (UC-MSCs) administration via intravenous infusion was a safe and effective approach that could reduce exogenous insulin requirements and alleviate insulin resistance in patients with T2D.11 Previous studies suggested that malglycemia (hypoglycemia, hyperglycemia, and/or glycemic variability) was associated with poor outcomes (increased infection, graft-versus-host disease, organ dysfunction, delayed engraftment and mortality) in both nondiabetic and diabetic hematopoietic stem cell transplant adult and pediatric/adolescent patients.12-14 These results indicated that minimizing glycemic variability was also necessary for stem cell transplantation. A prospective, phase II, open trial pilot study carried out by Debora B. Araujo showed that allogenic adipose tissue-derived stromal/stem cells and vitamin D supplementation for 3 months decreased the insulin requirement and HbA1c in patients with recent-onset type 1 diabetes (T1D), but did not affect pancreatic islet β-cell function, TIR, and metrics reflecting glycemic variability.15 However, no study has been carried out to evaluate the efficacy of UC-MSCs on TIR in T2D using CGM. Therefore, in this single-center, double-blinded, randomized, placebo-controlled trial, we used CGM to investigate the efficacy of UC-MSCs in Chinese adults with T2D.
Materials and Methods
Study Design and Participants
This prospective, single-center, randomized, double-blinded, and placebo-controlled trial was performed at the First Medical Center of Chinese PLA General Hospital (Beijing, China). The study protocol was approved by the Ethics Committee of the First Medical Center of Chinese PLA General Hospital (Approval No. 2013-107-01) and conformed to the Declaration of Helsinki guidelines. All participants provided written informed consent before recruitment. This study was registered on ClinicalTrials.gov (identifier: NCT02302599). Between October 2015 and December 2018, 73 subjects (aged between 20 and 65 years, body mass index of 24-40 kg/m², fasting C-peptide levels of ≥ 1 ng/mL, HbA1c levels between 7.0% and 12.0%, treated with stable insulin of 0.5-1.0 U/kg/day and metformin for ≥ 3 months) with T2D for less than 20 years were enrolled. These subjects were randomly assigned to receive intravenous infusion of UC-MSCs (100 mL) (n = 37) or the same volume and appearance of placebo (n = 36) at the elbow joint 3 times at an interval of 4 weeks. UC-MSCs at 4 passages were used in this study, and the total number of UC-MSCs for each transfusion was 1 × 10⁶/kg. Insulin requirement, HbA1c levels, fasting plasma glucose (FPG) levels, levels of fasting C-peptide (FCP), fold change in C-peptide levels (FFCP) stimulated by intravenous administration of 1 mg glucagon, C-peptide area under the curve (AUCC-pep) in the oral glucose tolerance test (OGTT, 6 points), and glucose infusion rate (GIR) measured by a hyperinsulinemic-euglycemic clamp (HEC), indicating that insulin resistance were assessed at baseline and preestablished follow-up time points (at 9 and 48 weeks) (Fig. 1). The potential risk of UC-MSCs transplantation was observed during treatment and follow-up. Insulin dose adjustments were made at each visit as necessary according to glycemic control. Both groups received the same diabetes education, nutritional recommendations, and help with management from healthcare providers.
Figure 1.
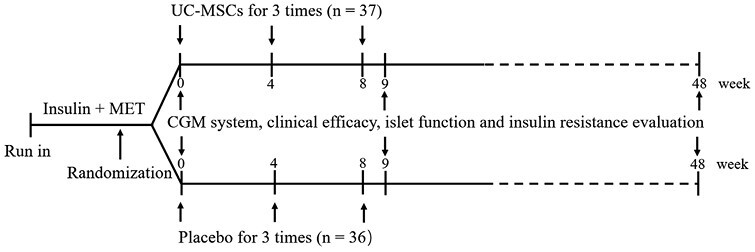
Study design. MET, metformin; UC-MSCs, umbilical cord-derived mesenchymal stem cells; CGM, continuous glucose monitoring.
The inclusion and exclusion criteria, randomization, masking, protocol for preparation and identification of UC-MSCs, and procedures for clinical assessment were reported in the previous study.11
CGM Metrics
A retrospective CGM system (Medtronic, Inc., Northridge, CA) was used for subcutaneous interstitial glucose monitoring for 3 consecutive days. We use retrospective CGM to avoid interference of experimental results caused by doctors and patients adjusting the lifestyle and insulin dosage based on real-time blood glucose results when using real-time CGM. It was performed at baseline (week 0: −3 days to week 0) and at 9 and 48 weeks (week 9 and 48: −3 days to weeks 9 and 48), and subjects were asked to wear the monitor for at least 72 h each time (Fig. 1). Glycemic variability was estimated by CV, MAGE, MG, SD of blood glucose values, TIR, TAR, and TBR. CV was calculated by dividing SD by the average of the corresponding glucose readings. The CV values in this article are multiplied by 100 and expressed as CV, %. MAGE was calculated by measuring the arithmetic mean of the difference between consecutive peaks and nadirs; measurement in the peak-to-nadir or nadir-to-peak direction was determined by the first qualifying excursion. Only excursions of more than 1 SD of the mean glycemic values were considered. MG was defined as the mean of daily continuous 24 h blood glucose levels. TIR was the percentage of time in the target glucose range of 3.9-10.0 mmol/L during a 24 h period. TBR or TAR was defined as the percentage of time in the glucose range of ≤ 3.9 mmol/L or ≥ 10 mmol/L during a 24 h period.
Endpoints
The primary endpoint was the changes in TIR and HbA1c. The secondary endpoints were changes in CV, MAGE, MG, SD, TAR, TBR, FCP, FFCP, AUCC-pep, GIR, and insulin requirement. The safety analysis mainly included the incidence of self-reported hypoglycemia and allergic reactions in the 2 groups.
Statistical Analysis
Because the present study was a pilot study, sample size calculation was not performed, and a convenience sample size was adopted. Statistical analyses were performed using SPSS software (version 26.0). Continuous data are expressed as the means ± standard deviations (SDs) when data followed a normal distribution or medians and interquartile ranges (IQRs) when they did not. Continuous variables at baseline were compared between the 2 groups by Student’s t test. Differences in the parameters before and after treatment were analyzed by the paired t test. Skewed variables were tested by the rank sum test. Comparisons of categorical variables between groups were performed by the chi-square test. Seven related risk factors, sex, age, duration of diabetes, BMI, HbA1c, TIR, and AUCC-pep, were analyzed using a multivariable logistic regression model. A P-value < .05 (2-tailed) was considered statistically significant.
Results
Baseline Characteristics
The characteristics of the participants are shown in Table 1. At baseline, there were no significant differences in clinical parameters, including age, sex, BMI, duration of diabetes, insulin requirement, metrics of glucose control (FPG and HbA1c), measures of insulin secretion (FCP, FFCP, and AUCC-pep), and insulin resistance (GIR) (all P > .05). Similarly, there were no significant differences in CGM parameters (CV, MAGE, MG, SD, TIR, TAR, and TBR) (all P > .05).
Table 1.
Clinical characteristics of the participants at baseline.
| Characteristics | UC-MSCs (N = 37) | Placebo (N = 36) | P-value |
|---|---|---|---|
| Age (years) | 50.97 ± 8.63 | 50.53 ± 8.33 | .823 |
| Sex (male) (%) | 64.86% | 72.22% | .499 |
| BMI (kg/m2) | 28.60 ± 3.45 | 28.22 ± 2.72 | .602 |
| Duration of diabetes (years) | 11.65 ± 4.21 | 11.56 ± 4.09 | .924 |
| Insulin dose (U/kg/day) | 0.72 ± 0.21 | 0.71 ± 0.15 | .882 |
| FPG (mmol/L) | 8.52 ± 2.05 | 8.59 ± 1.99 | .892 |
| HbA1c (%) | 8.84 ± 1.20 | 8.81 ± 1.06 | .928 |
| FCP (ng/mL) | 1.97 ± 0.72 | 1.98 ± 0.68 | .943 |
| FFCP (fold) | 1.88 ± 0.58 | 1.89 ± 0.27 | .909 |
| AUCC-pep (ng/h/mL) | 14.93 ± 4.84 | 15.08 ± 3.24 | .878 |
| GIR (mg/minute/kg) | 3.36 ± 1.50 | 3.30 ± 1.21 | .872 |
| CV (%) | 26.94 ± 6.34 | 26.71 ± 7.46 | .885 |
| MAGE (mmol/L) | 4.75 ± 1.95 | 4.39 ± 2.22 | .454 |
| MG (mmol/L) | 8.94 ± 1.77 | 8.77 ± 2.40 | .738 |
| SD (mmol/L) | 2.29 ± 0.68 | 2.14 ± 0.68 | .362 |
| TIR (%) | 58.16 ± 17.68 | 60.43 ± 17.40 | .582 |
| TAR (%) | 38.24 ± 19.87 | 37.44 ± 18.39 | .859 |
| TBR (%) | 0.40 (0.00-2.05) | 0.00 (0.00-4.75) | .499 |
Glycemic Control Measured by CGM
At week 9, the CGM parameters (CV, MAGE, MG, SD, TIR, and TAR) were significantly improved (all P < .01) and the TBR was reduced in UC-MSCs group when compared with baseline (p < .05). In placebo group, MG (p < 0.05), TIR (p < 0.01), and TAR (p < 0.01) were significantly improved compared with baseline, while the CV, MAGE, SD, and TBR were not changed (Table 2).
Table 2.
Clinical characteristics and CGM parameters of glucose variability in patients treated with UC-MSCs or placebo.
| Parameters | UC-MSCs (N = 37) | Placebo (N = 36) | ||||
|---|---|---|---|---|---|---|
| 0 weeks | 9 weeks | 48 weeks | 0 weeks | 9 weeks | 48 weeks | |
| Insulin dose (U/kg/day) | 0.72 ± 0.21 | 0.48 ± 0.17**,†† | 0.45 ± 0.25**,† | 0.71 ± 0.15 | 0.60 ± 0.16** | 0.57 ± 0.26** |
| HbA1c (%) | 8.84 ± 1.20 | 7.09 ± 0.73**,†† | 7.52 ± 1.07**,†† | 8.81 ± 1.06 | 7.75 ± 1.19** | 8.19 ± 1.02** |
| FCP (ng/mL) | 1.97 ± 0.72 | 2.07 ± 0.75 | 2.07 ± 0.70 | 1.98 ± 0.68 | 1.97 ± 0.65 | 1.86 ± 0.60 |
| FFCP (fold) | 1.88 ± 0.58 | 2.25 ± 0.66**,†† | 1.91 ± 0.54 | 1.89 ± 0.27 | 1.81 ± 0.30 | 1.81 ± 0.29 |
| AUCC-pep (ng/h/mL) | 14.93 ± 4.84 | 17.04 ± 5.45** | 16.23 ± 5.14* | 15.08 ± 3.24 | 15.28 ± 3.68 | 14.79 ± 3.67 |
| GIR (mg/minute/kg) | 3.36 ± 1.50 | 4.17 ± 1.79**,† | 4.76 ± 1.67**,†† | 3.30 ± 1.21 | 3.33 ± 1.31 | 3.60 ± 1.67 |
| CV (%) | 26.94 ± 6.34 | 20.67 ± 7.56**,† | 21.96 ± 7.80**,† | 26.71 ± 7.46 | 25.26 ± 7.37 | 25.98 ± 6.40 |
| MAGE (mmol/L) | 4.75 ± 1.95 | 3.23 ± 1.78** | 3.83 ± 2.32* | 4.39 ± 2.22 | 3.99 ± 1.75 | 4.20 ± 1.90 |
| MG (mmol/L) | 8.94 ± 1.77 | 6.98 ± 1.35**,† | 7.68 ± 1.80** | 8.77 ± 2.40 | 7.78 ± 1.91* | 8.43 ± 2.19 |
| SD (mmol/L) | 2.29 ± 0.68 | 1.69 ± 0.73**,† | 1.89 ± 0.78** | 2.14 ± 0.68 | 2.16 ± 1.36 | 2.24 ± 1.59 |
| TIR (%) | 58.16 ± 17.68 | 83.83 ± 13.27**,† | 79.00 ± 18.16**,†† | 60.43 ± 17.40 | 74.32 ± 19.35** | 68.02 ± 12.29** |
| TAR (%) | 38.24 ± 19.87 | 15.40 ± 13.42** | 19.18 ± 18.61**,†† | 37.44 ± 18.39 | 23.32 ± 20.02** | 29.80 ± 11.50** |
| TBR (%) | 0.40 (0.00-2.05) | 0.00 (0.00-0.75) * | 0.00 (0.00-2.00) | 0.00 (0.00-4.75) | 0.00 (0.00-2.68) | 0.55 (0.00-3.00) |
* P < .05 compared with baseline.
** P < .01 compared with baseline.
† P < .05 compared with the placebo group.
†† P < .01 compared with the placebo group.
At week 48, the CGM parameters (CV, MAGE, MG, SD, TIR, and TAR) were also significantly improved (all P < 0.01), but the TBR was not changed in UC-MSCs group when compared with baseline. In placebo group, TIR and TAR were also significantly improved (all P < .01) when compared with baseline, but the MG, CV, MAGE, SD, and TBR were not changed (Table 2).
We also compared the differences in the CGM metrics between the 2 groups at 9 and 48 weeks. At week 9, the CV, MG, SD, and TIR of the UC-MSCs group were higher than those of the placebo group (all P < .05). At week 48, the CV (P < .05), TIR (P < .01), and TAR (P < .01) of the UC-MSCs group were higher than those of the placebo group (Table 2).
We compared the CGM parameters change from baseline to weeks 9 and 48 between the 2 groups. Compared with the placebo group, the UC-MSCs group led to more pronounced improvements in CV, MAGE, MG, SD, and TIR at 9 weeks (all p < 0.05) and in CV, MAGE, MG, TIR, and TAR at 48 weeks (P < .01 of TIR and P < .05 of other metrics; Table 3).
Table 3.
Reduction in clinical characteristics and CGM parameters of glucose variability from baseline.
| Parameters | UC-MSCs (N = 37) | Placebo (N = 36) | ||||||
|---|---|---|---|---|---|---|---|---|
| 9 weeks | 48 weeks | 9 weeks | 48 weeks | |||||
| Changes | 95% CI | Changes | 95% CI | Changes | 95% CI | Changes | 95% CI | |
| Insulin dose (U/kg/day) | −0.24†† | −0.30 to −0.18 | −0.27 | −0.37 to −0.17 | −0.12 | −0.16 to −0.07 | −0.16 | −0.25 to −0.07 |
| HbA1c (%) | −1.79**,† | −2.19 to −1.40 | −1.36†† | −1.72 to −0.99 | −0.96* | −1.29 to −0.63 | −0.51 | −0.85 to −0.18 |
| FCP (ng/mL) | 0.11 | −0.10 to 0.32 | 0.10 | −0.13 to 0.32 | −0.02 | −0.24 to 0.21 | −0.17 | −0.40 to 0.07 |
| FFCP (fold) | 0.36**,†† | 0.18 to 0.55 | 0.04 | −0.08 to 0.17 | −0.06 | −0.16 to 0.04 | −0.09 | −0.23 to 0.04 |
| AUCC-pep (ng/h/mL) | 2.11†† | 1.26 to 2.96 | 1.29† | 0.01 to 2.57 | 0.20 | −0.92 to 1.32 | −0.29 | −1.36 to 0.78 |
| GIR (mg/minute/kg) | 0.80**,†† | 0.42 to 1.18 | 1.43†† | 0.99 to 1.88 | 0.13 | −0.31 to .57 | 0.37 | −0.14 to 0.89 |
| CV (%) | −6.27† | −9.24 to −3.31 | −5.29† | −8.22 to −2.36 | −1.12 | −4.69 to 2.44 | 0.55 | −2.74 to 3.84 |
| MAGE (mmol/L) | −1.58† | −2.28 to −0.87 | −1.13† | −2.01 to −0.25 | −0.18 | −1.09 to .74 | 0.14 | −0.77 to 1.04 |
| MG (mmol/L) | −1.80**,† | −3.30 to −0.43 | −1.09† | −2.68 to −0.36 | −0.32* | −1.75 to 0.30 | 0.04 | −1.06 to 1.19 |
| SD (mmol/L) | −0.58† | −1.28 to −0.06 | −0.41 | −0.84 to −0.05 | 0.00 | −0.78 to 0.60 | 0.03 | −0.88 to 0.71 |
| TIR (%) | 26.54*,† | 19.64 to 33.44 | 21.36†† | 13.42 to 29.30 | 15.84 | 10.12 to 21.56 | 6.32 | 0.91 to 11.74 |
| TAR (%) | −23.89 | −31.50 to −16.28 | −19.86† | −28.70 to −11.02 | −15.68 | −21.62 to −9.75 | −6.55 | −12.20 to −0.90 |
| TBR (%) | 0.00 | −1.55 to 0.05 | 0.00 | −1.00 to 1.35 | 0.00 | −1.00 to 0.38 | 0.00 | −1.77 to 2.68 |
* P < .05 compared with 48 weeks.
** P < .01 compared with 48 weeks.
† P < .05 compared with the placebo group.
†† P < .01 compared with the placebo group.
Changes in Glycemic Control Parameters, Pancreatic Islet β-Cell Function and Insulin Resistance
In terms of other clinical parameters, insulin requirement and HbA1c were significantly decreased in both the UC-MSCs group and the placebo group at 9 and 48 weeks compared with their values at baseline (all P < .01; Table 2). We also evaluated metrics of pancreatic islet β-cell function and insulin resistance in both groups. The results showed that the FFCP, AUCC-pep, and GIR of the UC-MSCs group at 9 weeks (all P < .01) and the AUCC-pep and GIR at 48 weeks (P < .05 of AUCC-pep and P < .01 of GIR) significantly increased compared with their values at baseline. The metrics of pancreatic islet β-cell function and insulin resistance in the placebo group did not change at either 9 or 48 weeks (Table 2).
The comparison of differences in clinical parameters, pancreatic islet β-cell function and insulin resistance between the 2 groups showed that the insulin requirement and HbA1c of the UC-MSCs group were lower than those of the placebo group (all P < .01), and the GIR of the UC-MSCs group was higher than that of the placebo group at both 9 (P < .05) and 48 weeks (P < .01). The FFCP of the UC-MSCs group was higher than that of the placebo group at 9 weeks (P < .01). There was no difference in FCP or AUCC-pep between the 2 groups at either 9 or 48 weeks (Table 2).
We also compared the reduction in clinical parameters, pancreatic islet β-cell function and insulin resistance from baseline between the 2 groups at both 9 and 48 weeks. Compared with the placebo group, the UC-MSCs group achieved more obvious improvements in insulin requirement, HbA1c, FFCP, AUCC-pep, and GIR at 9 weeks (P < .01 of insulin requirement, FFCP, AUCC-pep, GIR, and P < .05 of HbA1c) and in HbA1c, AUCC-pep, and GIR at 48 weeks (P < .01 of HbA1c, GIR and P < .05 of AUCC-pep) (Table 3).
Analyses in Patients With TIR ≥ 70% and HbA1c < 7%
Exploratory analyses were performed to explore which type of patients could benefit from UC-MSCs therapy. Compared with the placebo group, more patients in the UC-MSCs group achieved the glycemic control target of TIR ≥ 70% and HbA1c < 7% at 9 and 48 weeks (59.5% vs. 27.8% at 9 weeks and 43.2% vs. 11.1% at 48 weeks, all P < .01; Fig. 2). The comparison of relevant clinical parameters between the patients with TIR ≥ 70% and HbA1c < 7% (valid group) and patients with TIR < 70% or HbA1c ≥ 7% (invalid group) at 9 and 48 weeks after UC-MSCs intervention are shown in Supplementary Table S1. Compared with the invalid group, the valid group at 9 weeks had lower HbA1c and higher AUCC-pep, and the valid group at 48 weeks had lower HbA1c. According to univariate analysis, female sex (P = .002; odds ratio, 0.079), HbA1c (P = .032; odds ratio, 0.479), TIR (P = .003; odds ratio, 1.125), duration of diabetes (P = .041; odds ratio, 1.22) and AUCC-pep (P = .046; odds ratio, 1.188) were statistically significant factors related to efficacy at 9 weeks, and only the duration of diabetes (P = 0.025; odds ratio, 1.263) was a statistically significant factor related to efficacy at 48 weeks in T2D undergoing UC-MSCs intervention. According to multivariate analysis, female sex (P = 0.011; odds ratio, 0.026) and AUCC-pep (P = 0.033; odds ratio, 1.393) were statistically significant factors related to efficacy at 9 weeks, and no factor was found to be related to efficacy at 48 weeks in T2D undergoing UC-MSCs intervention (Table 4).
Figure 2.
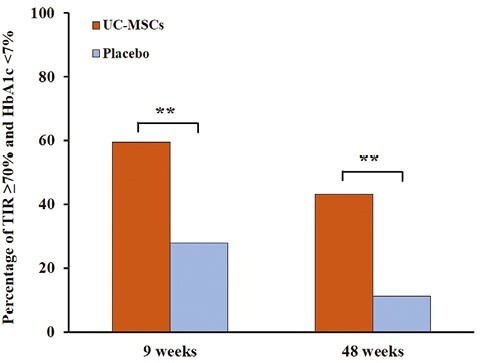
Percentage of patients with TIR ≥ 70% and HbA1c < 7%. Compared with the placebo group, more patients in the UC-MSCs group achieved the glycemic control target of TIR ≥ 70% and HbA1c < 7% both at 9 and 48 weeks.
Table 4.
Univariable and multivariable analyses of prognostic factors for valid group treated by UC-MSCs.
| 9 weeks of follow-up | 48 weeks of follow-up | |||||||
|---|---|---|---|---|---|---|---|---|
| Univariable analysis | Multivariable analysis | Univariable analysis | Multivariable analysis | |||||
| Parameter | OR (95% CI) | P-value | OR (95% CI) | P-value | OR (95% CI) | P-value | OR (95% CI) | P-value |
| Female | 0.079 (0.016-0.400) | .002 | 0.026 (0.002-0.436) | .011 | 0.444 (.107-1.846) | .264 | 1.157 (0.161-8.323) | .858 |
| Age | 1.023 (0.947-1.105) | .567 | 1.057 (0.925-1.208) | .411 | 1.029 (0.951-1.113) | .475 | 0.955 (0.849-1.073) | .437 |
| Duration of diabetes | 1.220 (1.008-1.476) | .041 | 1.343 (0.946-1.907) | .099 | 1.263 (1.030-1.548) | .025 | 1.322 (0.997-1.752) | .668 |
| BMI | 1.194 (0.937-1.521) | .151 | 1.035 (0.698-1.536) | .864 | 1.094 (0.899-1.332) | .369 | 1.054 (0.829-1.341) | .668 |
| HbA1c | 0.497 (0.262-0.940) | .032 | 1.129 (0.357-3.569) | .837 | 0.526 (0.270-1.028) | .060 | 0.738 (0.253-2.147) | .577 |
| TIR | 1.125 (1.040-1.218) | .003 | 1.011 (0.935-1.093) | .789 | 1.029 (0.989-1.072) | .156 | 1.016 (0.947-1.090) | .664 |
| AUCC-pep | 1.188 (1.003-1.406) | .046 | 1.393 (1.028-1.887) | .033 | 1.091 (0.946-1.258) | .230 | 1.056 (0.869-1.283) | .586 |
Safety
One female patient suffered from cerebral infarction 1 month after the 3rd UC-MSCs infusion. One male patient suffered from femoral neck fracture caused by an accident 3 months after the 3rd UC-MSCs infusion. These events were not considered to be related to UC-MSCs treatment as judged by an independent adjudication committee. The details were reported in the previous study.11
Discussion
This prospective, single-center, randomized, double-blinded, placebo-controlled trial showed that intravenous infusion of UC-MSCs at the elbow joint increased TIR, alleviated glycemic variability, decreased HbA1c levels, reduced daily insulin requirement, improved pancreatic islet β-cell function and ameliorated insulin resistance. AUCC-pep was an independent risk factor associated with efficacy in T2D undergoing UC-MSCs intervention, and male patients were more likely to benefit from UC-MSCs treatment. No major UC-MSCs transplantation-related adverse events occurred.
UC-MSCs have been proved to be a potential clinical therapeutic strategy for T2D because they have immunosuppressive, low-cost, pain-free, high-yield, rapid-collection, and nonimmunogenic characteristics. Three open-label clinical studies conducted by Liu X, Kong D, and Guan LX preliminarily confirmed the efficacy of UC-MSCs for the treatment of T2D.8-10 Consistent with these observations, our results indicated that intravenous infusion of UC-MSCs decreased HbA1c and insulin consumption, emphasizing the efficacy of UC-MSCs therapy in the treatment of T2D.
Animal studies showed that UC-MSCs reversed hyperglycemia by alleviating pancreatic islet β-cell dysfunction or ameliorating peripheral insulin resistance,16,17 while the results of the clinical trials were not consistent. The study conducted by Liu X showed that combined intravenous and intrapancreatic endovascular injection of UC-MSCs with a 5-day interval decreased HbA1c levels and improved plasma C-peptide levels and islet β-cell function,8 while another study conducted by Kong D indicated that UC-MSCs intravenously transfused 3 times did not significantly increase plasma C-peptide levels.9 Our results indicated that, compared with the placebo group, both AUCC-pep and GIR improved after UC-MSCs intravenous infusion at 9 and 48 weeks, indicating that UC-MSCs alleviated pancreatic islet dysfunction and ameliorated peripheral insulin resistance simultaneously, implying the attractive potential of UC-MSCs in the treatment of T2D.
HbA1c is currently established as the gold standard for the assessment of glycemic control, and optimal HbA1c is associated with decreased risks of diabetic complications in patients with diabetes.18,19 However, HbA1c differs among various ethnic groups and is unreliable in patients with anemia, hemoglobinopathies and pregnant women.20,21 Furthermore, HbA1c provides only an average glucose level over the previous 2-3 months and does not reflect individual distinct glucose profiles. CGM parameters, especially TIR, have become an acceptable intuitive index of optimal glycemic control with clinical significance. A study in a Chinese population demonstrated an HbA1c-independent association of TIR (assessed by CGM) with the prevalence of all stages of diabetic retinopathy (DR) in T2D, and TIR was related to the severity of DR.22 Another study carried out by this team also indicated an association of lower TIR with an increased risk of all-cause and cardiovascular disease (CVD) mortality among patients with T2D.7 Therefore, we evaluated TIR and other CGM metrics in each subject in the present study. We found that TIR and TAR of either the UC-MSCs group or the placebo group improved compared with their values at baseline, which mainly benefited from the adjustment of insulin dose according to blood glucose level. The UC-MSCs group exhibited more pronounced improvements in TIR than the placebo group at both 9 and 48 weeks, and the reduction in TAR in the UC-MSCs group was higher than that in the placebo group at 48 weeks. These results further confirmed the efficacy of UC-MSCs therapy for the treatment of T2D and preliminarily proved that UC-MSCs therapy could minimize glycemic variability. Our results are markedly better than those reported by Debora B. Araujo.15 We assume that this difference is mainly due to the heterogeneity of enrolled patients (T2D vs. T1D) and stem cell classification (UC-MSCs vs. allogenic adipose tissue-derived stromal/stem cells). The reduction in the TAR of the UC-MSCs group was higher than that of the placebo group at 9 weeks, while there were no significant differences. The same situation occurred for the results of TBR. A possible explanation could be the few samples and the skewed distribution of the data in the study.
TIR alone is not an adequate description of overall glycemic control, especially glycemic variability, which is closely associated with diabetes complications by inducing oxidative stress and endothelial dysfunction.23-25 Clinical investigations indicated that glycemic variability metrics assessed by CGM (ie, SD, CV, and MAGE) were specifically associated with microvascular complications (retinopathy, nephropathy and neuropathy) and cardiovascular outcomes,26-29 implying the importance of minimizing glycemic variability. The results of our study showed that SD, CV, and MAGE were significantly ameliorated after UC-MSCs intervention compared with baseline. The reduction in SD, CV, and MAGE at 9 weeks and CV and MAGE at 48 weeks in the UC-MSCs group was significantly higher than that in the placebo group. These results further confirmed the capability of UC-MSCs to diminish glycemic variability.
However, previous clinical studies showed that only 50%-70% of patients with T2D benefited from UC-MSCs therapy.8-10 Similar to the previous studies, our analysis demonstrated that 59.5% and 43.2% of the patients in the UC-MSCs group achieved glycemic control targets of TIR ≥ 70% and HbA1c < 7% at 9 and 48 weeks, respectively. Identifying the factors affecting the efficacy of UC-MSCs in the treatment of T2D is of great significance for the clinical application of this promising treatment strategy. The course of diabetes and FCP were previously considered possible risk factors associated with the validity for patients who received UC-MSCs treatment. While the FCP showed no difference between the valid and invalid groups at baseline in our study, we did not find that the duration of diabetes in the valid group was shorter than that in the invalid group. AUCC-pep was higher in the valid group than in the invalid group at baseline, and our multivariate analysis indicated that the AUCC-pep level at baseline was related to validity in T2D undergoing UC-MSCs treatment. FCP, FFCP, and AUCC-pep are representative indicators of pancreatic islet β-cell function. The first 2 indices reflect the insulin secretion ability of islet β-cells, while the latter index indicates the reserve capacity of islet β-cells, which we thought to be representative indicators of UC-MSCs efficacy. We must also pay attention to the fact that compared with FCP, the detection of AUCC-pep is more complex and time-consuming. However, we thought it to be necessary to evaluate AUCC-pep before UC-MSCs treatment because stem cell therapy is relatively expensive and cumbersome. Our results also showed that, compared with female patients, male patients were more likely to benefit from UC-MSCs treatment. Our results are not the same as those of previous studies, which can be attributed to the heterogeneity of the enrolled patients and the few samples in the treatment group.
To the best of our knowledge, this is the first study to evaluate the association between UC-MSCs treatment and glycemic variability. The main strength of this study is the double-blinded, randomized, placebo-controlled study design, which increases the reliability of our findings. This study had some limitations. First, this was a single-center trial that recruited a small number of Chinese patients. In addition, the measurement of TIR with 3-day CGM may not represent the historical glycemic control of the participants. Furthermore, the 3-day hospital-based CGM of all patients was studied under the same dietary conditions, while the dietary habits of the patients were not consistent outside the hospital during the 48 weeks of follow-up, which affected the consistency of HbA1c and TIR. Therefore, the results of our study should be interpreted with caution and might not be generalizable to all patients. Nevertheless, our study provides the basis for future well-controlled multicenter and large-scale prospective studies.
Conclusion
This prospective, single-center, randomized, double-blinded, placebo-controlled trial provided evidence that UC-MSCs administration via intravenous infusion is an effective approach for ameliorating TIR and glycemic variability.
Supplementary Material
Acknowledgments
The authors thank all the involved clinicians, nurses, and technicians for dedicating their time and skill to this study.
Contributor Information
Li Zang, Department of Endocrinology, The First Medical Center of Chinese PLA General Hospital, Beijing, China.
Yijun Li, Department of Endocrinology, The First Medical Center of Chinese PLA General Hospital, Beijing, China.
Haojie Hao, Department of Biotherapy, The First Medical Center of Chinese PLA General Hospital, Beijing, China.
Jiejie Liu, Department of Biotherapy, The First Medical Center of Chinese PLA General Hospital, Beijing, China.
Qian Zhang, Department of Endocrinology, The First Medical Center of Chinese PLA General Hospital, Beijing, China.
Fei Gao, Department of Endocrinology, The First Medical Center of Chinese PLA General Hospital, Beijing, China.
Haibin Wang, Department of Endocrinology, The First Medical Center of Chinese PLA General Hospital, Beijing, China.
Yulong Chen, Department of Endocrinology, The First Medical Center of Chinese PLA General Hospital, Beijing, China.
Weijun Gu, Department of Endocrinology, The First Medical Center of Chinese PLA General Hospital, Beijing, China.
Jin Du, Department of Endocrinology, The First Medical Center of Chinese PLA General Hospital, Beijing, China.
Junhua Meng, Department of Endocrinology, The First Medical Center of Chinese PLA General Hospital, Beijing, China.
Saichun Zhang, Department of Endocrinology, The First Medical Center of Chinese PLA General Hospital, Beijing, China.
Zhaohui Lyu, Department of Endocrinology, The First Medical Center of Chinese PLA General Hospital, Beijing, China.
Jingtao Dou, Department of Endocrinology, The First Medical Center of Chinese PLA General Hospital, Beijing, China.
Yiming Mu, Department of Endocrinology, The First Medical Center of Chinese PLA General Hospital, Beijing, China.
Conflict of Interest
The authors indicated no potential conflicts of interest.
Funding
This study was supported by Beijing Natural Science Foundation (grant no. 7232148), the National Key Research and Development Program of China (grant no. 2021YFC2701901).
Data Availability
The datasets generated and analyzed during the present study are available from the corresponding author on reasonable request.
Author Contributions
L.Z. and Y.M.: provided conception and design of studies, financial support, collection of data, data analysis and interpretation, manuscript writing, final approval of manuscript; H.H. and J.L.: provided preparation and monitoring of stem cells; Y.L., Q.Z., F.G., H.W., Y.C., W.G., J.D., J.M., S.Z.: provided collection and/or assembly of data, data analysis and interpretation; Z.L., J.D.: provided final approval of manuscript; Y.L.: provided conception and design of studies, manuscript writing, final approval of manuscript.
References
- 1. Li Y, Teng D, Shi X, et al. Prevalence of diabetes recorded in mainland China using 2018 diagnostic criteria from the American Diabetes Association: national cross sectional study. BMJ. 2020;369:m997. 10.1136/bmj.m997 [DOI] [PMC free article] [PubMed] [Google Scholar]
- 2. Hu YM, Zhao LH, Zhang XL, et al. Association of glycaemic variability evaluated by continuous glucose monitoring with diabetic peripheral neuropathy in type 2 diabetic patients. Endocrine. 2018;60(2):292-300. 10.1007/s12020-018-1546-z [DOI] [PubMed] [Google Scholar]
- 3. Wang X, Zhao X, Dorje T, et al. Glycemic variability predicts cardiovascular complications in acute myocardial infarction patients with type 2 diabetes mellitus. Int J Cardiol. 2014;172(2):498-500. 10.1016/j.ijcard.2014.01.015 [DOI] [PubMed] [Google Scholar]
- 4. Ceriello A, Esposito K, Piconi L, et al. Oscillating glucose is more deleterious to endothelial function and oxidative stress than mean glucose in normal and type 2 diabetic patients. Diabetes. 2008;57(5):1349-1354. 10.2337/db08-0063 [DOI] [PubMed] [Google Scholar]
- 5. Battelino T, Danne T, Bergenstal RM, et al. Clinical targets for continuous glucose monitoring data interpretation: recommendations from the international consensus on time in range. Diabetes Care. 2019;42(8):1593-1603. 10.2337/dci19-0028 [DOI] [PMC free article] [PubMed] [Google Scholar]
- 6. Saboo B, Kesavadev J, Shankar A, et al. Time-in-range as a target in type 2 diabetes: an urgent need. Heliyon. 2021;7(1):e05967. 10.1016/j.heliyon.2021.e05967 [DOI] [PMC free article] [PubMed] [Google Scholar]
- 7. Lu J, Wang C, Shen Y, et al. Time in range in relation to all-cause and cardiovascular mortality in patients with type 2 diabetes: a prospective cohort study. Diabetes Care. 2021;44(2):549-555. 10.2337/dc20-1862 [DOI] [PMC free article] [PubMed] [Google Scholar]
- 8. Liu X, Zheng P, Wang X, et al. A preliminary evaluation of efficacy and safety of Wharton’s jelly mesenchymal stem cell transplantation in patients with type 2 diabetes mellitus. Stem Cell Res Ther. 2014;5(2):57. 10.1186/scrt446 [DOI] [PMC free article] [PubMed] [Google Scholar]
- 9. Kong D, Zhuang X, Wang D, et al. Umbilical cord mesenchymal stem cell transfusion ameliorated hyperglycemia in patients with type 2 diabetes mellitus. Clin Lab. 2014;60(12):1969-1976. 10.7754/clin.lab.2014.140305 [DOI] [PubMed] [Google Scholar]
- 10. Guan LX, Guan H, Li HB, et al. Therapeutic efficacy of umbilical cord-derived mesenchymal stem cells in patients with type 2 diabetes. Exp Ther Med. 2015;9(5):1623-1630. 10.3892/etm.2015.2339 [DOI] [PMC free article] [PubMed] [Google Scholar]
- 11. Zang L, Li Y, Hao H, et al. Efficacy and safety of umbilical cord-derived mesenchymal stem cells in Chinese adults with type 2 diabetes: a single-center, double-blinded, randomized, placebo-controlled phase II trial. Stem Cell Res Ther. 2022;13(1):180. 10.1186/s13287-022-02848-6 [DOI] [PMC free article] [PubMed] [Google Scholar]
- 12. Hammer MJ, Casper C, Gooley TA, et al. The contribution of malglycemia to mortality among allogeneic hematopoietic cell transplant recipients. Biol Blood Marrow Transplant. 2009;15(3):344-351. 10.1016/j.bbmt.2008.12.488 [DOI] [PMC free article] [PubMed] [Google Scholar]
- 13. Storey S, Von Ah D.. Impact of malglycemia on clinical outcomes in hospitalized patients with cancer: a review of the literature. Oncol Nurs Forum. 2012;39(5):458-465. 10.1188/12.ONF.458-465 [DOI] [PubMed] [Google Scholar]
- 14. Sopfe J, Pyle L, Keating AK, et al. Malglycemia is associated with poor outcomes in pediatric and adolescent hematopoietic stem cell transplant patients. Blood Adv. 2019;3(3):350-359. 10.1182/bloodadvances.2018021014 [DOI] [PMC free article] [PubMed] [Google Scholar]
- 15. Araujo DB, Dantas JR, Silva KR, et al. Allogenic adipose tissue-derived stromal/stem cells and vitamin D supplementation in patients with recent-onset type 1 diabetes mellitus: a 3-month follow-up pilot study. Front Immunol. 2020;11:993. 10.3389/fimmu.2020.00993 [DOI] [PMC free article] [PubMed] [Google Scholar]
- 16. Yin Y, Hao H, Cheng Y, et al. Human umbilical cord-derived mesenchymal stem cells direct macrophage polarization to alleviate pancreatic islets dysfunction in type 2 diabetic mice. Cell Death Dis. 2018;9(7):760. 10.1038/s41419-018-0801-9 [DOI] [PMC free article] [PubMed] [Google Scholar]
- 17. Xie Z, Hao H, Tong C, et al. Human umbilical cord-derived mesenchymal stem cells elicit macrophages into an anti-inflammatory phenotype to alleviate insulin resistance in type 2 diabetic rats. Stem Cells. 2016;34(3):627-639. 10.1002/stem.2238 [DOI] [PubMed] [Google Scholar]
- 18. UK Prospective Diabetes Study (UKPDS) Group. Intensive blood-glucose control with sulphonylureas or insulin compared with conventional treatment and risk of complications in patients with type 2 diabetes (UKPDS 33). Lancet. 1998;352(9131):837-853. [PubMed] [Google Scholar]
- 19. Nathan DM, Genuth S, Lachin J, et al. The effect of intensive treatment of diabetes on the development and progression of long-term complications in insulin-dependent diabetes mellitus. N Engl J Med. 1993;329(14):977-986. [DOI] [PubMed] [Google Scholar]
- 20. Bergenstal RM, Gal RL, Connor CG, et al. Racial differences in the relationship of glucose concentrations and hemoglobin A1c levels. Ann Intern Med. 2017;167(2):95-102. 10.7326/M16-2596 [DOI] [PubMed] [Google Scholar]
- 21. Danne T, Nimri R, Battelino T, et al. International consensus on use of continuous glucose monitoring. Diabetes Care. 2017;40(12):1631-1640. 10.2337/dc17-1600 [DOI] [PMC free article] [PubMed] [Google Scholar]
- 22. Lu J, Ma X, Zhou J, et al. Association of time in range, as assessed by continuous glucose monitoring, with diabetic retinopathy in type 2 diabetes. Diabetes Care. 2018;41(11):2370-2376. 10.2337/dc18-1131 [DOI] [PubMed] [Google Scholar]
- 23. Brownlee M, Hirsch IB.. Glycemic variability: a hemoglobin A1c-independent risk factor for diabetic complications. JAMA. 2006;295(14):1707-1708. 10.1001/jama.295.14.1707 [DOI] [PubMed] [Google Scholar]
- 24. Horváth EM, Benko R, Kiss L, et al. Rapid “glycaemic swings” induce nitrosative stress, activate poly(ADP-ribose) polymerase and impair endothelial function in a rat model of diabetes mellitus. Diabetologia. 2009;52(5):952-961. 10.1007/s00125-009-1304-0 [DOI] [PubMed] [Google Scholar]
- 25. Quagliaro L, Piconi L, Assaloni R, et al. Intermittent high glucose enhances apoptosis related to oxidative stress in human umbilical vein endothelial cells: the role of protein kinase C and NAD(P)H-oxidase activation. Diabetes. 2003;52(11):2795-2804. 10.2337/diabetes.52.11.2795 [DOI] [PubMed] [Google Scholar]
- 26. Sartore G, Chilelli NC, Burlina S, Lapolla A.. Association between glucose variability as assessed by continuous glucose monitoring (CGM) and diabetic retinopathy in type 1 and type 2 diabetes. Acta Diabetol. 2013;50(3):437-442. 10.1007/s00592-013-0459-9 [DOI] [PubMed] [Google Scholar]
- 27. Low S, Lim SC, Yeoh LY, et al. Effect of long-term glycemic variability on estimated glomerular filtration rate decline among patients with type 2 diabetes mellitus: insights from the Diabetic Nephropathy Cohort in Singapore. J Diabetes. 2017;9(10):908-919. 10.1111/1753-0407.12512 [DOI] [PubMed] [Google Scholar]
- 28. Zhang X, Yang X, Sun B, Zhu C.. Perspectives of glycemic variability in diabetic neuropathy: a comprehensive review. Commun Biol. 2021;4(1):1366. 10.1038/s42003-021-02896-3 [DOI] [PMC free article] [PubMed] [Google Scholar]
- 29. Su G, Mi S, Tao H, et al. Association of glycemic variability and the presence and severity of coronary artery disease in patients with type 2 diabetes. Cardiovasc Diabetol. 2011;10:19. 10.1186/1475-2840-10-19 [DOI] [PMC free article] [PubMed] [Google Scholar]
Associated Data
This section collects any data citations, data availability statements, or supplementary materials included in this article.
Supplementary Materials
Data Availability Statement
The datasets generated and analyzed during the present study are available from the corresponding author on reasonable request.