

Summary
Genome-wide association studies (GWASs) have identified tens of thousands of genetic loci associated with human complex traits. However, the majority of GWASs were conducted in individuals of European ancestries. Failure to capture global genetic diversity has limited genomic discovery and has impeded equitable delivery of genomic knowledge to diverse populations. Here we report findings from 102,900 individuals across 36 human quantitative traits in the Taiwan Biobank (TWB), a major biobank effort that broadens the population diversity of genetic studies in East Asia. We identified 968 novel genetic loci, pinpointed novel causal variants through statistical fine-mapping, compared the genetic architecture across TWB, Biobank Japan, and UK Biobank, and evaluated the utility of cross-phenotype, cross-population polygenic risk scores in disease risk prediction. These results demonstrated the potential to advance discovery through diversifying GWAS populations and provided insights into the common genetic basis of human complex traits in East Asia.
Keywords: Taiwan Biobank, cross-ancestry GWAS, quantitative traits, multi-polygenic score prediction
Graphical abstract
Highlights
-
•
The Taiwan Biobank (TWB) is a prospective study with health and multi-omics data
-
•
Genome-wide analysis in TWB for 36 quantitative traits identified 968 novel loci
-
•
Differences in genetic architecture were observed in TWB, Biobank Japan, and UK Biobank
-
•
Polygenic prediction for disease onset was enhanced by cross-population biomarker GWAS
Chen, Chen, Feng, Yu, Lin, et al. reported findings from genome-wide analysis in 102,900 Taiwan Biobank (TWB) participants across 36 human quantitative traits. A total of 1,986 significant loci were identified, and comparative analyses with Biobank Japan, UK Biobank, and previous GWASs revealed 968 novel loci. We also showed the utility of cross-phenotype, cross-population polygenic risk scores in disease risk prediction. These results highlight the potential to advance gene discovery with diverse populations.
Introduction
Biobanks, which link biological samples from consented participants to their electronic medical records, survey questionnaires, and other health-related datasets, provide pivotal resources for biomedical research. Genetic studies enabled by biobanks have provided insights into the biological mechanisms of human diseases and health-related outcomes1,2 and have driven critical scientific discoveries that alleviate disease burden and improve public health.3,4,5,6,7 However, to date, the vast majority of biobank participants are of European (EUR) genetic ancestries, which only captures a small proportion of the global population. Failure to capture human genetic diversity has posed significant limitations in our understanding of the genetic architecture of complex traits and diseases in non-European populations and has impeded equitable delivery of genomic discoveries.8,9,10,11
In East Asian (EAS) populations, Biobank Japan (BBJ)5,12,13,14 has made important discoveries and publicly released genome-wide association summary statistics, thereby facilitating numerous other genetic studies. However, BBJ’s sample size remains relatively small compared with European biobanks (e.g., the UK Biobank [UKBB]) and only covers <10% of EAS populations. Expanding the scale and diversity of EAS biobanks is needed to advance gene discovery and gain insights into the comparative genetic architecture of complex traits and diseases within East Asia. As the Han Chinese population has the largest representation in East Asia (with a population of 1.4 billion out of 1.6 billion EAS people in total), a biobank of participants representative of Han Chinese ancestries, spanning a range of health-related outcomes with publicly available genome-wide association study (GWAS) summary statistics, will make a critical contribution to alleviating the ancestry bias in genetic studies.
Here we present genome-wide analyses for 36 quantitative traits in the Taiwan Biobank (TWB), a prospective cohort study of the Taiwanese population with multi-omics genomic data and longitudinal phenotypic and environmental measures (see https://www.twbiobank.org.tw/, https://www.biobank.org.tw/, and Feng et al.6 for more information). We first performed GWAS for the 36 traits in TWB, and we fine-mapped all genome-wide significant loci to identify putative causal variants. To expand our understanding of the genetic architectures of these quantitative traits across populations, we leveraged GWAS summary statistics from BBJ as well as UKBB and large consortium studies (with samples of European ancestries) for SNP-based heritability and genetic correlation analyses. We further meta-analyzed TWB and BBJ to maximize the power for genetic discovery in EAS populations. Lastly, we demonstrated that integrating biomarker GWAS across different populations can improve polygenic prediction for disease risk.
Results
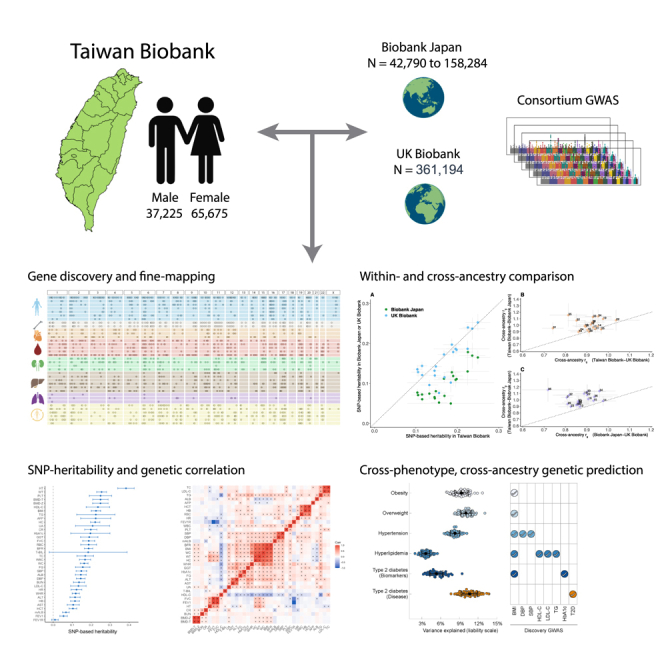
TWB genotyping was performed using two different customized genome-wide arrays.15 A total of 27,719 participants genotyped on the TWBv1 array and 83,207 participants genotyped on the TWBv2 array were included in this study and subsequently went through genotype quality control (QC) and imputation. Figure 1 provides an overview of the TWB samples, the traits examined, their abbreviations, and the analyses conducted in this study (Table S1).
Figure 1.

Overview of the Taiwan Biobank sample and analysis
The abbreviations and index numbers for the 36 quantitative traits examined in this study are used throughout the text, tables, and figures. The sample size noted in the figure reflects the final analytical sample size after genotype quality control and imputation. Created with BioRender.com.
After stringent QC, we performed GWAS on 36 quantitative traits (Figures 2A, S2, and S36 and Tables S1 and S2) in 92,615 individuals with imputed genotype data across the two genotyping arrays (STAR Methods). We selected these traits as they are intermediate phenotypes or potential biomarkers relevant to an individual’s health and disease status. We used Regenie,16 a two-step whole-genome regression method for genetic association tests that accounts for sample relatedness and population structure, to perform association analyses on the two discovery batches (27,033 and 65,582 individuals) separately. LD score regression (LDSC)17 intercept, λGC, and λ1000 showed that there was negligible inflation due to population stratification in these GWASs (Table S3). All traits had highly consistent genetic architectures across the two discovery batches, as shown by the high between-batch genetic correlations (rg) estimated by LDSC18 (median = 1.028; Table S3). We then meta-analyzed discovery batch 1 and 2 GWASs using an inverse-variance-weighted fixed-effect approach.19 Using FUMA20 with the 1000 Genomes Project (1KG)21 phase 3 EAS samples as the linkage disequilibrium (LD) reference, we identified 1,986 independent genome-wide significant loci (p value < 5.0 × 10⁻⁸) across 36 traits (Tables S2 and S3), among which 1,332 loci survived Bonferroni correction for the number of traits tested (p value < 5 × 10⁻⁸/36 = 1.39 × 10⁻⁹). The number of genome-wide significant loci per trait ranged from 2 for FEV1 to forced vital capacity ratio (FEV1R) to 229 for height (HT), with a median of 48 loci per trait (Table S3). Using LDSC,17,18 we estimated the SNP-based heritability (h2g) for each trait (Figure 2B; Table S4), which ranged from 0.009 (FEV1R) to 0.384 (HT), and pairwise rg between these traits (Figure 2C; Table S5), which identified clusters of highly genetically correlated traits (e.g., body fat rate [BFR], body mass index [BMI], WT, waist circumference [WC], hip circumference [HC], and waist-to-hip ratio [WHR]). We note that all TWB GWAS summary statistics are publicly available on GWAS Catalog (see data and code availability).
Figure 2.

GWAS results for 36 quantitative traits in the Taiwan Biobank (TWB)
(A) A summary of genome-wide significant loci associated with the 36 traits in TWB identified by whole-genome linear regression implemented in Regenie (two-sided score test for genetic association, controlling for age, age2, sex, age by sex interaction, age2 by sex interaction, and top 20 PCs). Each row of the plot represents a single trait, with traits within the same category grouped by the same color. Each dot represents a genome-wide significant locus (p value < 5 × 10⁻⁸). The most pleiotropic genes identified in this study are annotated (see Figure 4B). Manhattan plots and Q-Q plots for each trait are in Figures S1, S2, and S36.
(B) SNP-based heritability (h2g) for the 36 traits in TWB estimated using univariate LD score regression (LDSC) based on association test statistics from linear regression (see STAR Methods). Abbreviations of the traits are listed in Figure 1. The complete set of h2g estimates and standard errors is available in Table S4. The unusually large confidence interval (CI) of the h2g estimate for total bilirubin (T-BIL) is driven by a Mendelian locus on chromosome 2, harboring the UGT1A1 gene. Modeling the signal in this locus as a fixed effect and removing the locus from the LDSC analysis produced a similar point estimate of h2g with a much smaller CI (see STAR Methods).
(C) Pairwise genetic correlations (rg) between the 36 traits in TWB estimated using bivariate LDSC based on association test statistics from linear regression (see STAR Methods). Significant rg after false discovery rate correction is indicated by a cross sign (two-sided Wald test). The complete set of rg estimates, including standard errors and p values, is available in Table S5.
To follow-up on the findings in TWB, we fine-mapped genome-wide significant loci on autosomal chromosomes using SuSiE22,23 (STAR Methods). Of the 1,907 autosomal loci consolidated across traits (Table S6), 1,615 were fine-mapped to a total of 1,972 credible sets, each representing an independent association signal (292 loci failed to identify a reliable credible set that passed QC thresholds; see STAR Methods). Out of the 1,972 credible sets, 232 were mapped to a single variant with posterior inclusion probability (PIP) > 95%, among which 24 were coding (Table 1 and Table S7). These 24 coding variants were all missense variants, which showed a significant 9.8-fold enrichment (p value < 1 × 10⁻¹⁶) when compared to variants in the fine-mapped loci used as background, highlighting the crucial role of missense variants in the quantitative traits investigated in this study. We next focused on these missense variants as in other studies,24 because compared with non-coding variants, missense variants are more clearly linked to genes with their functional consequences and are thus more actionable. We found all missense variants with PIP >95% in TWB have the same direction of effect as in BBJ and/or UKBB if available. All associations with these missense variants were replicated at study-wide significance in UKBB (p value < 0.05/15 = 0.0033), and all but four were replicated in BBJ (p value < 0.05/21 = 0.0024). The four associations that failed to reach the study-wide significance threshold in BBJ were driven by two variants, which had substantially lower allele frequencies, and thus statistical power, in BBJ (rs146340667: 1.7% in TWB and 0.45% in BBJ; rs2296651: 9.5% in TWB and 1.1% in BBJ). These putative causal missense variants not only replicated previous findings (e.g., T1412N in CPS1 for PLT25 and V174A in SLCO1B1 for T-BIL26), but they also represented novel causal variants in well-known genes (e.g., R103W in EXOC3L4 for GGT27) and implicated novel genes (e.g., D1171N in RREB1 for BMD-T and BMD-Z). Some of these high-PIP missense variants were also highly pleiotropic (e.g., S267F in SLC10A1 is associated with gamma-glutamyltransferase [GGT], low-density lipoprotein cholesterol [LDL-C], and total cholesterol [TC]), suggesting their roles in multiple complex traits.
Table 1.
Fine-mapped missense variants with posterior inclusion probability (PIP) > 0.95 in the Taiwan Biobank
| Trait | Chr | Variant | Position | Reference | ALT | Allele freq (EAS) | Allele freq (EUR) | Marginal beta | SE | p value | PIP | BBJ p value |
UKBB p value |
Gene | Amino acid change |
|---|---|---|---|---|---|---|---|---|---|---|---|---|---|---|---|
| TG | 2 | rs1260326 | 27730940 | T | C | 0.501 | 0.590 | 0.137 | 0.005 | 7.80E-191 | 1.00 | 6.60E-102 | 2.50E-418 | GCKR | Leu256Pro |
| PLT | 2 | rs1047891 | 211540507 | A | C | 0.156 | 0.316 | −0.048 | 0.006 | 4.60E-14 | 0.98 | 1.60E-05 | 2.90E-44 | CPS1 | Thr1412Asn |
| BMD-T | 6 | rs9379084 | 7231843 | A | G | 0.156 | 0.119 | −0.055 | 0.007 | 1.70E-14 | 0.99 | no GWAS | no GWAS | RREB1 | Asp1171Asn |
| BMD-Z | 6 | rs9379084 | 7231843 | A | G | 0.156 | 0.119 | −0.055 | 0.007 | 1.10E-14 | 0.99 | no GWAS | no GWAS | RREB1 | Asp1171Asn |
| FG | 6 | rs146340667 | 39040708 | A | G | 7.51E-03 | 0.00E+00 | −0.145 | 0.022 | 8.90E-11 | 1.00 | 9.20E-02 | low MAF | GLP1R | Val194Ile |
| HbA1C | 7 | rs2233580 | 127253550 | T | C | 9.25E-02 | 4.41E-05 | 0.098 | 0.008 | 2.60E-37 | 1.00 | 4.30E-21 | low MAF | PAX4 | Arg192His |
| HT | 8 | rs12541381 | 135649848 | A | G | 0.301 | 0.249 | −0.039 | 0.005 | 1.30E-14 | 1.00 | 1.00E-13 | 3.40E-43 | ZFAT | Pro90Ser |
| LDL-C | 11 | rs11601507 | 5701074 | A | C | 0.090 | 0.073 | 0.059 | 0.008 | 3.90E-13 | 1.00 | 1.10E-03 | 4.40E-13 | TRIM5 | Val112Phe |
| TC | 11 | rs11601507 | 5701074 | A | C | 0.090 | 0.073 | 0.054 | 0.008 | 3.30E-11 | 0.99 | 9.80E-04 | 2.70E-07 | TRIM5 | Val112Phe |
| T-BIL | 12 | rs4149056 | 21331549 | C | T | 0.128 | 0.159 | 0.154 | 0.007 | 1.00E-96 | 1.00 | 3.40E-53 | 1.40E-638 | SLCO1B1 | Val174Ala |
| HT | 12 | rs2277339 | 57146069 | G | T | 0.219 | 0.104 | −0.040 | 0.006 | 6.20E-12 | 1.00 | 4.20E-17 | 1.90E-10 | PRIM1 | Asp5Ala |
| TC | 12 | rs1169288 | 121416650 | C | A | 0.411 | 0.328 | 0.044 | 0.005 | 2.80E-20 | 0.99 | 1.10E-11 | 2.00E-25 | HNF1A | Ile27Leu |
| GGT | 14 | rs2296651 | 70245193 | A | G | 7.08E-02 | 1.47E-05 | 0.061 | 0.008 | 1.60E-14 | 0.97 | 7.00E-02 | low MAF | SLC10A1 | Ser267Phe |
| LDL-C | 14 | rs2296651 | 70245193 | A | G | 7.08E-02 | 1.47E-05 | −0.072 | 0.008 | 1.50E-19 | 1.00 | 3.00E-01 | low MAF | SLC10A1 | Ser267Phe |
| TC | 14 | rs2296651 | 70245193 | A | G | 7.08E-02 | 1.47E-05 | −0.072 | 0.008 | 1.00E-19 | 1.00 | 8.20E-01 | low MAF | SLC10A1 | Ser267Phe |
| GGT | 14 | rs200884137 | 103576369 | T | C | 1.40E-02 | 2.94E-05 | −0.322 | 0.028 | 9.80E-31 | 0.99 | 2.70E-88 | low MAF | EXOC3L4 | Arg103Trp |
| HT | 15 | rs3817428 | 89415247 | G | C | 0.128 | 0.267 | −0.050 | 0.008 | 5.20E-11 | 1.00 | 3.70E-14 | 4.10E-56 | ACAN | Asp2335Glu |
| HDL-C | 16 | rs2303790 | 57017292 | G | A | 2.72E-02 | 8.82E-05 | 0.490 | 0.014 | 1.70E-272 | 1.00 | 5.50E-206 | low MAF | CETP | Asp394Gly |
| ALB | 17 | rs11552708 | 7462555 | A | G | 0.325 | 0.118 | 0.047 | 0.005 | 2.10E-20 | 1.00 | 3.30E-05 | 1.00E-17 | TNFSF13 | Gly67Arg |
| TG | 19 | rs58542926 | 19379549 | T | C | 0.075 | 0.072 | −0.105 | 0.010 | 2.10E-28 | 1.00 | 3.50E-15 | 1.70E-127 | TM6SF2 | Glu167Lys |
| HDL-C | 19 | rs429358 | 45411941 | C | T | 0.097 | 0.138 | −0.132 | 0.008 | 6.50E-56 | 1.00 | 2.90E-30 | 1.20E-127 | APOE | Cys156Arg |
| HDL-C | 19 | rs686335 | 54754989 | T | G | 0.283 | 0.454 | −0.029 | 0.005 | 3.80E-10 | 1.00 | missing | 7.80E-14 | LILRB5 | Glu549Ala |
| HDL-C | 20 | rs1800961 | 43042364 | T | C | 0.013 | 0.030 | −0.143 | 0.020 | 2.90E-13 | 1.00 | 5.70E-06 | 3.00E-95 | HNF4A | Thr139Ile |
| TC | 20 | rs1800961 | 43042364 | T | C | 0.013 | 0.030 | −0.115 | 0.020 | 5.60E-09 | 1.00 | 6.80E-08 | 2.20E-44 | HNF4A | Thr139Ile |
Base pair position is in hg19. Allele freq (EAS) and Allele freq (EUR) are the allele frequencies of the reference allele (REF column) in East Asian and European populations, calculated using the East Asian and non-Finnish European samples in gnomAD v3.1.2, respectively. Marginal beta is the marginal effect size of the reference allele. BBJ and UKBB p values for each variant were extracted from the BBJ and UKBB GWASs, respectively. No GWAS: GWAS of the trait has not been conducted in BBJ or UKBB. Missing: the fine-mapped missense variant was not present in the GWAS. Low MAF: minor allele frequency <0.1%. For UKBB, seven variants had MAF <0.1% and thus were not included in the GWAS (labeled as “low MAF”). Full fine-mapping results are available in Table S7.
Prior studies have shown that complex traits and diseases are genetically correlated at different levels between EAS and EUR populations,28,29,30 but the genetic overlap within EAS populations has not been characterized. Leveraging existing GWAS summary statistics from BBJ and UKBB, we investigated the comparative genetic architecture of quantitative traits within EAS (TWB vs. BBJ) and between EAS and EUR populations (TWB vs. UKBB and BBJ vs. UKBB). Intriguingly, among the 20 traits (for which GWASs based on the linear regression model were available across the three biobanks; see STAR Methods), SNP heritability estimates (h2g) in TWB (median h2g = 0.168) were comparable with those in UKBB (median h2g = 0.143) but consistently higher than the h2g estimates in BBJ (median h2g = 0.079; Figure 3A; Table S8). This systematic difference in TWB, BBJ, and UKBB h2g estimates could be due to various reasons, including differences in sample ascertainment and phenotype measurement and transformation. Specifically, while TWB (current data release, see STAR Methods) and UKBB are both community-based cohort studies, BBJ is composed of hospital samples. The quantitative traits analyzed here are often used as disease biomarkers and thus may suffer from increased heterogeneity due to various underlying health conditions and medication use among the hospital samples in BBJ. In contrast, the same traits measured in community settings as in TWB and UKBB may be more reflective of the general population, while potentially suffering from healthy volunteer bias.31 In addition, different quantitative trait transformation methods were used in BBJ for different traits (see STAR Methods), while inverse rank-based normal transformation was used for all traits in TWB and UKBB. These factors may all contribute to the observed systematic differences in h2g across the three biobanks. Nevertheless, the genetic correlation (rg) estimates within EAS (between TWB and BBJ) were indistinguishable from 1 (median rg = 0.986; Figures 3B and 3C) and were in general higher than the rg estimates between EAS and EUR (TWB-UKBB median rg = 0.922; BBJ-UKBB median rg = 0.863; Figures 3B and 3C; Table S9). With that being said, we note that all within- and cross-population rg estimates were high (median rg = 0.926) with some variations across phenotype categories (Table S9). Taken together, these results suggested that the genetic architecture for the quantitative traits examined in this study was largely consistent across EAS and EUR populations.
Figure 3.

Comparison of SNP-based heritability and within- and cross-ancestry genetic correlation estimates for 20 quantitative traits in TWB, BBJ, and UKBB
(A) Comparison of the SNP-based heritability estimates (h2g) in BBJ or UKBB against TWB.
(B) Comparison of the genetic correlation estimates (rg) between TWB and BBJ (within EAS) against the cross-ancestry rg estimates between TWB and UKBB (EAS vs. EUR).
(C) Comparison of the genetic correlation estimates (rg) between TWB and BBJ (within EAS) against the cross-ancestry rg estimates between BBJ and UKBB (EAS vs. EUR). A total of 20 traits for which GWAS summary statistics were available across the three biobanks were included for comparison: BMI (3), DBP (10), SBP (11), WBC (13), RBC (14), HB (15), HCT (16), PLT (17), CR (19), T-BIL (22), ALT (23), AST (24), GGT (25), ALB (27), FG (31), HBA1C (32), TC (33), HDL-C (34), LDL-C (35), and TG (36) (see Figure 1 for full names of the traits). h2g values were estimated using LDSC,17 and rg values were estimated using S-LDXR29 based on high-quality variants available across the three biobanks and GWASs generated by linear regression. The dotted line indicates the diagonal line in each plot. The complete results of the h2g and rg analyses are available in Tables S8 and S9.
To maximize the power for genetic discovery in the EAS populations, we meta-analyzed the GWASs from TWB and BBJ for 24 traits, using an inverse-variance-weighted fixed-effect approach.19 We then compared the EAS GWAS meta-analysis with existing GWASs and report an association signal in the EAS meta-analysis as novel if none of the variants within the locus reached genome-wide significance (p value < 5 × 10⁻⁸) in BBJ and UKBB GWASs based on samples of European ancestries (available for 30 traits) or the largest European GWAS performed by international consortia (available for 10 traits).32,33,34,35,36,37 We identified a total of 3,382 loci associated with the 24 traits, among which 665 were novel (Figures 4A and S37 and Tables S3 and S10). For the 12 traits where BBJ GWASs were not available, we compared the TWB batch 1 and 2 GWAS meta-analysis to GWASs in UKBB European ancestry samples or the largest EUR consortium GWAS available to report novel loci. We also reported all genome-wide significant loci in TWB for the traits where there was no GWAS conducted before this study. We identified 443 genome-wide significant loci with TWB GWAS meta-analysis for the 12 traits (among the 1,986 loci identified in TWB for 36 traits). A total of 303 among the 443 loci were considered novel (210 loci for 5 traits with no previous GWAS; Tables S3 and S10). The minor allele frequencies (MAFs) of the lead SNPs in these 968 (665 + 303) novel loci were significantly greater in EAS relative to EUR (average MAF = 31.62% in EAS vs. 23.74% in EUR; paired t test p value = 2.22 × 10−66). We also showed that there is significant heterogeneity between genome-wide association results in EAS and EUR samples for 29 traits (out of 30 traits examined) in our study (Table S11 and Figures S38–S67). As expected, many of the associated loci identified in the EAS (TWB and BBJ) GWAS meta-analysis were highly pleiotropic (Figure 4B; Table S12). Outside the human leukocyte antigens (HLA) region (chromosome 6; 28.5 to 33.5 Mb), GCKR and TRPS1 were the most pleiotropic genes in our analysis, with significant associations for 14 traits spanning anthropometric, bone, cardiovascular, hematological, kidney, liver, and metabolic phenotypes (Figure 4B). Due to the complex LD pattern in the HLA region, we included the entire HLA region as a single locus and identified 15 traits that showed genome-wide significant associations. The mechanism underlying these pleiotropic associations (e.g., biological pleiotropy vs. mediated pleiotropy) warrants further investigations.
Figure 4.

Genetic loci associated with quantitative traits in the East Asian populations
(A) Genome-wide significant loci identified in the TWB and BBJ meta-analysis, tallied based on their significance in TWB, BBJ, and UKBB or the largest consortium GWAS in samples of European ancestries.
(B) Distribution of the pleiotropic genes defined as the number of associated traits for each gene. The HLA region (chromosome 6; 28.5 to 33.5 Mb) was treated as a single locus and excluded from the figure. A total of 15 traits showed genome-wide significant associations in the HLA region, including height (HT), weight (WT), body mass index (BMI), white blood cell (WBC), red blood cell (RBC), platelet (PLT), creatinine (CR), uric acid (UA), alanine aminotransferase (ALT), aspartate aminotransferase (AST), albumin (ALB), total cholesterol (TC), high-density lipoprotein cholesterol (HDL-C), low-density lipoprotein cholesterol (LDL-C), and triglyceride (TG). The complete results of loci discovery and information on the pleiotropic genes are available in Tables S10 and S12.
To assess the clinical utility of the biomarker GWASs, we examined whether polygenic risk scores (PRSs) of biomarkers can be used to predict the risk of common complex diseases. We applied PRS-CSx,38,39 a Bayesian polygenic prediction method, to integrate the GWAS summary statistics of EAS and EUR ancestries and calculated both an EAS-specific and an EUR-specific PRS for each biomarker. We first examined the distribution of the EAS-specific and EUR-specific PRSs within sub-populations of a held-out sample of the TWB (Holo, Hakka, and Northern and Southern Han Chinese as defined in Feng et al.6; n = 10,285; see STAR Methods), and we did not find any differences in both EAS-specific and EUR-specific PRSs (Figure S68). We therefore performed PRS analysis on five complex diseases (obesity [ncase = 824; defined as BMI ≥ 30], overweight [ncase = 3,873; defined as BMI ≥ 25], hypertension [ncase = 1,149], hyperlipidemia [ncase = 771], and type 2 diabetes [ncase = 508]) in the full TWB held-out sample, adjusting for age, sex, and top 20 principal components (PCs) to account for population substructure. Specifically, for each disease, we randomly and repeatedly divided the held-out sample into a validation dataset (in which we learned an optimal linear combination of the population-specific PRS from one or more biomarkers) and a testing dataset (in which we assessed the prediction accuracy of the linearly combined biomarker PRS using weights trained in the validation sample). Biomarker PRSs were significantly associated with disease status, explaining >8% of the variation for obesity, overweight, and hypertension and 3.6% of the variation for hyperlipidemia on the liability scale (Figure 5; Table S13). HbA1c alone explained 4.3% of the variation for type 2 diabetes, and adding BMI as a predictor increased the variance explained to 5.3% (AUC increased from 0.626 to 0.637). Across the diseases we examined, the AUC of the prediction ranged from 0.61 to 0.68, and the odds ratios comparing individuals in the top 10% vs. the remaining 90% of the PRS distribution ranged from 2.0 to 2.8 (Figure 5; Table S13). As a comparison, we also predicted type 2 diabetes using T2D GWAS in EAS (meta-analysis of TWB discovery sample and BBJ; ncase = 49,992; ncontrol = 219,905) and EUR (the DIAMENTE consortium40; ncase = 74,124; ncontrol = 824,006). While the disease GWASs represented much larger sample sizes, biomarker PRS was able to explain approximately half of the liability variation compared with PRSs derived from GWAS of T2D diagnosis (Figure 5; Table S13).
Figure 5.

Polygenic prediction of common complex diseases in the Taiwan Biobank
PRS-CSx was applied to jointly model the East Asian (EAS) and European (EUR) GWAS summary statistics of each biomarker and derive an EAS-specific and an EUR-specific polygenic risk score (PRS). Each disease was predicted by the linear combination of PRSs from one or more biomarkers (right panel), controlling for age, sex, and top 20 principal components (PCs) of genotype data. The left-out TWB sample (n = 10,285) was repeatedly and randomly divided into a validation dataset (where tuning parameters and the optimal linear combination of PRSs were learned) and a testing dataset (where the predictive performance of the final linearly combined PRSs was assessed). To benchmark the predictive performance of biomarker PRS, self-reported type 2 diabetes (T2D) was also predicted by PRSs derived from the EAS and EUR type 2 diabetes GWASs. Biomarker GWASs in EAS were obtained from the meta-analysis of TWB and BBJ; biomarker GWASs in EUR were obtained from UKBB or the largest consortium GWAS. The T2D disease GWAS in EAS has 49,992 cases and 219,905 controls (4,609 cases and 87,873 controls from TWB; 45,383 cases and 132,032 controls from BBJ); the T2D GWAS in EUR has 74,124 cases and 824,006 controls. Each dot in the left panel represents the prediction accuracy (variance explained on the liability scale) from one random split of the dataset. Error bar represents the standard error of the prediction accuracy across 100 random splits for each disease. PRS performance metrics are available in Table S13.
Discussion
In this study, we performed genome-wide analyses on 102,900 community-based TWB participants across 36 human complex traits. Leveraging GWAS summary statistics from BBJ and UKBB, we found that the genetic architecture for the quantitative traits examined was largely consistent within EAS and between EAS and EUR populations. Integrating TWB and BBJ GWASs identified a total of 3,825 genetic loci (3,382 for 24 traits from EAS meta-analysis and 443 for 12 traits from TWB alone), among which 968 had not been reported in previous GWASs. We additionally fine-mapped over 200 association signals to a single variant with PIP >95% and identified 24 putative causal missense variants that implicated novel genes underlying quantitative traits. Lastly, our PRS analysis demonstrated the potential utility of biomarker GWAS in predicting disease risk and the promise of multi-trait cross-population polygenic prediction.
Our study represents a major advance in the characterization of the genetic architecture of human complex traits in EAS populations and highlights the importance of diversity in human genetics research. As one of the pioneering biobanks in East Asia, TWB expands human genetic resources in non-European populations, and it provides opportunities to investigate the comparative genetic architectures within East Asia and across continental populations with better powered EAS GWASs. Indeed, we identified 968 novel loci by comparing EAS GWASs (with approximately 100,000 samples in TWB and 178,000 samples in BBJ) against EUR GWASs with larger sample sizes (with approximately 340,000 samples in UKBB), and we demonstrated that allele frequency differences across populations likely drove these novel loci discoveries. The TWB GWASs also facilitated statistical fine-mapping and provided insights into disease biology and therapeutics development. For example, a missense variant rs146340667 (MAF = 0.0075 in EAS; absent in EUR populations; Table 1) was identified as the causal variant in the GLP1R gene for fasting glucose (FG) through fine-mapping. GLP1R gene is the target of several drugs for type 2 diabetes (e.g., glucagon-like peptide-1 receptor agonists, such as dulaglutide and semaglutide), obesity, and cardiovascular disease. Other variants with similar allele frequency differences across populations may provide additional insights and opportunities into population-specific pharmacogenomics and personalized medicine.41
Despite all the novel loci identified in TWB and BBJ GWASs, the overall high genetic correlations (rg) between TWB, BBJ, and UKBB suggested a similar genetic architecture for these quantitative traits within EAS populations and across EAS and EUR populations. On the other hand, the systematically higher h2g across traits in TWB and UKBB than in BBJ is intriguing and, as discussed above, may be attributed to several factors such as phenotype data collection and processing as well as biobank design, which warranted further investigation with a wider range of phenotypes (e.g., disease phenotypes in TWB).
BBJ and the community-based TWB data analyzed in this work employed different sample recruitment strategies, which have both advantages and disadvantages. While population-/community-based samples can be subjected to health volunteer bias (as observed in UKBB),6,31 the current TWB study provided the first assessment for the genetic basis of anthropometric traits and biomarkers in the general Taiwanese adult population. However, as the current TWB sample is not enriched for disease endpoints, we were not able to perform adequately powered GWAS for disease phenotypes. In contrast, BBJ, by adopting a hospital-based design, has an enriched diseased patient collection and is more powerful for genetic discovery of disease phenotypes. Nevertheless, data from these two biobanks, as well as other biobanks, can be complementary and provide insights into the genetic basis of complex traits within and across populations.
As an application of the biobank resources, we utilized biomarker GWAS summary statistics from TWB, BBJ, UKBB, and international consortia to predict disease risk. We used a recently developed polygenic scoring methodology, PRS-CSx,39 to jointly model biomarker GWASs from EAS and EUR samples, and we designed a PRS validation and testing strategy to obtain the optimal weights for combining multiple biomarker PRSs into a single predictor. We showed that polygenic prediction for disease risk can be improved by incorporating multiple biomarker PRSs derived from GWASs in diverse populations. These results suggest that expanding biobank resources to collect a wider range of biomarkers with larger sample sizes in diverse populations may further improve the clinical utility of PRSs.42
Limitations of the study
We note that, despite the large number of novel loci identified, the current study was limited to 36 quantitative traits for the genome-wide association analysis and 5 diseases for polygenic prediction that were made available for our study. Expanding the analyses to a wider range of quantitative and disease phenotypes is warranted as the ongoing sample and data collection efforts in TWB continue. In addition, the collective sample size of TWB and BBJ remains relatively small compared with genetic studies in EUR populations. Future endeavors on increasing the sample size and phenotype coverage in TWB, in East Asia and in other non-European populations, and improving cross-biobank data harmonization will facilitate genetic discovery for human complex traits.
STAR★Methods
Key resources table
| REAGENT or RESOURCE | SOURCE | IDENTIFIER |
|---|---|---|
| Deposited data | ||
| Association results | This paper | GWAS Catalog accession: GCST90278615, GCST90278616, GCST90278617, GCST90278618, GCST90278619, GCST90278620, GCST90278621, GCST90278622, GCST90278623, GCST90278624, GCST90278625, GCST90278626, GCST90278627, GCST90278628, GCST90278629, GCST90278630, GCST90278631, GCST90278632, GCST90278633, GCST90278634, GCST90278635, GCST90278636, GCST90278637, GCST90278638, GCST90278639, GCST90278640, GCST90278641, GCST90278642, GCST90278643, GCST90278644, GCST90278645, GCST90278646, GCST90278647, GCST90278648, GCST90278649, GCST90278650, GCST90278651, GCST90278652, GCST90278653, GCST90278654, GCST90278655, GCST90278656, GCST90278657, GCST90278658, GCST90278659, GCST90278660, GCST90278661, GCST90278662, GCST90278663, GCST90278664, GCST90278665, GCST90278666, GCST90278667, GCST90278668, GCST90278669, GCST90278670, GCST90278671, GCST90278672, GCST90278673, GCST90278674. |
| PRS weights | This paper | https://doi.org/10.5281/zenodo.8303422 |
| 1000 Genomes Phase 3 data | 1000 Genomes Project Consortium et al.21 | https://mathgen.stats.ox.ac.uk/impute/1000GP_Phase3.html |
| BBJ summary statistics | Biobank Japan5,12,13,14 | http://jenger.riken.jp/en/result |
| UKBB summary statistics | Neale Lab “GWAS round 2” | http://www.nealelab.is/uk-biobank |
| Height GWAS summary statistics | Yengo et al.36 | https://www.joelhirschhornlab.org/giant-consortium-results |
| Boby mass index GWAS summary statistics | Yengo et al.32 | https://portals.broadinstitute.org/collaboration/giant/index.php/GIANT_consortium_data_files#2018_GIANT_and_UK_BioBank_Meta-analysis |
| Blood pressure GWAS summary statistics | Evangelou et al.33 | https://www.ebi.ac.uk/gwas/publications/30224653 |
| Kidney function GWAS summary statistics | Pattaro et al.37 | https://www.ebi.ac.uk/gwas/publications/26831199 |
| Glycemic traits GWAS summary statistics | Chen et al.34 | https://magicinvestigators.org/downloads/ |
| Lipid traits GWAS summary statistics | Graham et al.35 | http://csg.sph.umich.edu/willer/public/glgc-lipids2021/ |
| TWB array v1 | Thermo Fisher | Contact TWB for array manifests. |
| TWB array v2 | Thermo Fisher | Contact TWB for array manifests. |
| Software and algorithms | ||
| Regenie | Mbatchou et al.16 | https://github.com/rgcgithub/regenie |
| PLINK2 | Chang et al.43 | https://www.cog-genomics.org/plink/2.0 |
| METAL | Willer et al.19 | https://genome.sph.umich.edu/wiki/METAL |
| FUMA | Watanabe et al.20 | https://fuma.ctglab.nl |
| LDSC | Bulik-Sullivan et al.,17 Bulik-Sullivan et al.18 | https://github.com/bulik/ldsc |
| S-LDXR | Shi et al.29 | https://huwenboshi.github.io/s-ldxr |
| PRS-CS | Ge et al.38 | https://github.com/getian107/PRScs |
| PRS-CSx | Ruan et al.39 | https://github.com/getian107/PRScsx |
| SuSiEx | Yuan et al.23 | https://github.com/getian107/SuSiEx |
| Analysis codes used in this manuscript | This paper | https://doi.org/10.5281/zenodo.7091819; https://doi.org/10.5281/zenodo.8303402; https://github.com/Annefeng/PBK-QC-pipeline |
Resource availability
Lead contact
Further information and requests for resources and reagents should be directed to and will be fulfilled by the lead contact, Yen-Feng Lin (yflin@nhri.edu.tw).
Materials availability
This study did not generate new unique reagents.
Data and code availability
-
•
A detailed description of the availability and application process of the individual-level TWB data can be found at https://www.biobank.org.tw/english.php. Briefly, TWB made available the individual-level data and biological samples from the participants of the prospective cohort study in 2014. Available data include questionnaire surveys, physical measures, blood and urine tests, biological samples and genomic data (whole-genome sequencing, whole-genome genotyping, DNA methylation, HLA typing, and blood metabolome). Researchers interested in obtaining TWB individual-level data for research purposes would need to submit an application that includes a detailed research proposal and an institutional review board (IRB) approval to TWB (contact e-mail: biobank@gate.sinica.edu.tw). The application will undergo scientific and ethical reviews by external experts in relevant scientific fields and the TWB ethical governance committee (EGC). Once approved, researchers will be able to access the data for the approved research projects during the approved time period. For international researchers outside of Taiwan, an additional international data transfer agreement needs to be filed to the Ministry of Health and Welfare of Taiwan to enable sharing of the TWB individual-level data and any derived data.
-
•
All GWAS summary statistics are available at GWAS Catalog (https://www.ebi.ac.uk/gwas/; GCP ID: GCP000702) with the following accession numbers: GCST90278615, GCST90278616, GCST90278617, GCST90278618, GCST90278619, GCST90278620, GCST90278621, GCST90278622, GCST90278623, GCST90278624, GCST90278625, GCST90278626, GCST90278627, GCST90278628, GCST90278629, GCST90278630, GCST90278631, GCST90278632, GCST90278633, GCST90278634, GCST90278635, GCST90278636, GCST90278637, GCST90278638, GCST90278639, GCST90278640, GCST90278641, GCST90278642, GCST90278643, GCST90278644, GCST90278645, GCST90278646, GCST90278647, GCST90278648, GCST90278649, GCST90278650, GCST90278651, GCST90278652, GCST90278653, GCST90278654, GCST90278655, GCST90278656, GCST90278657, GCST90278658, GCST90278659, GCST90278660, GCST90278661, GCST90278662, GCST90278663, GCST90278664, GCST90278665, GCST90278666, GCST90278667, GCST90278668, GCST90278669, GCST90278670, GCST90278671, GCST90278672, GCST90278673, and GCST90278674.
-
•
All original code used in this manuscript has been deposited on Zenodo and is publicly available at https://doi.org/10.5281/zenodo.7091819 and https://doi.org/10.5281/zenodo.8303402, including scripts for genotype data QC, figure generation, and genome-wide association analysis. Other codes used in this manuscript can also be found in the key resources table.
Experimental model and subject details
Study permissions
The access to and use of the Taiwan Biobank data in the present work was approved by the Ethics and Governance Council (EGC) of Taiwan Biobank (approval number: TWBR10907-05) and the Institutional Review Board (IRB) of National Health Research Institutes, Taiwan (approval number: EC1090402-E). The data collection of Taiwan Biobank was approved by the Ethics and Governance Council (EGC) of Taiwan Biobank and the Department of Health and Welfare, Taiwan (Wei-Shu-I-Tzu NO.1010267471). Taiwan Biobank obtained informed consent from all participants for research use of collected data. Only publicly available GWAS summary statistics, without individual-level information, were used from Biobank Japan (BBJ) and UK Biobank (UKBB).
Taiwan biobank (TWB)
The Taiwan Biobank (TWB) (https://www.twbiobank.org.tw/; https://www.biobank.org.tw/) is a prospective cohort study of the Taiwanese population with two recruiting arms: the community-based arm (final expected sample size of 200,000) and the hospital-based arm (final expected sample size of 100,000).6 Current TWB subject recruitment focuses on the community-based arm, with multi-omics data and repeated measurements of a wide range of phenotypes collected from 149,894 individuals (as of April 2021). Participants in TWB were recruited across 29 recruitment centers with at least one center in each city or county of Taiwan. All participants included in this study were from the community-based arm. Data from the hospital-based arm have not been made available. TWB collects extensive phenotypes including demographics, socioeconomic status, environmental exposures, lifestyle, dietary habits, family history and self-reported disease status through structured questionnaires. The anthropometric measures, and blood and urine samples were collected at recruitment, and biomarkers were assayed subsequently, following the manufacturer’s protocol at Linkou, Taiwan. TWB participants were 30–70 years old at recruitment, and the sex ratio was 0.57 in the final analytic sample of this study (37,225 males and 65,675 females; see Figure 1).
Method details
TWB sample characteristics, quality control and imputation
We obtained genome-wide genotype data from a total of 110,926 TWB participants. Genotyping was performed using two different customized chips. 27,719 samples were genotyped on the TWBv1 custom array, which was designed based on Thermo Fisher Axiom Genome-Wide CHB Array with customized contents; 83,207 samples were genotyped on the TWBv2 custom array, which was designed by Thermo Fisher Scientific Inc. based on whole-genome sequencing data from 946 TWB samples with customized contents.15 We divided the samples genotyped on the TWBv2 array into two subsets, with 68,975 samples for loci discovery and 14,232 samples for polygenic risk score (PRS) analysis, based on the chronological order of data release (see subsection “polygenic prediction” below). We refer to samples genotyped on the TWBv1 array as “discovery batch 1” and the discovery samples genotyped on the TWBv2 array as “discovery batch 2” (see Figure 1), and a third set of samples genotyped using the TWBv2 array as the PRS validation and testing samples.
We conducted stringent quality control (QC) for the two discovery samples and the sample for PRS analysis separately before imputation.9,43 QC was performed using a combination of bash script, R, python and PLINK,9,43 with scripts adapted from a recent biobank genotype QC project: https://github.com/Annefeng/PBK-QC-pipeline. We first filtered out variants with call rate <0.98 and samples with call rate <0.98, and removed variants that were duplicated, monogenic or not correctly mapped to a genomic position. We then merged TWB samples with the 1000 Genomes (1KG) Project phase 3 data (n = 2,504),21 and selected high-quality, common variants by removing multi-allelic and strand ambiguous SNPs, SNPs with call rate <0.98 and minor allele frequency (MAF) < 5%, and SNPs located in long-range LD regions (chr6: 25-35Mb; chr8: 7-13Mb). Next, we performed LD-pruning at R2 = 0.1, and computed principal components (PCs) of the merged genotype data with LD-pruned variants. Using the population labels of 1KG samples as the reference, we trained a random forest model with top 6 PCs to classify TWB samples into 1KG super-population groups: East Asian [EAS], European [EUR], African [AFR], American [AMR], South Asian [SAS]. We retained TWB samples that can be assigned to a homogeneous EAS population group with a predicted probability of EAS ancestry >0.8. After initial population assignment, we filtered out samples with heterozygosity rate outside of 6 standard deviation (SD) from the sample average, and samples with mismatched genetic and self-reported sex. We then performed three rounds of in-sample principal components analysis (PCA) to identify remaining population outliers, each time removing TWB samples with any of the top 10 PCs that was more than 6 SD away from the sample average. We used the in-sample PCs derived after outlier removal in subsequent analyses. Lastly, we removed variants with call rate <0.98 and Hardy-Weinberg equilibrium (HWE) test p-value < 1e-10 within the EAS sample.
After pre-imputation QC, we used Eagle v2.444 for pre-phasing and Minimac445 for genotype imputation with 1KG phase 3 data as the reference panel. We performed post-imputation QC by retaining variants with imputation INFO >0.6 and MAF >0.5% for the downstream analyses, which included up to 8,190,806 variants for discovery batch 1 and 8,156,315 variants for discovery batch 2, respectively. The imputed dataset included a total of 92,615 samples for loci discovery (27,033 samples for discovery batch 1 and 65,582 samples for discovery batch 2), and 12,997 samples for polygenic risk score (PRS) analysis. We further restricted the PRS analysis to 10,285 unrelated individuals that were also unrelated with the discovery GWAS samples. We note that while most of the phenotypes examined in this study were measured on the large majority of the discovery samples, the final analytic sample size of GWAS reduced to 62,901 (17,111 from discovery batch 1 and 45,790 from discovery batch 2) for FEV1, FVC and FEV1R, and 65,360 (19,509 from discovery batch 1 and 45,851 from discovery batch 2) for AFP due to missing phenotypic data.
Biobank Japan (BBJ)
We used two sets of GWAS summary statistics from BBJ for the EAS GWAS meta-analysis and the SNP-based heritability and genetic correction analyses, respectively. For the EAS GWAS meta-analysis, we used the latest BBJ GWAS summary statistics from Sakaue et al. (https://pheweb.jp/).5,12,14 Genome-wide association tests were performed for 220 phenotypes, using linear or logistic mixed models implemented in SAIGE46 (v0.37) or BOLT-LMM47 (v.2.3.4) adjusted for age, age,2 sex, age by sex interaction, age2 by sex interaction, and the top 20 PCs. We extracted 24 quantitative traits from BBJ that matched the quantitative traits we analyzed in TWB: height (HT), weight (WT), body mass index (BMI), diastolic blood pressure (DBP), systolic blood pressure (SBP), white blood cell (WBC), red blood cell (RBC), hemoglobin (HB), hematocrit (HCT), platelet (PLT), blood urea nitrogen (BUN), creatinine (CR), uric acid (UA), total bilirubin (T-BIL), alanine aminotransferase (ALT), aspartate aminotransferase (AST), gamma-glutamyltransferase (GGT), albumin (ALB), fasting glucose (FG), hemoglobin A1c (HbA1c), total cholesterol (TC), high-density lipoprotein cholesterol (HDL-C), low-density lipoprotein cholesterol (LDL-C), and triglyceride (TG). We meta-analyzed these 24 GWAS in BBJ with the corresponding GWAS in TWB using sample size-weighted Z score meta-analysis implemented in an in-house script (Python 3.9.5).19 We retained variants presented in either TWB or BBJ in this meta-analysis for loci discovery in the East Asian populations. Phenotypes used in the BBJ GWAS were either inverse rank-based normal transformed (HT, WT, BMI, T-BIL, ALB, FG, HbA1c), log transformed followed by Z score transformed (BUN, CR, ALT, AST, GGT, TG), or Z score transformed (DBP, SBP, WBC, BRC, HB, HCT, PLT, UA, TC, HDL-C, LDL-C).
For SNP-based heritability and genetic correction analyses, we used an earlier release of BBJ GWAS summary statistics from Kanai et al. (http://jenger.riken.jp/en/result),13 because association test statistics from mixed models can bias heritability and genetic correlation estimates when used with LD score regression.48 We extracted BBJ GWAS summary statistics for 20 traits from this earlier release, including BMI, DBP, SBP, WBC, RBC, HB, HCT, PLT, CR, T-BIL, ALT, AST, GGT, ALB, FG, HbA1c, TC, HDL-C, LDL-C, and TG. The association tests in these earlier BBJ GWAS were performed by first residualizing phenotypes on age, age,2 sex, the top 10 PCs, and trait-specific covariates (e.g., disease status), followed by association tests in linear regression.
UK biobank (UKBB)
All UK Biobank GWAS summary statistics used in this study were publicly available: http://www.nealelab.is/uk-biobank (v2). These GWAS were conducted and released by Benjamin Neale’s lab at Massachusetts General Hospital and the Broad Institute. We included 30 GWAS from UKBB: height (HT), weight (WT), body mass index (BMI), body fat rate (BFR), waist circumference (WC), hip circumference (HC), bone density T-score (BMD-T), diastolic blood pressure (DBP), systolic blood pressure (SBP), white blood cell (WBC), red blood cell (RBC), hemoglobin (HB), hematocrit (HCT), platelet (PLT), creatinine (CR), microalbumin urine (mALB), uric acid (UA), total bilirubin (T-BIL), alanine aminotransferease (ALT), aspartate aminotransferase (AST), gamma-glutamyltransferase (GGT), albumin (ALB), forced expiratory flow (FEV1), forced vital capacity (FVC), fasting glucose (FG), hemoglobin A1c (HbA1c), total cholesterol (TC), high-density lipoprotein cholesterol (HDL-C), low-density lipoprotein cholesterol (LDL-C), and triglyceride (TG). All phenotypes used in these GWAS were inverse rank-based normal transformated. Association tests were conducted in White British samples as defined by UKBB with linear regrerssion, controlling for age, age,2 sex, age by sex interaction, age2 by sex interaction, and top 20 PCs.
Quantification and statistical analysis
Genome-wide association analysis in TWB
We performed genetic association analysis on 36 quantitative traits including anthropometric measures and biomarkers from 8 categories as described in Figure 1. The three repeated measures for systolic and diastolic blood pressure and resting heart rate within the same visit were averaged. For each trait, we removed samples with phenotypic measures that were more than 6 SD away from the sample average. By doing so, we also removed samples with extremely high alpha-fetoprotein (AFP) levels that could be a result of pregnancy. We also note that the bone mineral density was measured using ultrasound at heel and then converted to T-score (BMD-T) using an Asian young adult reference and Z score (BMD-Z) using an Asian age-matched reference. In addition, we randomly removed one sample from each pair of duplicated samples within and across the two discovery batches. We then performed inverse rank-based normal transformation (IRNT) within each batch to achieve normality of the phenotype. All following genetic analyses were based on IRNT transformed measures. Association analyses were performed separately for the two discovery batches, followed by an inverse-variance-weighted fixed-effect meta-analysis (based on effect size estimates and standard errors) implemented in METAL.19
We used linear regression implemented in Regenie (v1.0.5.4)16 for association testing (two-sided score test), controlling for age, age,2 sex, age by sex interaction, age2 by sex interaction, and top 20 PCs. Regenie is a two-step whole-genome regression approach that accounts for potential population stratification and sample relatedness, providing better statistical power than restricting the association analysis to unrelated individuals. Specifically, in step 1 of Regenie, we used a subset of LD-pruned (at R2 = 0.9) SNPs with imputation INFO >0.8 and MAF >1% (919,630 SNPs for discovery batch 1 and 745,794 SNPs for discovery batch 2) to calculate a leave-one-chromosome-out (LOCO) polygenic score for each trait and each individual using Ridge regression. Association testing was then performed, in step 2 of Regenie, including the LOCO polygenic predicted value from step 1 as an offset in the linear regression model, in addition to other covariates, to account for sample relatedness. Association tests were performed in three sets of phenotypes according to missing data patterns: (1) AFP; (2) FEV1, FVC, FEV1R; (3) all other phenotypes. The association test statistics were then meta-analyzed between discovery batch 1 and 2. The final meta-analysis results only included variants presented on both batches.
Comparison between EAS and EUR genome-wide loci discovery
To investigate the contribution of non-European GWAS to loci discovery, we compared the loci identified in EAS GWAS meta-analysis (TWB and BBJ) and TWB GWAS (batch 1 and 2 meta-analysis; for traits where BBJ GWAS summary statistics were not available) with existing GWAS, which are primarily based on samples of European ancestries. We first used FUMA20 to identify genome-wide significant loci (p-value < 5 × 10⁻⁸) in EAS GWAS meta-analysis and TWB GWAS. We then performed the loci comparison between the EAS GWAS meta-analysis and existing GWAS for 24 traits where TWB, BBJ mixed model association GWAS, and EUR GWAS (UKBB or consortia) are all available (Table S1). We reported a genome-wide significant locus in EAS GWAS meta-analysis as novel if none of the variants within the locus reached genome-wide significance (p-value < 5 × 10⁻⁸) in BBJ (NBBJ_GWAS = 24), UKBB GWAS based on samples of European ancestries (total NUKBB_GWAS = 30), or the largest consortium GWAS based on samples of European ancestries (Nconsortium_GWAS = 10; Table S1).32,33,34,35,36,37 We reported a secondary analysis without considering consortium GWAS in the comparison in Figure S37 and Table S3. Finally, we compared the loci between TWB GWAS and EUR GWAS for 12 traits where BBJ GWAS summary statistics were not available. We report a genome-wide significant locus in TWB GWAS as novel if none of the variants within the locus reached genome-wide significance (p-value < 5 × 10⁻⁸) in UKBB or consortium GWAS based on samples of European ancestries or all genome-wide significant loci for the traits where there was no GWAS conducted before. To assess the heterogeneity between the association signals in EAS and EUR GWAS, we also performed genome-wide Cochran’s Q tests between EAS GWAS meta-analysis (N = 23) or TWB GWAS (N = 7) and UKBB GWAS using METAL.19
Pleiotropic genes
To identify genes influencing multiple traits, we took the list of genes mapped to each significant locus in the TWB and BBJ meta-analysis from FUMA20 (“genes.txt” from the FUMA download), and picked the gene with the most significant p-value in the “minGwasP” column for each locus. Multiple genes were retained for a locus if they shared the minimal p-value. We then report the number of traits a gene was associated with in the “Number of associated traits” column in Table S12, and visualize the distribution of pleiotropic genes in Figure 4B.
Fine-mapping
We implemented a summary statistics based version of SuSiE (Sum of Single Effects)22,23,49 in Python for the fine-mapping analysis (key resources table). We first consolidated nearby genome-wide significant loci across the 36 traits in TWB (Table S6). All loci (N = 1,907) identified using the TWB summary statistics were extended +/− 100kb to ensure sufficient locus data was available for fine-mapping. In-sample LD was calculated using hard-called genotypes merged across post-imputation samples from the two discovery batches. We identified the 95% credible set using the following settings: marginal p-value threshold < 5 × 10⁻⁸, minimum purity = 0.5, algorithmic convergence tolerance = 10−4, and the maximum number of iterations = 100. An initial run was performed, limiting to a maximum of five signals. Loci in which five credible sets were identified were re-run, relaxing the maximum number of signals to 10. Loci that failed to converge in the initial run were rerun through an iterative process of reducing the maximum number of signals from 5 toward 1 until model convergence. Annotations for credible sets were generated using ANNOVAR50,51 (version 2019Oct24) on the GENCODE V19 database, and ExAC using VEP version 101.50,51
Heritability and genetic correlation analyses
To enable unbiased estimates and a fair comparison of h2g and rg between TWB, BBJ and UKBB, we applied LDSC to GWAS summary statistics generated from linear regression models in BBJ and UKBB, and GWAS summary statistics generated from linear regression models in unrelated TWB samples. The TWB sample size for h2g and rg analysis (ranged from 53,962 to 79,407; Table S3. Genomic inflation metrics for Taiwan Biobank (TWB) batch 1, batch 2, and meta-analysis GWAS, genetic correlation estimates between the two discovery batches of TWB, and loci comparison between TWB and EAS GWAS meta-analysis with EUR GWAS, related to Figures 2A and 4A, Table S4. Heritability estimates across 36 quantitative traits in the Taiwan Biobank (TWB), related to Figure 2B, Table S5. Pairwise genetic correlation estimates between 36 quantitative traits in the Taiwan Biobank (TWB), related to Figure 2C) was thus smaller than the Regenie-based GWAS sample size used in loci discovery. Specifically, we removed one sample in each pair of second degree or more closely related relatives within and across the two discovery batches in TWB, and performed association tests in the remaining unrelated individuals, controlling for age, age,2 sex, age by sex interaction, age2 by sex interaction, and top 20 PCs, followed by meta-analysis across the two batches using PLINK2.43 This set of GWAS summary statistics was used in within-TWB h2g and rg estimation shown in Figures 2B, 2C, and Table S3. Genomic inflation metrics for Taiwan Biobank (TWB) batch 1, batch 2, and meta-analysis GWAS, genetic correlation estimates between the two discovery batches of TWB, and loci comparison between TWB and EAS GWAS meta-analysis with EUR GWAS, related to Figures 2A and 4A, Table S4. Heritability estimates across 36 quantitative traits in the Taiwan Biobank (TWB), related to Figure 2B, Table S5. Pairwise genetic correlation estimates between 36 quantitative traits in the Taiwan Biobank (TWB), related to Figure 2C, and cross-biobank h2g and rg comparisons presented in Figure 3, Tables S8, and S9.
We used LDSC to estimate h2g for 36 traits and the pairwise rg between them within TWB. We additionally applied LDSC to BBJ and UKBB GWAS summary statistics to estimate h2g for 20 traits that were available across the three biobanks. For fair comparison, all LDSC analyses were restricted to shared SNPs with INFO >0.8 and MAF >1% across the three biobanks. LD scores were calculated using the 1KG phase 3 reference panel that matched the ancestry of the GWAS sample. We note that the h2g estimate for total bilirubin (T-BIL) had an unusually large standard error (SE = 0.105; median SE for the other traits = 0.016; see Figure 2 and Table S8). We identified a Mendelian locus for T-BIL on chromosome 2 (p-value < 1e-1000), harboring the UGT1A1 gene, which is known to cause inherited unconjugated hyperbilirubinemia, including Gilbert Syndrome (OMIM: 143500), Crigler–Najjar Syndrome type I (OMIM: 218800), and Crigler–Najjar Syndrome type II (OMIM: 606785). Removing this Mendelian locus reduced LDSC h2g estimate from 0.184 to 0.091 and its SE from 0.105 to 0.020. We separately estimated the T-BIL phenotypic variance explained by the top signal in the Mendelian locus as a fixed effect to be 0.088, which matched the missing h2g by removing this locus from the LDSC analysis.
We used the baseline-LD-X model of S-LDXR29 (version 0.3-beta) to estimate cross-biobank genetic correlations, using shared SNPs with INFO >0.8 and MAF >1% across the three biobanks. To estimate the cross-population rg between TWB and UKBB, and between BBJ and UKBB, we used the default LD scores for EAS and EUR populations provided by S-LDXR as the reference panels. To estimate within-EAS rg between TWB and BBJ, we used the LD scores and regression weight files for EAS provided by S-LDXR as the reference panels for both biobanks.
Polygenic prediction
For each biomarker (BMI, DBP, SBP, HDL-C, LDL-C, TG, and HbA1c), we used large GWAS in EAS (the meta-analysis of TWB and BBJ) and EUR populations (BMI N = 681,27532; DBP and SBP N = 757,60133; HDL-C, LDL-C and TG N = 1,320,01635; HbA1c N = 344,182 from Neale Lab) to predict disease risk. Population-specific PRS for each biomarker was calculated using PRS-CSx,39 a Bayesian polygenic prediction method that jointly models GWAS summary statistics from multiple populations to improve polygenic prediction. Specifically, for a fixed global shrinkage parameter (phi = 1e-6, 1e-4, 1e-2, and 1.0 in this study) that models the overall sparseness of the genetic architecture, PRS-CSx returned posterior SNP effect size estimates for each discovery population (i.e., EAS and EUR), which were used to calculate both an EAS-specific PRS and an EUR-specific PRS in the left-out TWB sample (N = 10,285). The left-out TWB samples for PRS validation and testing are independent from the discovery batch 1 and discovery batch 2 samples, but were recruited following the same procedure as the discovery batch 2 samples with the same data collection and genome-wide genotyping methodologies. However, the left-out samples were released to us later than the discovery samples, which makes it a natural independent validation and testing set for the PRS analyses. We first examined the distribution of the EAS-specific and EUR-specific PRS within the sub-populations in the left-out TWB sample. The three sub-populations were defined by self-reported paternal and maternal places of ancestral origin of Holo, Hakka, and Northern and Southern Han Chinese (see Feng et al. for details).6 We only retained TWB samples with the same paternal and maternal place of origin for this PRS distribution comparison.
We then used the PRS of one or more biomarkers to predict five common complex diseases: (1) obesity (defined as BMI>=30); (2) overweight (defined as BMI>=25); (3) hypertension (self-report); (4) hyperlipidemia (self-report); and (5) type 2 diabetes (self-report). Specifically, we predicted obesity and overweight using BMI, hypertension using BMI, DBP and SBP, hyperlipidemia using BMI, HDL-C, LDL-C and TG, and type 2 diabetes using HbA1c alone, as well as BMI and HbA1c (Figure 5, right panel). Of note, the prevalence of these 5 complex diseases are similar across TWB discovery batch 1, discovery batch 2, and left-out PRS validation and testing samples (Table S13). We repeatedly and randomly divided the left-out TWB sample into a validation dataset (N = 5,000), where we selected the optimal global shrinkage parameter for each biomarker and learnt the optimal linear combination of the PRS across biomarkers that were used as predictors, and a testing dataset (N = 5,285), where we evaluated the predictive performance of the final linearly combined PRS (using weights trained in the validation sample), controlling for age, sex and top 20 PCs. This process was repeated 100 times. To compare the prediction accuracy of PRS derived from biomarker GWAS and disease GWAS, we additionally applied PRS-CSx to the EAS (the meta-analysis of TWB and BBJ; Ncase = 49,992; Ncontrol = 219,905) and EUR type 2 diabetes GWAS (Ncase = 74,124; Ncontrol = 824,006),40 and used the resulting PRS to predict self-reported type 2 diabetes in the same TWB held-out sample. We calculated several performance metrics to evaluate the final PRS in the testing dataset: (i) variance explained on the liability scale,52 assuming the same population and sample prevalence of the disease; (ii) area under the receiver operating curve (AUC); (iii) the odds ratio (OR) comparing individuals in the top 10% of the final PRS with those in the rest of the PRS distribution. To avoid potential sample overlap between the discovery and testing samples and ensure a fair comparison between PRS derived from biomarker GWAS and disease GWAS, we opt to use the T2D GWAS meta-analysis of TWB and BBJ instead of the largest T2D GWAS in EAS.53
Acknowledgments
We thank Masahiro Kanai for helpful discussions related to Biobank Japan (BBJ). We thank Saori Sakaue for the help with making Figure 2A. We thank the participants of Taiwan Biobank and the staff, management team, and leadership of Taiwan Biobank. We thank Neale Lab, UK Biobank, and Biobank Japan for providing resources and releasing the genome-wide association summary statistics that made this study possible. Y.-F.L. is supported by the National Health Research Institutes (NP-110, 111, 112-PP-09) and the Ministry of Science and Technology (MOST 109-2314-B-400-017, 110-2314-B-400-028-MY3) of Taiwan. Y.-C.A.F. acknowledges support from the National Taiwan University (NTU-112L7404), the Yushan Young Fellow Program by the Ministry of Education (MOE; NTU-112V1020-2), and the National Science and Technology Council (NSTC 112-2314-B-002-200-MY3). Y.-C.A.F. and P.-H.K. are supported by the Population Health Research Center from Featured Areas Research Center Program within the framework of the Higher Education Sprout Project by the MOE in Taiwan (NTU-112L9004). T.G. is supported by NHGRI R01HG012354, U01HG008685, and U01HG011723. H.H. acknowledges support from NIDDK K01DK114379, NIMH U01MH109539, Brain & Behavior Research Foundation Young Investigator Grant, the Zhengxu and Ying He Foundation, and the Stanley Center for Psychiatric Research. This research has been conducted using the Taiwan Biobank resource. We thank the National Center for Genome Medicine of Taiwan for the technical support in genotyping. We thank the National Core Facility for Biopharmaceuticals (NCFB, MOST 106-2319-B-492-002) and National Center for High-performance Computing (NCHC) of National Applied Research Laboratories (NARLabs) of Taiwan for providing computational and storage resources.
Author contributions
Conceptualized, C.-Y.C., Y.-C.A.F., H.H., T.G., and Y.-F.L.; methodology, C.-Y.C., Y.-C.A.F., M.Y., R.J.L., H.H., and T.G.; formal analysis, T.-T.C., S.-C.L., and Y.-F.L.; resources, Y.-F.L.; writing – original draft, C.-Y.C., Y.-C.A.F., H.H., T.G., and Y.-F.L.; writing – review & editing, S.-H.W., Y.-H.H., H.-I.Y., P.-H.K., M.J.D., and W.J.C.; supervision, C.-Y.C., Y.-C.A.F., H.H., T.G., and Y.-F.L.; project administration, Y.-F.L.
Declaration of interests
C.-Y.C. is an employee of Biogen. R.J.L. is an employee of Ionis Pharmaceuticals. M.J.D. is a founder of Maze Therapeutics.
Published: November 16, 2023
Footnotes
Supplemental information can be found online at https://doi.org/10.1016/j.xgen.2023.100436.
Contributor Information
Chia-Yen Chen, Email: chiayenc@gmail.com.
Yen-Chen Anne Feng, Email: ajfeng@ntu.edu.tw.
Hailiang Huang, Email: hhuang@atgu.mgh.harvard.edu.
Tian Ge, Email: tge1@mgh.harvard.edu.
Yen-Feng Lin, Email: yflin@nhri.edu.tw.
Supplemental information
References
- 1.Visscher P.M., Wray N.R., Zhang Q., Sklar P., McCarthy M.I., Brown M.A., Yang J. 10 Years of GWAS Discovery: Biology, Function, and Translation. Am. J. Hum. Genet. 2017;101:5–22. doi: 10.1016/j.ajhg.2017.06.005. [DOI] [PMC free article] [PubMed] [Google Scholar]
- 2.Tam V., Patel N., Turcotte M., Bossé Y., Paré G., Meyre D. Benefits and limitations of genome-wide association studies. Nat. Rev. Genet. 2019;20:467–484. doi: 10.1038/s41576-019-0127-1. [DOI] [PubMed] [Google Scholar]
- 3.Sudlow C., Gallacher J., Allen N., Beral V., Burton P., Danesh J., Downey P., Elliott P., Green J., Landray M., et al. UK biobank: an open access resource for identifying the causes of a wide range of complex diseases of middle and old age. PLoS Med. 2015;12 doi: 10.1371/journal.pmed.1001779. [DOI] [PMC free article] [PubMed] [Google Scholar]
- 4.Bycroft C., Freeman C., Petkova D., Band G., Elliott L.T., Sharp K., Motyer A., Vukcevic D., Delaneau O., O’Connell J., et al. The UK Biobank resource with deep phenotyping and genomic data. Nature. 2018;562:203–209. doi: 10.1038/s41586-018-0579-z. [DOI] [PMC free article] [PubMed] [Google Scholar]
- 5.Sakaue S., Kanai M., Tanigawa Y., Karjalainen J., Kurki M., Koshiba S., Narita A., Konuma T., Yamamoto K., Akiyama M., et al. A cross-population atlas of genetic associations for 220 human phenotypes. Nat. Genet. 2021;53:1415–1424. doi: 10.1038/s41588-021-00931-x. [DOI] [PubMed] [Google Scholar]
- 6.Feng Y.-C.A., Chen C.-Y., Chen T.-T., Kuo P.-H., Hsu Y.-H., Yang H.-I., Chen W.J., Su M.-W., Chu H.-W., Shen C.-Y., et al. Taiwan Biobank: A rich biomedical research database of the Taiwanese population. Cell Genom. 2022;2 doi: 10.1016/j.xgen.2022.100197. [DOI] [PMC free article] [PubMed] [Google Scholar]
- 7.Zhou W., Kanai M., Wu K.-H.H., Rasheed H., Tsuo K., Hirbo J.B., Wang Y., Bhattacharya A., Zhao H., Namba S., et al. Global Biobank Meta-analysis Initiative: Powering genetic discovery across human disease. Cell Genom. 2022;2 doi: 10.1016/j.xgen.2022.100192. [DOI] [PMC free article] [PubMed] [Google Scholar]
- 8.Martin A.R., Kanai M., Kamatani Y., Okada Y., Neale B.M., Daly M.J. Clinical use of current polygenic risk scores may exacerbate health disparities. Nat. Genet. 2019;51:584–591. doi: 10.1038/s41588-019-0379-x. [DOI] [PMC free article] [PubMed] [Google Scholar]
- 9.Peterson R.E., Kuchenbaecker K., Walters R.K., Chen C.-Y., Popejoy A.B., Periyasamy S., Lam M., Iyegbe C., Strawbridge R.J., Brick L., et al. Genome-wide Association Studies in Ancestrally Diverse Populations: Opportunities, Methods, Pitfalls, and Recommendations. Cell. 2019;179:589–603. doi: 10.1016/j.cell.2019.08.051. [DOI] [PMC free article] [PubMed] [Google Scholar]
- 10.Martin A.R., Stroud R.E., 2nd, Abebe T., Akena D., Alemayehu M., Atwoli L., Chapman S.B., Flowers K., Gelaye B., Gichuru S., et al. Increasing diversity in genomics requires investment in equitable partnerships and capacity building. Nat. Genet. 2022;54:740–745. doi: 10.1038/s41588-022-01095-y. [DOI] [PMC free article] [PubMed] [Google Scholar]
- 11.Fatumo S., Chikowore T., Choudhury A., Ayub M., Martin A.R., Kuchenbaecker K. A roadmap to increase diversity in genomic studies. Nat. Med. 2022;28:243–250. doi: 10.1038/s41591-021-01672-4. [DOI] [PMC free article] [PubMed] [Google Scholar]
- 12.Akiyama M., Okada Y., Kanai M., Takahashi A., Momozawa Y., Ikeda M., Iwata N., Ikegawa S., Hirata M., Matsuda K., et al. Genome-wide association study identifies 112 new loci for body mass index in the Japanese population. Nat. Genet. 2017;49:1458–1467. doi: 10.1038/ng.3951. [DOI] [PubMed] [Google Scholar]
- 13.Kanai M., Akiyama M., Takahashi A., Matoba N., Momozawa Y., Ikeda M., Iwata N., Ikegawa S., Hirata M., Matsuda K., et al. Genetic analysis of quantitative traits in the Japanese population links cell types to complex human diseases. Nat. Genet. 2018;50:390–400. doi: 10.1038/s41588-018-0047-6. [DOI] [PubMed] [Google Scholar]
- 14.Akiyama M., Ishigaki K., Sakaue S., Momozawa Y., Horikoshi M., Hirata M., Matsuda K., Ikegawa S., Takahashi A., Kanai M., et al. Characterizing rare and low-frequency height-associated variants in the Japanese population. Nat. Commun. 2019;10:4393. doi: 10.1038/s41467-019-12276-5. [DOI] [PMC free article] [PubMed] [Google Scholar]
- 15.Wei C.-Y., Yang J.-H., Yeh E.-C., Tsai M.-F., Kao H.-J., Lo C.-Z., Chang L.-P., Lin W.-J., Hsieh F.-J., Belsare S., et al. Genetic profiles of 103,106 individuals in the Taiwan Biobank provide insights into the health and history of Han Chinese. NPJ Genom. Med. 2021;6:10. doi: 10.1038/s41525-021-00178-9. [DOI] [PMC free article] [PubMed] [Google Scholar]
- 16.Mbatchou J., Barnard L., Backman J., Marcketta A., Kosmicki J.A., Ziyatdinov A., Benner C., O’Dushlaine C., Barber M., Boutkov B., et al. Computationally efficient whole-genome regression for quantitative and binary traits. Nat. Genet. 2021;53:1097–1103. doi: 10.1038/s41588-021-00870-7. [DOI] [PubMed] [Google Scholar]
- 17.Bulik-Sullivan, B.K., Loh, P.-R., Finucane, H.K., Ripke, S., Yang, J., Schizophrenia Working Group of the Psychiatric Genomics Consortium, Patterson, N., Daly, M.J., Price, A.L., and Neale, B.M. (2015). LD Score regression distinguishes confounding from polygenicity in genome-wide association studies. Nat. Genet. 47, 291–295. 10.1038/ng.3211. [DOI] [PMC free article] [PubMed]
- 18.Bulik-Sullivan B., Finucane H.K., Anttila V., Gusev A., Day F.R., Loh P.-R., Psychiatric Genomics Consortium. Genetic Consortium for Anorexia Nervosa of the Wellcome Trust Case Control Consortium 3. Duncan L., et al. An atlas of genetic correlations across human diseases and traits. Nat. Genet. 2015;47:1236–1241. doi: 10.1038/ng.3406. [DOI] [PMC free article] [PubMed] [Google Scholar]
- 19.Willer C.J., Li Y., Abecasis G.R. METAL: fast and efficient meta-analysis of genomewide association scans. Bioinformatics. 2010;26:2190–2191. doi: 10.1093/bioinformatics/btq340. [DOI] [PMC free article] [PubMed] [Google Scholar]
- 20.Watanabe K., Taskesen E., van Bochoven A., Posthuma D. Functional mapping and annotation of genetic associations with FUMA. Nat. Commun. 2017;8:1826. doi: 10.1038/s41467-017-01261-5. [DOI] [PMC free article] [PubMed] [Google Scholar]
- 21.1000 Genomes Project Consortium. Auton A., Brooks L.D., Durbin R.M., Garrison E.P., Kang H.M., Korbel J.O., Marchini J.L., McCarthy S., McVean G.A., Abecasis G.R. A global reference for human genetic variation. Nature. 2015;526:68–74. doi: 10.1038/nature15393. [DOI] [PMC free article] [PubMed] [Google Scholar]
- 22.Wang G., Sarkar A., Carbonetto P., Stephens M. A simple new approach to variable selection in regression, with application to genetic fine mapping. J. R. Stat. Soc. Series B Stat. Methodol. 2020;82:1273–1300. doi: 10.1111/rssb.12388. [DOI] [PMC free article] [PubMed] [Google Scholar]
- 23.Yuan K., Longchamps R.J., Pardiñas A.F., Yu M., Chen T.-T., Lin S.-C., Chen Y., Lam M., Liu R., Xia Y., et al. Fine-mapping across diverse ancestries drives the discovery of putative causal variants underlying human complex traits and diseases. medRxiv. 2023 doi: 10.1101/2023.01.07.23284293. Preprint at. [DOI] [PubMed] [Google Scholar]
- 24.Kanai M., Ulirsch J.C., Karjalainen J., Kurki M., Karczewski K.J., Fauman E., Wang Q.S., Jacobs H., Aguet F., Ardlie K.G., et al. Insights from complex trait fine-mapping across diverse populations. medRxiv. 2021 doi: 10.1101/2021.09.03.21262975. Preprint at. [DOI] [Google Scholar]
- 25.Polfus L.M., Khajuria R.K., Schick U.M., Pankratz N., Pazoki R., Brody J.A., Chen M.-H., Auer P.L., Floyd J.S., Huang J., et al. Whole-Exome Sequencing Identifies Loci Associated with Blood Cell Traits and Reveals a Role for Alternative GFI1B Splice Variants in Human Hematopoiesis. Am. J. Hum. Genet. 2016;99:785. doi: 10.1016/j.ajhg.2016.08.002. [DOI] [PMC free article] [PubMed] [Google Scholar]
- 26.Johnson A.D., Kavousi M., Smith A.V., Chen M.-H., Dehghan A., Aspelund T., Lin J.-P., van Duijn C.M., Harris T.B., Cupples L.A., et al. Genome-wide association meta-analysis for total serum bilirubin levels. Hum. Mol. Genet. 2009;18:2700–2710. doi: 10.1093/hmg/ddp202. [DOI] [PMC free article] [PubMed] [Google Scholar]
- 27.Chambers J.C., Zhang W., Sehmi J., Li X., Wass M.N., Van der Harst P., Holm H., Sanna S., Kavousi M., Baumeister S.E., et al. Genome-wide association study identifies loci influencing concentrations of liver enzymes in plasma. Nat. Genet. 2011;43:1131–1138. doi: 10.1038/ng.970. [DOI] [PMC free article] [PubMed] [Google Scholar]
- 28.Shi H., Burch K.S., Johnson R., Freund M.K., Kichaev G., Mancuso N., Manuel A.M., Dong N., Pasaniuc B. Localizing Components of Shared Transethnic Genetic Architecture of Complex Traits from GWAS Summary Data. Am. J. Hum. Genet. 2020;106:805–817. doi: 10.1016/j.ajhg.2020.04.012. [DOI] [PMC free article] [PubMed] [Google Scholar]
- 29.Shi H., Gazal S., Kanai M., Koch E.M., Schoech A.P., Siewert K.M., Kim S.S., Luo Y., Amariuta T., Huang H., et al. Population-specific causal disease effect sizes in functionally important regions impacted by selection. Nat. Commun. 2021;12:1098. doi: 10.1038/s41467-021-21286-1. [DOI] [PMC free article] [PubMed] [Google Scholar]
- 30.Lam M., Chen C.-Y., Li Z., Martin A.R., Bryois J., Ma X., Gaspar H., Ikeda M., Benyamin B., Brown B.C., et al. Comparative genetic architectures of schizophrenia in East Asian and European populations. Nat. Genet. 2019;51:1670–1678. doi: 10.1038/s41588-019-0512-x. [DOI] [PMC free article] [PubMed] [Google Scholar]
- 31.Fry A., Littlejohns T.J., Sudlow C., Doherty N., Adamska L., Sprosen T., Collins R., Allen N.E. Comparison of Sociodemographic and Health-Related Characteristics of UK Biobank Participants With Those of the General Population. Am. J. Epidemiol. 2017;186:1026–1034. doi: 10.1093/aje/kwx246. [DOI] [PMC free article] [PubMed] [Google Scholar]
- 32.Yengo L., Sidorenko J., Kemper K.E., Zheng Z., Wood A.R., Weedon M.N., Frayling T.M., Hirschhorn J., Yang J., Visscher P.M., GIANT Consortium Meta-analysis of genome-wide association studies for height and body mass index in ∼700000 individuals of European ancestry. Hum. Mol. Genet. 2018;27:3641–3649. doi: 10.1093/hmg/ddy271. [DOI] [PMC free article] [PubMed] [Google Scholar]
- 33.Evangelou E., Warren H.R., Mosen-Ansorena D., Mifsud B., Pazoki R., Gao H., Ntritsos G., Dimou N., Cabrera C.P., Karaman I., et al. Genetic analysis of over 1 million people identifies 535 new loci associated with blood pressure traits. Nat. Genet. 2018;50:1412–1425. doi: 10.1038/s41588-018-0205-x. [DOI] [PMC free article] [PubMed] [Google Scholar]
- 34.Chen J., Spracklen C.N., Marenne G., Varshney A., Corbin L.J., Luan J. ’an, Willems S.M., Wu Y., Zhang X., Horikoshi M., et al. The trans-ancestral genomic architecture of glycemic traits. Nat. Genet. 2021;53:840–860. doi: 10.1038/s41588-021-00852-9. [DOI] [PMC free article] [PubMed] [Google Scholar]
- 35.Graham S.E., Clarke S.L., Wu K.-H.H., Kanoni S., Zajac G.J.M., Ramdas S., Surakka I., Ntalla I., Vedantam S., Winkler T.W., et al. The power of genetic diversity in genome-wide association studies of lipids. Nature. 2021;600:675–679. doi: 10.1038/s41586-021-04064-3. [DOI] [PMC free article] [PubMed] [Google Scholar]
- 36.Yengo L., Vedantam S., Marouli E., Sidorenko J., Bartell E., Sakaue S., Graff M., Eliasen A.U., Jiang Y., Raghavan S., et al. A saturated map of common genetic variants associated with human height. Nature. 2022;610:704–712. doi: 10.1038/s41586-022-05275-y. [DOI] [PMC free article] [PubMed] [Google Scholar]
- 37.Pattaro C., Teumer A., Gorski M., Chu A.Y., Li M., Mijatovic V., Garnaas M., Tin A., Sorice R., Li Y., et al. Genetic associations at 53 loci highlight cell types and biological pathways relevant for kidney function. Nat. Commun. 2016;7 doi: 10.1038/ncomms10023. [DOI] [PMC free article] [PubMed] [Google Scholar]
- 38.Ge T., Chen C.-Y., Ni Y., Feng Y.-C.A., Smoller J.W. Polygenic prediction via Bayesian regression and continuous shrinkage priors. Nat. Commun. 2019;10:1776. doi: 10.1038/s41467-019-09718-5. [DOI] [PMC free article] [PubMed] [Google Scholar]
- 39.Ruan Y., Lin Y.-F., Feng Y.-C.A., Chen C.-Y., Lam M., Guo Z., Stanley Global Asia Initiatives. He L., Sawa A., Martin A.R., et al. Improving polygenic prediction in ancestrally diverse populations. Nat. Genet. 2022;54:573–580. doi: 10.1038/s41588-022-01054-7. [DOI] [PMC free article] [PubMed] [Google Scholar]
- 40.Mahajan A., Taliun D., Thurner M., Robertson N.R., Torres J.M., Rayner N.W., Payne A.J., Steinthorsdottir V., Scott R.A., Grarup N., et al. Fine-mapping type 2 diabetes loci to single-variant resolution using high-density imputation and islet-specific epigenome maps. Nat. Genet. 2018;50:1505–1513. doi: 10.1038/s41588-018-0241-6. [DOI] [PMC free article] [PubMed] [Google Scholar]
- 41.El Eid L., Reynolds C.A., Tomas A., Jones B. Biased agonism and polymorphic variation at the GLP-1 receptor: Implications for the development of personalised therapeutics. Pharmacol. Res. 2022;184 doi: 10.1016/j.phrs.2022.106411. [DOI] [PubMed] [Google Scholar]
- 42.Wang Y., Namba S., Lopera E., Kerminen S., Tsuo K., Läll K., Kanai M., Zhou W., Wu K.-H., Favé M.J., et al. Global Biobank analyses provide lessons for developing polygenic risk scores across diverse cohorts. Cell Genom. 2023;3 doi: 10.1016/j.xgen.2022.100241. [DOI] [PMC free article] [PubMed] [Google Scholar]
- 43.Chang C.C., Chow C.C., Tellier L.C., Vattikuti S., Purcell S.M., Lee J.J. Second-generation PLINK: rising to the challenge of larger and richer datasets. GigaScience. 2015;4:7. doi: 10.1186/s13742-015-0047-8. [DOI] [PMC free article] [PubMed] [Google Scholar]
- 44.Loh P.-R., Danecek P., Palamara P.F., Fuchsberger C., A Reshef Y., K Finucane H., Schoenherr S., Forer L., McCarthy S., Abecasis G.R., et al. Reference-based phasing using the Haplotype Reference Consortium panel. Nat. Genet. 2016;48:1443–1448. doi: 10.1038/ng.3679. [DOI] [PMC free article] [PubMed] [Google Scholar]
- 45.Das S., Forer L., Schönherr S., Sidore C., Locke A.E., Kwong A., Vrieze S.I., Chew E.Y., Levy S., McGue M., et al. Next-generation genotype imputation service and methods. Nat. Genet. 2016;48:1284–1287. doi: 10.1038/ng.3656. [DOI] [PMC free article] [PubMed] [Google Scholar]
- 46.Zhou W., Nielsen J.B., Fritsche L.G., Dey R., Gabrielsen M.E., Wolford B.N., LeFaive J., VandeHaar P., Gagliano S.A., Gifford A., et al. Efficiently controlling for case-control imbalance and sample relatedness in large-scale genetic association studies. Nat. Genet. 2018;50:1335–1341. doi: 10.1038/s41588-018-0184-y. [DOI] [PMC free article] [PubMed] [Google Scholar]
- 47.Loh P.-R., Tucker G., Bulik-Sullivan B.K., Vilhjálmsson B.J., Finucane H.K., Salem R.M., Chasman D.I., Ridker P.M., Neale B.M., Berger B., et al. Efficient Bayesian mixed-model analysis increases association power in large cohorts. Nat. Genet. 2015;47:284–290. doi: 10.1038/ng.3190. [DOI] [PMC free article] [PubMed] [Google Scholar]
- 48.Yang J., Zaitlen N.A., Goddard M.E., Visscher P.M., Price A.L. Advantages and pitfalls in the application of mixed-model association methods. Nat. Genet. 2014;46:100–106. doi: 10.1038/ng.2876. [DOI] [PMC free article] [PubMed] [Google Scholar]
- 49.Zou Y., Carbonetto P., Wang G., Stephens M. Fine-mapping from summary data with the “Sum of Single Effects” model. PLoS Genet. 2022;18 doi: 10.1371/journal.pgen.1010299. [DOI] [PMC free article] [PubMed] [Google Scholar]
- 50.Wang K., Li M., Hakonarson H. ANNOVAR: functional annotation of genetic variants from high-throughput sequencing data. Nucleic Acids Res. 2010;38:e164. doi: 10.1093/nar/gkq603. [DOI] [PMC free article] [PubMed] [Google Scholar]
- 51.Lek M., Karczewski K.J., Minikel E.V., Samocha K.E., Banks E., Fennell T., O’Donnell-Luria A.H., Ware J.S., Hill A.J., Cummings B.B., et al. Analysis of protein-coding genetic variation in 60,706 humans. Nature. 2016;536:285–291. doi: 10.1038/nature19057. [DOI] [PMC free article] [PubMed] [Google Scholar]
- 52.Lee S.H., Wray N.R., Goddard M.E., Visscher P.M. Estimating missing heritability for disease from genome-wide association studies. Am. J. Hum. Genet. 2011;88:294–305. doi: 10.1016/j.ajhg.2011.02.002. [DOI] [PMC free article] [PubMed] [Google Scholar]
- 53.Spracklen C.N., Horikoshi M., Kim Y.J., Lin K., Bragg F., Moon S., Suzuki K., Tam C.H.T., Tabara Y., Kwak S.-H., et al. Identification of type 2 diabetes loci in 433,540 East Asian individuals. Nature. 2020;582:240–245. doi: 10.1038/s41586-020-2263-3. [DOI] [PMC free article] [PubMed] [Google Scholar]
Associated Data
This section collects any data citations, data availability statements, or supplementary materials included in this article.
Supplementary Materials
Data Availability Statement
-
•
A detailed description of the availability and application process of the individual-level TWB data can be found at https://www.biobank.org.tw/english.php. Briefly, TWB made available the individual-level data and biological samples from the participants of the prospective cohort study in 2014. Available data include questionnaire surveys, physical measures, blood and urine tests, biological samples and genomic data (whole-genome sequencing, whole-genome genotyping, DNA methylation, HLA typing, and blood metabolome). Researchers interested in obtaining TWB individual-level data for research purposes would need to submit an application that includes a detailed research proposal and an institutional review board (IRB) approval to TWB (contact e-mail: biobank@gate.sinica.edu.tw). The application will undergo scientific and ethical reviews by external experts in relevant scientific fields and the TWB ethical governance committee (EGC). Once approved, researchers will be able to access the data for the approved research projects during the approved time period. For international researchers outside of Taiwan, an additional international data transfer agreement needs to be filed to the Ministry of Health and Welfare of Taiwan to enable sharing of the TWB individual-level data and any derived data.
-
•
All GWAS summary statistics are available at GWAS Catalog (https://www.ebi.ac.uk/gwas/; GCP ID: GCP000702) with the following accession numbers: GCST90278615, GCST90278616, GCST90278617, GCST90278618, GCST90278619, GCST90278620, GCST90278621, GCST90278622, GCST90278623, GCST90278624, GCST90278625, GCST90278626, GCST90278627, GCST90278628, GCST90278629, GCST90278630, GCST90278631, GCST90278632, GCST90278633, GCST90278634, GCST90278635, GCST90278636, GCST90278637, GCST90278638, GCST90278639, GCST90278640, GCST90278641, GCST90278642, GCST90278643, GCST90278644, GCST90278645, GCST90278646, GCST90278647, GCST90278648, GCST90278649, GCST90278650, GCST90278651, GCST90278652, GCST90278653, GCST90278654, GCST90278655, GCST90278656, GCST90278657, GCST90278658, GCST90278659, GCST90278660, GCST90278661, GCST90278662, GCST90278663, GCST90278664, GCST90278665, GCST90278666, GCST90278667, GCST90278668, GCST90278669, GCST90278670, GCST90278671, GCST90278672, GCST90278673, and GCST90278674.
-
•
All original code used in this manuscript has been deposited on Zenodo and is publicly available at https://doi.org/10.5281/zenodo.7091819 and https://doi.org/10.5281/zenodo.8303402, including scripts for genotype data QC, figure generation, and genome-wide association analysis. Other codes used in this manuscript can also be found in the key resources table.