

Abstract
Colorimetric sensing technologies have been widely used for both quantitative detection of specific analyte and recognition of a large set of analytes in gas phase, ranging from environmental chemicals to biomarkers in breath. But the accuracy and reliability of the colorimetric gas sensors are threatened by the humidity interference in different application scenarios. Though substantial progress has been made towards new colorimetric sensors development, unless the humidity interference is well addressed, the colorimetric sensors cannot be deployed for real-world applications. Although there are comprehensive and insightful review articles about the colorimetric gas sensors, they have focused more on the progress in new sensing materials, new sensing systems, and new applications. There is a need for reviewing the works that have been done to solve the humidity issue, a challenge that the colorimetric gas sensors commonly face. In this review paper, we analyzed the mechanisms of the humidity interference and discussed the approaches that have been reported to mitigate the humidity interference in colorimetric sensing of environmental gases and breath biomarkers. Finally, the future perspectives of colorimetric sensing technologies were also discussed.
Keywords: colorimetric sensor, humidity interference, gas sensor, environmental sensor, colorimetric sensor array, hydrophobicity, volatile organic compound, air pollutant, breath biomarker
Graphical Abstract

As one of the most important chemical sensing techniques, colorimetric sensing has many unique advantages, such as high selectivity, multiplexed sensing capability, high compatibility with digital imaging systems, and low cost. Colorimetric sensing refers to the techniques of detecting the presence and concentration of an analyte via a chemical reaction that accompanies with color change. Colorimetric sensors have been widely used in analytes detection in both liquid phase and gas phase.1–4 The most successful applications include pH papers, pregnancy test strips, and gas detector tubes. Substantial progress has been made to advance colorimetric sensing technologies for broader applications in gas phase analytes sensing, ranging from monitoring chemicals in the ambient air to detecting biomarkers in human breath.1, 4–10 The colorimetric sensing technologies can be used for both quantitative detection of specific analyte and recognition and classification of a large set of analytes. Although there are comprehensive and insightful review articles in the field of colorimetric gas sensors,1, 5, 7 they have focused more on the progress in new sensing materials, new sensing systems, and new applications. There is a need for reviewing the challenges that the colorimetric gas sensors have commonly faced, which set barriers for this technology from solving real-world problems. In this review paper, we dedicate to one of the universal challenges to most of the colorimetric gas sensors, the humidity interference.
No matter in the ambient environment or in human breath, water vapor is everywhere. Humidity refers to the amount of water vapor in the air. It can be expressed as absolute humidity and relative humidity (RH). Absolute humidity describes the concentration of water vapor in gas regardless of temperature, normally in grams per cubic meter. The relative humidity is defined as the ratio of the water vapor to saturated water vapor at a given temperature, typically in percentage. The concentration of water vapor in the atmosphere ranging from ~10 ppm in the coldest regions of the Earth’s atmosphere up to 5% by volume in hot, humid air masses.11 In human breath, the relative humidity is considered to be 100%, meaning the water vapor is saturated at breath temperature.12, 13 Considering the concentrations of most of the analytes of interest in ambient air or human breath are in the ppm or ppb level, the concentration of vapor is significantly higher than that of the target analytes. This presents a huge challenge to most gas sensors, ranging from semiconductor metal oxide sensors,14, 15 electrochemical sensors,16, 17 solid-state sensors (resistive, capacitive, amperometric, and potentiometric),18–20 optical sensors,21 mass-based sensors,22, 23 to the colorimetric sensors24, 25 for environmental gases26 or breath biomarkers detection.27
This review paper is intended to summarize the approaches that have been used to mitigate the humidity interference in colorimetric sensing of gaseous analytes. Different kinds of colorimetric sensing platforms for gas detection are covered by this review, such as the “lock-and-key” colorimetric sensors and the colorimetric sensing arrays. However, gas detector tubes will not be included in this review since the detector tube technology is very mature and has been widely used in different applications for decades.28, 29 The humidity interference also exists in gas detector tubes, but it has been well addressed by using humidity correction or desiccation.30–33 The patents related to colorimetric sensing of gases are not included in this review paper.
Because of the intrinsic differences, we divide the humidity mitigating approaches into two groups: one for environmental gas detection and the other for breath biomarkers detection. The major difference between these two groups is with the humidity level. The environmental humidity is subject to changes in ambient condition, in the range of 10–100% RH, while the humidity level in the breath is saturated at 100% RH. The challenges of mitigating humidity interference under these two conditions are different: one needs to deal with the humidity variation in environmental gas sensing while dealing with water condensation in breath biomarkers sensing.
COLORIMETRIC GAS SENSING PLATFORMS
To better understand the mechanism of humidity interference, we need to review the colorimetric sensing principle and sensing platforms briefly. Colorimetry is a conventional method in analytical chemistry. It measures the analytes in the sample through chemical reactions that are accompanied with color change. As for the detection of analytes in gas phase, typically, a gas-solid phase reaction model can be applied. Typically, the sensing probes are incorporated in a solid substrate, such as plate, membrane, or film, and the analytes in the gas phase are actively delivered or passively diffused into a reaction chamber, where they encounter and react with the sensing probes. The following processes are involved in the gas-solid phase reaction: 1) adsorption of analyte molecules on the surface of the substrate; 2) diffusion of analyte molecules within the matrix of the substrate; and 3) chemical reaction between gas analyte with sensing probes causing color change on the substrate. Generally speaking, the higher the analyte concentration in the gas phase, the faster the color development rate; the higher the gas flow rate, the faster the color development.
Similar to the biosystems, there are two kinds of colorimetric sensing platforms: 1) the lock-and-key sensing platform, where the sensing probe is highly selective to a specific analyte, e.g., the antibody-antigen interaction; 2) the colorimetric sensor array, where the sensing probes in the array cross-react with a large set of analytes, such as the mammalian olfactory system. As for the lock-and-key sensing platform, the concentration of the analyte can be quantified by the optical signal.24, 34, 35 While in the colorimetric sensor array, a large set of analytes can be classified through pattern recognition based on the high dimensional data.8, 36, 37
“Lock-and-key” colorimetric sensor.
The “lock-and-key” type of colorimetric sensors use specific sensing probes as the receptors to react with specific analytes, similar to the relationship between a lock and a key. Cross-sensitivity should be avoided in this type of sensors for the sake of high selectivity and accuracy. This is fundamentally different from the colorimetric sensor array, which takes advantage of the cross-sensitivity.
An optical detection system is needed to monitor the color change, as shown in Fig. 1. It consists of a light source, a substrate, and an optical detector. The optical signals that can be used for analyte quantification typically include transmission (or absorbance) and reflectance. In the absorbance mode, the substrate locates in between the light source and the optical detector. The color change on the substrate during analyte exposure causes the optical absorbance change, which is monitored by the optical detector. As for the reflection mode, the light source and the optical detector locate on the same side of the substrate. Similarly, the optical reflection change due to the color change on the substrate is monitored by the optical detector. To quantify the gas sample introduced in the detection system, either the flow rate or the volume of the gas will be controlled.
Figure 1.

Schematic of the absorption mode and reflection mode in colorimetric sensing.
To quantify the analyte concentration, information of both the kinetics and the thermodynamics can be used. The kinetics information refers to the color development rate and the thermodynamics information refers to the finalized color development when the chemical reaction reaches an equilibrium. Typically, the real-time absorbance or reflection signal will be monitored in kinetics-based colorimetric sensing. Fig. 2 shows how to quantify the concentration in a “lock-and-key” colorimetric carbon monoxide (CO) sensor.24 The slope of the absorbance change during CO injection was calculated to determine the CO concentration. As for the thermodynamics-based sensing, the absorbance or reflection signal before and after the analyte exposure will be measured and compared.38
Figure 2.

Quantification of analyte concentration in a “lock-and-key” colorimetric CO sensor. (A) Optical responses of colorimetric CO sensor to different concentrations (0, 50, 100, 200, 300, 400, and 500 ppm) of CO gas. (B) Calibration of sensor response to CO. The slope of the absorbance during CO injection increases linearly with the CO concentration. Reproduced with permission from Ref. 24. Copyright © 2018 American Chemical Society.
Colorimetric sensor array.
Unlike “lock-and-key” colorimetric sensor, which leverages the colorimetric chemical reaction between analytes and sensing probes with high specificity, colorimetric sensor array (or optoelectronic nose) takes advantage of the cross-sensitivity between a large set of analytes and sensor arrays through nonspecific interactions, mimicking the mammalian olfactory system.1, 39 These nonspecific interactions include both physical adsorptions and chemical reactions, ranging from van der Waals interactions, dipole-dipole interactions, hydrogen bonding interactions, salt bridges interactions, π-π stacking complexation, Bronsted acid-base interactions, donor-acceptor interactions, to ion-ion interactions.1 The colorimetric array is typically prepared by printing cross-reactive and hydrophobic dyes, such as Brønsted acidic or basic dyes, Lewis acid/base dyes, redox dyes, colorants with large permanent dipoles, and chromogenic aggregative materials onto hydrophobic membranes.1 In the colorimetric sensor array, the color map created by the entire sensor arrays rather than the response from each sensor carries the chemical information of the analytes, like the fingerprint. To obtain this chemical fingerprint, the images of the array before and after the analytes exposure are captured by digital imaging devices, such as the flatbed scanners, digital cameras, contact image sensors, and cell phones,1 from which the color difference map of the sensor array can be quantified and visualized for analysis, as shown in Fig. 3.40
Figure 3.

Image of the 36-dye colorimetric sensor array before exposure (left) and after exposure to decylamine (middle) after equilibration at full vapor pressure at 295 K. A subtraction of the two images yields a difference vector. This vector is usefully visualized using a difference map (right). Reproduced with permission from Ref. 40. Copyright © 2006 American Chemical Society.
The major data analysis methods for the colorimetric sensor array is pattern recognition, which can be categorized as: 1) descriptive methods, including hierarchical cluster analysis (HCA) and principal component analysis (PCA); 2) classification methods, including linear discriminant analysis (LDA), support vector machines (SVMs), and artificial neural networks (ANNs).1 Fig. 4(A) and (B) show the results of using HCA and PCA methods for toxic industrial chemicals (TICs)41 and volatile organic compounds (VOCs)40 analysis. Though in most of the cases, these data analysis methods are used for the classification of a set of analytes, sometimes they can also be used for quantification of the analyte concentrations,25, 42 as shown in Fig. 4(C).
Figure 4.

Data analysis methods for colorimetric sensor array. (A) Hierarchical cluster analysis for 20 toxic industrial chemicals (TICs) at (immediately dangerous to life or health) (IDLH) concentrations and a control. (B) Two principal components of the colorimetric sensor array from the response data averages of the 100 VOCs at 295 K, at their full vapor pressure using principal component analysis (PCA) method. (C) Dendrogram of hierarchical cluster analysis (HCA) for trimethylamine (TMA) at different concentrations in gases. Reproduced with permission from Ref. 41, 40, and 42. Copyright © 2010, 2006, and 2016 American Chemical Society.
MECHANISMS OF HUMIDITY INTERFERENCE
Humidity can interfere with the colorimetric sensing through either the physical interaction or the chemical interaction, as shown in Fig. 5. Physically, water molecules can be adsorbed onto the surface of the sensing probes, the substrates, or the optical components, resulting in physical changes in the sensing system.
Figure 5.

Illustration of the possible mechanisms of humidity interference: (A) water adsorption, (B) substrate swelling, and (C) chemical reaction.
Silica plate is widely used as the substrate for fabricating colorimetric sensors. Humidity can interfere with the colorimetric sensing by changing the transmittance of the silica plate, and the RH-induced absorbance change is in the VIS-NIR (visible–near-infrared) region (Fig. 6).43 This type of humidity effect is reversible since it is only a physical adsorption-desorption process.
Figure 6.

The measured absorbance of the silica plate under different relative humidities at the wavelengths of (A) 442 nm, (B) 525 nm, and (C) 850 nm. Reproduced with permission from Ref. 43. Copyright © 2009 American Chemical Society.
As illustrated in Fig. 5(A), the thickness of the water layer on the sensing substrate may change with humidity, especially for the sol-gel matrix. Usually, the thickness of the water layer increases along with increase in the relative humidity, leading to more gas analytes dissolving and sensor signal increasing.44
Humidity can cause the swelling of the hydrogels (Fig. 5(B)), a commonly used polymer matrix in colorimetric sensing system, and introduce false signals to the transducers, such as the shift of the diffraction wavelength.45
Chemical changes due to humidity can be much more complicated. The penetration of water vapor into the hydrophobic plastic film in solid-state colorimetric sensor could possibly cause some degree of plasticization action in the matrix, resulting in an increase of sensitivity.46 In some colorimetric sensing system, water is able to catalyze the chemical reaction.24 For some colorimetric sensors, water molecules take part in the chemical reaction and the environmental humidity could play a subtle role in affecting the sensor performance. Li et. al. found that the Pd(II)-silica porous microsphere sensors-based cumulative colorimetric sensor array was actually independent of the humidity change over a wide range, from 10% to 90%, as shown in Fig. 7.25 They concluded that since water was a necessary component in the chemical reaction of Pd(II) reduction, the concentration of water vapor in 10%−90% RH was far more than enough for the chemical reaction and hence the sensor was immune to the humidity variation.
Figure 7.

Responses of Pd (II)-silica porous microsphere sensors-based cumulative colorimetric sensor array to 10 ppm ethylene in the presence of 10% to 90% relative humidity. Reproduced with permission from Ref. 25. Copyright © 2019 American Chemical Society.
In a colorimetric sensing platform, the physical interaction and the chemical interaction can happen simultaneously, which makes the humidity interference hard to predict. The entanglement between physical change and chemical change could also result in a nonlinear relationship between the humidity level and the sensor response, creating additional difficulties for signal compensation and correction. To avoid the burden on signal processing and algorithms development, desiccants, Nafion tubing, and hydrophobic substrates are often used to eliminate or repel the water vapor from the chemical reactions. On the other hand, it is also possible to take advantage of the effect that humidity brings to the sensing system to promote the performance of the sensors for analytes detection. This strategy is usually used in breath biomarkers detection, since the humidity level in breath is high and constant.
MITIGATION OF HUMIDITY INTERFERENCE IN COLORIMETRIC SENSING OF ENVIRONMENTAL GASES
Colorimetric sensors, including the “lock-and-key” colorimetric sensors and colorimetric sensor arrays, have been widely applied in different kinds of environmental gas sensing. The environmental gases here refer to pollutants and chemical vapors existed in home settings, offices, and industrial settings that are harmful to human health, chemical warfare agents and explosives, and odors of food and beverage. Based on the applications, we classify the analytes into five categories:
Volatile organic compounds (VOCs): VOCs are organic chemicals which show high vapor pressure at room temperature. VOCs are released by household products, building materials, furniture, gasoline and other products. They can cause short-term and long-term adverse health effects, such as irritation, headache, nausea, or cancers.47
Air quality-related pollutants: These refer to six air quality-related principal pollutants (or “criteria pollutants”) identified by EPA (Environmental Protection Agency), which are harmful to people and the environment.48
Toxic industrial chemicals: These refer to industrial chemicals that are manufactured, stored, transported, and used throughout the world.49 These chemicals are very toxic and could have short-term health effect or risk to the exposed individuals.
Chemical warfare agents and explosives: These refer to warfare agents such as nerve agents, poisons, and explosives, which are critical to homeland security.7
Odors of food & beverage: These refer to the VOCs released by the food and beverage products, such as pork, fish, chicken, turkey, squid, sausage, rice, fruit, coffee, tea, vinegar, beer, wine, honey, and other drinks.5 These odors can be used for the safety and quality assessment of food and beverage.
The analytes, sensing probes, substrates, and humidity concerns of the colorimetric sensors for environmental gases detection are summarized in Table 1.
Table 1.
Summary of colorimetric sensing of environmental gases.
| Categories | Analytes | Sensing probes | Substrates | Humidity concerns |
|---|---|---|---|---|
| Volatile organic compounds | Hydrocarbons, alcohols, amines, ethers, aldehydes, ketones, carboxylic acids, thioethers, phosphines,phosphites, thiols, arenes, and halocarbons.36, 37, 40 | Metalloporphyrins, free-base porphyrins, pH indicators, and solvatochromic dyes.36, 37, 40 | Reverse phase silica thin-layer-chromatography plates.36, 37 | Hydrophobic dyes and substrate were selected to avoid humidity interference in 10 to >95 % RH.37 |
| Air quality related pollutants | Particulate matter, ozone, nitrogen dioxide, sulfur dioxide, carbon monoxide, and lead.24, 50, 51 | Redox indicators,50 and potassium disulfitopalladate (II).24 | Silica G TLC plates.24, 50 | The sensing performance does depend on the humidity of the ambient air.24 |
| Toxic industrial chemicals | Industrial chemicals that are manufactured, stored, transported, and used throughout the world, such as, ammonia, arsine, chlorine, diborane, dimethylamine, fluorine, formaldehyde, hydrogen chloride, hydrogen cyanide, hydrogen fluoride, hydrogen sulfide, hydrazine, methylamine, methyl hydrazine, nitric acid, nitrogen dioxide, phosgene, phosphine, sulfur dioxide, and trimethylamine, et al.41, 52, 53,54 | Sol-gel-colorant solutions,41, 52, 53 and mononuclear iron(II) neutral complex.54 | Polyethylene terephthalate (PET) film.41, 52, 53 | Hydrophobic dyes in hydrophobic matrixes rendering the sensor array much less sensitive to changes in humidity.41, 52, 53 |
| Chemical warfare agents and explosives | Nerve agents like sarin, soman, and tabun; poisons, like mustard gas, lewisite, phosgene, phosgene oxime, cyanide, mace, and ricin; explosives like TNT (2,4,6- trinitrotoluene), DNT (2,4 dinitrotoluene), HMX (octahydro-1,3,5,7-tetranitro- 1,3,5,7-tetrazocine), Tetryl (2,4,6-trinitrophenylmethylnitramine), DDNP (diazodinitrophenol), RDX (cyclotrimethylenetrinitramine), pA (picric acid), DMNB (2,3-dimethyl-2,3-dinitrobutane), and TATP (triaceonetriperoxide).7 | Functionalized gold nanoparticles;55 oxime-modified PDA (OX-PDA) liposomes;56 push-pull chromophores;57 Brady’s reagent, metal salts, pH indicators, porphyrins, redoxsensitive dyes, solvatochromic dyes, and Strong base.58 59 | Cellulose acetate membrane filter,56 silica gel plate,57 and polypropylene membranes.59 | No color changes were detected at the humidity of saturated H2O atmosphere57 due to the use of hydrophobic dyes in hydrophobic matrixes, the colorimetric sensor array is very insensitive to changes in ambient humidity.58 |
| Odors of food & beverage | Relevant volatile organic chemicals from food and beverage.5, 60 | Porphyrins and metalloporphyrins, pH indicators.5 | C2 reverse phase silica gel plates, polyvinylidene fluoride (PVDF) membrane, silica gel plates, TiO2 nanoporous film, polyvinylidene difluoride membrane, Acetate sheet.5 | The insensitivity of colorimetric sensors to changes in humidity is due to the hydrophobic dyes and hydrophobic matrixes.60 To analyze samples with high humidity, the dyes and the membrane must be hydrophobic.61 |
As discussed before, the concentration of water vapor in the atmosphere ranging from ~10 ppm in the coldest regions of the Earth’s atmosphere up to 5% by volume in hot, humid air masses.11 This wide humidity variation presents a practical challenge for the colorimetric sensing systems design. The sensing probes and the substrates are the key factors to determine the humidity effect of the colorimetric sensors. As suggested in Table 1, increasing the hydrophobicity of the sensing probes and the substrates is a widely adopted method for mitigating the humidity interference. Besides this materials engineering approach, there are also other methods that can address the humidity interference from the aspects of sample conditioning and signal compensation.
Using desiccants to reduce humidity level.
To avoid the physical and chemical interactions of water molecules with the sensing system, a straightforward way is to remove the water vapor in the gas sample before it is delivered to the sensing chamber. This can be achieved by implementing a dehumidifier to the sensing system. The ambient humidity level can be reduced to almost zero by applying the desiccants for the pretreatment of the gas sample. Kawanura et. al. developed a hand-held colorimetric toluene gas sensor for the prevention of sick building syndrome.62 It was found that the colorimetric chemical reaction between toluene and the sensing probe, I2O5, was inhibited by high humidity. A hand-crafted dehumidifier made from calcium chloride was incorporated in the gas pretreatment system (Fig. 8(A)), through which the gas sample was passed to bring the humidity down to ~19% for sensitive detection of toluene. With the help of the dehumidifier, the colorimetric sensor was able to detect toluene at a concentration of 0.5 ppm, as shown in Fig. 8(B).
Figure 8.

Using dehumidifier to reduce the humidity of the gas sample. (A) Schematic diagrams of toluene gas generation system, pre-treatment system, and the gas sensing system. (B) The effect of humidity (%) and response (%) at toluene gas concentration of 0.5 ppm. Reproduced with permission from Ref. 62. Copyright © 2006 Elsevier B.V.
Because of the continuous exposure to the ambient environment, the efficiency of the desiccants for dehumidification will drop. Usually, the desiccants will be packed in a cartridge, which can be replaced when its performance drops to a certain level.
Using the matrices of substrates for humidity regulation.
The matrix of the substrates can not only immobilize the sensing probes but also modulate the local environment for the colorimetric sensing.1 Thus, using hydrophobic materials as the matrices and substrates to immobilize sensing probes is a very effective way to mitigate the humidity interference.1 The hydrophobicity and the hydrophilicity reflect how easily the water molecules can physically adsorb on the surface of the materials. If this water adsorption process can be blocked, the humidity interference can be mitigated.
Hydrophobic plates/membranes/films are widely used to minimize the humidity interference to the colorimetric sensors. As listed in Table 1, the hydrophobic substrates used in preparing the colorimetric sensors include both organic polymers and inorganic materials, such as reverse phase silica thin-layer-chromatography plates,36, 37 polyethylene terephthalate (PET) film,41, 52, 53 cellulose acetate membrane,56 silica gel plate,57 polypropylene membranes,59 polyvinylidene fluoride (PVDF) membrane,63–65 acetate sheet.5 and TiO2 nanoporous film.66
Since the sensing probes are incorporated on the substrate surface, to mitigate the humidity interference, the sensing probes should be hydrophobic as well. The combination of hydrophobic substrates with water-insoluble, hydrophobic dyes have been proved to be a very effective strategy in reducing humidity interference for colorimetric sensor array.67 Suslick’s group has tried many ways to fabricate these hydrophobic colorimetric sensor arrays, mostly through directly printing hydrophobic dyes on the various hydrophobic substrate, such as reverse phase silica gel thin-layer-chromatography plates36, 37 and PVDF63–65. Feng and Suslick et al. demonstrated that by immobilizing hydrophobic colorants on an extremely hydrophobic PVDF membrane, highly sensitive colorimetric detection of gaseous formaldehyde was achieved in 10 to 90% RH.64 As shown in Fig. 9, the colorimetric sensor array generated almost identical color difference maps at different humidity levels in the range of 10–90% RH without (Fig. 9(A)) and with (Fig. 9(B) formaldehyde exposure, suggesting a high stability against humidity variation.
Figure 9.

Hydrophobic colorimetric sensor array for highly sensitive formaldehyde detection. (A) Difference maps of the colorimetric sensor array to various humidity from 10% to 90% RH; (B) Difference maps of the colorimetric sensor array to formaldehyde at 1.5 ppm at different levels of relative humidity at room temperature. Reproduced with permission from Ref. 64. Copyright © 2010 American Chemical Society.
By proper choice of hydrophobic dyes and hydrophobic substrates, the colorimetric sensing array could even be immune to 100% RH. Janzen and Suslick et al. demonstrated that colorimetric sensor arrays were nonresponsive to humidity changes in the range of 11–100% RH, as shown in Fig. 10.40 The excellent humidity stability was essential for the sensor array to differentiate 100 VOCs.
Figure 10.

Difference map of colorimetric sensor array to different saturated aqueous salt solutions at 295 K. The array shows no response to humidity change in the range of 11–100% RH. Reproduced with permission from Ref. 40. Copyright © 2006 American Chemical Society.
Among different kinds of hydrophobic substrates, PVDF film seems to be a popular choice in different applications. The effectiveness of PVDF film for improving the reproducibility of the colorimetric sensing array was also proven by Wang et al. in volatile compounds detection.68 They evaluated the reproducibility of the sensing array for n-heptane (n-Hep), ammonia (NH3), and chlorine hydride (HCl) detection in the humidity range of 0–100% and found no significant differences in sensor responses (Fig.11 (A)). They attributed the excellent immunity of the sensing array to humidity to the super-hydrophobic matric of the PVDF film. The effectiveness of PVDF substrate to improve the stability of the colorimetric sensor against humidity changes was also reported by Zhong et. al. in biogenic amines detection (Fig. 11 (B)).69
Figure 11.
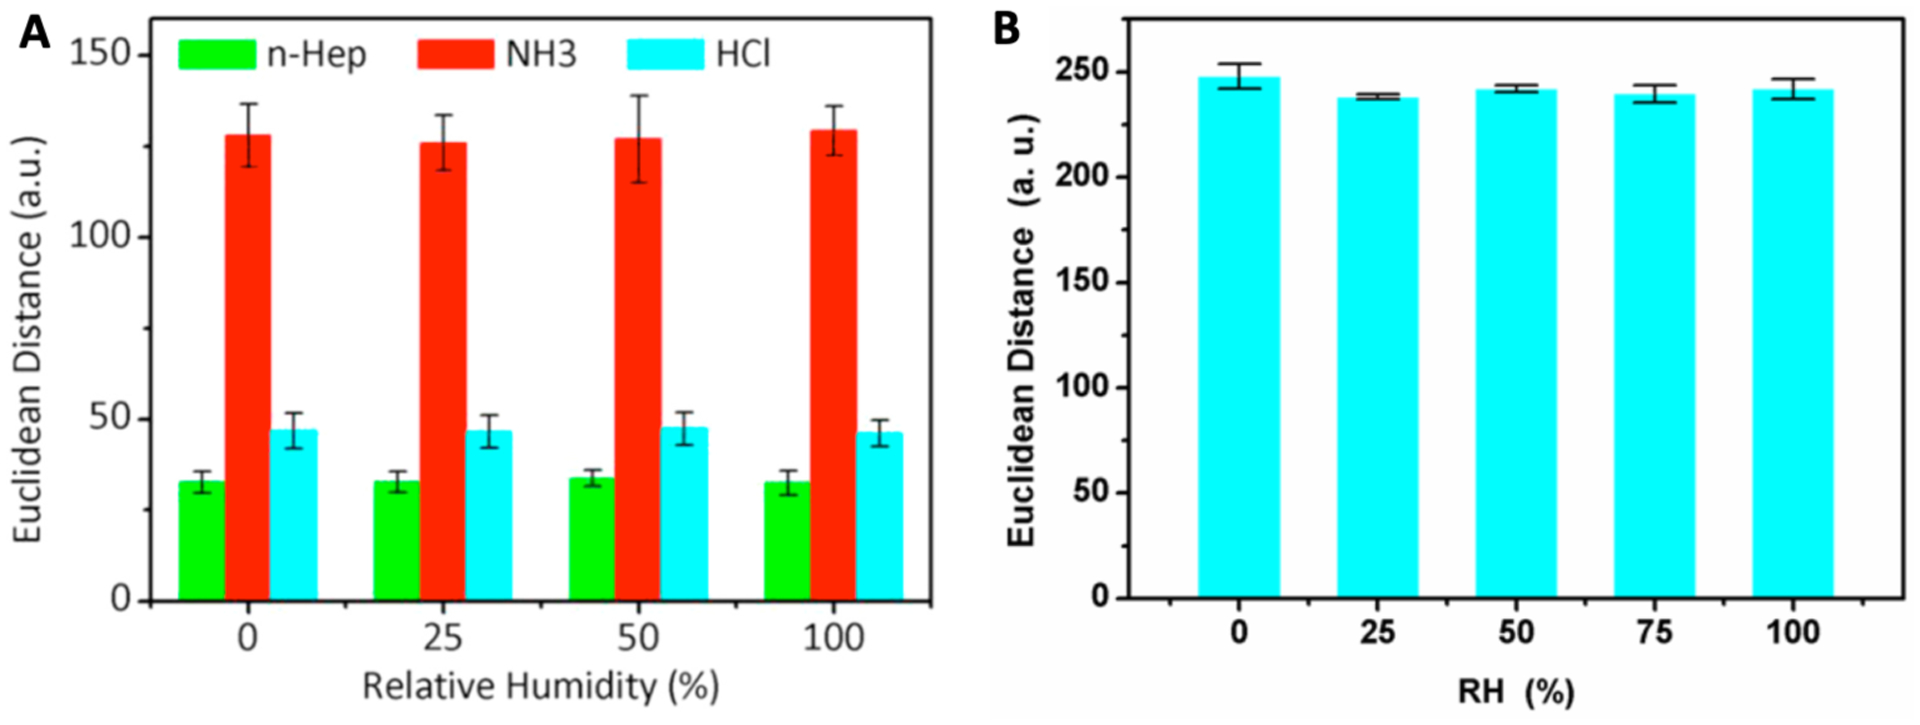
Humidity influence on colorimetric sensor arrays based on PVDF film. (A) The reproducible responses of colorimetric sensor arrays to volatile compounds: n-heptane (n-Hep), ammonia (NH3) and chlorine hydride (HCl) in different relative humidity (RH). (B) The influence of humidity on response of the arrays to trimethylamine (TMA) at concentration of 10 ppm. Reproduced with permission from Ref. 68 & 69. Copyright © 2019 & 2018 Elsevier B.V.
Printing soluble dyes onto porous membranes seems to be straightforward for colorimetric sensors fabrication but implementing the nonpermeable pigments in the colorimetric sensors requires substantial chemical engineering work. Generally, a host material needs to be used for forming the nanoporous pigments via the sol-gel method.70, 71 In this way, the nanoporous pigments can be created to improve the sensitivity, durability, stability, and the hydrophobicity of the colorimetric sensors.52 Suslick’s group has embedded a broad range of chemically responsive pigments into ormosils (organically modified silicate) to form nanoporous pigments and then printing these sol-gel colorants onto hydrophobic membranes to fabricate colorimetric sensor arrays.41, 52, 53, 72 Ormosil sol-gel matrix is an excellent porous matrix, mainly due to its high stability, large surface area, and good hydrophobicity. The colorimetric sensor arrays produced by this method are unaffected by the variations of relative humidity from 10% to 90%, as shown in Fig. 12.41 Moreover, by properly selecting the silane precursors and hydrophobic membranes, the colorimetric sensor arrays can even be used for hydrophilic analytes detection in liquid.73, 74
Figure 12.

Humidity effect on colorimetric sensor array based on ormosils matrix. (A) The colorimetric sensor array has no response to variations in humidity from 10% to 90% RH (i.e., the color difference maps are black). (B) Difference maps of the colorimetric sensor array for ammonia and sulfur dioxide at IDLH (immediately dangerous to life or health) concentrations at different humidity levels after 2 minutes of exposure time. Reproduced with permission from Ref. 41. Copyright © 2010 American Chemical Society.
By adding plasticizer to the polymer-based colorimetric film, the hydrophobicity of the polymer matrix can be enhanced, as well as the immunity to humidity. Courbat et al. reported a colorimetric ammonia (NH3) sensor by mixing pH indicator, polymers, and hydrophobic plasticizer.75 The sensor showed high humidity dependence (Fig. 13(A)) but the humidity interference could be modulated by the plasticizer. Compared to tributyl phosphate (TBP), dioctyl phthalate (DOP) was very effective in suppressing the humidity effect due to its strong hydrophobic nature (Fig. 13(B)).
Figure 13.

Using hydrophobic plasticizer to minimize the humidity effect on colorimetric ammonia sensor. (A) Transmission spectra of the bromophenol blue (BPB) + PMMA+ tributyl phosphate (TBP) film in 100ppm of NH3 for different RH levels. (B) Humidity response of the BPB + PMMA films with either TBP or dioctyl phthalate (DOP) as plasticizer when they were exposed to 5ppm of NH3 for different RH levels. Reproduced with permission from Ref. 75. Copyright © 2009 Elsevier B.V.
Inorganic film with nanoporous structures could be another alternative for mitigating humidity interference in colorimetric sensing systems. Huang et al. developed a TiO2-based nanoporous film as the sensing substrate for colorimetric detection of meat-borne trimethylamine (TMA), a key indicator for meat spoilage.66 The TiO2-based nanoporous film was impervious to humidity change. As shown in Fig. 14, the colorimetric sensor gave almost no response to humidity change in the range of 30% – 70% RH.
Figure 14.

The nanoporous TiO2 film-based colorimetric sensor array is unaffected by humidity in the range of 30% to 70% RH. (A) SEM images of nanoporous TiO2 film, (B) nanoporous colorimetric sensor array under different levels of humidity exposure. Reproduced with permission from Ref. 66. Copyright © 2016 Elsevier B.V.
Instead of increasing the hydrophobicity of the film matrix, humectant can also be introduced to buffer the variation of the ambient humidity. Qin et al. added glycerol, a hygroscopic substance, to the silica plate-based colorimetric formaldehyde (HCHO) sensor to serve as the humidity buffer to stabilize the humidity level in the sensor matrix.34 The variation of the sensor response to HCHO was less than ±15% despite the humidity change in the range of 5%−90%, as shown in Fig. 15. Study also indicated that hydroxide, an active component in the sensing recipe to control the basicity for chemical reaction, played an important role in improving the stability of the sensor against humidity.76
Figure 15.

Using humectant to minimize the humidity effect on colorimetric formaldehyde (HCHO) sensor. (A) molecular structure of glycerol; (B) silica plate-based formaldehyde sensor with glycerol; and (C) sensor responses to HCHO (120 ppb and 300 ppb) at different relative humidity levels (5%–90%). Reproduced with permission from Ref. 34. Copyright © 2015 IEEE
Hydrogels are 3D cross-liked, highly water swellable, hydrophilic polymer networks that have been widely used in sensing. Hydrogels can serve as a host matrix to immobilize the sensing probes and regulate the diffusion of the analytes in the sensing network.77 Devadhasan et al. reported a disposable hydrogel test strip consisting of titanium nanoparticles, poly (vinyl alcohol) (PVA) hydrogel and chemically responsive pH indicators for sensing toxic gases such as hydrogen fluoride (HF), chlorine (Cl2), ammonia (NH3), and formaldehyde (CH2O).78 The colorimetric detection was based on the color change of dyes due to acid-base reactions. Humidity analysis suggested that the test strips were unresponsive to changes in relative humidity, due to the use of glutaraldehyde as a cross-linking agent. It was reported that glutaraldehyde preserved the structure of PVA hydrogel film from swelling and shrinking up to 95% humidity exposure.78 Since the colorimetric sensor strip was mechanically stable regardless of the ambient humidity, changes in humidity did not affect the sensing performance of the hydrogel test strips, as shown in Fig. 16.
Figure 16.

Humidity effect on a colorimetric hydrogel test strip for toxic gas detection. Color Euclidean distance shows that the sensor has no detectable response to 50% RH at room temperature. (W/OE: without exposure at 50% RH; WE: with exposure at 50% RH). Reproduced with permission from Ref. 78. Copyright © 2017 Elsevier B.V.
Using humidity sensor to signal compensation.
Instead of avoiding the humidity interference, one can establish the relationship between the humidity level and its impact on the optical signals and then remove the humidity-induced sensor response from the overall signal. This method is more practical when the humidity dependence of the sensor is predictable. Lin et al. found that though the colorimetric CO sensor they developed was significantly dependent on the ambient humidity level, the sensitivity of the sensor followed a linear relationship with the humidity level, as shown in Fig. 17.24 This sensing behavior was due to the catalytic effect and could be simply corrected by implementing a numerical compensation algorithm based on the signal from an additional humidity sensor.
Figure 17.

Humidity interference correction by numerical compensation. (A) CO sensor responses to 100 ppm CO gas samples under different humidity levels. (B) Sensor responses to CO with various concentrations under different relative humidity levels. Reproduced with permission from Ref. 24. Copyright © 2018 American Chemical Society.
Maruo et al. developed an indigo carmine-coated paper for ambient ozone detection (Fig. 18 (A)).79 The sensor, which consisted of cellulose sheet, humectant, acid, and indigo carmine, gave a color change from blue to white upon ozone exposure, as shown in Fig. 18 (B). They found that the response of the sensor to ozone was highly influenced by the relative humidity, but the relationship between the relative humidity and the optical signal could be described by formulas. Three equations were used to correct the humidity interference in the RH range of 10–55%, 55–70%, and 70–85%, respectively, as shown in Fig. 18(C).
Figure 18.

Humidity correction by formulas. (A) Schematic diagrams of the optical sensing system. (B) Photographs of ozone detection paper after exposure to 0–640 ppb×h ozone at 25°C, and 60% RH: (a) 0 ppb, (b) 129 ppb, (c) 268 ppb, (d) 416 ppb, and (e) 640 ppb. (C) Relationship between relative humidity and optical signal for 380ppb ozone detection and the inset shows the correction formulas at different RH ranges. Reproduced with permission from Ref. 79. Copyright ©@ 2009 Elsevier B.V.
Environmental humidity variation makes the humidity interference in colorimetric sensing of environmental gases less predictable. Three kinds of methods have been used to mitigate the humidity inference, including the use of: 1) desiccants to reduce humidity level; 2) matrices of substrates for humidity regulation, and; 3) humidity sensor to signal compensation. Among these methods, incorporating hydrophobic dyes/pigments with hydrophobic plates/membranes/films is the widely used approach in different applications.
MITIGATION OF HUMIDITY INTERFERENCE IN COLORIMETRIC SENSING OF BREATH BIOMARKERS
Human breath contains thousands of chemical compounds, the concentrations of which range from parts per trillion (ppt) to percent level.80, 81 Because of the partial pressure equilibrium between the pulmonary capillary blood and alveolar gas in the lung,82 the chemical biomarkers in the exhaled air can be monitored for evaluating the health conditions of the human body, such as diagnostics of diseases or measurement of metabolism. Compared to blood tests, breath analysis offers a noninvasive diagnostic method. The biomarkers discovered in breath can be used for diagnosis of diseases such as: 1) VOCs for lung cancer diagnosis, 2) nitric oxide, carbon monoxide, and ammonia for inflammatory lung diseases, 3) acetone for diabetes, 4) malondialdehyde, ethane, pentane, and methylated alkanes for oxidative stress in breast cancer, heart transplant rejection, and bronchial asthma, and 5) benzene in exhaled air for occupational hygiene.83–85
Conventional breath analysis equipment like GC-MS and SIFT-MS are bulky and expensive,86, 87 and more attentions have been paid to the development of portable breath analyzers.88, 89 Chemical sensors are the core parts of breath analyzers. Electrochemical sensors, metal oxide sensors, spectroscopy sensors, and electronic noses have been used for building portable breath analyzers.90 Colorimetric sensor is another promising candidate for sensing breath biomarkers in portable or wearable breath analyzers because of their excellent selectivity, high sensitivity, low cost, and the potential to be miniaturized. In addition, the colorimetric sensor array is an optoelectronic nose that can detect VOC fingerprints for lung cancer diagnosis.1, 8,91, 92
The exhaled breath is nearly saturated with water at body temperature, which is important to keep the airway surfaces moist and enhance the gas exchange.93, 94 The nearly 100% RH in breath sample and the potential water condensation on the sensor surface can be a huge challenge to the colorimetric sensing of breath biomarkers, considering most of the biomarkers are in ppm or even ppb level. By overcoming the humidity challenge, many colorimetric sensors have been reported in successfully detecting different kinds of breath biomarkers. The sensing systems include both the “lock-and-key” colorimetric sensors and colorimetric sensor arrays.
The breath biomarkers, clinical correlation, related diseases, sensing probes, substrates, and humidity concerns of these colorimetric sensors are summarized in Table 2.
Table 2.
Summary of colorimetric sensing of breath biomarkers.
| Breath biomarkers | Clinical correlation | Related diseases | Sensing probes | Substrates | Humidity concerns |
|---|---|---|---|---|---|
| Oxygen (O2) | Oxygen consumption related to metabolism. | Oxygen uptake, metabolic rate.95 | Lignin95 | Paper95 | The sensor is capable of selectively detecting oxygen in human breath at high humidity (100%).95 |
| Carbone dioxide (CO2) | CO2 production related to metabolism. | COPD (chronic obstructive pulmonary disease), asthma,96 and capnography.46, 97 | pH indicators, such as mcresol purple,98 cresol red,98 phenol red,46 and thymol blue.96 | Hydrophobic plastic film (ethyl cellulose) incorporated with a phase-transfer agent (tetraoctyl ammonium hydroxide)46 | The colorimetric CO2 sensor showed stable performance at 37°C and 100% humidity.46 |
| Acetone | Breath acetone is correlated with blood glucose (BG) and blood ketone levels.99, 100 | Diabetes99, 100 | Resorcinol35, 101 | Nafion membrane35, 101 | The incorporated organic acids played an important role in mitigating the humidity interference to the Nafion membrane catalysts in humid breath environment.35 |
| Nitric oxide (NO) | NO level is elevated in asthma with inflammatory. | Asthma102, 103 | Cobalt tetraphenylpor phyrin (CoTPP)104 and phenylenediam ine derivatives.105 | Polystyrene (PSt), ethylcellulose (EC), polycyclohexyl methacrylate (PCHMA),104 and microporous cellulose membrane.105 | The hydrophobic polymer matrix significantly improved the humidity resistance.104 A Nafion tubing was integrated to avoid the humidity interference.105 |
| Hydrogen sulfide (H2S) | An endogenous gaseous signaling molecule and potential therapeutic agent.106 | Bad breath107 | Lead(II) acetate,10 silver nanoparticles,108 and copper(II) complex.107 | Polyacrylonitrile nanofibers,10 nylon membrane,108 and Prozorb substrate.107 | Sensor can detect sub-ppm H2S gas in high relative humidity (~90% RH).10 The sensitivity of the sensor is retained in 50–96% RH, but decreased at low humidity level, e.g. 20% RH.108 |
| Ammonia (NH3) | Associated with blood urea nitrogen | Renal failure109–111 | pH indicators109,110 | Hydrogel film (with the combination of polyvinyl alcohol, titanium oxide nanoparticles, and hydroquinone)109 | The hydrogel film with the combination of other chemicals provides a versatile matrix to minimize the environmental interference.109 |
| VOCs | Volatile organic compounds (VOCs) related to metabolic changes within cancer cells. | Lung cancer8,91, 92 | Metalloporphyr ins, pH indicators, and dyes with large permanent dipoles.8, 91, 92 | Poly(vinylidene fluoride) membrane92 | Sensor is stable against humidity because of the high hydrophobicity of polyvinylidene fluoride.92 |
Among these colorimetric breath sensors, some are compatible with the highly humid breath condition, while others need interventions to mitigate the humidity interference.
Colorimetric sensors compatible with highly humid breath condition.
The concentrations of breath oxygen and carbon dioxide carry important health relevant information about the metabolic rate (energy expenditure) and the pulmonary system (COPD, Capnography). Yu et al. developed an innovative breath O2 sensing method based on the yellowing of newspaper.95 They introduced UV light as a switch to activate the selective reaction between O2 and newspaper and the results showed that the sensor could reliably detect breath O2 at 100% RH. Zhao et al. reported a colorimetric device for carbon dioxide detection in real breath.96 This device utilized abundant water in exhaled gas to mitigate the humidity interference on the sensor. The sensing cartridge was coated with a pH indicator for CO2 monitoring. When the warm exhaled gas contacts the sensing cartridge, water vapor condensed and formed an aqueous layer with an initial pH of 9.05. The pH decreased as CO2 in exhaled gas dissolved in the aqueous layer, leading to proton release and color change of the pH indicator, as shown in Fig. 19.
Figure 19.

High humidity assisted breath biomarkers detection. (A) Schematic diagram of breath CO2 sensing system. (B) Real and simulated color development on sensor chip after 6.5 s of exposure to CO2 sample. (C) Normalized absorbance vs. time at the CO2 concentration of 0.08–6.28%. Reproduced with permission from Ref. 96. Copyright © 2013 Elsevier B.V.
The detection of breath O2 and CO2 is relatively easy because the volume concentrations of O2 and CO2 in breath are at the percent level. To detect the ppm level breath biomarkers, the sensing probes must be functional at high humidity level. Cha et al. reported the colorimetric sensing of hydrogen sulfide (H2S) down to sub-ppm level at 90% RH in breath for halitosis diagnosis using the lead acetate (Pb(Ac)2) anchored nanofibers.10 Neus Jornet-Martínez et al. developed a solid-phase plasmonic colorimetric sensor based on silver nanoparticles coated nylon membrane and demonstrated its capability of detecting hydrogen sulfide-like compounds in breath samples.108 They studied the influence of humidity on the colorimetric sensor in the range of 20–100% RH at room temperature (20 °C). The results showed that the sensitivity of the sensor is retained in 50–96% RH but decreased only at low humidity level, e.g. 20% RH, as shown in Fig. 20.
Figure 20.
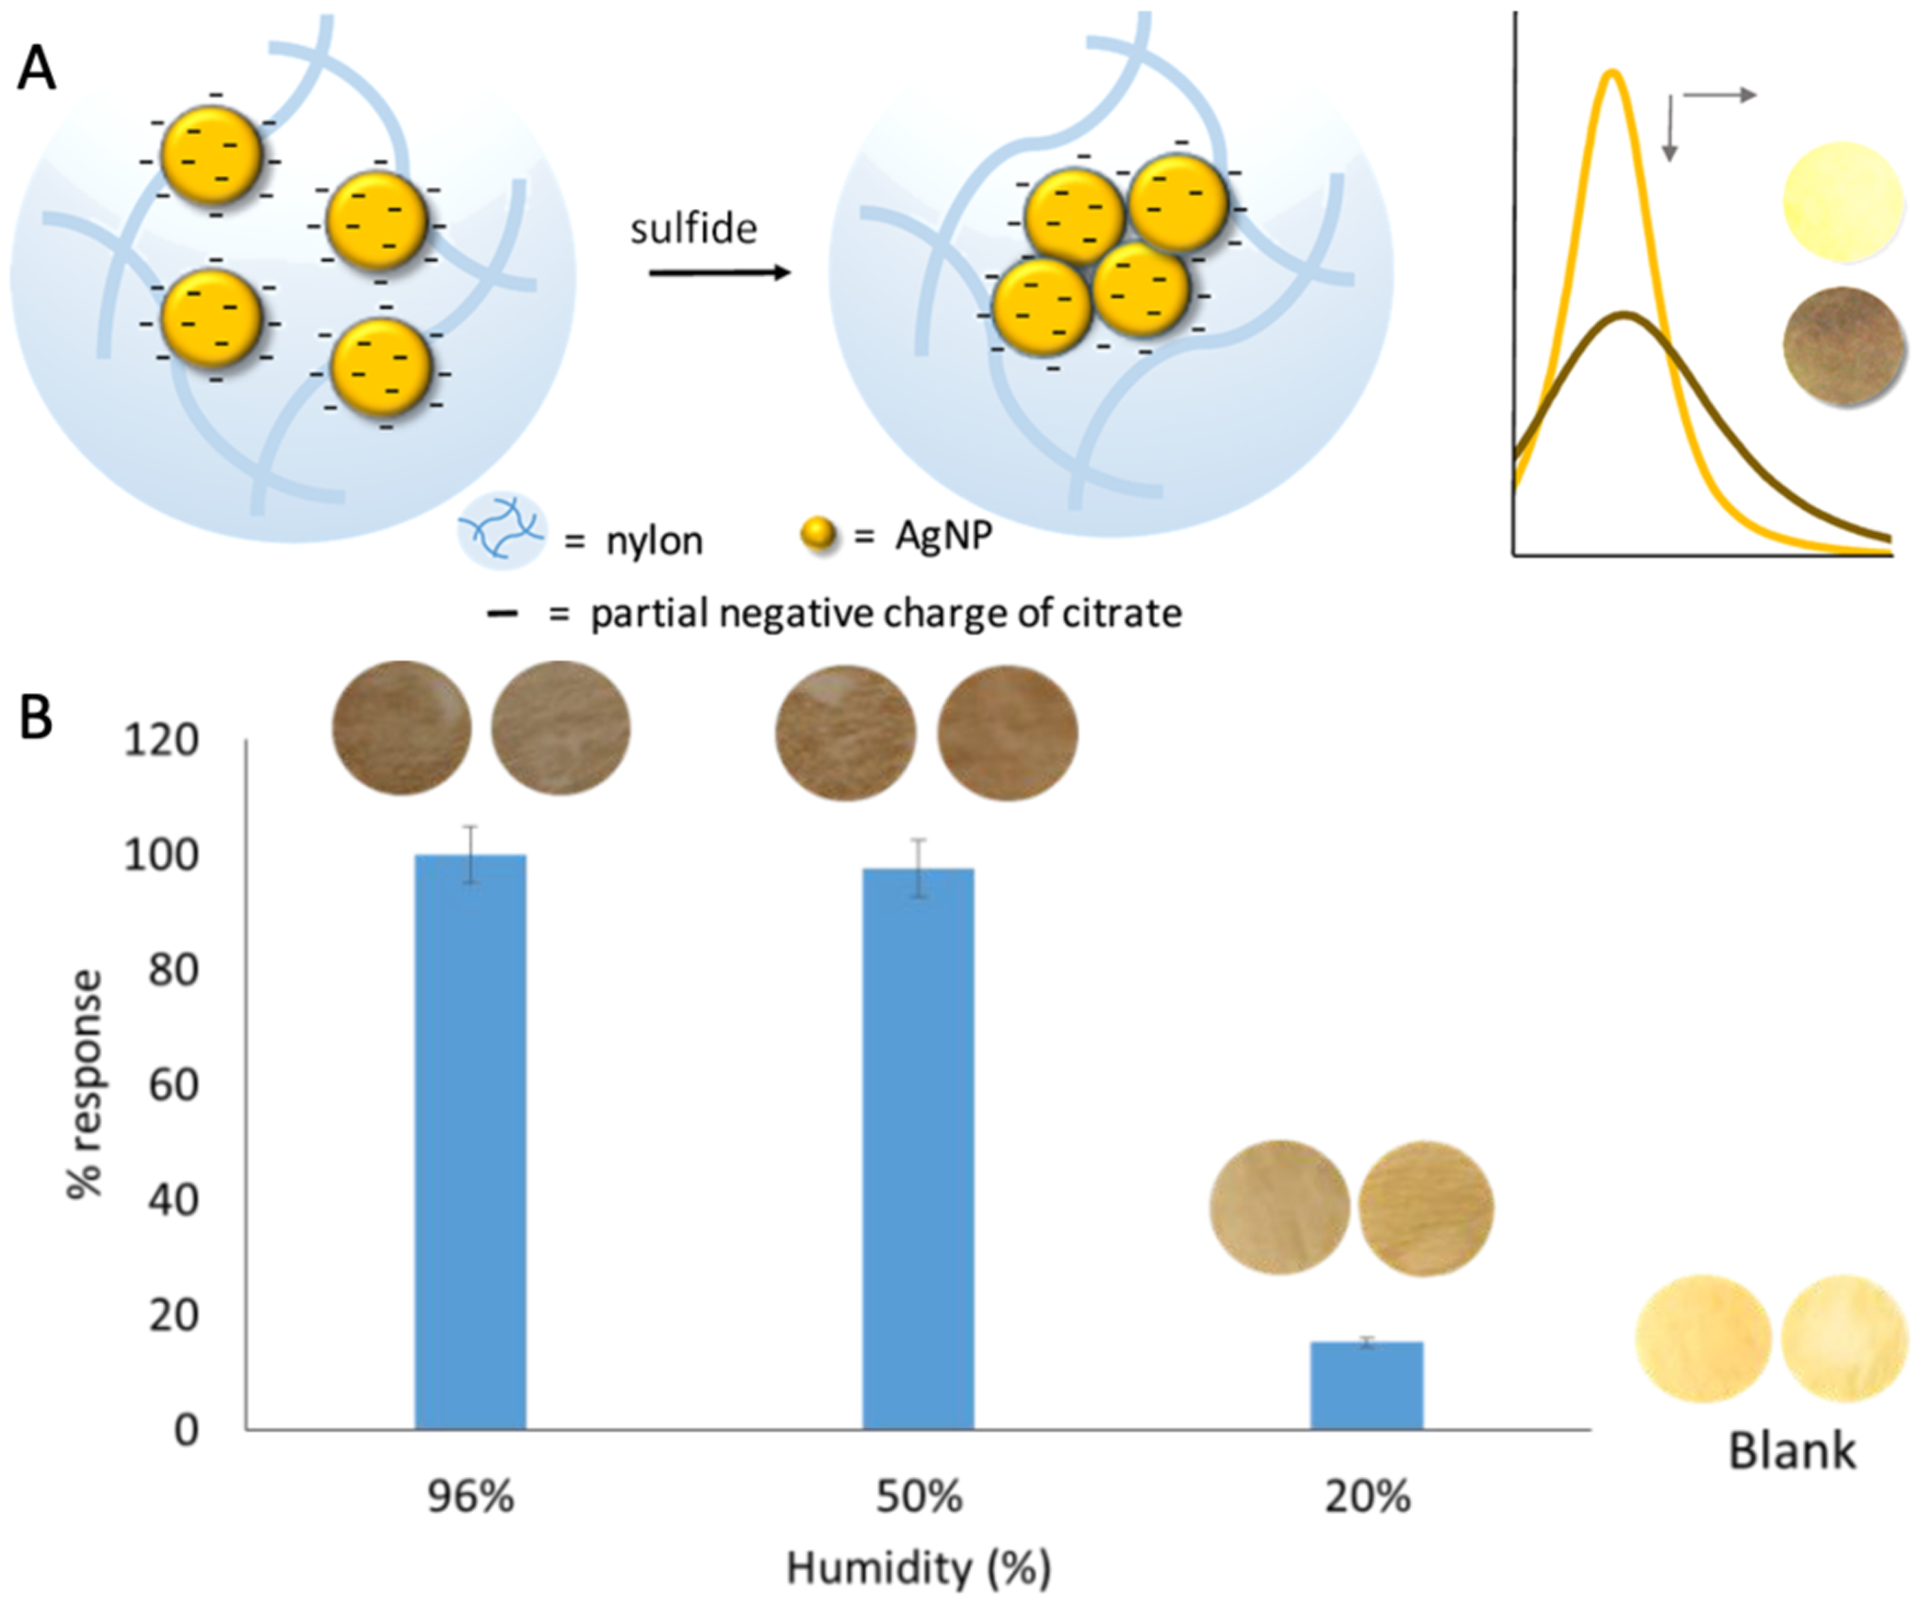
Plasmonic colorimetric sensor for breath hydrogen sulfide detection. (A) Colorimetric sensing principle. (B) Influence of humidity on the response of the sensor for 2500 ppvb H2S at 20 °C. Reproduced with permission from Ref. 108. Copyright © 2019 American Chemical Society.
Ito et al. reported a colorimetric sensing approach of using 4-nitrophenylhydrazine (4-NPH)-coated porous glass to detect breath acetone.112 During their humidity interference study, they observed that when humidity increased, though the concentration of the sensing probe, 4-NPH, in the pores of the glass substrate was decreased, the volume of the solution actually increased. These two opposite changes canceled out each other, which made the performance of the sensor chip unaffected by humidity level.
Using desiccants to reduce breath humidity level.
For the sensing probes that are sensitive to humidity, additional interventions are needed for accurate breath biomarkers detection. To ensure the accuracy of the breath biomarkers detection, usually an efficient sample conditioning system was adopted to remove potential interferants and reduce the humidity level. Prabhakar et al. developed a miniaturized mouthpiece packed with desiccant particles to condition the humidity in real breath samples for breath analysis (Fig. 21 (A)).113 The desiccation efficiency of the mouthpiece can be adjusted by the geometry of the mouthpiece, such as length and diameter, as shown in Fig. 21 (B). By carefully choosing the desiccants, the mouthpiece can selectively remove the water molecules while leaving the analytes of interest intact, which was very useful for the breath analyzers. Fig. 21 (C) showed the performance of calcium chloride-packed mouthpiece, where ~70% of the humidity was removed while analytes like acetone, carbon dioxide, nitric oxide, and oxygen were preserved.
Figure 21.

Online sample conditioning mouthpiece for reducing breath humidity. (A) Schematic of the online sample conditioning mouthpiece. (B) Desiccation efficiency simulated as a function of tube geometry for a given volumetric flow rate. (C) Selective removal of humidity by the desiccant mouthpiece over other chemical components of interest. Adapted with permission from Ref. 113. Copyright © 2012 American Chemical Society
Mazzone et al. implemented the desiccant in front of the colorimetric sensor array to reduce humidity interference so that the VOCs related to the lung cancer were reliably detected in the breath (Fig. 22).114 In addition, temperature was controlled at 30°C to minimize the condensation of water vapor.
Figure 22.

Colorimetric sensor array cartridge with integrated desiccant. There are 4 channels for airflow, each containing 32 sensor elements. The top channel contains a desiccant and oxidizer. Reprinted with permission of the American Thoracic Society from Ref. 114. Copyright © 2015 American Thoracic Society. All rights reserved. Cite: Mazzone, P. J.; Wang, X.-F.; Lim, S.; Jett, J.; Choi, H.; Zhang, Q.; Beukemann, M.; Seeley, M.; Martino, R.; Rhodes, P., 2015, Progress in the development of volatile exhaled breath signatures of lung cancer. Annals of the American Thoracic Society,12, 752–757. Annals of the American Thoracic Society is an official journal of the American Thoracic Society.
Using Nafion tubing for humidity regulation.
Nafion is a copolymer of tetrafluoroethylene and perfluoro-3,6-dioxa-4-methyl-7-octene-sulfonic acid. It is very inert to chemical attack and highly permeable to water, making it an ideal material for drying and humidifying gas samples. Prabhakar et al. developed an ultrasensitive colorimetric sensor for nitrogen oxides detection aiming at both breath analysis and environmental monitoring.105 The phenylenediamine derivatives (o-phenylenediamine and diethyl-p-phenylenediamine) coated microporous cellulose membrane was capable of detecting ppb level NO in exhaled breath, showing a high potential for asthma diagnosis. As shown in Fig. 23(A), the sensor signal was interfered by high humidity (~100% RH). The shape of the response curve suggested that the humidity interference was probably due to condensation of water on the optical pathway. After implementing a Nafion tubing to the inlet of the sensing chamber, the humidity interference was effectively avoided (Fig. 23(A)). The performance of the sensing platform for breath sample analysis was validated against the gold standard method (Fig. 23(B)), which also proved the effectiveness of this humidity mitigating approach.
Figure 23.

Using Nafion tubing to avoid humidity interference. (A) Sensor response at ~100 % relative humidity with and without a Nafion tubing located at the inlet of the sensing chamber. (B) Evaluation of the sensor accuracy with a Nafion tubing for real sample analysis. Comparison of NO concentration determined by the present sensor vs NO concentration determined by the gold standard method (chemiluminescence). Reproduced with permission from Ref. 105. Copyright © 2010 American Chemical Society.
Using the matrices of substrates for humidity regulation.
As discussed in previous sections, the combination of hydrophobic dyes with hydrophobic substrates is very effective in reducing the humidity interference. This approach also works for breath biomarkers detection.92 Zhong et al. reported the recognition of VOCs in breath for lung cancer screening using colorimetric sensor arrays in a wide humidity range.92 Their experimental results indicated that the sensor responses were quite stable in 0–100% RH range, as shown in Fig. 24(A). The super-hydrophobic material of PVDF and the micro to nanostructure of the substrate were both believed to contribute to the hydrophobicity and thus, the high sensing stability against humidity variation.
Figure 24.

(A) Stability of the colorimetric sensor array for breath VOCs detection against humidity. (B) Response curve of the colorimetric CO2 sensor exposed to an alternating atmosphere of N2 and 5% CO2 at 100% relative humidity and 37°C. Reproduced with permission from Ref. 92 & 46. Copyright © 2018 Springer and 1997 Elsevier B.V.
Mills et al. developed a solid-state colorimetric sensor for breath-by-breath CO2 detection by using a hydrophobic plastic film (ethyl cellulose) incorporated with a phase-transfer agent (tetraoctyl ammonium hydroxide) and a hydrophilic pH-sensitive dye (phenol red).46 The colorimetric CO2 sensor showed stable performance at 37°C and 100% humidity, as shown in Fig. 24(B). It was speculated that the hydrophobic plastic film and the phase-transfer agent played an important role in mitigating the humidity interference.
Shiba et al. reported a humidity-resistive colorimetric breath NO sensor that was fabricated by dispersing the sensing probe in a hydrophobic polymer matrix.104 They dispersed cobalt tetraphenylporphyrin (CoTPP) in three kinds of hydrophobic polymer film matrix: polystyrene (PSt), ethylcellulose (EC), and polycyclohexyl methacrylate (PCHMA) (Fig. 25 (A)). It was found that the hydrophobic polymer matrix not only significantly improved the humidity resistance (Fig. 25 (B)) but also dramatically increased the sensitivity, which made the sensor capable of detecting NO in humid breath for asthma diagnosis.
Figure 25.

Improving humidity resistance by dispersing sensing probe in hydrophobic polymer matrix. (A) Top surface structures and water-drop contact angle measurements of the (a,b) cobalt tetraphenylporphyrin (CoTPP), (c,d) cobalt tetraphenylporphyrin ethylcellulose (CoTPP-EC), (e,f) cobalt tetraphenylporphyrin polystyrene (CoTPP-PSt), and (g,h) cobalt tetraphenylporphyrin polycyclohexyl methacrylate (CoTPP-PCHMA) films (Scale bar: 5 μm). (B) One ppm NO sensing at 100°C under low humidity (<20 RH%) and high humidity (85 RH%) conditions for CoTPP-EC film (red solid line) and CoTPP film (black solid line). Reproduced with permission from Ref. 104. Copyright © 2020 MDPI.
Worrall et al. reported an approach of using organic acids incorporated Nafion membranes to maintain the catalytic capability in colorimetric detection of exhaled acetone in the humid breath environment for diabetes diagnosis.35 The colorimetric detection was based on the chemical reaction between breath acetone and membrane-immobilized resorcinol, producing colored flavan, as shown in Fig. 26(A).35 In order to preserve the catalytic activity of Nafion membrane, organic acids such as vanillic or tiglic were immobilized in the membrane. Though these acids cannot serve as catalysts in the reaction, they can modulate the ionization of the perfluorosulfonic acid (PSA) groups in Nafion to catalyze the chemical reaction between acetone and resorcinol. This modulation was based on the phenomena that ionization of acids was lower in acidic solvent than in water, and the pKa of strong acid increased in weak acid relative to water. Thus, the incorporated organic acids played an important role in mitigating the humidity interference to the Nafion membrane catalysts in humid breath environment. The schemes of this mechanism were presented in Fig. 26(B). The performance of the membrane for acetone detection at 100% RH was presented in Fig. 26(C), which proved the effectiveness of this approach for exhaled acetone detection in humid human breath.
Figure 26.

Water-resistant polymeric acid membrane catalyst for acetone detection in the exhaled breath. (A) Nafion-catalyzed reaction between resorcinol and acetone. (B) Mechanism for preservation of PSA catalytic activity in humid environments. Without tiglic acid (TA), PSA is a strong acid that readily deprotonates in the presence of water and can no longer catalyze the reaction. With TA, PSA is a weak acid with sufficient protonation even in the presence of water to catalyze the reaction. (C) The membrane response with acetone exposure at 100% RH. Reproduced with permission from Ref. 35. Copyright © 2018 American Chemical Society.
Since the humidity level in breath is around 100% RH, the challenge for colorimetric breath sensor is not the humidity variation but the water condensation. Though some colorimetric sensors are compatible with the highly humid breath condition, many of them still need interventions to mitigate the humidity interference. Three kinds of methods have been used to mitigate the humidity inference, including the use of: 1) desiccants to reduce humidity level; 2) Nafion tubing for humidity regulation, and; 3) matrices of substrates for humidity regulation. Among these methods, using the matrices of substrates for humidity regulation is the widely used approach. Compared to environmental gases detection, breath biomarkers detection requires special consideration about the breath sampling system because the exhalation flow rate and the backpressure could affect the test results.115 Generally speaking, the online mode (meaning the subject directly exhales to the sensors/devices) is easier to have the water condensation issue than the offline mode (meaning the breath sample of the subject is collected in a bag first and then delivered to the sensors/devices for detection).
CONCLUSIONS AND FUTURE PERSPECTIVES
Colorimetric sensors have been widely used for sensing environmental gases and breath biomarkers. Unlike other gas sensors, which are mostly based on physical interactions between the analytes and the receptors, colorimetric sensors use a broad range of chemical interactions for analytes detection. Depending on whether the sensing is based on specific binding or non-specific binding, colorimetric sensors can be classified into two types: the “Lock-and-key” colorimetric sensor and the colorimetric sensor array. The former is mostly used for quantitative detection of a specific analyte, while the latter is widely used for recognition and classification of a large set of analytes. Colorimetric sensor array is the dominating technique in colorimetric sensing, mainly due to its powerful sensing capability for providing high-dimensional data.
Humidity interference is a universal threat to the accuracy and stability of the colorimetric sensors. It can interfere with the colorimetric sensing through either the physical or the chemical way. The methods for mitigating humidity interference include: 1) using desiccants to reduce humidity level, 2) using humidity sensor for signal compensation, 3) using Nafion tubing for humidity regulation, and 4) using the matrices of substrates for humidity regulation humidity. The analyte concentration may be reduced when external dehumidifying intervention is introduced to the sensing system, because of either physical adsorption or chemical adsorption of the analyte molecules on the desiccants or filters. This could be problematic when the concentration of the analyte in the gas is too low. Usually, the materials of the desiccants or filters need to be carefully selected to minimize the analyte loss. Substrate/matrix engineering is the primary approach to mitigate the humidity effect in colorimetric sensing because this approach solves the humidity interference intrinsically and can make the sensor fabrication simple and efficient. Furthermore, the substrate/matrix engineering approach could avoid the unwanted analytes loss, an issue that the desiccation methods could have.
The most widely used approach for mitigating the humidity interference is to incorporate hydrophobic sensing elements on hydrophobic substrates. Though this approach has been proved to be effective, it limits the options of choosing other kinds of sensing elements. The hydrophilicity could add another dimension for the colorimetric sensing array to expand its sensing power.
The colorimetric sensor array has shown its advantage over conventional e-nose technologies because it can include a broad range of physical and chemical intermolecular interactions, ranging from van der Waals interactions, dipole-dipole interactions, hydrogen bonding interactions, salt bridges interactions, p-p stacking complexation, Bronsted acid-base interactions, donor-acceptor interactions, to ion-ion interactions. Nevertheless, the mammalian olfactory system operates in an aqueous environment, meaning the sensing mechanism is water compatible. To advance the current colorimetric sensor array, more efforts are needed to further understand and mimic the working principles of the mammalian olfactory system.
Coating plays a central role in preparing the colorimetric sensor cartridge. The conventional way is to cast the sensing elements solution on a proper substrate and then let it dry. Though this method is effective, it also faces two technical challenges. One is the well-known “coffee-ring” effect, which could cause uneven distribution of the sensing elements in the sensing spots. And the other is the variation associated with the coating process, e.g. spot size variation, batch-to-batch variation, and crystallization. These challenges can cause precision and reproducibility issues for colorimetric sensing. New coating methods need to be developed to address these challenges.
Both environmental gases monitoring and breath biomarkers detection require a multiplex sensing platform on which multiple analytes can be detected simultaneously. Colorimetric sensor is complementary to other sensing techniques, especially other optical sensing methods. A hybrid approach of integrating different sensing systems together could offer a full solution for certain applications, such as environmental health study.
The internet of things (IoT) is an emerging technology that could change industry, business, and our daily life. It can connect billions of devices around the world to the internet for data collecting and sharing. Sensors play an essential role in data collection. Moreover, smartphones are also integrating more and more sensors to achieve more functions for better user experience. Though physical sensors that are compatible with modern electronics are widely available, such as proximity sensor, accelerometer, gyroscope, magnetometer, GPS, microphone, barometer, ambient light sensor, thermometer, humidity sensor, and biometric sensor, the proper chemical sensors are still missing. An IoT and smartphone compatible chemical sensor should be miniaturized, multiplexed, low power, and low cost. Colorimetric sensor array could be a potential candidate because it is compatible to the complementary metal-oxide-semiconductor (CMOS) imaging electronics and can collect high-dimensional data about the chemicals. However, two major challenges remain: 1) How to further reduce the size of the colorimetric sensing array while maintaining its sensitivity and reproducibility? 2) How to make the colorimetric sensing array reusable rather than disposable? 3) How to make the colorimetric sensors immune to environmental changes, such as humidity and temperature variations? Considering that the chemical sensors to be implemented in IoT and smartphone should be miniaturized and mass-manufacturable, chemical engineering on the sensing probes and substrate matrices are needed to address the challenges of both the reusability and environmental stability.
To expand the use of colorimetric gas sensors in broad applications, the sensor performance should be competitive with other leading gas sensing technologies in the field, such as semiconductor metal oxide sensors, electrochemical sensors, solid-state sensors (resistive, capacitive, amperometric, and potentiometric), optical sensors, and mass-based sensors. The sensor performance could be evaluated from three different aspects: analytical performance, physical dimension, and power consumption. In terms of analytical performance, originating from its chemically specific nature, the colorimetric sensors can be highly sensitive and selective, compared to the sensors that are based on physical interactions between analytes and receptors. But on the other hand, the reversibility and lifetime of the colorimetric sensors could be a challenge also because of the high specificity and affinity of chemical interactions. As for the physical dimension, the size of colorimetric sensors could be further reduced by grafting the advances of complementary metal-oxide-semiconductor (CMOS) imaging electronics, which could promote their applications in wearables and IoT. The power consumption of the colorimetric sensors can be very low, especially when miniaturized LEDs and CMOS imagers are used for the optical readout. This attribute the colorimetric sensors the competitive advantage over sensing techniques that require heating elements, such as semiconductor metal oxide sensors.
Colorimetric sensors have unique strengths in collecting chemical information about the environment and our health. We envision that the next-generation colorimetric sensors could play an important rolein advancing smartphones, smart home, wearable devices, mobile-health, and the internet of things.
ACKNOWLEDGMENTS
We dedicate this paper to Prof. Nongjian Tao, our forever mentor. This work was supported by National Institutes of Health (NIH) (Project Numbers: 4R44ES029006–02 and 5R44ES029006–03).
VOCABULARY
- Colorimetric sensor
a kind of sensor which can qualitatively or quanlitatively detect the presence or the concentration of analyte through optical signal (absorbance or reflectance) associated with color change that is stimulated by analyte
- Gas sensor
A kind of sensor that can measure the presence or the concentration of gasous analyte
- Humidity interference
an unwanted response on gas sensor caused by the water vapor present in the air
- Hydrophobicity
a kind of physical property of material to repel water. Hydrophobicity and hydrophilicity are commonly used in surface science, in which a surface is defined as hydrophobic when its static water contact angle is larger than 90° and is defined as hydrophilic when the contact angle is lesser than 90°
- Air pollutant
a substance (gases, particles, or droplets) present in the air that can harm human health or cause adverse effects to the ecosystem
- Breath biomarker
a substance present in human breath that can indicate of the presence or severity of some disease.
Footnotes
The authors declare no competing financial interest.
REFERENCES:
- 1.Li Z; Askim JR; Suslick KS, The optoelectronic nose: colorimetric and fluorometric sensor arrays. Chemical Reviews 2019, 119 (1), 231–292. [DOI] [PubMed] [Google Scholar]
- 2.Gunnlaugssona T; Glynna M; Tocci M; Krugera PE; Pfeffer FM, Anion recognition and sensing in organic and aqueous media using luminescent and colorimetric sensors. Coordination Chemistry Reviews 2006, 250 (23–24), 3094–3117. [Google Scholar]
- 3.Zhou X; Lee S; Xu Z; Yoon J, Recent progress on the development of chemosensors for gases. Chemical Reviews 2015, 115 (15), 7944–8000. [DOI] [PubMed] [Google Scholar]
- 4.Azzouz A; Vikrant K; Kim K-H; Ballesteros E; Rhadfi T; Malik AK, Advances in colorimetric and optical sensing for gaseous volatile organic compounds. TrAC-Trends in Analytical Chemistry 2019, 118, 502–516. [Google Scholar]
- 5.Huang X.-w.; Zou X.-b.; Shi J.-y.; Li Z.-h.; Zhao J.-w., Colorimetric sensor arrays based on chemo-responsive dyes for food odor visualization. Trends in Food Science & Technology 2018, 81, 90–107. [Google Scholar]
- 6.Schmitt K; Tarantik KR; Pannek C; Wöllenstein J, Colorimetric materials for fire gas detection-A review. Chemosensors 2018, 6 (2). [DOI] [PMC free article] [PubMed] [Google Scholar]
- 7.Kangas MJ; Burks RM; Atwater J; Lukowicz RM; Williams P; Holmes AE, Colorimetric sensor arrays for the detection and identification of chemical weapons and explosives. Critical Reviews in Analytical Chemistry 2017, 47 (2), 138–153. [DOI] [PMC free article] [PubMed] [Google Scholar]
- 8.Mazzone PJ; Hammel J; Dweik R; Na J; Czich C; Laskowski D; Mekhail T, Diagnosis of lung cancer by the analysis of exhaled breath with a colorimetric sensor array. Thorax 2007, 62 (7), 565–568. [DOI] [PMC free article] [PubMed] [Google Scholar]
- 9.Hou C; Lei J; Huo D; Song K; Li J; Luo X; Yang M; Fa H, Discrimination of lung cancer related volatile organic compounds with a colorimetric sensor array. Analytical Letters 2013, 46 (13), 2048–2059. [Google Scholar]
- 10.Cha J-H; Kim D-H; Choi S-J; Koo W-T; Kim I-D, Sub-parts-per-million hydrogen sulfide colorimetric sensor: lead acetate anchored nanofibers toward halitosis diagnosis. Analytical Chemistry 2018, 90 (15), 8769–8775. [DOI] [PubMed] [Google Scholar]
- 11.Wallace JM; Hobbs PV, Atmospheric science: An introductory survey. 2nd edition. 2006; p 483–483. [Google Scholar]
- 12.Mutlu GM; Garey KW; Robbins RA; Danziger LH; Rubinstein I, Collection and analysis of exhaled breath condensate in humans. American Journal of Respiratory and Critical Care Medicine 2001, 164 (5), 731–737. [DOI] [PubMed] [Google Scholar]
- 13.Rosias PPR; Dompeling E; Hendriks HJE; Heijnens JWCM; Donckerwolcke RAMG; Jobsis Q, Exhaled breath condensate in children: Pearls and pitfalls. Pediatric Allergy and Immunology 2004, 15 (1), 4–19. [DOI] [PubMed] [Google Scholar]
- 14.Dey A, Semiconductor metal oxide gas sensors: A review. Materials Science and Engineering B-Advanced Functional Solid-State Materials 2018, 229, 206–217. [Google Scholar]
- 15.Masikini M; Chowdhury M; Nemraoui O, Review-metal oxides: Application in exhaled breath acetone chemiresistive sensors. Journal of the Electrochemical Society 2020, 167 (3). [Google Scholar]
- 16.Wei P; Ning Z; Ye S; Sun L; Yang FH; Wong KC; Westerdahl D; Louie PKK, Impact analysis of temperature and humidity conditions on electrochemical sensor response in ambient air quality monitoring. Sensors 2018, 18 (2). [DOI] [PMC free article] [PubMed] [Google Scholar]
- 17.Pang XB; Shaw MD; Gillot S; Lewis AC, The impacts of water vapour and co-pollutants on the performance of electrochemical gas sensors used for air quality monitoring. Sensors and Actuators B-Chemical 2018, 266, 674–684. [Google Scholar]
- 18.Tai HL; Duan ZH; He ZZ; Li X; Xu JL; Liu BH; Jiang YD, Enhanced ammonia response of Ti3C2Tx nanosheets supported by TiO2 nanoparticles at room temperature. Sensors and Actuators B-Chemical 2019, 298. [Google Scholar]
- 19.Zhang Y; Zhang J; Jiang Y; Duan Z; Liu B; Zhao Q; Wang S; Yuan Z; Tai H, Ultrasensitive flexible NH3 gas sensor based on polyaniline/SrGe4O9 nanocomposite with ppt-level detection ability at room temperature. Sensors and Actuators B: Chemical 2020, 319, 128293. [Google Scholar]
- 20.Tai HL; Duan ZH; Wang Y; Wang S; Jiang YD, Paper-based sensors for gas, humidity, and strain detections: A review. Acs Applied Materials & Interfaces 2020, 12 (28), 31037–31053. [DOI] [PubMed] [Google Scholar]
- 21.Brook TE; Narayanaswamy R, Polymeric films in optical gas sensors. Sensors and Actuators B-Chemical 1998, 51 (1–3), 77–83. [Google Scholar]
- 22.Addabbo T; Fort A; Mugnaini M; Vignoli V; Baldi A; Bruzzi M, Quartz-crystal microbalance gas sensors based on TiO2 nanoparticles. Ieee Transactions on Instrumentation and Measurement 2018, 67 (3), 722–730. [Google Scholar]
- 23.Matsuguchi M; Kadowaki Y, Poly(acrylamide) derivatives for QCM-based HCl gas sensor applications. Sensors and Actuators B-Chemical 2008, 130 (2), 842–847. [Google Scholar]
- 24.Lin C; Xian X; Qin X; Wang D; Tsow F; Forzani E; Tao N, High performance colorimetric carbon monoxide sensor for continuous personal exposure monitoring. ACS Sensors 2018, 3 (2), 327–333. [DOI] [PubMed] [Google Scholar]
- 25.Li Z; Suslick KS, Colorinnetric sensor array for monitoring CO and ethylene. Analytical Chemistry 2019, 91 (1), 797–802. [DOI] [PubMed] [Google Scholar]
- 26.Spinelle L; Gerboles M; Villani MG; Aleixandre M; Bonavitacola F, Field calibration of a cluster of low-cost available sensors for air quality monitoring. Part A: Ozone and nitrogen dioxide. Sensors and Actuators B-Chemical 2015, 215, 249–257. [Google Scholar]
- 27.Tai HL; Wang S; Duan ZH; Jiang YD, Evolution of breath analysis based on humidity and gas sensors: Potential and challenges. Sensors and Actuators B-Chemical 2020, 318. [Google Scholar]
- 28.Bäther W, Detector tube technology. Sensors Update 1998, 4 (1), 81–108. [Google Scholar]
- 29.National Security Technologies LLC, Portable colorimetric tubes for chemical vapor detection market survey report. 2014.
- 30.Dräger-tubes & CMS-Handbook, 16th edition. Dräger Safety AG & Co.: 2011. [Google Scholar]
- 31.Gastec gas detection system - detector tube list, 22nd edition. Gastec Co.: 2015. [Google Scholar]
- 32.Gas detection tubes and sampling handbook, 2nd edition,. RAE Systems Inc.: 2013. [Google Scholar]
- 33.Sensidyne colorimetric gas detector tube handbook. Sensidyne, LP: 2013. [Google Scholar]
- 34.Qin X; Wang R; Tsow F; Forzani E; Xian X; Tao N, A colorimetric chemical sensing platform for real-time monitoring of indoor formaldehyde. IEEE Sensors Journal 2015, 15 (3), 1545–1551. [Google Scholar]
- 35.Worrall AD; Qian Z; Bernstein JA; Angelopoulos AP, Water-resistant polymeric acid membrane catalyst for acetone detection in the exhaled breath of diabetics. Analytical Chemistry 2018, 90 (3), 1819–1826. [DOI] [PubMed] [Google Scholar]
- 36.Rakow NA; Suslick KS, A colorimetric sensor array for odour visualization. Nature 2000, 406 (6797), 710–713. [DOI] [PubMed] [Google Scholar]
- 37.Rakow NA; Sen A; Janzen MC; Ponder JB; Suslick KS, Molecular recognition and discrimination of amines with a colorimetric array. Angewandte Chemie International Edition 2005, 44 (29), 4528–4532. [DOI] [PubMed] [Google Scholar]
- 38.Bridgeman D; Corral J; Quach A; Xian X; Forzani E, Colorimetric humidity sensor based on liquid composite materials for the monitoring of food and pharmaceuticals. Langmuir 2014, 30 (35), 10785–10791. [DOI] [PubMed] [Google Scholar]
- 39.Askim JR; Mahmoudi M; Suslick KS, Optical sensor arrays for chemical sensing: The optoelectronic nose. Chemical Society Reviews 2013, 42 (22), 8649–8682. [DOI] [PubMed] [Google Scholar]
- 40.Janzen MC; Ponder JB; Bailey DP; Ingison CK; Suslick KS, Colorimetric sensor arrays for volatile organic compounds. Analytical Chemistry 2006, 78 (11), 3591–3600. [DOI] [PubMed] [Google Scholar]
- 41.Feng L; Musto CJ; Kemling JW; Lim SH; Zhong W; Suslick KS, colorimetric sensor array for determination and identification of toxic industrial chemicals. Analytical Chemistry 2010, 82 (22), 9433–9440. [DOI] [PubMed] [Google Scholar]
- 42.Li Z; Li H; LaGasse MK; Suslick KS, Rapid quantification of trimethylamine. Analytical Chemistry 2016, 88 (11), 5615–5620. [DOI] [PubMed] [Google Scholar]
- 43.Ohira S-I; Dasgupta PK; Schug KA, Fiber optic sensor for simultaneous determination of atmospheric nitrogen dioxide, ozone, and relative humidity. Analytical Chemistry 2009, 81 (11), 4183–4191. [DOI] [PubMed] [Google Scholar]
- 44.Kim J; Yoo H; Ba VAP; Shin N; Hong S, Dye-functionalized sol-gel matrix on carbon nanotubes for refreshable and flexible gas sensors. Scientific Reports 2018, 8. [DOI] [PMC free article] [PubMed] [Google Scholar]
- 45.Jang J; Kang K; Raeis-Hosseini N; Ismukhanova A; Jeong H; Jung C; Kim B; Lee J-Y; Park I; Rho J, Self-powered humidity sensor using chitosan-based plasmonic metal-hydrogel-metal filters. Advanced Optical Materials 2020, 8 (9). [Google Scholar]
- 46.Mill A; Lepre A; Wild L, Breath-by-breath measurement of carbon dioxide using a plastic film optical sensor. Sensors and Actuators B-Chemical 1997, 39 (1–3), 419–425. [Google Scholar]
- 47.Volatile organic compounds’ impact on indoor air quality. https://www.epa.gov/indoor-air-quality-iaq/volatile-organic-compounds-impact-indoor-air-quality.
- 48.Criteria air pollutants. https://www.epa.gov/criteria-air-pollutants.
- 49.Toxic industrial chemicals (TICs) guide. https://www.osha.gov/SLTC/emergencypreparedness/guides/chemical.html.
- 50.Lin C; Zhu Y; Yu J; Qin X; Xian X; Tsow F; Forzani ES; Wang D; Tao N, Gradient-based colorimetric sensors for continuous gas monitoring. Analytical Chemistry 2018, 90 (8), 5375–5380. [DOI] [PMC free article] [PubMed] [Google Scholar]
- 51.Kring EV; Lautenberger WJ; Baker WB; Douglas JJ; Hoffman RA, A new passive colorimetric air monitoring badge system for ammonia, sulfur-dioxide and nitrogen-dioxide. American Industrial Hygiene Association Journal 1981, 42 (5), 373–381. [Google Scholar]
- 52.Lim SH; Feng L; Kemling JW; Musto CJ; Suslick KS, An optoelectronic nose for the detection of toxic gases. Nature Chemistry 2009, 1 (7), 562. [DOI] [PMC free article] [PubMed] [Google Scholar]
- 53.Feng L; Musto CJ; Kemling JW; Lim SH; Suslick KS, A colorimetric sensor array for identification of toxic gases below permissible exposure limits. Chemical Communications 2010, 46 (12), 2037–2039. [DOI] [PMC free article] [PubMed] [Google Scholar]
- 54.Guo Y; Xue S; Dirtu MM; Garcia Y, A versatile iron(II)-based colorimetric sensor for the vapor-phase detection of alcohols and toxic gases. Journal of Materials Chemistry C 2018, 6 (15), 3895–3900. [Google Scholar]
- 55.Yue G; Su S; Li N; Shuai M; Lai X; Astruc D; Zhao P, Gold nanoparticles as sensors in the colorimetric and fluorescence detection of chemical warfare agents. Coordination Chemistry Reviews 2016, 311, 75–84. [Google Scholar]
- 56.Lee J; Seo S; Kim J, Colorimetric detection of warfare gases by polydiacetylenes toward equipment-free detection. Advanced Functional Materials 2012, 22 (8), 1632–1638. [Google Scholar]
- 57.Chulvi K; Gavina P; Costero AM; Gil S; Parra M; Gotor R; Royo S; Martinez-Manez R; Sancenon F; Vivancos J-L, Discrimination of nerve gases mimics and other organophosphorous derivatives in gas phase using a colorimetric probe array. Chemical Communications 2012, 48 (81), 10105–10107. [DOI] [PubMed] [Google Scholar]
- 58.Li Z; Bassett WP; Askim JR; Suslick KS, Differentiation among peroxide explosives with an optoelectronic nose. Chemical Communications 2015, 51 (83), 15312–15315. [DOI] [PubMed] [Google Scholar]
- 59.Askim JR; Li Z; LaGasse MK; Rankin JM; Suslick KS, An optoelectronic nose for identification of explosives. Chemical Science 2016, 7 (1), 199–206. [DOI] [PMC free article] [PubMed] [Google Scholar]
- 60.Li Z; Suslick KS, Portable optoelectronic nose for monitoring meat freshness. ACS Sensors 2016, 1 (11), 1330–1335. [Google Scholar]
- 61.Zhang C; Bailey DP; Suslick KS, Colorimetric sensor arrays for the analysis of beers: A feasibility study. Journal of Agricultural and Food Chemistry 2006, 54 (14), 4925–4931. [DOI] [PubMed] [Google Scholar]
- 62.Kawamura K; Vestergaard M; Ishiyama M; Nagatani N; Hashiba T; Tamiya E, Development of a novel hand-held toluene gas sensor: Possible use in the prevention and control of sick building syndrome. Measurement 2006, 39 (6), 490–496. [Google Scholar]
- 63.Suslick KS; Rakow NA; Sen A, Colorimetric sensor arrays for molecular recognition. Tetrahedron 2004, 60 (49), 11133–11138. [Google Scholar]
- 64.Feng L; Musto CJ; Suslick KS, A simple and highly sensitive colorimetric detection method for gaseous formaldehyde. Journal of the American Chemical Society 2010, 132 (12), 4046–4047. [DOI] [PMC free article] [PubMed] [Google Scholar]
- 65.Lim SH; Kemling JW; Feng L; Suslick KS, A colorimetric sensor array of porous pigments. Analyst 2009, 134 (12), 2453–2457. [DOI] [PMC free article] [PubMed] [Google Scholar]
- 66.Xiao-wei H; Zhi-hua L; Xiao-bo Z; Ji-yong S; Han-ping M; Jie-wen Z; Li-min H; Holmes M, Detection of meat-borne trimethylamine based on nanoporous colorimetric sensor arrays. Food Chemistry 2016, 197, 930–936. [DOI] [PubMed] [Google Scholar]
- 67.LaGasse MK; Rankin JM; Askim JR; Suslick KS, Colorimetric sensor arrays: Interplay of geometry, substrate and immobilization. Sensors and Actuators B-Chemical 2014, 197, 116–122. [Google Scholar]
- 68.Wang Y; Zhong X; Huo D; Zhao Y; Geng X; Fa H; Luo X; Yang M; Hou C, Fast recognition of trace volatile compounds with a nanoporous dyes-based colorimetric sensor array. Talanta 2019, 192, 407–417. [DOI] [PubMed] [Google Scholar]
- 69.Zhong X; Huo D; Fa H; Luo X; Wang Y; Zhao Y; Hou C, Rapid and ultrasensitive detection of biogenic amines with colorimetric sensor array. Sensors and Actuators B-Chemical 2018, 274, 464–471. [Google Scholar]
- 70.Dunbar RA; Jordan JD; Bright FV, Development of chemical sensing platforms based on sol-gel-derived thin films: Origin of film age vs performance trade offs. Analytical Chemistry 1996, 68 (4), 604–610. [Google Scholar]
- 71.Jeronimo PCA; Araujo AN; Montenegro M, Optical sensors and biosensors based on sol-gel films. Talanta 2007, 72 (1), 13–27. [DOI] [PubMed] [Google Scholar]
- 72.Lin H; Suslick KS, A colorimetric sensor array for detection of triacetone triperoxide vapor. Journal of the American Chemical Society 2010, 132 (44), 15519–15521. [DOI] [PubMed] [Google Scholar]
- 73.Lim SH; Musto CJ; Park E; Zhong W; Suslick KS, A colorimetric sensor array for detection and identification of sugars. Organic Letters 2008, 10 (20), 4405–4408. [DOI] [PMC free article] [PubMed] [Google Scholar]
- 74.Musto CJ; Lim SH; Suslick KS, Colorimetric detection and identification of natural and artificial sweeteners. Analytical Chemistry 2009, 81 (15), 6526–6533. [DOI] [PMC free article] [PubMed] [Google Scholar]
- 75.Courbat J; Briand D; Damon-Lacoste J; Wollenstein J; de Rooij NF, Evaluation of pH indicator-based colorimetric films for ammonia detection using optical waveguides. Sensors and Actuators B-Chemical 2009, 143 (1), 62–70. [Google Scholar]
- 76.Kim YH; Yang YJ; Kim JS; Choi DS; Park SH; Jin SY; Park JS, Non-destructive monitoring of apple ripeness using an aldehyde sensitive colorimetric sensor. Food Chemistry 2018, 267, 149–156. [DOI] [PubMed] [Google Scholar]
- 77.Buenger D; Topuz F; Groll J, Hydrogels in sensing applications. Progress in Polymer Science 2012, 37 (12), 1678–1719. [Google Scholar]
- 78.Devadhasan JP; Kim D; Lee DY; Kim S, Smartphone coupled handheld array reader for real-time toxic gas detection. Analytica Chimica Acta 2017, 984, 168–176. [DOI] [PubMed] [Google Scholar]
- 79.Maruo YY; Kunioka T; Akaoka K; Nakamura J, Development and evaluation of ozone detection paper. Sensors and Actuators B-Chemical 2009, 135 (2), 575–580. [Google Scholar]
- 80.Costello BD; Amann A; Al-Kateb H; Flynn C; Filipiak W; Khalid T; Osborne D; Ratcliffe NM, A review of the volatiles from the healthy human body. Journal of Breath Research 2014, 8 (1). [DOI] [PubMed] [Google Scholar]
- 81.Pereira J; Porto-Figueira P; Cavaco C; Taunk K; Rapole S; Dhakne R; Nagarajaram H; Câmara JS, Breath analysis as a potential and non-invasive frontier in disease diagnosis: an overview. Metabolites 2015, 5 (1), 3–55. [DOI] [PMC free article] [PubMed] [Google Scholar]
- 82.Piiper J; Scheid P, Blood-gas equilibration in lungs. In Pulmonary Gas Exchange, Volume I: Ventilation, Blood Flow, and Diffusion, West JB, Ed. Academic Press, Inc.: New York, 1980; pp 131–163. [Google Scholar]
- 83.Cao W; Duan Y, Breath analysis: Potential for clinical diagnosis and exposure assessment. Clinical Chemistry 2006, 52 (5), 800–811. [DOI] [PubMed] [Google Scholar]
- 84.Francesco FD; Fuoco R; Trivella MG; Ceccarini A, Breath analysis: Trends in techniques and clinical applications. Microchemical Journal 2005, 79 (1–2), 405–410. [Google Scholar]
- 85.Kharitonov SA; Barnes PJ, Exhaled markers of pulmonary disease. American Journal of Respiratory and Critical Care Medicine 2001, 163 (7), 1693–1722. [DOI] [PubMed] [Google Scholar]
- 86.Smith D; Spanel P, Application of ion chemistry and the SIFT technique to the quantitative analysis of trace gases in air and on breath. International Reviews in Physical Chemistry 1996, 15 (1), 231–271. [Google Scholar]
- 87.Spanel P; Smith D, Progress in sift-ms: Breath analysis and other applications. Mass Spectrometry Reviews 2011, 30 (2), 236–267. [DOI] [PubMed] [Google Scholar]
- 88.Patterson CS; McMillan LC; Longbottom C; Gibson GM; Padgett MJ; Skeldon KD, Portable optical spectroscopy for accurate analysis of ethane in exhaled breath. Measurement Science and Technology 2007, 18 (5), 1459–1464. [Google Scholar]
- 89.Righettoni M; Tricoli A, Toward portable breath acetone analysis for diabetes detection. Journal of Breath Research 2011, 5 (3). [DOI] [PMC free article] [PubMed] [Google Scholar]
- 90.Tisch U; Haick H, Chemical sensors for breath gas analysis: The latest developments at the breath analysis summit 2013. Journal of Breath Research 2014, 8 (2). [DOI] [PubMed] [Google Scholar]
- 91.Mazzone PJ; Wang X-F; Xu Y; Mekhail T; Beukemann MC; Na J; Kemling JW; Suslick KS; Sasidhar M, Exhaled breath analysis with a colorimetric sensor array for the identification and characterization of lung cancer. Journal of Thoracic Oncology 2012, 7 (1), 137–142. [DOI] [PMC free article] [PubMed] [Google Scholar]
- 92.Zhong X; Li D; Du W; Yan M; Wang Y; Huo D; Hou C, Rapid recognition of volatile organic compounds with colorimetric sensor arrays for lung cancer screening. Analytical and Bioanalytical Chemistry 2018, 410 (16), 3671–3681. [DOI] [PubMed] [Google Scholar]
- 93.Effros RM; Biller J; Foss B; Hoagland K; Dunning MB; Castillo D; Bosbous M; Sun F; Shaker R, A simple method for estimating respiratory solute dilution in exhaled breath condensates. American Journal of Respiratory and Critical Care Medicine 2003, 168 (12), 1500–1505. [DOI] [PubMed] [Google Scholar]
- 94.Horvath I; Hunt J; Barnes PJ; Alving K; Antczak A; Balint B; Baraldi E; Becher G; van Beurden WJC; Blomberg A; Corradi M; Dekhuijzen R; Dweik RA; Dwyer T; Effros R; Erzurum S; Freels J; Gaston B; Gessner C; Goldman M; Greening A; Ho LP; Hohfeld JM; Jobsis Q; Kharitonov SA; Kelly F; Laskowski D; Lehmann C; Lindstrom A; Loukides S; Marlin D; Montuschi P; Olin AC; Redington AE; Reinhold P; van Rensen ELJ; Robbins R; Rubinstein I; Silkoff P; Smith HJ; Steinhaeusser WR; Teague WG; Toren K; Vass G; Vaughan J; Vogelberg C; Wirtz H; Breath AETFE, Exhaled breath condensate: methodological recommendations and unresolved questions. European Respiratory Journal 2005, 26 (3), 523–548. [DOI] [PubMed] [Google Scholar]
- 95.Yu J; Qin X; Xian X; Tao N, Oxygen sensing based on the yellowing of newspaper. ACS Sensors 2018, 3 (1), 160–166. [DOI] [PubMed] [Google Scholar]
- 96.Zhao D; Miller D; Shao D; Xian X; Tsow F; Iglesias RA; Forzani ES, A personal device for analyzing carbon dioxide in real time and real breath: Experimental investigation and computational simulation. Sensors and Actuators B-Chemical 2013, 183, 627–635. [Google Scholar]
- 97.Rabitsch W; Nikolic A; Schellongowski P; Kofler J; Kraft P; Krenn CG; Staudinger T; Locker GJ; Knöbl P; Hofbauer R, Evaluation of an end-tidal portable ETCO2 colorimetric breath indicator (COLIBRI). The American Journal of Emergency Medicine 2004, 22 (1), 4–9. [DOI] [PubMed] [Google Scholar]
- 98.Mills A; Chang Q; McMurray N, Equilibrium studies on colorimetric plastic film sensors for carbon-dioxide. Analytical Chemistry 1992, 64 (13), 1383–1389. [Google Scholar]
- 99.Tassopoulos CN; Barnett D; Fraser TR, Breath-acetone and blood-sugar measurements in diabetes. Lancet 1969, 1 (7609), 1282-+. [DOI] [PubMed] [Google Scholar]
- 100.Saasa V; Beukes M; Lemmer Y; Mwakikunga B, Blood ketone bodies and breath acetone analysis and their correlations in type 2 diabetes mellitus. Diagnostics 2019, 9 (4). [DOI] [PMC free article] [PubMed] [Google Scholar]
- 101.Worrall AD; Bernstein JA; Angelopoulos AP, Portable method of measuring gaseous acetone concentrations. Talanta 2013, 112, 26–30. [DOI] [PubMed] [Google Scholar]
- 102.Smith AD; Cowan JO; Filsell S; McLachlan C; Monti-Sheehan G; Jackson P; Taylor DR, Diagnosing asthma - Comparisons between exhaled nitric oxide measurements and conventional tests. American Journal of Respiratory and Critical Care Medicine 2004, 169 (4), 473–478. [DOI] [PubMed] [Google Scholar]
- 103.Smith AD; Cowan JO; Brassett KP; Herbison GP; Taylor DR, Use of exhaled nitric oxide measurements to guide treatment in chronic asthma. New England Journal of Medicine 2005, 352 (21), 2163–2173. [DOI] [PubMed] [Google Scholar]
- 104.Shiba S; Yamada K; Matsuguchi M, Humidity-resistive optical NO gas sensor devices based on cobalt tetraphenylporphyrin dispersed in hydrophobic polymer matrix. Sensors 2020, 20 (5), 1295. [DOI] [PMC free article] [PubMed] [Google Scholar]
- 105.Prabhakar A; Iglesias RA; Wang R; Tsow F; Forzani ES; Tao N, Ultrasensitive detection of nitrogen oxides over a nanoporous membrane. Analytical Chemistry 2010, 82 (23), 9938–9940. [DOI] [PMC free article] [PubMed] [Google Scholar]
- 106.Toombs CF; Insko MA; Wintner EA; Deckwerth TL; Usansky H; Jamil K; Goldstein B; Cooreman M; Szabo C, Detection of exhaled hydrogen sulphide gas in healthy human volunteers during intravenous administration of sodium sulphide. British Journal of Clinical Pharmacology 2010, 69 (6), 626–636. [DOI] [PMC free article] [PubMed] [Google Scholar]
- 107.S.Carpenter T; M.Rosolina S; Xue Z-L, Quantitative, colorimetric paper probe for hydrogen sulfide gas. Sensors and Actuators B-Chemical 2017, 253, 846–851. [Google Scholar]
- 108.Jornet-Martinez N; Hakobyan L; Argente-Garcia AI; Molins-Legua C; Campíns-Falcó P, Nylon-supported plasmonic assay based on the aggregation of silver nanoparticles: In situ determination of hydrogen sulfide-like compounds in breath samples as a proof of concept. ACS Sensors 2019, 4 (8), 2164–2172. [DOI] [PubMed] [Google Scholar]
- 109.Krishnan ST; Son KH; Kim N; Viswanath B; Kim S; An JH, Development of simple and sensitive hydrogel based colorimetric sensor array for the real-time quantification of gaseous ammonia. Materials Science & Engineering C-Materials for Biological Applications 2017, 72, 583–589. [DOI] [PubMed] [Google Scholar]
- 110.Krishnan ST; Devadhasan JP; Kim S, Recent analytical approaches to detect exhaled breath ammonia with special reference to renal patients. Analytical and Bioanalytical Chemistry 2017, 409 (1), 21–31. [DOI] [PubMed] [Google Scholar]
- 111.Limeres J; Garcez JF; Marinho JS; Loureiro A; Diniz M; Diz P, A breath ammonia analyser for monitoring patients with end-stage renal disease on haemodialysis. British Journal of Biomedical Science 2017, 74 (1), 24–29. [DOI] [PubMed] [Google Scholar]
- 112.Ito K; Kawamura N; Suzuki Y; Maruo Y, Colorimetric detection of gaseous acetone based on a reaction between acetone and 4-nitrophenylhydrazine in porous glass. Microchemical Journal 2020, 159, 105428. [Google Scholar]
- 113.Prabhakar A; Iglesias RA; Shan X; Xian X; Zhang L; Tsow F; Forzani ES; Tao N, Online sample conditioning for portable breath analyzers. Analytical Chemistry 2012, 84 (16), 7172–7178. [DOI] [PMC free article] [PubMed] [Google Scholar]
- 114.Mazzone PJ; Wang X-F; Lim S; Jett J; Choi H; Zhang Q; Beukemann M; Seeley M; Martino R; Rhodes P, Progress in the development of volatile exhaled breath signatures of lung cancer. Annals of the American Thoracic Society 2015, 12 (5), 752–757. [DOI] [PMC free article] [PubMed] [Google Scholar]
- 115.American Thoracic Society; European Respiratory Society, ATS/ERS recommendations for standardized procedures for the online and offline measurement of exhaled lower respiratory nitric oxide and nasal nitric oxide, 2005. American Journal of Respiratory and Critical Care Medicine 2005, 171 (8), 912–930. [DOI] [PubMed] [Google Scholar]