Abstract
Motile cells of Bacillus subtilis inadvertently escaped from the surface of an agar disk that was surrounded by a fluid growth medium and formed a migrating population in the fluid. When viewed from above, the population appeared as a cloud advancing unidirectionally into the fresh medium. The cell population became spontaneously organized into a series of stripes in a region behind the advancing cloud front. The number of stripes increased progressively until a saturation value of stripe density per unit area was reached. New stripes arose at a fixed distance behind the cloud front and also between stripes. The spacing between stripes underwent changes with time as stripes migrated towards and away from the cloud front. The global pattern appeared to be stretched by the advancing cloud front. At a time corresponding to approximately two cell doublings after pattern formation, the pattern decayed, suggesting that there is a maximum number of cells that can be maintained within the pattern. Stripes appear to consist of high concentrations of cells organized in sinking columns that are part of a bioconvection system. Their behavior reveals an interplay between bacterial swimming, bioconvection-driven fluid motion, and cell concentration. A mathematical model that reproduces the development and dynamics of the stripe pattern has been developed.
Populations of swimming, swarming, or gliding bacteria are capable of spontaneous self-organization into states that exhibit cooperative behavior. In systems such as the multicellular forms of myxobacteria and the complex colonial patterns produced by motile strains of Escherichia coli and Salmonella, cellular aggregation arises in response to signaling by certain cells that excrete attractants (2, 6, 21). Responding cells accumulate and together display features that distinguish them from their individual cell progenitors. Another form of cellular organization has been found in fluid cultures of swimming Bacillus subtilis strains. This form also results in the accumulation of cells in spatially restricted regions by bringing together individual cells initially distributed throughout a larger region. The spatial and temporal order of cells in this case, however, appears not to require cell-cell signaling. Instead, external constraints set into play by the swimming of cells upwards and the force of gravity acting on the accumulated cell mass beneath the fluid surface give rise to a bioconvection process that is responsible for organizing the cells into discrete regions of high density (3, 5, 8, 16–18, 23).
Bioconvection arises whenever cells that have a density greater than the fluid they are suspended in swim upwards and accumulate in a layer or region some distance from the floor of the solution. Instabilities arise spontaneously in such heavily populated regions and result in sinking columns of fluid that carry the cells to the bottom where the fluid is less dense. Cells liberated at the base of a sinking plume are free to swim towards the top again and recycle into sinking columns. Fluid also travels upwards once sinking plumes become established as a result of conservation of mass. The net result is a continuously circulating system driven by cell swimming and fluid motion. Cells caught in the fluid flows are transported by these flows. This phenomenon is similar to convection flows driven by temperature differences between the top and bottom of a thin layer of fluid (1, 17).
Bioconvection has been observed in several bacterial species, including aerobic, anaerobic, and magnetotactic organisms, as well as in algal and protozoan cultures (9). All have in common the sudden appearance of a pattern when viewed from above that requires cell swimming to be sustained. The work described here is concerned with the analysis of a one-dimensional bioconvection pattern found accidentally in a culture of B. subtilis: a series of stripes that form spontaneously and migrate as a traveling wave. The physical conditions of the culture and the dynamics and appearance of the pattern strongly suggest that each stripe consists of a sinking column of cells. The formation, dynamics, and decay of the pattern will be described. A unique feature of the pattern we discovered is the fact that it forms behind the front of an advancing cell population that migrates unidirectionally into fresh medium. Front migration strongly influences pattern development. A mathematical model that reproduces the key observations suggests that physical processes are responsible for pattern organization and properties.
MATERIALS AND METHODS
Strains.
B. subtilis OI2836 was obtained from G. Ordal. OI2836 carries a deletion of the cheB gene and consequently does not produce a functional methylesterase required for adaptation in chemotaxis. OI2836 cells have wild-type motility, however, and unstimulated OI2836 cells differ little from wild-type strains in the proportion of time their flagella rotate counterclockwise (10). OI1085 carries wild-type alleles for all motility genes as well as trpF7, hisH2, and metC markers.
Media and growth conditions.
Bacteria were maintained as streaks on tryptose blood agar base (Difco) (33 g) plus Bacto Agar (Difco) (5 g) per liter of deionized water. Tryptose blood agar base (TBAB) consists of tryptose (10 g), beef extract (3 g), NaCl (5 g), and agar (15 g) per 33 g. The fluid equivalent of TBAB, called TB, was of identical composition but lacked agar. Colonies of strain OI2836 were grown on a soft agar version of TBAB that contained 6 g of agar per liter (14). Colonies were initiated by toothpick transfer from fresh streaks on standard TBAB and then maintained by sequential transfer daily from soft TBAB to soft TBAB.
The center of a 60-mm-diameter plastic petri dish containing 10 ml of soft TBAB agar was inoculated with OI2836 cells obtained from a colony that had grown overnight on the same medium at 25°C. After growth overnight at 25°C, the entire agar disk was removed from the plate and transferred to a 100-mm-diameter plastic petri dish. Three milliliters of fluid TB was carefully added to surround the agar disk, whose diameter was now 50 mm. The petri dish was closed with its normal lid and moved to a glass plate suspended above a fluorescent light source that had its center blocked so as to provide oblique lighting to the petri dish. The culture was incubated on the glass plate at 25°C and 29% relative humidity.
In the experiment shown in Fig. 5A, a colony of OI2836 was produced by growth overnight in a 60-mm-diameter plastic petri dish containing 10 ml of a reduced-concentration TB medium (0.75 times the standard TB concentration) plus 0.71% agar at 25°C and 39% relative humidity. The agar surrounding the colony was cut out and removed, leaving a 27-mm-diameter disk in place. Standard TB fluid (1.5 ml) was added around the disk, and the culture was incubated at 25°C and 34% relative humidity. The frames shown in Fig. 5A were taken from a video film made after addition of fluid TB to the culture.
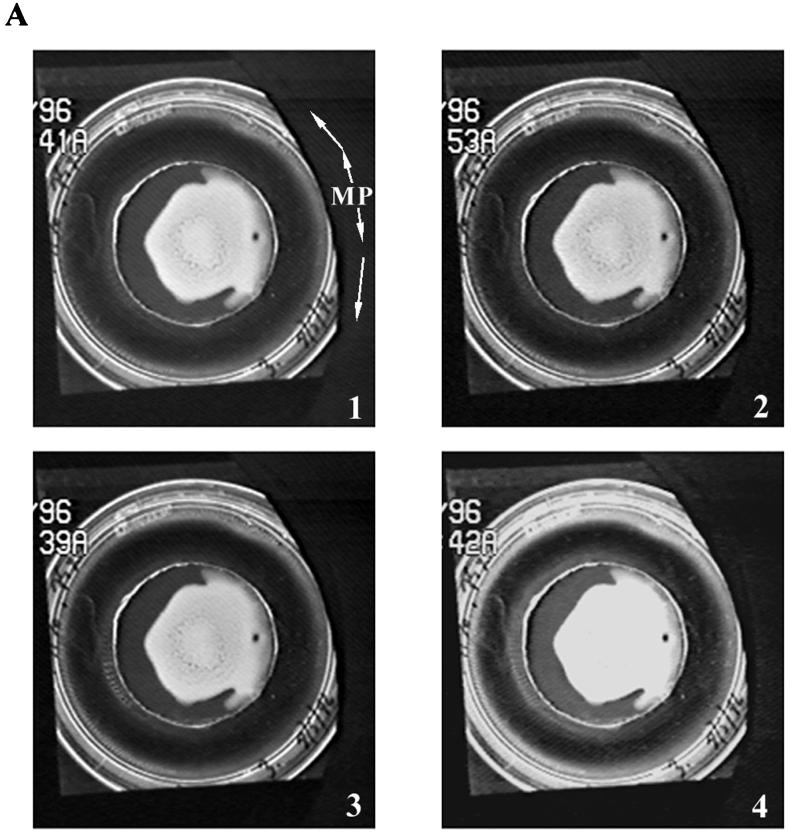
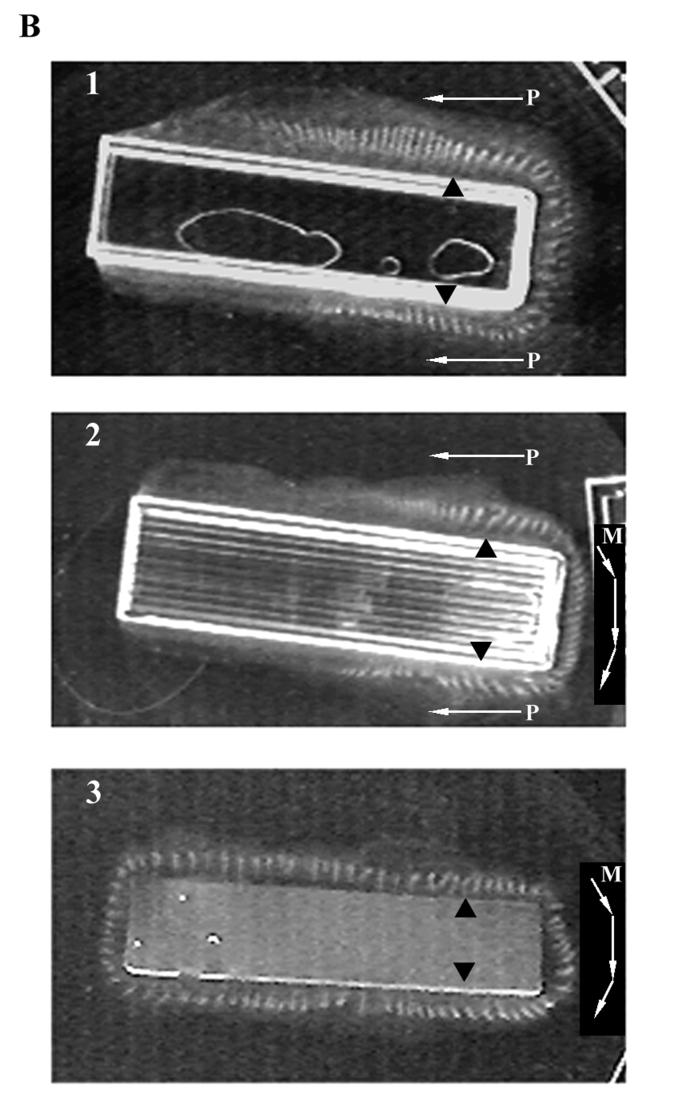
FIG. 5.
Examples of bacterial bioconvection stripe patterns produced adjacent to various boundaries. (A) Strain OI2836 patterns produced from cells originating in a colony grown on soft TB agar (0.6%). Panel 1 shows stripes formed both at the periphery of the petri dish and near the agar disk. The white arrows marked M and P indicate the direction of cloud front propagation and new stripe formation behind the front (P) and of stripe migration (M). Panels 2, 3, and 4 show progressively later times (15, 68, and 102 min after panel 1, respectively). Panel 4 illustrates decay of the peripheral stripe pattern and the beginnings of decay in the inner pattern surrounding the agar disk. (B) Stripe patterns produced by strain OI1085 fluid populations grown near linear boundaries. Panels 1 and 2 show patterns along rough and smooth surface plastic boundaries, respectively. Panel 3 shows a pattern produced along a linear agar boundary. Black triangles indicate the points of inoculation of the fluid. White arrows indicate the direction of front migration and stripe migration (as described above for panel A).
The stripe patterns produced along linear boundaries of plastic or agar shown in Fig. 5B were obtained by toothpick transfer of cells from streaks of strain OI1085 grown on standard TBAB medium into 1.5 ml of fluid TB surrounding each boundary. Disposable 4.5-ml plastic spectrophotometer cuvettes were used as boundaries. Their outer dimensions were 45 mm in length, 13 mm in width, and 13 mm in height. Two opposing surfaces of these cuvettes were clear and smooth, and the other two surfaces were roughened by regular indentations running the length of the cuvette. Both surfaces were used as fluid boundaries. Linear agar boundaries were produced by cutting out rectangles of similar dimensions from soft TB agar (0.6%) and transferring them to empty sterile 100-mm-diameter petri dishes. All cultures were incubated at 23°C.
Video film production and analysis.
Time-lapse video films of cultures described above were produced by using a charge-coupled device camera (Cohu, San Diego, Calif.) with a Fujinon TV zoom lens (12.5 to 75 mm). The camera was positioned above the petri dish. Images were recorded with a GYYR time-lapse VHS tape deck (Odetics, Inc., Anaheim, Calif.). During recording, the time (in seconds, minutes, and hours) was written automatically on each video frame. Images were measured in three ways: (i) directly on plastic sheet overlays placed on the video monitor, (ii) from prints of individual frames made with a video copy processor (Mitsubishi, Piscataway, N.J.) and a graphics digitizer (Numonics Corporation, Jandell Scientific, Corta Madera, Calif.) controlled by Sigma Scan software (Jandell Scientific) run on an express 425X computer (CompuAdd, Austin, Tex.), or (iii) from individual frames transferred into a personal computer, using Image Pro Plus software (Media Cybernetics, Silver Spring, Md.). Space-time figures were constructed by using the Adobe Photoshop program (Adobe Systems Inc., Mountain View, Calif.). Graphs were produced and analyzed by using Cricket Graph (Philadelphia, Pa.).
Computer simulation of mathematical model.
The mathematical model consists of one partial differential equation describing the temporal evolution of a space-dependent complex quantity. The simulation was performed in one space dimension. The code was run on a Silicon Graphics Power Challenge computer, using an interactive interface built with the Advanced Visual Systems graphical software.
RESULTS
Source of motile cells that formed a pattern.
For purposes that will be described elsewhere, a single colony of strain OI2836 approximately 18 mm in diameter was produced by growth on soft agar TBAB in a small petri dish (60-mm diameter). A 50-mm-diameter agar disk including the bacterial colony was transferred from the initial plate to a larger petri dish (100-mm diameter), and 3 ml of fresh fluid TB medium was added to form a reservoir around the periphery of the agar disk. The new culture was incubated on a glass plate that was lighted from below and had a video camera positioned above it. A time-lapse video film was produced that spanned 17 h 50 min. The field of view recorded on the film included most of the agar disk and part of the surrounding fluid in two areas located below the disk, as shown in Fig. 1, panel 1. Both the left and right fluid areas observed were connected to one another in the region between the two that could not be seen on the film.
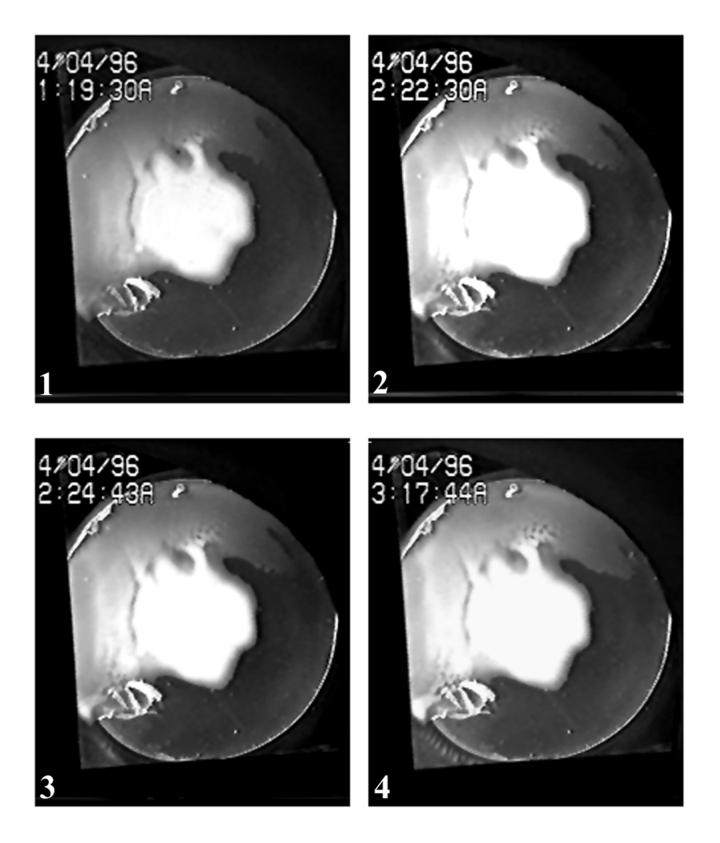
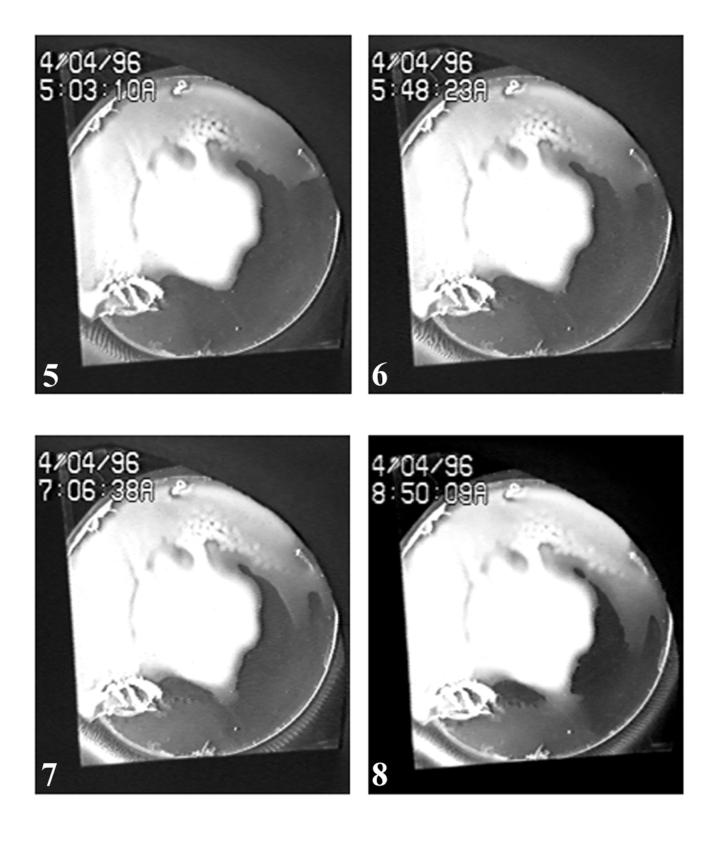
FIG. 1.
Images of sequential frames illustrating pattern formation, dynamics, and decay. Panels 1 through 8 depict the following: 1, the state of colony growth on the agar disk prior to cloud appearance; 2, bacterial cloud in the left region; 3, two stripes formed in the left region; 4, 10 stripes in the left region; 5, the start of chaos in the left region; 6, bacterial cloud in the right region; 7, pattern decay in the left region, numerous stripes in the right region; 8, an early stage of pattern decay in the right region.
Cloud appearance and stripe condensation in the left region.
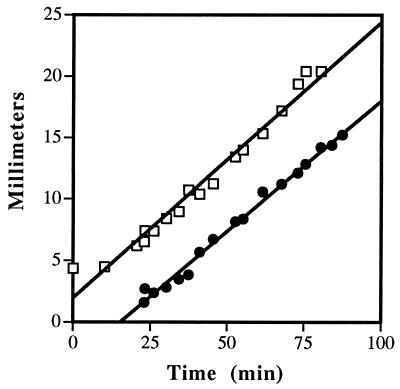
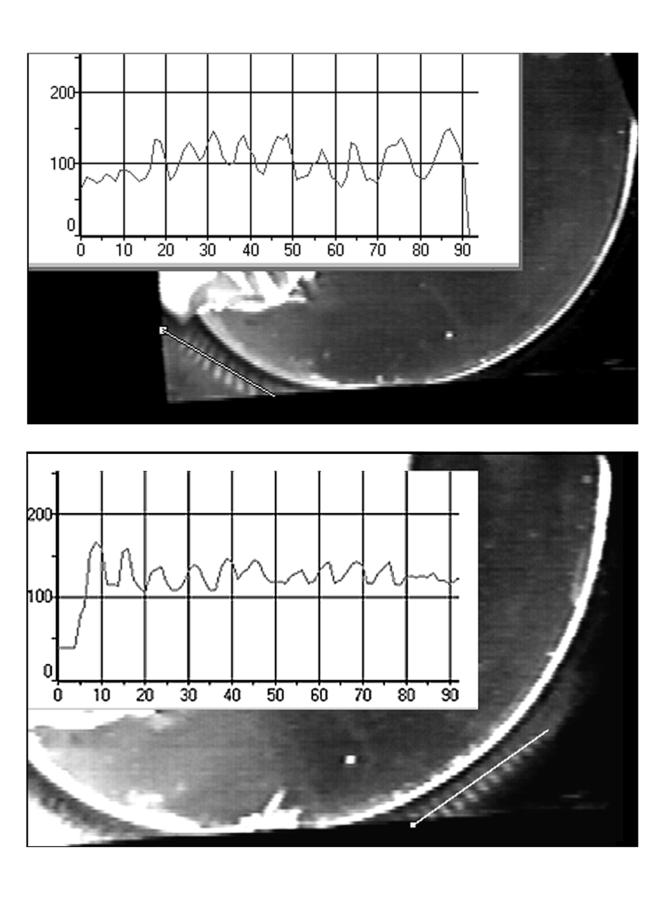
During the initial stages of growth on the agar disk surrounded by fluid TB, the OI2836 colony expanded nonuniformly towards the periphery of the disk. After 9 h 18 min of incubation, a migrating bacterial population suddenly appeared in the fluid surrounding the agar disk (Fig. 1, panel 2). The migrating population moved counterclockwise around the agar disk, appearing first in the left region and then later in the right region (Fig. 1, panel 6). It had the appearance of an expanding cloud. The cloud front is clearly evident in the film images. The rate of its movement measured from prints of individual frames was approximately 0.225 mm/min (Fig. 2). About 45 min after first becoming visible in the left region, two discrete stripes appeared spontaneously within the cloud. Additional stripes arose during the next 90 min, until 10 stripes eventually became positioned uniformly within the space of the left region (Fig. 1, panel 4). Based upon their appearance, the stripes observed must correspond to regions of high cell density separated from one another by regions of low cell density. The wavelength of the stripe pattern in the left fluid region is approximately 1 mm (Fig. 3, top panel).
FIG. 2.
Position of the cloud front and the newest stripe formed behind it as a function of time in the right region. The rate of cloud migration was 1 mm/4.44 min (slope = 0.225). Stripes appeared approximately 24 min after the cloud front passed a given position corresponding to 6.7 mm behind the cloud front. The bacterial doubling time in the same growth medium at the same temperature was 90 min (data not shown). Symbols: □, the cloud front; •, the newest stripe formed behind the cloud front.
FIG. 3.
Comparison of stripe patterns in the left region (top) and right region (bottom). The upper video frame was taken at 75 min 29 s and the lower frame was taken at 238 min 46 s after the first stripes appeared in the left region. The inserts give the pattern intensity as a function of position along the line drawn on each frame (1 U on the x axes of the inserts corresponds to 0.155 mm of actual length.)
Shortly after the production of 10 stripes in the left region (90 min after the first stripes became organized), an instability arose in the stripes that gave them the appearance of a flickering flame. Each stripe became progressively less well defined, but even so it was still possible to determine that eventually 12 stripes were formed before the entire left region became chaotic (Fig. 1, panels 5 to 7). The chaotic phase started 180 min after the initial appearance of stripes and continued throughout the remainder of the experiment (an additional 200 min). One hundred eighty minutes corresponds to approximately two cell doublings for strain OI2836 growing in static TB medium at 25°C.
Stripe pattern formation in the right region.
The right region visible in the field of view spanned more than twice the arc length around the agar disk than that in the left region. Consequently, a greater number of stripes could be observed in the right region (Fig. 1, panel 7). The rate of cloud front migration in the right region and the corresponding locations of stripes formed behind the cloud front are shown in Fig. 2. New stripes appeared approximately 24 min after the cloud front passed a given position. They were always situated 6.7 mm behind the cloud front and approximately 1 mm to the right of the neighboring stripe (Fig. 3, bottom panel). The 17 stripes that formed behind the cloud front in the right fluid region appeared over a period of 66 min during which time the cell population could not have undergone one doubling. The cell density required for stripe formation behind a cloud front must therefore depend primarily on cells moving into the region rather than cell division. The situation is complex, however, because all of the stripes present in the right region migrated primarily in a clockwise direction, that is away from the cloud front.
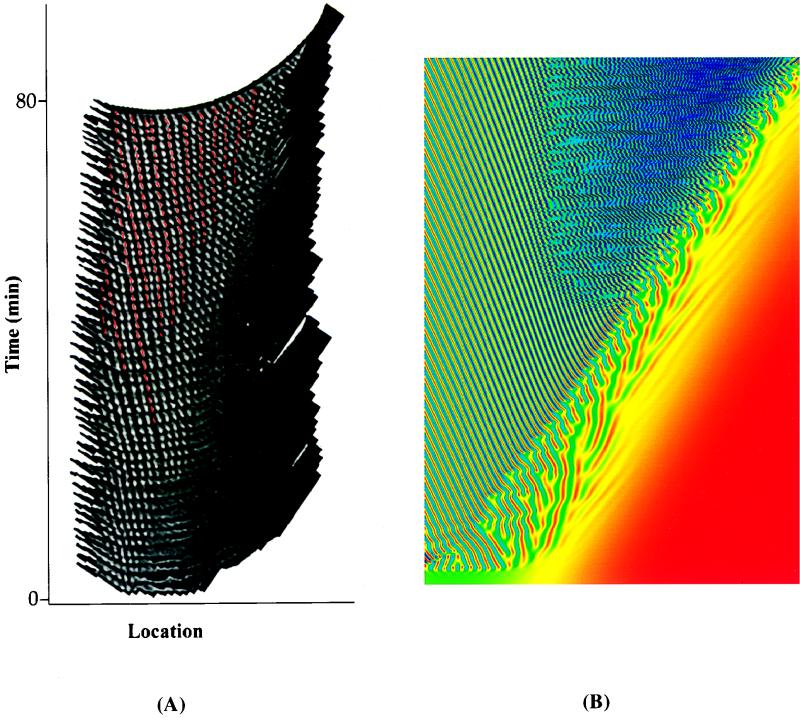
To characterize stripe migration in the right region, a space-time figure was constructed by transfer of individual video frame images to a computer and processing them so that they could be aligned with one another. The composite of 51 separate images representing time points that spanned 80 min of pattern development is shown in Fig. 4A. Overall stripe migration was clockwise, as is evident in the leftward slope of lines produced by following the paths of individual stripes as a function of time. However, there was also counterclockwise stripe movement, and as a result, interstripe distances changed in a very regular manner. The gaps formed between stripes widened and they migrated clockwise around the disk along with the stripes. New stripes (false-colored-red stripes in Fig. 4A) arose in these gaps, thereby restoring the normal wavelength of the stripe pattern. The locations where widened gaps formed and new stripes were produced appear to have been strictly regulated within the overall pattern, as shown by the alternation of older stripes produced behind the cloud front (white stripes in Fig. 4A) with those produced within widened gaps (red stripes in Fig. 4A). Global regulation of the pattern is based therefore upon control of interstripe spacing.
FIG. 4.
(A) Space-time diagram showing the evolution of stripes in the right region. A portion of each video frame showing stripes in the right region was selected and transferred by computer to form an aligned composite figure containing 51 time points that span 80 min in real time. New bands that arose between old ones are shown in red. (B) Space-time diagram showing the evolution of the bacteria concentration as a function of time obtained from the mathematical model. The times range from t = 0 to t ≃ 970 (arbitrary units). The model parameters used to produce this diagram are ρc = 0.3, αr = 2.0 + 0.85μ, αi = 0.8 + 0.5μ, βr = 1.0, βi = −1.3 − 2.0μ, k0 = 0.5 + 0.5μ + 0.8μ2, γ = 0.453, and ν = −0.1, where μ = ρ − ρc.
A mathematical model of stripe pattern formation.
The rationale for and mathematical details of constructing the pattern formation model that approximates bacterial stripe pattern formation and dynamics are given below in the Appendix. Three initial assumptions were made about the experimental system: (i) that the formation of stripes is triggered by variations in average cell density within the fluid (as in known bioconvection systems), (ii) that the average cell density in the fluid is space dependent (zero ahead of the cloud front, positive behind it, and at a critical threshold value at a fixed distance behind the front) and increases as a function of time, and (iii) that the pattern formed behind the front develops an instability when the average concentration of cells gets too large. These assumptions are relevant, because in our experimental system there is a clearly fixed location behind the cloud front where stripes form, because cells multiply as they swim, and because instabilities and decay of the pattern are clearly observed.
A numerical simulation of the model was produced, and Fig. 4B illustrates in a false-colored space-time diagram how the model gives rise to stripe formation, dynamics, and decay. As in the experimental system (Fig. 4A), cloud front migration travels from left to right in Fig. 4B. Blue stripes in the simulation correspond to the white stripes or regions of high cell density in Fig. 4A. The wavy blue lines towards the top right of Fig. 4B represent the decay of stripes into chaos as shown in the later panels of Fig. 1. The space-time diagram of Fig. 4A terminates before this transition occurs, hence there is no corresponding region of chaos in Fig. 4A.
Production of other one-dimensional stripe patterns.
All of the features observed in the pattern described above have been reproduced in subsequent experiments. Examples are shown in Fig. 5. Stripes oriented perpendicularly to a boundary wall arose with either agar (Fig. 5A, center of all panels, and Fig. 5B, panel 3) or plastic (Fig. 5A, periphery of all panels, and Fig. 5, panels 1 and 2) surfaces as the boundaries. Boundaries of various shapes (convex and concave as well as those without curvature) were all effective. Stripe patterns always arose spontaneously from a dense cell population. The sequence of events shown in Fig. 5A illustrates patterns formed independently in a region adjacent to the central agar disk and up against the wall of the petri dish. The cell populations responsible for both originated in the colony that grew on the top of the agar disk. A layer of TB fluid too shallow to support a pattern permitted cells that escaped from the agar disk to reach the meniscus at the periphery of the plate where the outer pattern formed. A migrating cloud arose that moved both counterclockwise and clockwise around the periphery of the plate, as indicated by the arrows on Fig. 5A, panel 1. Stripes formed behind both advancing cloud fronts. Stripes also migrated towards both fronts. Eventually the two advancing cloud fronts met. The details of their interaction have not yet been analyzed.
Figure 5B illustrates three stripe patterns obtained with linear boundary walls. Panels 1 and 2 of Fig. 5B show patterns formed against rough and smooth boundaries, respectively. The points of inoculation are shown by black triangles. New stripes were added to the pattern behind the cloud front in the direction shown by arrows marked P. Stripe migration was not always observed in these patterns. Panels 2 and 3 indicate (arrows marked M) that stripe migration in the region between two points of inoculation did occur. The factors governing the direction of migration around the ends of these boundaries are currently being investigated. Neither cloud front migration nor stripe propagation was observed in the culture shown in panel 3 that formed around a rectangular agar boundary. In this experiment, the pattern was reconstituted by addition of new fluid TB to the culture late in its history when cells had already become distributed all around the boundary. As a result, all stripes appeared simultaneously.
All patterns that are illustrated in Fig. 5 eventually became chaotic in a manner similar to that described earlier. An example can be seen in Fig. 5A, panel 4, where the peripheral pattern has progressed to a high-cell-density disorganized cloud in the oldest regions of the pattern shown towards the right of the figure.
DISCUSSION
The organization of cells into structural and functional groupings is a fundamental strategy in biology. The establishment and properties of multicellular bacterial states have been studied in several systems, and the advantages and constraints imposed by multicellularity have been discussed elsewhere (14). Some bacterial multicellular states, colonies, and macrofibers, for example, originate from clonal growth that can be initiated from a single cell (15). Others become organized by the aggregation of individual cells initially separated from each other and not necessarily belonging to the same clone (2, 6). The factors responsible for bringing cells together in such cases usually rely on signal-response-motility systems. The system described here that brings cells together is based upon another principle: cells influence the physical properties of their environment and in turn become influenced by the changes they set into play.
By swimming upwards and accumulating in a region at the top of a fluid, cells create an unstable situation that results initially in downward fluid flows that trap the cells and organize them. A circulation process becomes established that translocates cells downwards and upwards and possibly laterally as well. When carried in the flows, cells move at greater rates than they do by conventional swimming. The traveling-stripe bioconvection pattern described here appears to rely upon cell transport by flows of this nature. Although the functional significance of this particular pattern is not understood, others have shown that sinking plumes such as stripes mix the environment vertically and thus provide transport of oxygen to cells in lower regions of fluid where it may become limiting (8, 9).
The vertical translocation of cells and fluid was not examined in this study. Instead, the focus was on the one-dimensional organization of the stripes and their movements horizontally in the growth fluid. When a layer of dense fluid forms on top of another with lower density, it cannot sink intact into the solution below it without displacing the underlying fluid. The dense layer above must therefore break up into regions that penetrate the lower solution as they sink. The stripe patterns analyzed here illustrate that the locations of sinking plumes can be highly regulated by the geometry of the fluid space and the dynamics of the bacterial population that creates the dense layer of fluid. The biological factors governing pattern formation and maintenance in this system are therefore the swimming behavior of the cells towards fresh nutrients and oxygen, their chemotactic behavior, the density of the individual cells and the fluid within which they accumulate, and the increase in cell mass.
The fluid growth medium within which the stripe pattern that we analyzed arose was confined to a ring surrounding an agar disk. The key parameters appear to be simply that there was a boundary wall on one side of the fluid and that the fluid depth was 5 mm or less. In other experiments, we discovered that a plastic boundary wall was as effective as an agar wall and that the shape of wall could be straight, concave, or convex. In all cases, stripe patterns arose with stripes oriented radially from the boundary rather than parallel to it. Fluid depth was an important parameter. Stripes first became organized in the shallow region of the fluid ring and then filled in the area between the shallow region of the fluid ring and the boundary wall. However, no stripes could be seen in very shallow regions of fluid when the fluid extended outwards from the fluid ring towards the periphery of the petri dish. Cells must have traveled through these regions in order to populate the area near the petri dish wall where an independent stripe pattern became organized. These observation are in accord with known properties of convection patterns formed adjacent to a boundary and in bioconvection patterns produced in solutions of various depths (17).
When viewed from above with oblique lighting from below, the advancing bacterial population appeared as a gray cloud, whereas the stripes formed within it appeared as lighter bands against a darker background. Variations in the intensities of the cloud images suggest that a gradient of bacterial cell density was produced behind the cloud front. New stripe formation was triggered at a constant distance behind the front apparently in a region where the cell density reached a critical threshold (ρc in our model [see Appendix]). The repeated production of stripes as the front advanced required an expanding poulation of cells. The rates of both cloud front migration (225 μm/min) and stripe production (about 1 new stripe/3.3 min) appear to be too rapid for cell multiplication to have provided the needed cells. Cell migration towards the front must have been involved, but the precise origin of the cells at the front is not currently known. Most of the cells in the pattern must be trapped in sinking plumes, and when recirculated, many must return to sinking plumes rather than the cloud front. Nevertheless, the global pattern must somehow feed the advancing front.
Evidence for an influence of cloud front migration on the stripe pattern was found in both the left and right fluid regions. Stripe migration towards the front shown in Fig. 4A appears to have been the initial event leading to interstripe separation and the eventual creation of spaces where new stripes later became organized. Interstripe spaces became progressively greater with time and behaved as robust features of the global pattern. Spaces were able to migrate along with neighboring stripes. The global pattern is characterized therefore by expansion of stripes to fill the area behind the advancing cloud front, migration of stripes primarily away from the cloud front (but some stripes near the front migrate towards the front), migration of interstripe spaces that become wider with time, the eventual insertion of new stripes in these spaces, and the production of new stripes behind the front.
Cells are presumed to grow and divide in all regions of the pattern that they occupy. The dimensions of stripes did not enlarge proportionally however to accommodate new cells. The wavelength of the pattern also remained approximately constant. We believe that there is a maximum carrying capacity in terms of the number of cells a stripe can contain. If the number of cells in a stripe exceeds this value and the excess is unable to move to an unoccupied location in the fluid space, the stripe becomes destabilized and the entire bioconvection pattern may decay. The transition to chaos at late times appears to be caused in this manner.
A fundamental feature of the discovery described here and shown in Fig. 4A is the global regulation of a bacterial bioconvection pattern. The bacterial cells initially distributed within a spatially disordered population not only grouped together into discrete regions but also obeyed strict rules governing the dynamical behavior of the pattern that they produced. These rules appear to be governed largely by the physics of convection rather than anything the cells themselves control by their swimming or taxis. The mathematical model that we developed shows how well the detailed features of the pattern can be accounted for on purely physical principles. An advancing bacterial population driven by cell swimming into fresh medium exerts an influence on the fluid. Cells swimming upwards towards oxygen exert an influence on the fluid. Sinking plumes caused when denser fluid above pushes into less-dense fluid below it influences the fluid. Increases in cell numbers caused by cell growth and division influence the fluid. Fluid motions in turn influence cells. The particular pattern observed is therefore the result of an interplay between a set of biological factors and a set of physical factors. Knowing the rules that govern this interplay will enhance our understanding of how the biological and physical worlds interact. Given the precision of the stripe pattern and the experimental advantages of the bacterial system that forms stripes, we hope to be able to work out these rules.
ACKNOWLEDGMENTS
This work was supported by a research grant from the National Center for Research Resources (NIH) to N.H.M.
We are indebted to S. D. Whitworth for excellent technical assistance, J. O. Kessler for discussions concerning bioconvection in B. subtilis and A. Goriely and J. J. Thwaites for critical reading of the manuscript. We thank A. C. Celovsky for help with linear boundary experiments.
Appendix
Patterns occur in a variety of physical systems, such as fluids subjected to temperature gradients and undergoing thermal convection (1), chemical reactors, active and passive optical devices, biological systems, or liquid crystals under the action of an electric field (for a review, see reference 4). One striking feature is that similar patterns can be observed in very different situations and at very different scales. Compare, for instance, rolls seen in fingerprints to sand ripples on a beach. Both exhibit parallel stripes; in both systems, new stripes are inserted between existing ones at some point defects, called dislocations. These defects look like the insertions seen in the space-time diagram of Fig. 4A. It turns out that these similarities are not coincidental. In fact, there exists a qualitative theory of pattern formation, based on generic partial differential equations, called amplitude equations. As a general principle, similar patterns are described by similar equations whose form depends only on the nature of the pattern and on the symmetries of the system in which it is seen. The physics itself is captured by the values of the coefficients in front of the various terms in these equations (for more information, see reference 4). For the same reason, one can write generic pattern-forming models, such as the Swift-Hohenberg equation (22), originally introduced to describe hydrodynamic convection. Two points should be emphasized here: first, such models are generic in the sense that they contain all of the necessary ingredients to create a pattern; second, they can sometimes be derived from physical models in the vicinity of a bifurcation, as was recently shown for lasers (11, 12) and for rotating convection (19, 20). In the absence of a complete microscopic theory, as is the case for bioconvection where hydrodynamics has to be coupled to the motion of individual cells, generic features of experimental patterns can nevertheless be understood in terms of the pattern-forming models mentioned above, and it is such an approach that we have developed. Mathematical details of the model will be described elsewhere (13), and we give here only the essential ingredients.
Our model is based on the following assumptions. (i) When the average cell density ρ exceeds a threshold value (ρc), the vertical fluid velocity, which is initially zero, becomes unstable with respect to spatially periodic perturbations. This instability also triggers a periodic modulation of the local cell density and saturates in the form of a bioconvection pattern, corresponding to sinking and rising plumes of fluid and cells. (ii) The average cell density is space dependent: it is zero ahead of the cloud front and nonzero behind, and it exceeds the threshold value at a fixed distance behind the cloud front and slowly decays farther away from the front. The average cell density is also time dependent due to cell multiplication. In the numerics, we used a theoretical cloud shape similar to that described by Keller and Segel (7), multiplied by an exponential term modeling bacterial growth. (iii) The stripe pattern which arises above the bifurcation threshold is associated with a frequency (ωc) and a wavelength (kc) and corresponds to a traveling wave structure, which develops an instability as ρ − ρc gets too large.
Under these assumptions, the pattern can be described by the following complex Swift-Hohenberg equation
 |
1 |
 |
where αr and βr are positive constants. The solution ψ = 0, which corresponds to no pattern produced, becomes unstable to spatial perturbations of wave vector ±k when the real part of the complex growth rate
 |
becomes positive. This happens when ρ exceeds the threshold value ρc, and for k = ±kc, which is the mode experiencing maximum growth. The imaginary part of ς(±kc) gives the critical frequency ωc = ν − γkc2. Therefore, equation 1 produces a pattern with threshold wavelength 2π/kc and frequency ωc, which can be compared to experimentally measured values. This pattern saturates due to the nonlinear term (βr + iβi)|ψ|2ψ and a uniform structure of the form ψ = R exp[i(kx + ωt)] may be observed, where
 |
 |
By an appropriate choice of the equation parameters, such a pattern can be made unstable with respect to spatial perturbations, leading to the appearance of new stripes between existing ones and eventually to chaos. This is shown in the numerical simulation of Fig. 4B. The cloud front migrates from left to right; individual bands migrate towards the left, as they do in the experimental pattern; new bands arise between existing ones and behind the cloud front. The parameter values are given in the legend to Fig. 4B and can be chosen to match real-world values or those measured on the experimental pattern. The moving cloud is described by
 |
(2)
which shows the relationship between the average density ρ and the speed of the cloud front c. In the simulation of Fig. 4B, the cloud front corresponds to equation 2 above with ρ0 = 0.9, c = 0.3, r = 10.0, λ = 0.001, and D = 10.0. However, the stripe pattern dynamics are qualitatively independent of the details of the cloud shape.
REFERENCES
- 1.Bénard H. Les tourbillons cellulaires dans une nappe liquide transportant de la chaleur par convection en régime permanent. Ann Chim Phys. 1901;23:62–144. [Google Scholar]
- 2.Budrene E O, Berg H C. Complex patterns formed by motile cells of Escherichia coli. Nature. 1991;349:630–633. doi: 10.1038/349630a0. [DOI] [PubMed] [Google Scholar]
- 3.Childress S, Levandowsky M, Spiegel E A. Pattern formation in a suspension of swimming micro-organisms. J Fluid Mech. 1975;69:595–613. [Google Scholar]
- 4.Cross M C, Hohenberg P C. Pattern formation outside of equilibrium. Rev Mod Phys. 1993;65:851–1112. [Google Scholar]
- 5.Hill N A, Pedley T J, Kessler J O. The growth of bioconvection patterns in a suspension of gyrotactic micro-organisms in a layer of finite depth. J Fluid Mech. 1989;208:509–543. doi: 10.1017/s0022112088002393. [DOI] [PubMed] [Google Scholar]
- 6.Kaiser D. Multicellular development in myxobacteria. In: Hopwood D A, Chatter K F, editors. Genetics of bacterial diversity. New York, N.Y: Academic Press, Inc.; 1989. pp. 243–263. [Google Scholar]
- 7.Keller E F, Segel L A. Travelling bands of chemotactic bacteria: a theoretical analysis. J Theor Biol. 1971;30:235–248. doi: 10.1016/0022-5193(71)90051-8. [DOI] [PubMed] [Google Scholar]
- 8.Kessler J O, Wojciechowski M F. Collective behavior and dynamics of swimming bacteria. In: Shapiro J A, Dworkin M, editors. Bacteria as multicellular organisms. New York, N.Y: Oxford University Press; 1997. pp. 417–450. [Google Scholar]
- 9.Kessler J O, Hill N A. Complementarity of physics, biology and geometry in the dynamics of swimming micro-organisms. Lect Notes Phys. 1997;480:325–340. [Google Scholar]
- 10.Kirsch M L, Peters P D, Hanlon D W, Kirby J R, Ordal G W. Chemotactic methylesterase brings about adaptation to attractants in Bacillus subtilis. J Biol Chem. 1993;268:18610–18616. [PubMed] [Google Scholar]
- 11.Lega J, Moloney J V, Newell A. Swift-Hohenberg equations for lasers. Phys Rev Lett. 1994;73:2978–2981. doi: 10.1103/PhysRevLett.73.2978. [DOI] [PubMed] [Google Scholar]
- 12.Lega J, Moloney J V, Newell A. Universal description of laser dynamics near threshold. Physica D. 1995;83:478–498. [Google Scholar]
- 13.Lega, J., and N. H. Mendelson. Modelling bioconvection patterns produced by swimming bacteria. Submitted for publication.
- 14.Mendelson N H, Salhi B. Patterns of reporter gene expression in the phase diagram of Bacillus subtilis colony forms. J Bacteriol. 1996;178:1980–1989. doi: 10.1128/jb.178.7.1980-1989.1996. [DOI] [PMC free article] [PubMed] [Google Scholar]
- 15.Mendelson N H, Salhi B, Li C. Physical and genetic consequences of multicellularity in Bacillus subtilis. In: Shapiro J A, Dworkin M, editors. Bacteria as multicellular organisms. New York, N.Y: Oxford University Press; 1997. pp. 339–365. [Google Scholar]
- 16.Pedley T J, Hill N A, Kessler J O. The growth of bioconvection patterns in a uniform suspension of gyrotactic micro-organisms. J Fluid Mech. 1988;195:223–237. doi: 10.1017/s0022112088002393. [DOI] [PubMed] [Google Scholar]
- 17.Pedley T J, Kessler J O. Hydrodynamic phenomena in suspensions of swimming micro-organisms. Annu Rev Fluid Mech. 1992;24:313–358. [Google Scholar]
- 18.Platt J R. “Bioconvection patterns” in cultures of free-swimming organisms. Science. 1961;133:1766–1767. doi: 10.1126/science.133.3466.1766. [DOI] [PubMed] [Google Scholar]
- 19.Ponty Y, Passot T, Sulem P L. Pattern dynamics in rotating convection at finite Prandtl number. Phys Rev E. 1997;56:4162–4178. doi: 10.1103/physreve.59.r4745. [DOI] [PubMed] [Google Scholar]
- 20.Ponty Y, Passot T, Sulem P L. Chaos and structures in rotating convection at finite Prandtl number. Phys Rev Lett. 1997;79:71–74. doi: 10.1103/physreve.59.r4745. [DOI] [PubMed] [Google Scholar]
- 21.Shapiro J A. Multicellularity: the rule, not the exception. In: Shapiro J A, Dworkin M, editors. Bacteria as multicellular organisms. New York, N.Y: Oxford University Press; 1997. pp. 14–49. [Google Scholar]
- 22.Swift J, Hohenberg P C. Hydrodynamic fluctuations at the convective instability. Phys Rev A. 1977;15:319–328. [Google Scholar]
- 23.Wager H. On the effect of gravity upon the movements and aggregation of Euglena viridis, Ehrb., and other micro-organisms. Philos Trans R Soc London B. 1911;201:333–390. [Google Scholar]


