Abstract
Osteosarcoma (OS) is one of the most aggressive bone tumors worldwide. Emerging documents have shown that long noncoding RNAs (lncRNAs) elicit crucial regulatory functions in the process of tumorigenesis. LncRNA DLGAP1‐AS2 is recognized as a regulator in several types of cancers, but its biological functions and molecular mechanisms in OS remain to be elucidated. RT‐qPCR and In situ hybridization (ISH) were used to evaluate DLGAP1‐AS2 expression in OS samples. Western blotting was used for the measurement of the protein levels of hexokinase 2 (HK2) and epithelial–mesenchymal transition (EMT)‐related markers. The proliferation of OS cells was determined using a CCK‐8 assay and EdU assay. TUNEL assay and flow cytometry were performed to assess OS cell apoptosis. Glucose metabolism in vitro assays were used. The binding relations among miR‐451a, HK2, and DLGAP1‐AS2 were validated by luciferase reporter assay. The cellular distribution of DLGAP1‐AS2 in OS cells was determined by FISH and subcellular fractionation assays. Mouse xenograft models were established to perform the experiments in vivo. We found that DLGAP1‐AS2 expression was upregulated in OS tissues and cells. Downregulation of DLGAP1‐AS2 expression suppressed the malignancy of OS cells by restraining cell proliferation, the EMT process, invasiveness, migration, and aerobic glycolysis and accelerating apoptotic behaviors. Of note, silenced DLGAP1‐AS2 restrained tumor growth and metastasis in vivo. However, DLGAP1‐AS2 overexpression accelerated the progression of OS. We further found that DLGAP1‐AS2 upregulation was induced by hypoxia and low glucose. Additionally, DLGAP1‐AS2 bound to miR‐451a to upregulate HK2 expression. Rescue assays revealed that the DLGAP1‐AS2/miR‐451a/HK2 axis contributed to OS cell malignancy by promoting aerobic glucose metabolism. Overall, these findings revealed a new regulatory pathway where DLGAP1‐AS2 upregulated HK2 expression by sponging miR‐451a to accelerate OS development.
Keywords: aerobic glycolysis, DLGAP1‐AS2, HK2, osteosarcoma
The knockdown of lncRNA DLGAP1‐AS2 suppresses osteosarcoma progression by inhibiting aerobic glycolysis via the miR‐451a/HK2 axis.
Abbreviations
- ATP
adenosine triphosphate
- CCK‐8
cell counting kit‐8
- DLGAP1‐AS2
DLGAP1 antisense RNA 2
- ECAR
extracellular acidification rate
- EDU
5‐ethynyl‐2′‐deoxyuridine
- EMT
epithelial‐mesenchymal transition
- FISH
fluorescence in situ hybridization
- HE
hematoxylin and eosin
- HK‐2
hexokinase 2
- IHC
immunohistochemistry
- ISH
In situ hybridization
- lncRNAs
long noncoding RNAs
- miR‐451a
microRNA‐451a
- OCR
oxygen consumption rate
- OS
osteosarcoma
- RT‐qPCR
reverse transcriptase quantitative polymerase chain reaction
- TUNEL
Terminal deoxynucleotidyl transferase dUTP nick end labeling
1. INTRODUCTION
Osteosarcoma (OS) is a primary malignant tumor that develops in bone. 1 OS accounts for 3%–5% of malignant cancers and is frequently diagnosed in children and adolescents. 2 Multiple pathogenic factors, including gene mutation, chemical substances, ionizing radiation, and virus infection, are associated with the occurrence of OS. 3 Over the past four decades, the survival rate of OS patients has increased to approximately 60% due to the advancement in surgical techniques, chemotherapy, and radiotherapy. 4 However, many patients with OS still suffer from relapse and die of distant metastasis. Hence, it is important to find novel effective metastasis‐related targets for the treatment of OS.
Aerobic glycolysis (the Warburg effect) is a general characteristic of energy metabolism in tumor cells. 5 Tumor cells can gain the energy for their survival via aerobic glycolysis under enough oxygen conditions. Even though glycolysis is less efficient at producing ATP, it elevates cancer cell proliferation, suppresses apoptosis, and activates metabolism‐related signaling pathways to contribute to cell survival. 6 , 7 Increased aerobic glycolysis changes the NADH/NAD+ redox ratio by disrupting NAD+ metabolism, leading to the disruption of cellular redox homeostasis, which promotes cancer progression. 8 Evidence shows that glycolysis in OS is increased to facilitate malignant behaviors under aerobic conditions. 9 However, the molecule mechanisms underlying the glycolysis in OS are not fully characterized.
Long non‐coding RNAs (lncRNAs) with transcripts longer than 200 nucleotides play key roles in cell growth, migration, and apoptosis. 10 , 11 Accumulating evidence has shown the fundamental roles of lncRNAs in OS tumorigenesis. LncRNA BE503655 promotes cell malignant behaviors and serves as a tumor suppressor in OS. 12 LncRNA SNHG4 accelerates OS development by enhancing the epithelial–mesenchymal transition (EMT) process and cell migration. 13 LncRNA LOC100129620 increases tumor growth, metastasis, and angiogenesis, which expedites the pathological process of OS. 14 LncRNA DLGAP1‐AS2 located at human chromosome 18p11.31 has been found to participate in the physiological process of several cancers. Wang et al. found that DLGAP1‐AS2 promotes colorectal cancer tumorigenesis and metastasis by activating the AKT signaling pathway. 15 DLGAP1‐AS2 increases tamoxifen resistance in breast cancer by promoting the estrogen receptor signaling pathway. 16 Additionally, DLGAP1‐AS2 was found to enhance lung cancer malignancy by increasing aerobic glycolysis. 17 These studies suggest the potential role of DLGAP1‐AS2 in modulating cancer metastasis and glycolysis. However, whether DLGAP1‐AS2 affects OS progression remains uncertain.
As reported, cytoplasmic lncRNAs can relieve the inhibitory effects of microRNAs (miRNAs) on mRNA expression by sequestering miRNAs from targeting mRNAs as competitive endogenous RNAs (ceRNAs). 18 The ceRNA network plays crucial roles in OS tumorigenesis. For example, lncRNA TTN‐AS1 binds to miR‐134‐5p and upregulates the MBTD1 level, thus promoting the oncogenic behaviors and drug resistance in OS. 19 LncRNA BCRT1 serves as a sponge for miR‐1303 that targets FGF7, thereby accelerating inflammatory mediator secretion, the EMT process, cell cycle, and cell growth during OS progression. 20 LncRNA SNHG3 stimulates OS cell invasion and migration through modulation of the miR‐151a‐3p/RAB22A axis. 21 Nevertheless, the molecular mechanisms of DLGAP1‐AS2 in OS have not yet been elucidated.
In this report, we investigated the biological significance of DLGAP1‐AS2 as well as its related mechanisms involved in OS development. We hypothesized that DLGAP1‐AS2 affects OS cell malignancies by regulating glycolysis. The findings might reveal new clues for the treatment of OS.
2. METHODS
2.1. Patients
A total of 43 OS tumor specimens and the adjacent normal tissues were collected from patients receiving surgery at The Second Hospital of Jilin University. The diagnoses of OS were confirmed by two experienced pathologists. All the participants provided written informed consent. No patients had received any anticancer therapy before tumor sample collection. The use of clinical samples was approved by the Ethics Committee of The Second Hospital of Jilin University, in accordance with the principles outlined in the Declaration of Helsinki.
2.2. Bioinformatics analysis
Differential expression of DLGAP1‐AS2 in sarcoma was analyzed by the UALCAN database (http://ualcan.path.uab.edu). Potential miRNAs binding to DLGAP1‐AS2 were predicted by the lncRNASNP2 database (bioinfo.life.hust.edu.cn/ lncRNASNP#!/). Potential miRNAs targeting HK2 were predicted by the targetScan website (https://www.targetscan.org/vert_80/).
2.3. In situ hybridization
In situ hybridization (ISH) analysis was conducted in formalin‐fixed paraffin‐embedded OS tissues. The sections with a thickness of 4 μm were deparaffinized and hybridized in prehybridization solution containing digoxin‐labeled DLGAP1‐AS2 probe (RiboBio) at 52°C overnight. After hybridization, the samples were incubated with anti‐digoxin (Abcam) at 4°C overnight and stained with DAB substrate kit (DA1010; Solarbio). The DLGAP1‐AS2 probe was 5′‐GCGTTAGGGTGCTTACGTCTGTTTCACTCCAATCACCAAATAACAACCATCTCATTCCTTTCATTTACCATTTTGAATAGCAGCGGTGGCAAACTTTTGGATTTATTGAAAGGGTCTTGTCTGTGTCCTGGGGTTTACATCATCAT‐3′. The results were evaluated by two individuals in a blinded manner.
2.4. Immunohistochemistry
Immunohistochemistry (IHC) analyses were performed in formaldehyde‐fixed paraffin‐embedded tumor tissues. Endogenous peroxidase activity was blocked with hydrogen peroxide. After blocking non‐specific binding sites using goat serum, the tumor samples were incubated with Ki‐67 (ab16667, 1:200) and HK2 (ab209847, 1:500) overnight at 4°C followed by a 2‐h incubation with secondary antibodies at room temperature. Each section was washed with PBS and the reaction was developed with diaminobenzidine tetrahydrochloride and counterstained with hematoxylin. Images were obtained using a confocal microscope.
2.5. Cell culture
A normal osteoblastic cell line hFOB 1.19 and four human OS cell lines (U2OS, Soas2, 143B, and MG63) obtained from the ATCC (Manassas) were cultured in DMEM (Gibco) containing 10% FBS (PM150210B; Procell) with 5% CO2 at 37°C. To establish a hypoxic condition, U2OS and Soas2 cells were cultured in an incubator with 1% O2/5% CO2/94% N2 as previously described. 22
2.6. Cell transfection
Short hairpin RNAs (shRNA) targeting DLGAP1‐AS2 (sh‐DLGAP1‐AS2#1 and sh‐DLGAP1‐AS2#2) were used to knock down DLGAP1‐AS2 and sh‐NC acted as negative control (NC). The miR‐451a mimics were used for overexpressing miR‐451a and NC mimics acted as NCs. The coding region of DLGAP1‐AS2 or HK2 was inserted into the pcDNA3.1 vector to elevate DLGAP1‐AS2 or HK2 expression. When the cell confluence reached 80%, a total of 50 nM pcDNA3.1/DLGAP1‐AS2, 50 nM pcDNA3.1/HK2, 50 nM sh‐DLGAP1‐AS2#1/2, and 50 nM miR‐451a mimics or 50 nM of their corresponding NCs were transfected into U2OS and Soas2 cells using Lipofectamine 2000 (Invitrogen). The transfection efficiency was examined by RT‐qPCR after 48 h. All plasmids were synthesized by GenePharma.
2.7. RT‐qPCR
Total RNA extraction was performed in OS cells or tissues using TRIzol (Thermo Fisher Scientific) as per the supplier's introductions. RNA samples were reverse transcribed into cDNA using the PrimeScript RT Reagent Kit (Takara). RT‐qPCR analysis of gene expression was then performed with a SYBR Premix Ex Taq II Kit (Takara) on the ABI7500 quantitative PCR instrument (ABI Company). GAPDH and U6 functioned as internal references for mRNAs and miRNAs, respectively. The sequences of the primers are listed as below: DLGAP1‐AS2 F: 5′‐ACATCGTGGCTGAATGAACA‐3′, R: 5′‐ ATCAGTGGGGAGGAAGGAGT‐3′; HK2 F: 5′‐CAAAGTGACAGTGGGTGTGG‐3′, R: 5′‐GCCAGGTCCTTCACTGTCTC‐3′; miR‐451a F: 5′‐ACACTCCAGCTGGGAAACCGTTACCATTACT‐3′, R: 5′‐CTGGTGT CGTGGAGTCGGCAA‐3′; GAPDH F: 5′‐TCAAGATCATCAGCAATGCC‐3′, R: 5′‐CGATACCAAAGTTGTCATGGA‐3′; U6 F: 5′‐GGAATGCTTCAAAGAGTTGTG‐3′, R: 5′‐TCTAGAGGAGAAGCTGGGGT‐3′.
2.8. Western blotting
U2OS and Soas2 cells were treated with RIPA buffer (Sigma‐Aldrich) with protease inhibitor (ApexBio Technology) for total protein extraction. Protein (30 μg) was separated by 12% SDS‐PAGE and transferred onto PVDF membranes. After blocking with 5% skimmed milk, the membranes were incubated overnight with primary antibodies against E‐cadherin (ab231303, 1 μg/mL; Abcam), N‐cadherin (ab76011, 1:5000), Slug (ab27568, 1:500), HK2 (ab209847, 1:10000), Twist (ab50887, 2 μg/mL), and GAPDH (ab9485, 1:2500) at 4°C followed by a 2‐h incubation with secondary antibodies at room temperature. The membranes were subsequently subjected to TBST washing three times for 10 min each time. The blots were developed with an enhanced chemiluminescence (Yeasen) and imaged using the chemiluminescence detection system. GAPDH served as a loading control.
2.9. CCK‐8
After transfection, U2OS and Soas2 cells were seeded into 96‐well plates at a density of 3 × 10³ cells/well. CCK‐8 reagent (10 μL, Dojindo Molecular Technologies) was added to each well and incubated for 24 h, 48 h, and 72 h at 37°C and 5% CO2. The optical density (OD) at 450 nm was detected with a microplate reader (BioTek). The results are representative of three independent experiments.
2.10. Flow cytometry
An Annexin V‐FITC/PI Apoptosis Detection Kit (Amyjet Scientific) was used for apoptosis detection. Briefly, U2OS and Soas2 cells were stained with Annexin V‐FITC (5 μL) and PI Staining Solution (10 μL). After a reaction for 10 min in the dark, 400 μL binding buffer was added. The apoptotic cells were detected by flow cytometry (Beckman Coulter).
2.11. EdU
The U2OS and Soas2 cells seeded into 24‐well plates (2 × 10⁴ cells/well) were then exposed to a 4‐h incubation with 25 μM of EdU labeling kit (Beyotime). Subsequently, the cells were fixed with 4% paraformaldehyde and 0.5% Triton X‐100 (Beyotime). DAPI (Sigma‐Aldrich) was utilized for nuclei counterstaining. The EdU incorporation rate was calculated and the ratio of EdU‐positive cells (green cells) to total DAPI‐positive cells (blue cells) was evaluated. A fluorescent microscope (Carl Zeiss) was used to capture the images.
2.12. TUNEL
The transfected U2OS and Soas2 cells were inoculated into six‐well plates (1 × 10⁵ cells/well) and the cell apoptosis was examined using a TUNEL kit (Roche, Switzerland) according to the supplier's instructions. Later, a fluorescent microscope (Carl Zeiss) was used for image observation. DAPI (Sigma‐Aldrich) was used for nuclei counterstaining, and the average percentage of TUNEL‐positive cells was calculated.
2.13. Wound healing assay
The migratory capacity of OS cell lines was assessed using wound healing assays. When U2OS and Soas2 cells reached 90% confluence in 24‐well plates, the monolayers were scraped utilizing a sterile plastic tip and washed with PBS twice to remove the cellular debris. Afterward, the cells were incubated in a complete growth medium. Finally, under an inverted microscope (Olympus), the cells that had migrated to the wounded area were taken at 0 h and 24 h since the first scratch for each wound. ImageJ software was used to analyze the relative distance of wound healing. 23
2.14. Transwell assay
A Matrigel‐coated 24‐well transwell chamber (8 μm pore size) was prepared for cell invasion assays. The U2OS and Soas2 cells in serum‐free medium were incubated in the upper chamber. The medium with 10% FBS was then added to the lower chamber. After incubation for 48 h, the cells that had invaded to the lower chamber were fixed with methanol and stained with 0.1% crystal violet. The invaded cells were observed under an Olympus inverted microscope.
2.15. Glycolysis stress test
For the extracellular acidification rate (ECAR), 2 glucose, oligomycin, and 2‐deoxyglucose were added to a special medium in sequence. Glucose that was first added was catabolized to lactate and ATP. Oligomycin was then added to inhibit mitochondrial ATP production with the subsequent glycolysis production. ECAR readings were measured in milli‐pH units per minute. For oxygen consumption rate (OCR) analysis, the ATP synthase inhibitor oligomycin was first added to the medium to induce decreased OCR. Rapid oxygen consumption was then induced by the addition of carbonyl cyanide 4‐(trifluoromethoxy) phenylhydrazone. Next, electron transport chain inhibitors rotenone and antimycin A were added to the medium. Residual respiration corresponds to nonmitochondrial respiration. OCR values were read in picomoles per minute. An XF96 Glycolysis Analyzer (Seahorse Bioscience) was used to measure ECAR and OCR values.
2.16. Glucose metabolism assay
Glucose oxidase‐peroxidase (Sigma‐Aldrich) and Amplex Red reagent (Invitrogen) were used to quantify glucose consumption following the manufacturer's protocol. Extracellular lactate levels were measured using a lactate assay kit (BioVision) following the manufacturer's protocol. Cellular ATP level was examined using an ATP assay kit (Promega) following the manufacturer's instructions. Three independent experiments were performed.
2.17. FISH
Subcellular localization of DLGAP1‐AS2 was detected using FISH according to previously described methods. 24 In brief, U2OS and Soas2 cells cultured in 24‐well plates were fixed with 4% paraformaldehyde and washed with PBS. Next, the cells were permeabilized with PBS containing 0.5% Triton X‐100 on ice for 5 min. The DLGAP1‐AS2 probe (5′‐GCGTTAGGGTGCTTACGTCTGTTTCACTCCAATCACCAAATAACAACCATCTCATTCCTTTCATTTACCATTTTGAATAGCAGCGGTGGCAAACTTTTGGATTTATTGAAAGGGTCTTGTCTGTGTCCTGGGGTTTACATCATCAT‐3′) was synthesized by RiboBio (Guangzhou). The probes in the hybridization buffer were incubated with cells overnight at 37 °C. After DAPI staining, an Olympus IX83 (Olympus) was used to capture the immunofluorescent images.
2.18. Subcellular fractionation assay
The isolation of nuclear and cytoplasmic fractions was performed using a Subcellular Protein Fraction Kit (Thermo Fisher Scientific) according to the manufacturer's instructions. The relative expression of DLGAP1‐AS2 in the cytoplasm and the nucleus was evaluated by RT‐qPCR. Additionally, the abundance of DLGAP1‐AS2, U6, and GAPDH was detected by RT‐qPCR.
2.19. Luciferase reporter assay
Wild‐type DLGAP1‐AS2 and the mutant‐type DLGAP1‐AS2 were cloned into the firefly luciferase gene reporter vector pmirGLO (Promega). The pmirGLO‐DLGAP1‐AS2‐WT or pmirGLO‐DLGAP1‐AS2‐MUT was co‐transfected into U2OS and Soas2 cells with miR‐451a mimics or NC mimics for 48 h, and then detected using the luciferase reporter assay system (Promega). 25 Similarly, wild‐type HK2 and mutant‐type HK2 were cloned into the firefly luciferase gene reporter vector pmiRGLO (Promega). The pmirGLO‐HK2‐WT or pmirGLO‐HK2‐MUT was co‐transfected with miR‐451a mimics, miR‐451a mimics plus DLGAP1‐AS2, or NC mimics into U2OS and Soas2 cells. Luciferase activity was assayed 48 h after transfection.
2.20. Xenograft tumor model
BALB/c nude mice (6‐week‐old, female, 20–22 g) were purchased from BIOCY TOGEN Medical Technology and housed in a conditioned environment (23–25°C, 12 h/12 h light/darkness cycle, 50%–60% humidity) with free access to food and water. The animal experiments were approved by the Institutional Animal Care and Use Committee of The Second Hospital of Jilin University and were conducted based on the institutional guidelines. All mice were assigned to four groups: (1) sh‐NC group; (2) sh‐DLGAP1‐AS2 group; (3) vector group; and (4) DLGAP1‐AS2 group. N = 6 mice/group. For xenograft tumor experiments, 0.2 mL of the above cell suspension that contained 2 × 10⁶ U2OS cells was subcutaneously injected into each nude mouse. The tumor size of each group was assessed every 4 days using a digital caliper. The tumor volume was calculated according to the formula as previously described. 26 After 32 days, the mice were killed by CO2 asphyxia and tumors were weighted. To assess the lung metastasis, 2 × 10⁶ cells with sh‐NC or sh‐DLGAP1‐AS2 were injected via the tail vein into the mice. After 6 weeks, the mice were killed. The lung tissue samples were fixed with 4% formaldehyde solution for the H&E staining as previously described. 27
2.21. Statistical analysis
Statistical analysis was performed using SPSS 21.0 statistical software (IBM). The data from three independent experiments are shown as mean ± SD. Student's t‐test was used when two groups were compared. Comparisons among multiple groups were analyzed using one‐way ANOVA and Tukey's s post hoc test. p < 0.05 indicated that the difference is statistically significant.
3. RESULTS
3.1. DLGAP1‐AS2 is overexpressed in osteosarcoma and DLGAP1‐AS2 promotes osteosarcoma cell malignancies
TCGA database showed that the DLGAP1‐AS2 level is markedly overexpressed in 259 sarcoma tissue samples in comparison with two normal samples (Figure 1A). We next investigated the DLGAP1‐AS2 level in clinical OS tissues using qPCR analysis. DLGAP1‐AS2 expression was significantly higher in OS tissues than in the corresponding adjacent normal tissues (Figure 1B). ISH revealed a higher expression of DLGAP1‐AS2 in OS tissues than in normal tissues (Figure 1C). Moreover, DLGAP1‐AS2 was strongly stained in the cytoplasm. DLGAP1‐AS2 expression was shown to be higher in OS cell lines (U2OS, Saos2, 143B, and MG63) than in hFOB 1.19 cells (Figure 1D). Given the high expression of DLGAP1‐AS2 in OS, we investigated whether DLGAP1‐AS2 affects OC progression in vitro. We selected two OS cell lines, U2OS and Saos2, and knocked down DLGAP1‐AS2 expression by transfecting with sh‐DLGAP1‐AS2#1/2 in them (Figure 1E). CCK‐8 assays showed that DLGAP1‐AS2 depletion notably dampened OS cell viability (Figure S1B). EdU assay indicated that U2OS and Saos2 cells transfected with sh‐DLGAP1‐AS2#1/2 had lower proliferation ability than those transfected with sh‐NC (Figure 1F). The results obtained from the TUNEL assay showed that the percentage of apoptotic OS cells was elevated after sh‐DLGAP1‐AS2#1/2 transfection (Figure 1G). Flow cytometry analysis further demonstrated the proapoptotic effects of DLGAP1‐AS2 knockdown on U2OS and Saos2 cells (Figure S1C). Additionally, as the wound healing assay revealed, a significantly decreased healed wound percentage was found in OS cell lines transfected with sh‐DLGAP1‐AS2#1/2 compared to the control group (Figure 1H), suggesting the inhibitory impact of silencing DLGAP1‐AS2 on OS cell migration. DLGAP1‐AS2 knockdown also suppressed the invasion of cancer cells, as illustrated by the Transwell assay (Figure 1I). Finally, as western blotting revealed, the sh‐DLGAP1‐AS2#1/2 groups exhibited lower protein levels of N‐cadherin, Slug, and Twist as well as higher protein levels of E‐cadherin than the sh‐NC group (Figure 1J), which demonstrated the suppressive effects of downregulated DLGAP1‐AS2 on the EMT process in OS cell lines. We also examined the impact of DLGAP1‐AS2 overexpression on OS cells. The DLGAP1‐AS2 level was increased more in the DLGAP1‐AS2 overexpression group than in the vector group (Figure S1A). As CCK‐8, flow cytometry, wound healing, and Transwell assays indicated, DLGAP1‐AS2 overexpression significantly promoted cell viability, migration, and invasion, as well as reduced apoptosis (Figure S1B–E).
FIGURE 1.
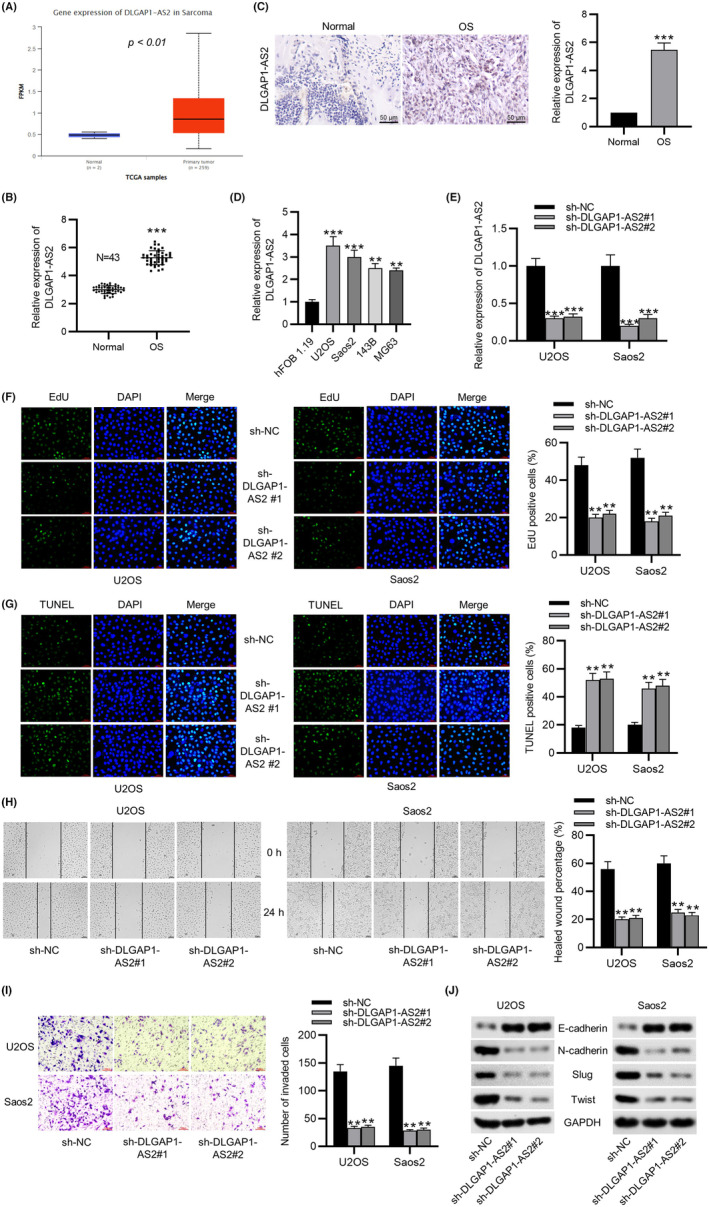
DLGAP1‐AS2 is overexpressed in osteosarcoma (OS) and DLGAP1‐AS2 depletion restrains OS cell malignancies. (A) DLGAP1‐AS2 level in sarcoma tissues (n = 259) and non‐tumor tissues (n = 2) shown by TCGA. (B) RT‐qPCR and (C) ISH analyses of DLGAP1‐AS2 level in OS tissues and adjacent normal tissues. (D) DLGAP1‐AS2 expression in OS cell lines and hFOB 1.19 cells measured by RT‐qPCR. (E) Knockdown efficiency of DLGAP1‐AS2 measured by RT‐qPCR. (F) Impact of silencing DLGAP1‐AS2 on OS cell proliferation determined by EdU assay. (G) Impact of silencing DLGAP1‐AS2 on OS cell apoptosis evaluated by TUNEL assay. (H) Impact of silencing DLGAP1‐AS2 on OS cell migration tested by wound healing assay. (I) Impact of silencing DLGAP1‐AS2 on OS cell invasion detected by Transwell assay. (J) Western blotting of the protein levels of EMT‐related markers in OS cell lines. **p < 0.01, ***p < 0.001.
3.2. DLGAP1‐AS2 promotes aerobic glycolysis in osteosarcoma
Tumor cells have a high rate of lactate production and glucose consumption in the presence of oxygen, which promotes tumor growth and reduces apoptosis. To evaluate whether DLGAP1‐AS2 affects bioenergetic changes in OS, ECAR and OCR in DLGAP1‐AS2‐silencing OS cells were measured using a metabolic flux analyzer. Figure 2A,B showed that silencing DLGAP1‐AS2 partly decreased the ECAR in U2OS and Saos2 cell lines but elevated the OCR of these two cell lines. Moreover, DLGAP1‐AS2 downregulation in OS cells also reduced glucose consumption (Figure 2C) and lactate produced by aerobic glycolysis (Figure 2D) and elevated the ATP level induced by oxidative phosphorylation (Figure 2E). In contrast, overexpression of DLGAP1‐AS2 significantly increased glucose consumption, lactate concentration, and ATP levels, as well as elevated the ECAR in OS cells (Figure S1F–I). These data suggested that DLGAP1‐AS2 contributed to aerobic glycolysis in OS cells. To elucidate how DLGAP1‐AS2 regulates glucose metabolism in OS, the expression levels of several genes associated with the glycolytic pathway in DLGAP1‐AS2‐knockdown cells were measured. The data indicated that DLGAP1‐AS2 depletion notably downregulated HK2, a key glycolytic gene, in U2OS and Saos2 cell lines (Figure 2F). We further compared the HK2 level in OS cells with that in hFOB1.19 cells. Figure 2G revealed that three OS cell lines exhibited a markedly higher HK2 level than the hFOB1.19 cell line, suggesting that DLGAP1‐AS2 might regulate glucose metabolism through the regulation of HK2. Moreover, we found a higher expression of HK2 in OS tissues than in the corresponding adjacent normal tissues using qPCR and IHC analyses (Figure 2H,I).
FIGURE 2.
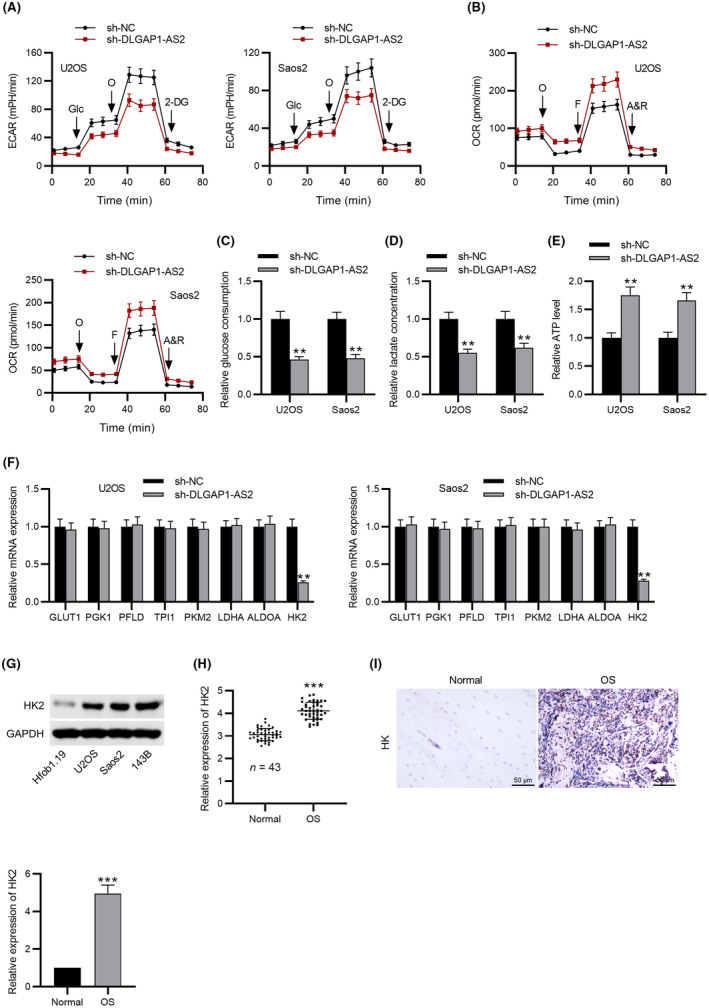
DLGAP1‐AS2 depletion inhibits aerobic glycolysis in osteosarcoma (OS). (A) Extracellular acidification rate (ECAR) and (B) OCR of U2OS and Soas2 cells in the sh‐NC and sh‐DLGAP1‐AS2 group. (C) Glucose consumption, (D) lactate production, and (E) ATP level in the sh‐NC and sh‐DLGAP1‐AS2 group. (F) Expression of several genes associated with the glycolytic pathway in DLGAP1‐AS2‐knockdown cells and control cells measured by RT‐qPCR. (G) Western blotting analysis of HK2 protein expression in OS cells. (H) RT‐qPCR and (I) IHC analyses of HK2 expression in OS tissues and adjacent normal tissues. **p < 0.01, ***p < 0.001.
3.3. DLGAP1‐AS2 is upregulated in hypoxic and glucose‐deprived microenvironments
Hypoxia has been suggested as a common feature of solid tumors and is a critical modulator of aerobic glycolysis, and we examined whether the hypoxic milieu affects the expression of DLGAP1‐AS2. We analyzed the changes in DLGAP1‐AS2 expression in the normoxic condition (20% O2 for 24 h) and the hypoxic condition (1% O2 for 24 h). The qPCR data showed that DLGAP1‐AS2 expression in four OS cell lines was remarkably higher in the hypoxic condition than in the normoxic condition (Figure S2A). Moreover, the DLGAP1‐AS2 level was found to be induced by hypoxia in a concentration‐ and time‐dependent manner (Figure S2B). Microenvironment variations modulate glucose metabolism in cancer cells. We used various concentrations of glucose from 2.5 mM to 20 mM to treat OS cells to mimic a glucose deprivation condition, and DLGAP1‐AS2 expression was measured. The data showed that glucose deprivation induced the upregulation of DLGAP1‐AS2 in a concentration‐ and time‐dependent manner in OS cells (Figure S2C). These findings suggested that hypoxic milieu and low glucose induced DLGAP1‐AS2 upregulation to trigger metabolic reprogramming in OS cells.
3.4. HK2 overexpression countervails the suppressive impact of silenced DLGAP1‐AS2 on osteosarcoma cell malignancies
Subsequently, we determined whether DLGAP1‐AS2 participates in OS progression via HK2‐mediated glycolysis. Transfection of pcDNA3.1/HK2 led to an elevation of HK2 expression in OS cell lines (Figure 3A). According to the EdU assay, restoration of HK2 abated the repressive effects of DLGAP1‐AS2 knockdown on OS cell proliferation (Figure 3B). In addition, HK2 elevation impeded OS cell apoptosis, which was promoted by DLGAP1‐AS2 depletion (Figure 3C). As illustrated by Figure 3D, silencing DLGAP1‐AS2 decelerated OS cell migration, which was antagonized by overexpression of HK2. Similarly, decreased invasive abilities of OS cells induced by downregulated DLGAP1‐AS2 were restored by HK2 overexpression (Figure 3E). DLGAP1‐AS2 knockdown contributed to the impaired EMT process, as evidenced by a decrease in N‐cadherin, Slug, and Twist, and elevation in E‐cadherin, but this process was reversed by elevated expression of HK2 (Figure 3F).
FIGURE 3.
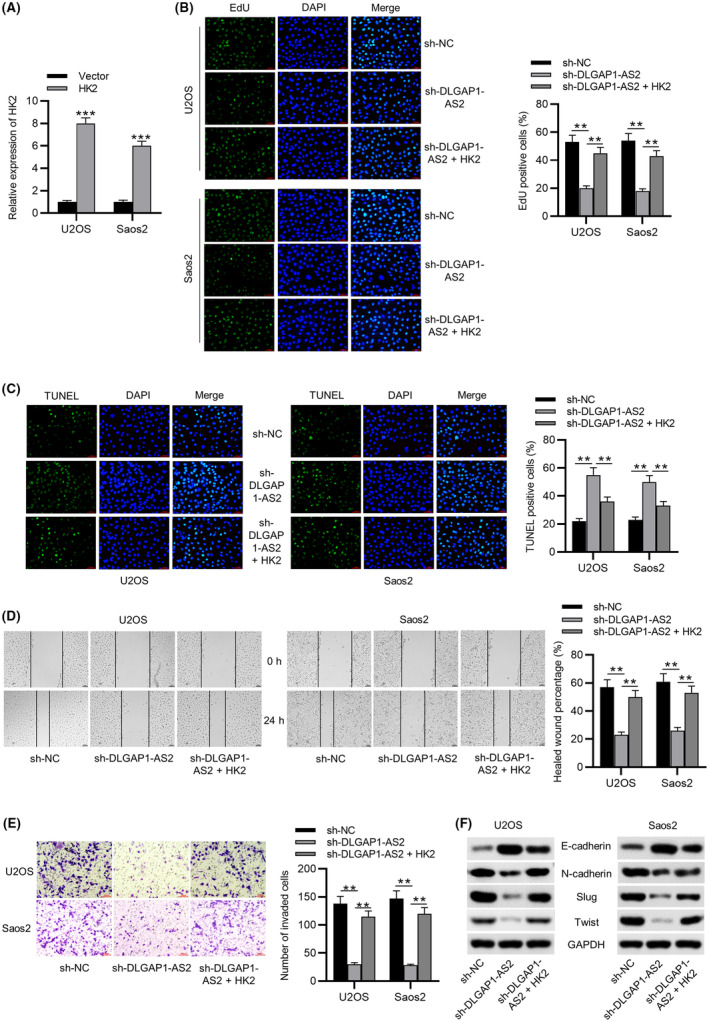
HK2 elevation rescues the impact of DLGAP1‐AS2 knockdown on osteosarcoma (OS) cellular behaviors. (A) Transfection efficacy of pcDNA3.1/HK2 detected by RT‐qPCR. (B) EdU assay of the proliferative abilities of U2OS and Soas2 cells transfected with sh‐NC, sh‐DLGAP1‐AS2, and sh‐DLGAP1‐AS2 + HK2. (C) The apoptotic behaviors of OS cell lines transfected with the indicated plasmids were evaluated by TUNEL assay. (D) Wound healing assay of cell migration in indicated groups. (E) Transwell assay of cell invasion in indicated groups. (F) Western blotting of the protein levels of EMT‐related markers in indicated groups. **p < 0.01, ***p < 0.001.
3.5. DLGAP1‐AS2 upregulates HK2 expression by sponging miR‐451a
The mechanism DLGAP1‐AS2 regulating HK2 expression was further detected. According to subcellular fractionation and FISH assays, we discovered that the distribution of DLGAP1‐AS2 in the cytoplasm was markedly greater than that in the nucleus (Figure 4A,B), suggesting that DLGAP1‐AS2 might function through post‐transcriptional modification. Then, we searched the targetScan database to predict the binding miRNAs for HK2 and the lncRNASNP2 database to predict the miRNAs for DLGAP1‐AS2. The intersection of these two databases shows one miRNA‐miR451a (Figure 4C). Downregulated expression of miR‐451a in OS cells was detected (Figure 4D). Afterward, we overexpressed miR‐451a in OS cells by transfection with miR‐451a mimics (Figure 4E). A possible binding site of DLGAP1‐AS2/HK2 to miR‐451a is shown (Figure 4F). Compared to the NC mimics group, the luciferase activity of DLGAP1‐AS2‐Wt was inhibited in the miR‐451a mimics group, while DLGAP1‐AS2‐Mut luciferase activity seemed unchanged either in the NC mimics group or the miR‐451a mimics group (Figure 4G), implying the binding relation between DLGAP1‐AS2 and miR‐451a. Subsequently, the binding relations among DLGAP1‐AS2, miR‐451a, and HK2 were verified by luciferase reporter assay. Upregulation of miR‐451a restrained the luciferase activity of HK2‐WT in OS cell lines, while this event was reversed by overexpression of DLGAP1‐AS2. Meanwhile, the luciferase activity of HK2‐Mut exhibited no significant changes in both the miR‐451a mimics group and the miR‐451a mimics + DLGAP1‐AS2 group (Figure 4H). As presented in Figure 4I, the HK‐1 protein level was reduced by miR‐451a overexpression or DLGAP1‐AS2 knockdown. This suggested that DLGAP1‐AS2 bound to miR‐451a to upregulate HK2 expression.
FIGURE 4.
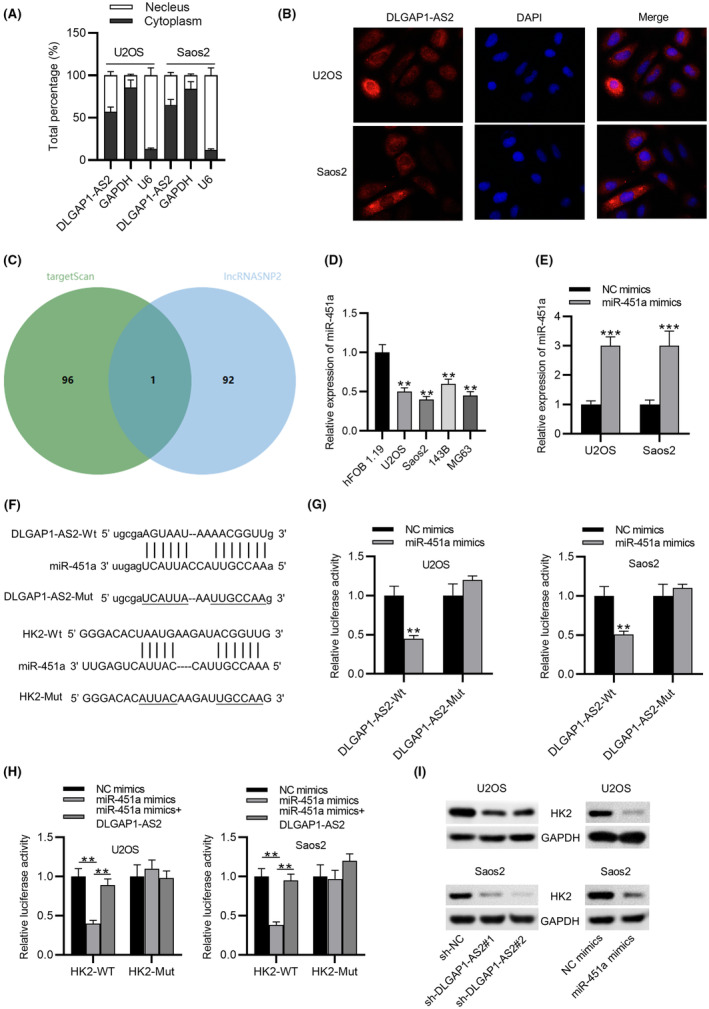
DLGAP1‐AS2 upregulates HK2 expression by sponging miR‐451a. (A, B) Cellular localization of DLGAP1‐AS2 determined by subcellular fractionation assay and FISH. (C) A Venn diagram of the intersection of miRNAs predicted by the targetScan and lncRNASNIP2 databases. (D) RT‐qPCR analysis of miR‐451a expression in osteosarcoma (OS) cell lines and hFOB 1.19 cells. (E) Overexpression efficiency of miR‐451a shown by RT‐qPCR. (F) Possible binding site of DLGAP1‐AS2/HK2 to miR‐451a. (G) Luciferase reporter assay for validation of the interaction between DLGAP1‐AS2 and miR‐451a. (H) The interactions among DLGAP1‐AS2, miR‐451a, and HK2 were verified by luciferase reporter assay. (I) The impact of miR‐451a overexpression and silenced DLGAP1‐AS2 on HK2 protein level shown by western blotting. **p < 0.01, ***p < 0.001.
3.6. DLGAP1‐AS2 knockdown inhibits osteosarcoma progression via the miR‐451a/HK2 axis‐mediated glycolysis
To investigate whether DLGAP1‐AS2 functions in OS by interacting with miR‐451a, we applied rescue assays by transfecting sh‐DLGAP1‐AS2 and miR‐451a inhibitors into OS cell lines. We observed that DLGAP1‐AS2 depletion‐mediated downregulation of HK2 was restored by miR‐451a inhibition in U2OS and Soas2 cells (Figure 5A). EdU results revealed that miR‐451a inhibition abated the repressive effects of DLGAP1‐AS2 knockdown on OS cell proliferation (Figure 5B). As shown in Figure 5C,F, the aerobic glycolysis inhibited by silencing DLGAP1‐AS2 was partly restored by miR‐451a inhibition, suggesting that DLGAP1‐AS2 promoted OS progression by affecting glycolysis via the miR‐451a/HK2 axis.
FIGURE 5.
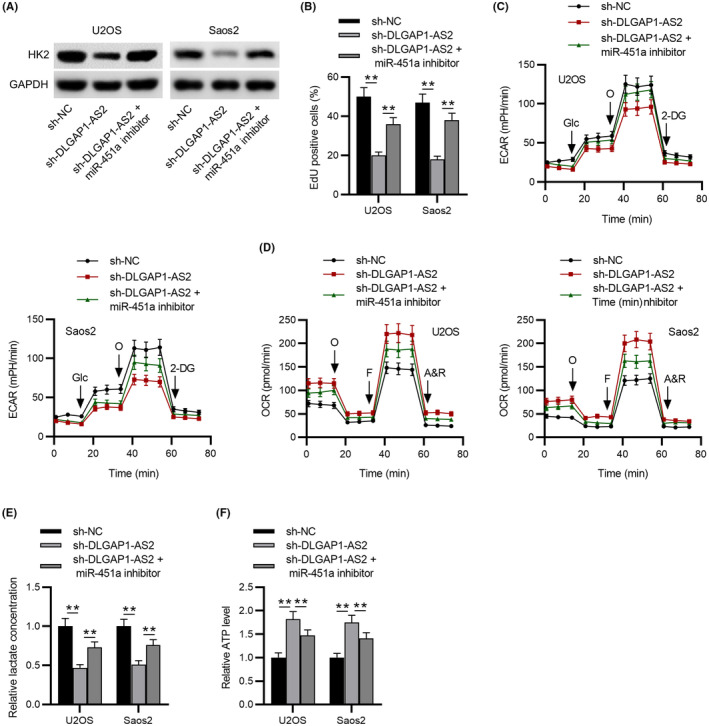
DLGAP1‐AS2 knockdown inhibits osteosarcoma (OS) progression via the miR‐451a/HK2 axis‐mediated glycolysis. (A) Western blotting of HK2 protein level in control, sh‐DLGAP1‐AS2, and sh‐DLGAP1‐AS2 + miR‐451a inhibitor groups. (B) EdU assay of the proliferative abilities of U2OS and Soas2 cells. (C) extracellular acidification rate (ECAR) and (D) OCR of U2OS and Soas2 cells in control, sh‐DLGAP1‐AS2, and sh‐DLGAP1‐AS2 + miR‐451a inhibitor groups. (E) Lactate production and (F) ATP level in experimental groups. **p < 0.01.
3.7. DLGAP1‐AS2 promotes osteosarcoma tumor growth and metastasis in vivo
To further investigate the functional role of DLGAP1‐AS2 in vivo, mice were subcutaneously injected with U2OS cells transfected with sh‐NC and sh‐DLGAP1‐AS2. We examined the size, volume, and weight every 4 days. Silencing DLGAP1‐AS2 induced a significant decrease in tumor size and weight compared to the control (Figure 6A–C). In contrast, overexpression of DLGAP1‐AS2 notably contributed to tumor growth in vivo (Figure S3A–C). In addition, a lower Ki‐67 and HK2 expression level was found in the tumor tissues from the sh‐DLGAP1‐AS2 group than in the control group, as shown by IHC analysis (Figure 6D,E). We further detected upregulation of miR‐451a expression in the sh‐DLGAP1‐AS2 group (Figure 6F). In the lung metastasis model, the sh‐DLGAP1‐AS2 group exhibited a smaller number of lung metastases than the sh‐NC group (Figure 6G,H), suggesting that DLGAP1‐AS2 knockdown suppressed OS metastasis in vivo.
FIGURE 6.
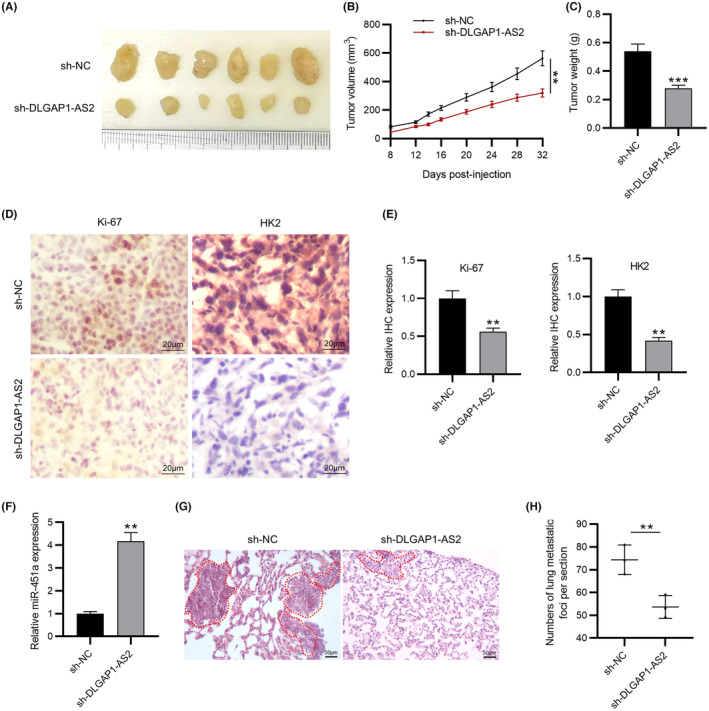
DLGAP1‐AS2 silencing suppresses osteosarcoma (OS) tumor growth and metastasis in vivo. (A–C) The size, volume, and weight of tumor in mouse xenograft models. (D, E) IHC staining of Ki‐67 and HK2 in tumors from experimental groups. (F) RT‐qPCR of miR‐451a expression in tumor tissues. (G) Representative microscopic images of the lung tissue sections by HE staining. (H) Quantification of the number of lung metastases. N = 6 mice/group. **p < 0.01, ***p < 0.001.
4. DISCUSSION
Osteosarcoma is a kind of primary intraosseous tumor with a high rate of metastasis and recurrence. 28 Although diagnosis and therapy have improved over the past decades, the prognosis in OS patients remains unfavorable. 29 Thus, exploration of the molecular mechanisms and novel therapeutic targets for preventing OS tumorigenesis and progression is of great urgency.
Accumulating investigations have indicated that lncRNAs are implicated in a large range of cancers, such as gastric carcinoma, thyroid cancer, and OS. 30 , 31 , 32 The critical roles of multiple lncRNAs in OS tumor growth, cell invasion, metastasis, and apoptosis have been previously demonstrated. 33 , 34 , 35 In this study, we observed upregulated DLGAP1‐AS2 expression in OS samples and cells. According to a series of functional experiments, we discovered that DLGAP1‐AS2 depletion repressed the proliferation and accelerated the apoptosis of OS cell lines. Increased migratory and invasive capacities are the important characteristics of OS tumorigenesis. 36 Here, silencing DLGAP1‐AS2 suppressed OS cell migration and invasion. As a highly dynamic mechanism, epithelial–mesenchymal transition (EMT) contributes to cancer malignancies and metastasis. 37 During the EMT process, epithelial cells with high polarization and immobility lose tight junctions and associated adherence to become migratory mesenchymal cells. 38 Reduction in E‐cadherin and increase in vimentin and N‐cadherin are hallmarks of EMT. 39 , 40 Several transcription factors, including δEF1/ZEB1, Twist, and the Snail/Slug family, are sensitive to microenvironmental stimuli and function as molecular switches for the EMT process. 41 Therefore, we also investigated the impact of downregulated DLGAP1‐AS2 on the EMT process in OS cells. In this study, DLGAP1‐AS2 deficiency contributed to elevation in E‐cadherin and decrease in N‐cadherin, Slug, and Twist, indicting the inhibition on the EMT process induced by silenced DLGAP1‐AS2 in OS cells. More importantly, the growth and lung metastasis of xenograft tumors were notably suppressed by DLGAP1‐AS2 knockdown. We also demonstrated the oncogenic effects of DLGAP1‐AS2 in the development of OS. Previous studies also demonstrated the effects exerted by DLGAP1‐AS2 on cancer cell migration and invasion. 42 , 43
Increased aerobic glycolysis is accompanied by elevation in lactate production and glucose consumption in cancer cells. 44 Even though glycolysis is less efficient at producing ATP, this energy metabolism reprogramming promotes cancer progression under molecularly stressful conditions depending on its own advantages. Glycolysis provides several intermediates for multiple metabolism‐related signaling pathways to meet cancer cells’ demand for growth and survival. 45 Moreover, the acidic environment produced by aerobic glycolysis stimulates cancer invasiveness and metastasis. 46 Thus, targeting glycolysis could be a potential approach for reversing cancer cell growth. However, the roles of lncRNAs in energy metabolism reprogramming in OS cells have not been fully investigated. DLGAP1‐AS2 was found by Zhang et al. to enhance lung cancer malignancy by promoting aerobic glycolysis. 17 OS cells are commonly exposed to a hypoxic microenvironment due to aberrant microvasculature and unrestrained tumor growth and expansion. In the present study, we found that hypoxia and glucose deprivation induced high expression of DLGAP1‐AS2 in a time‐ and concentration‐dependent manner in OS cells. Additionally, we showed that aerobic glycolysis in OS cell lines was substantially inhibited by DLGAP1‐AS2 depletion and increased by DLGAP1‐AS2 overexpression, which was responsible for the DLGAP1‐AS2‐induced OS malignant development.
To elucidate how DLGAP1‐AS2 regulates glucose metabolism in OS, the expression of several genes associated with the glycolytic pathway in DLGAP1‐AS2‐knockdown cells was detected. We found that DLGAP1‐AS2 depletion notably downregulated HK2 expression in U2OS and Saos2 cell lines. HK2 is a well‐known metabolic enzyme that is critically involved in glucose uptake and consumption in cancer cells. 47 Upregulation of HK2 has been detected in multiple cancers, contributing to tumor growth, metastasis, and glucose metabolism. 48 , 49 Additionally, HK2 has been reported to facilitate the glycolysis‐mediated OS progression via different mechanisms. 50 , 51 Our study also found upregulation of HK2 in OS cells. After overexpression of HK2, DLGAP1‐AS2 knockdown‐inhibited OS cell malignancies including proliferation, motility, and EMT were greatly restored. Moreover, we observed downregulated expression of HK2 in tumor tissues resected from DLGAP1‐AS2‐knockdown xenograft mice. These findings suggested that the oncogenic effects of DLGAP1‐AS2 might be attributed to HK2‐mediated aerobic glycolysis.
MicroRNAs (miRNAs) are identified as small non‐coding RNA molecules with 20–24 nucleotides. 52 Accumulating evidence has demonstrated the hypothesis that lncRNAs act as ceRNAs competitively sponge miRNAs to modulate the downstream targeted mRNAs. 53 Previous reports have manifested that lncRNAs can act as ceRNAs to exert their functions in OS development. 54 In the current study, the findings of subcellular fractionation assay and FISH showed the cytoplasmic distribution of DLGAP1‐AS2, indicating the potential of DLGAP1‐AS2 as a ceRNA. Then bioinformatics analysis and relevant experiments verified that miR‐451a was a miRNA that bound to both DLGAP1‐AS2 and HK2. MiR‐451a has been identified as a critical regulator in some cancers, including lung cancer, 55 prostate cancer, 56 and OS. 57 The upstream mechanism of how miR‐451a participates in OS has not been elucidated. In this study, miR‐451 was found underexpressed in OS cells. Upregulation of miR‐451 inhibited HK2 expression, which exerted the same effects as DLGAP1‐AS2 depletion. To investigate whether DLGAP1‐AS2 affects glycolysis in OS cells via the miR‐451a‐targeted HK2, we performed rescue assays. Our results indicated that miR‐451a inhibition restored OS cell proliferation and glycolysis inhibited by DLGAP1‐AS2 knockdown. Additionally, miR‐451a was found to be upregulated in DLGAP1‐AS2‐knockdown xenograft mice. These findings implied that miR‐451 participated in the DLGAP1‐AS2‐mediated regulation of HK2 expression.
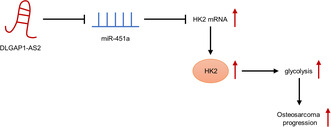
In conclusion, this research revealed the function of DLGAP1‐AS2 in enhancing OS tumorigenesis and its related mechanism. Mechanistically, DLGAP1‐AS2 enhanced aerobic glycolysis by controlling miR‐451a availability to facilitate HK2 expression, thereby promoting OS growth and metastasis (Figure 7). Our study contributes to an understanding of DLGAP1‐AS2 in the physiopathology of OS and implies that DLGAP1‐AS2 might be a useful target for OS therapy.
FIGURE 7.
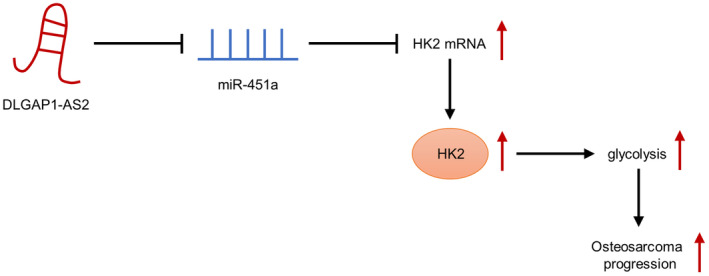
Schematic diagram of the role of DLGAP1‐AS2 in osteosarcoma (OS) and its mechanism.
AUTHOR CONTRIBUTIONS
Changjun Zheng conceived and designed the experiments. Changjun Zheng, Ronghang Li, Shuang Zheng, Hongjuan Fang, Meng Xu, and Lei Zhong carried out the experiments. Changjun Zheng and Lei Zhong analyzed the data. Changjun Zheng and Lei Zhong drafted the manuscript. All authors agreed to be accountable for all aspects of the work. All authors have read and approved the final manuscript.
FUNDING INFORMATION
None.
CONFLICT OF INTEREST STATEMENT
The authors have no conflicts of interest to declare.
ETHICS STATEMENT
Approval of the research protocol by an Institutional Reviewer Board: N/A.
Informed Consent: N/A.
Registry and the Registration No. of the study/trial: N/A.
Animal Studies: All procedures in animal experiments were under the approval of Ethics Committee of The Second Hospital of Jilin University.
Supporting information
Figures S1–S3.
ACKNOWLEDGMENTS
We thank all participants for their help.
Zheng C, Li R, Zheng S, Fang H, Xu M, Zhong L. The knockdown of lncRNA DLGAP1‐AS2 suppresses osteosarcoma progression by inhibiting aerobic glycolysis via the miR‐451a/HK2 axis. Cancer Sci. 2023;114:4747‐4762. doi: 10.1111/cas.15989
DATA AVAILABILITY STATEMENT.
The datasets used or analyzed during the current study are available from the corresponding author upon reasonable request.
REFERENCES
- 1. Xie J, Yuan Y, Yao G, Chen Z, Yu W, Zhu Q. Nucleoporin 160 (NUP160) inhibition alleviates diabetic nephropathy by activating autophagy. Bioengineered. 2021;12(1):6390‐6402. [DOI] [PMC free article] [PubMed] [Google Scholar]
- 2. Harvei S, Solheim O. The prognosis in osteosarcoma: Norwegian National Data. Cancer. 1981;48(8):1719‐1723. [DOI] [PubMed] [Google Scholar]
- 3. Yang C, Huang D, Ma C, et al. Identification of pathogenic genes and transcription factors in osteosarcoma. Pathol Oncol Res. 2020;26(2):1041‐1048. [DOI] [PubMed] [Google Scholar]
- 4. Kovac M, Blattmann C, Ribi S, et al. Exome sequencing of osteosarcoma reveals mutation signatures reminiscent of BRCA deficiency. Nat Commun. 2015;6:8940. [DOI] [PMC free article] [PubMed] [Google Scholar]
- 5. Park MK, Zhang L, Min KW, et al. NEAT1 is essential for metabolic changes that promote breast cancer growth and metastasis. Cell Metab. 2021;33(12):2380‐2397.e9. [DOI] [PMC free article] [PubMed] [Google Scholar]
- 6. Chu Z, Huo N, Zhu X, et al. FOXO3A‐induced LINC00926 suppresses breast tumor growth and metastasis through inhibition of PGK1‐mediated Warburg effect. Mol Ther. 2021;29(9):2737‐2753. [DOI] [PMC free article] [PubMed] [Google Scholar]
- 7. Meng F, Wu L, Dong L, et al. EGFL9 promotes breast cancer metastasis by inducing cMET activation and metabolic reprogramming. Nat Commun. 2019;10(1):5033. [DOI] [PMC free article] [PubMed] [Google Scholar]
- 8. Sharif T, Ahn DG, Liu RZ, et al. The NAD(+) salvage pathway modulates cancer cell viability via p73. Cell Death Differ. 2016;23(4):669‐680. [DOI] [PMC free article] [PubMed] [Google Scholar]
- 9. Feng Z, Ou Y, Hao L. The roles of glycolysis in osteosarcoma. Front Pharmacol. 2022;13:950886. [DOI] [PMC free article] [PubMed] [Google Scholar]
- 10. Hua Q, Jin M, Mi B, et al. LINC01123, a c‐Myc‐activated long non‐coding RNA, promotes proliferation and aerobic glycolysis of non‐small cell lung cancer through miR‐199a‐5p/c‐Myc axis. J Hematol Oncol. 2019;12(1):91. [DOI] [PMC free article] [PubMed] [Google Scholar]
- 11. Xu M, Chen X, Lin K, et al. lncRNA SNHG6 regulates EZH2 expression by sponging miR‐26a/b and miR‐214 in colorectal cancer. J Hematol Oncol. 2019;12(1):3. [DOI] [PMC free article] [PubMed] [Google Scholar]
- 12. Huang Q, Shi SY, Ji HB, Xing SX. LncRNA BE503655 inhibits osteosarcoma cell proliferation, invasion/migration via Wnt/β‐catenin pathway. Biosci Rep. 2019;39(7):BSR20182200. [DOI] [PMC free article] [PubMed] [Google Scholar]
- 13. Huang YF, Lu L, Shen HL, Lu XX. LncRNA SNHG4 promotes osteosarcoma proliferation and migration by sponging miR‐377‐3p. Mol Genet Genomic Med. 2020;8(8):e1349. [DOI] [PMC free article] [PubMed] [Google Scholar] [Retracted]
- 14. Chen Y, Tang G, Qian H, et al. LncRNA LOC100129620 promotes osteosarcoma progression through regulating CDK6 expression, tumor angiogenesis, and macrophage polarization. Aging. 2021;13(10):14258‐14276. [DOI] [PMC free article] [PubMed] [Google Scholar]
- 15. Wang X, Cheng H, Zhao J, et al. Long noncoding RNA DLGAP1‐AS2 promotes tumorigenesis and metastasis by regulating the Trim21/ELOA/LHPP axis in colorectal cancer. Mol Cancer. 2022;21(1):210. [DOI] [PMC free article] [PubMed] [Google Scholar]
- 16. Liang X, Zhao Y, Fang Z, et al. DLGAP1‐AS2 promotes estrogen receptor signalling and confers tamoxifen resistance in breast cancer. Mol Biol Rep. 2022;49(5):3939‐3947. [DOI] [PubMed] [Google Scholar]
- 17. Zhang Q, Zhang Y, Chen H, et al. METTL3‐induced DLGAP1‐AS2 promotes non‐small cell lung cancer tumorigenesis through m(6)a/c‐Myc‐dependent aerobic glycolysis. Cell Cycle. 2022;21(24):2602‐2614. [DOI] [PMC free article] [PubMed] [Google Scholar]
- 18. Wang JY, Yang Y, Ma Y, et al. Potential regulatory role of lncRNA‐miRNA‐mRNA axis in osteosarcoma. Biomed Pharmacother. 2020;121:109627. [DOI] [PubMed] [Google Scholar]
- 19. Fu D, Lu C, Qu X, et al. LncRNA TTN‐AS1 regulates osteosarcoma cell apoptosis and drug resistance via the miR‐134‐5p/MBTD1 axis. Aging. 2019;11(19):8374‐8385. [DOI] [PMC free article] [PubMed] [Google Scholar]
- 20. Han G, Guo Q, Ma N, et al. LncRNA BCRT1 facilitates osteosarcoma progression via regulating miR‐1303/FGF7 axis. Aging. 2021;13(11):15501‐15510. [DOI] [PMC free article] [PubMed] [Google Scholar]
- 21. Zheng S, Jiang F, Ge D, et al. LncRNA SNHG3/miRNA‐151a‐3p/RAB22A axis regulates invasion and migration of osteosarcoma. Biomed Pharmacother. 2019;112:108695. [DOI] [PubMed] [Google Scholar]
- 22. Yang J, Liu Z, Liu B, Sun L. Silencing of circCYP51A1 represses cell progression and glycolysis by regulating miR‐490‐3p/KLF12 axis in osteosarcoma under hypoxia. J Bone Oncol. 2022;37:100455. [DOI] [PMC free article] [PubMed] [Google Scholar]
- 23. Ji T, Ma K, Chen L, Cao T. PADI1 contributes to EMT in PAAD by activating the ERK1/2‐p38 signaling pathway. J Gastrointest Oncol. 2021;12(3):1180‐1190. [DOI] [PMC free article] [PubMed] [Google Scholar]
- 24. Yang J, Peng S, Zhang K. LncRNA RP11‐499E18.1 inhibits proliferation, migration, and epithelial‐mesenchymal transition process of ovarian cancer cells by dissociating PAK2‐SOX2 interaction. Front cell. Dev Biol. 2021;9:697831. [DOI] [PMC free article] [PubMed] [Google Scholar]
- 25. Wang Y, Bao D, Wan L, Zhang C, Hui S, Guo H. Long non‐coding RNA small nucleolar RNA host gene 7 facilitates the proliferation, migration, and invasion of esophageal cancer cells by regulating microRNA‐625. J Gastrointest Oncol. 2021;12(2):423‐432. [DOI] [PMC free article] [PubMed] [Google Scholar]
- 26. Zheng S, Li M, Miao K, Xu H. lncRNA GAS5‐promoted apoptosis in triple‐negative breast cancer by targeting miR‐378a‐5p/SUFU signaling. J Cell Biochem. 2020;121(3):2225‐2235. [DOI] [PubMed] [Google Scholar]
- 27. Zhang Y, Yuan Y, Wu H, et al. Effect of verbascoside on apoptosis and metastasis in human oral squamous cell carcinoma. Int J Cancer. 2018;143(4):980‐991. [DOI] [PubMed] [Google Scholar]
- 28. Mirabello L, Troisi RJ, Savage SA. International osteosarcoma incidence patterns in children and adolescents, middle ages and elderly persons. Int J Cancer. 2009;125(1):229‐234. [DOI] [PMC free article] [PubMed] [Google Scholar]
- 29. Ritter J, Bielack SS. Osteosarcoma. Ann Oncol. 2010;21:vii320‐5. [DOI] [PubMed] [Google Scholar]
- 30. Javed Z, Ahmed Shah F, Rajabi S, et al. LncRNAs as potential therapeutic targets in thyroid cancer. Asian Pac J Cancer Prev. 2020;21(2):281‐287. [DOI] [PMC free article] [PubMed] [Google Scholar]
- 31. Hang Q, Lu J, Zuo L, Liu M. Linc00641 promotes the progression of gastric carcinoma by modulating the miR‐429/Notch‐1 axis. Aging. 2021;13(6):8497‐8509. [DOI] [PMC free article] [PubMed] [Google Scholar]
- 32. Ghafouri‐Fard S, Shirvani‐Farsani Z, Hussen BM, Taheri M. The critical roles of lncRNAs in the development of osteosarcoma. Biomed Pharmacother. 2021;135:111217. [DOI] [PubMed] [Google Scholar]
- 33. Dai S, Li N, Zhou M, et al. LncRNA EBLN3P promotes the progression of osteosarcoma through modifying the miR‐224‐5p/Rab10 signaling axis. Sci Rep. 2021;11(1):1992. [DOI] [PMC free article] [PubMed] [Google Scholar]
- 34. Guo W, Jiang H, Li H, et al. LncRNA‐SRA1 suppresses osteosarcoma cell proliferation while promoting cell apoptosis. Technol Cancer Res Treat. 2019;18:1533033819841438. [DOI] [PMC free article] [PubMed] [Google Scholar]
- 35. Zhao D, Wang S, Chu X, Han D. LncRNA HIF2PUT inhibited osteosarcoma stem cells proliferation, migration and invasion by regulating HIF2 expression. Artif Cells Nanomed Biotechnol. 2019;47(1):1342‐1348. [DOI] [PubMed] [Google Scholar]
- 36. Jiang S, Kong P, Liu X, Yuan C, Peng K, Liang Y. LncRNA FLVCR1‐AS1 accelerates osteosarcoma cells to proliferate, migrate and invade via activating wnt/β‐catenin pathway. J BUON. 2020;25(4):2078‐2085. [PubMed] [Google Scholar]
- 37. Ye X, Weinberg RA. Epithelial‐mesenchymal plasticity: a central regulator of cancer progression. Trends Cell Biol. 2015;25(11):675‐686. [DOI] [PMC free article] [PubMed] [Google Scholar]
- 38. Serrano‐Gomez SJ, Maziveyi M, Alahari SK. Regulation of epithelial‐mesenchymal transition through epigenetic and post‐translational modifications. Mol Cancer. 2016;15:18. [DOI] [PMC free article] [PubMed] [Google Scholar]
- 39. Tam WL, Weinberg RA. The epigenetics of epithelial‐mesenchymal plasticity in cancer. Nat Med. 2013;19(11):1438‐1449. [DOI] [PMC free article] [PubMed] [Google Scholar]
- 40. Sun Y, Hu L, Zheng H, et al. MiR‐506 inhibits multiple targets in the epithelial‐to‐mesenchymal transition network and is associated with good prognosis in epithelial ovarian cancer. J Pathol. 2015;235(1):25‐36. [DOI] [PMC free article] [PubMed] [Google Scholar]
- 41. Wang Y, Shi J, Chai K, Ying X, Zhou B. The role of snail in EMT and tumorigenesis. Curr Cancer Drug Targets. 2013;13(9):963‐972. [DOI] [PMC free article] [PubMed] [Google Scholar]
- 42. Miao W, Li N, Gu B, Yi G, Su Z, Cheng H. LncRNA DLGAP1‐AS2 modulates glioma development by up‐regulating YAP1 expression. J Biochem. 2020;167(4):411‐418. [DOI] [PubMed] [Google Scholar]
- 43. Lu J, Xu Y, Xie W, et al. Long noncoding RNA DLGAP1‐AS2 facilitates Wnt1 transcription through physically interacting with Six3 and drives the malignancy of gastric cancer. Cell Death Dis. 2021;7(1):255. [DOI] [PMC free article] [PubMed] [Google Scholar]
- 44. Shi Y, Zhang Y, Ran F, et al. Let‐7a‐5p inhibits triple‐negative breast tumor growth and metastasis through GLUT12‐mediated Warburg effect. Cancer Lett. 2020;495:53‐65. [DOI] [PubMed] [Google Scholar]
- 45. Ganapathy‐Kanniappan S. Molecular intricacies of aerobic glycolysis in cancer: current insights into the classic metabolic phenotype. Crit Rev Biochem Mol Biol. 2018;53(6):667‐682. [DOI] [PubMed] [Google Scholar]
- 46. Li X, Zhang Z, Zhang Y, Cao Y, Wei H, Wu Z. Upregulation of lactate‐inducible snail protein suppresses oncogene‐mediated senescence through p16(INK4a) inactivation. J Exp Clin Cancer Res. 2018;37(1):39. [DOI] [PMC free article] [PubMed] [Google Scholar]
- 47. Mathupala SP, Ko YH, Pedersen PL. Hexokinase II: cancer's double‐edged sword acting as both facilitator and gatekeeper of malignancy when bound to mitochondria. Oncogene. 2006;25(34):4777‐4786. [DOI] [PMC free article] [PubMed] [Google Scholar]
- 48. Garcia SN, Guedes RC, Marques MM. Unlocking the potential of HK2 in cancer metabolism and therapeutics. Curr Med Chem. 2019;26(41):7285‐7322. [DOI] [PubMed] [Google Scholar]
- 49. Han X, Ren C, Lu C, Qiao P, Yang T, Yu Z. Deubiquitination of MYC by OTUB1 contributes to HK2 mediated glycolysis and breast tumorigenesis. Cell Death Differ. 2022;29(9):1864‐1873. [DOI] [PMC free article] [PubMed] [Google Scholar]
- 50. Song J, Wu X, Liu F, et al. Long non‐coding RNA PVT1 promotes glycolysis and tumor progression by regulating miR‐497/HK2 axis in osteosarcoma. Biochem Biophys Res Commun. 2017;490(2):217‐224. [DOI] [PubMed] [Google Scholar]
- 51. Zhuo B, Li Y, Li Z, et al. PI3K/Akt signaling mediated Hexokinase‐2 expression inhibits cell apoptosis and promotes tumor growth in pediatric osteosarcoma. Biochem Biophys Res Commun. 2015;464(2):401‐406. [DOI] [PubMed] [Google Scholar]
- 52. D'Angelo B, Benedetti E, Cimini A, et al. MicroRNAs: a puzzling tool in cancer diagnostics and therapy. Anticancer Res. 2016;36(11):5571‐5575. [DOI] [PubMed] [Google Scholar]
- 53. Yu M, Lu W, Cao Z, et al. LncRNA LINC00662 exerts an oncogenic effect on osteosarcoma by the miR‐16‐5p/ITPR1 Axis. J Oncol. 2021;2021:8493431. [DOI] [PMC free article] [PubMed] [Google Scholar]
- 54. Li Y, Liu JJ, Zhou JH, Chen R, Cen CQ. LncRNA HULC induces the progression of osteosarcoma by regulating the miR‐372‐3p/HMGB1 signalling axis. Mol Med. 2020;26(1):26. [DOI] [PMC free article] [PubMed] [Google Scholar]
- 55. Shen YY, Cui JY, Yuan J, Wang X. MiR‐451a suppressed cell migration and invasion in non‐small cell lung cancer through targeting ATF2. Eur Rev Med Pharmacol Sci. 2018;22(17):5554‐5561. [DOI] [PubMed] [Google Scholar]
- 56. Liu Y, Yang HZ, Jiang YJ, Xu LQ. miR‐451a is downregulated and targets PSMB8 in prostate cancer. Kaohsiung J Med Sci. 2020;36(7):494‐500. [DOI] [PubMed] [Google Scholar]
- 57. Cao D, Ge S, Li M. MiR‐451a promotes cell growth, migration and EMT in osteosarcoma by regulating YTHDC1‐mediated m6A methylation to activate the AKT/mTOR signaling pathway. J Bone Oncol. 2022;33:100412. [DOI] [PMC free article] [PubMed] [Google Scholar]
Associated Data
This section collects any data citations, data availability statements, or supplementary materials included in this article.
Supplementary Materials
Figures S1–S3.
Data Availability Statement
The datasets used or analyzed during the current study are available from the corresponding author upon reasonable request.


