Abstract
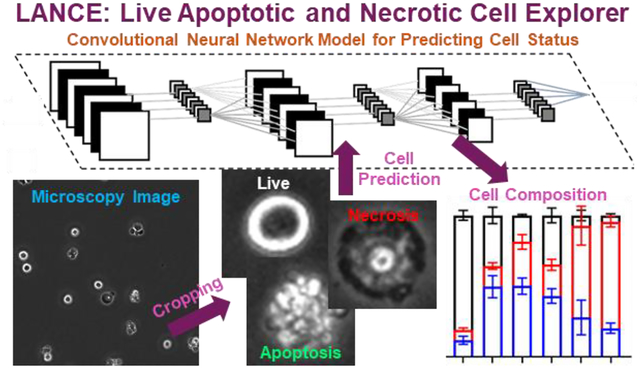
Identifying and quantifying cell death is the basis for all cell death research. Current methods for obtaining these quantitative measurements rely on established biomarkers, yet the marker-based approach suffers from limited marker specificity, high cost of reagents, lengthy sample preparation and fluorescence imaging. Based on the morphological difference, we developed a Live, Apoptotic, and Necrotic Cell Explorer (LANCE) to categorize cell death status in a label-free manner, by incorporating machine learning and image processing. The LANCE workflow includes cropping individual cells from microscopic images having hundreds of cells, formation of an image database of around 5,000 events, training and validation of the convolutional neural network models using multiple cell lines and treatment conditions. With LANCE, we precisely categorized live, apoptotic, and necrotic cells with a high accuracy of 96.3±0.5%. More importantly, the non-destructive label-free LANCE method allows for tracking time dynamics of the cell death process, which enhances the understanding of subtle cell death regulation at molecular level. Hence, LANCE is a fast, low-cost, and non-destructive label-free method to distinguish cell status, which can be applied to cell death studies as well as many other biomedical applications.
Keywords: Cell Death, Label-Free, Machine Learning, Convolutional Neural Network, Apoptosis, Necrosis
Graphical Abstract
INTRODUCTION
After decades of cell death study, it is now well accepted that cell death can be highly programmed, including apoptosis and several forms of necrosis1. Decoding the cell death pathway has led us to successfully induce, block, and/or predict cell death during embryonic development and many other physiological conditions. Moreover, the fundamental biological roles of cell death in diseases have also been established. Now we have a menu of drugs specifically targeting cell death machinery (e.g., anti-leukemia drug Navitoclax and Venetoclax) in treating different pathological conditions2. There are currently numerous on-going efforts to develop and validate new cell death regulating compounds, so the need to distinguish cell death status continues increasing over time.
To distinguish different types of cell death, cellular morphology is the most straightforward standard. Conventionally, cell death is divided into two subtypes, apoptotic and necrotic cell death3. For apoptosis, dying/dead cells preserve the plasma membrane (PM) integrity, featuring PM blebbing, cell shrinkage, and nuclear fragmentation. As compared to non-lytic apoptosis, the markers for necrosis include cell lysis, PM breakdown and cell swell. This morphological difference can be distinguished by experienced researchers, under brightfield microscopy. However, visual evaluations can be subjective and slow when quantitatively counting hundreds or thousands of cells. Biomarkers were also established to quantify cell death. For example, cell membrane-impermeant nucleic acid stains, such as Propidium Iodide (PI) or SYTOX dyes, can distinguish two forms of cell death, as only necrotic cells can uptake those dyes due to the PM integrity loss. Note that although Annexin V is usually for apoptotic cell labeling4, it is now known that necroptotic (a specific form of programmed necrosis, mediated by phosphorylated mixed lineage kinase domain like pseudokinase (MLKL)) cells also exhibit phosphatidylserine for Annexin V labeling prior to cell lysis5, similar to apoptosis. Thus, Annexin V staining is not a specific marker for apoptosis.
In addition to the potential issue of marker specificity, marker-based approach to distinguish Live, Apoptotic, and Necrotic cells will likely occupy 2 fluorescent channels in the visible light spectrum. As illustrated in Fig. S1, blue channel and far-red channel were occupied. With label-free cell death recognition based on brightfield microscopy, more proteins of interest can be quantified by fluorescent labels in one experiment. Furthermore, as compared to brightfield microscopy, the exposure time of fluorescence microscopy is 10–100 times longer. While the difference might not be noticeable when taking only a few images, the fluorescence microscopy experiments will be significantly lengthier when imaging hundreds or thousands of images for drug screening. A fast brightfield measurement is especially helpful for monitoring rapid changes of cell status and alleviates the phototoxicity and photobleaching effects of fluorescence microscopy. The limitations in marker-based fluorescence approaches highlights the need to develop a fast and easy-to-use label-free cell morphology distinguisher.
The recent advancement in machine learning opens avenues for image classification and automatic recognition in high throughput. Among machine learning strategies, the convolutional neural network (CNN) is especially good at image classification6. Inspired by the functionality of human neurons and synapses, CNN is composed of convolutional and pooling filters and connections between filters. Its multi-layer structure recognizes both local and global features to mimic the judgement of a human observer for classification of images7,8. Prior work has used machine learning approaches to quantify cell viability by transmitted light microscopy6,9,10. This process is effective, but complicated by the need for multiple programs each differing in complexity from unsupervised machine learning to convolutional neural networks in deep learning. Consequently, this process can differentiate between viable live cells and presumed dead cells, yet no effort is made to distinguish the different forms of cell death (e.g., apoptosis versus necrosis). Similar tools have been developed using machine learning on transmitted light microscopy images with the purpose of determining cell death as it occurs solely by morphological changes6. The significance of this work lies in the idea of a single neural network being capable of cell death classification at high accuracies from digital images. Despite a high accuracy around 98.7%, this method is equally limited in that it cannot distinguish types of cell death. There are also several manners of label-free approaches to identify traits of programmed cell death without machine learning such as ultrasound imaging, dynamic light scattering, Raman scattering, Optical coherence tomography (OCT), and endogenous fluorescence imaging11,12. These methods lack a built-in method to quickly count the cell types they aim to identify. Similar to labeled methods such as the Annexin V/PI assay13, some of these methods resort to using flow cytometry to count desired cells14. Flow cytometry analyzes the light scatter of cells in the forward or side direction using multiple lasers. This, along with the analysis of excitation of desired fluorophores, provides a quantitative measure of a given trait15. This requires extensive equipment and additional reagents which increase the cost and time of experimentation. Methods that do not employ flow cytometry rely on visual estimations of large areas containing potentially hundreds of cells following visualization16, ensuring that a true quantitative measure cannot be reached.
Herein, we report the first label-free identification methods that can distinguish not only live versus dead cells, but also apoptosis versus necrosis. We trained and tested the model using a variety of cell lines and precisely recognized live, necrotic, and apoptotic cells across various experimental circumstances. We named this model as “Live, Apoptotic, and Necrotic Cells Explorer (LANCE)”. The label-free LANCE is simple, fast, and allowing incorporating more proteins of interest to be studied in one experiment. More importantly, with the help of LANCE, we successfully monitored the cell death process over time in a label-free manner. By doing so, we successfully verified the function of cell death executor molecule Gasdermin E (GSDME, also known as DFNA5). The LANCE method represents a paradigm shift of cell death studies from a label-based measure to a label-free manner, ultimately expediting and enhancing the discovery in cell death.
MATERIALS AND METHODS:
Cell culture and induction of cell death
NIH3T3 cells and their derivatives, iMacs (murine immortalized macrophages) were maintained at 37°C, 5% v/v CO2 in a humidified incubator in DMEM (GIBCO) supplemented with 10% FBS, 2 mM L-glutamine (GIBCO), 200 U/mL penicillin-–streptomycin (GIBCO) and 50 μg/mL Plasmocin (Invivogen). U937 and Jurkat cells were maintained similarly except in RPMI1640 media (GIBCO). iMacs were originally generated from Dr. Doug Green Lab (St Jude Children’s Research Hospital).
To induce apoptosis, NIH3T3 cells were stably retrovirally transfected a caspase 9 fused to FKBP (Fv) domain, which responds to rapamycin dimerizer B/B (AP20187, Takara) and gets activated by dimerization17. Most cells underwent apoptosis after 50–100 nM B/B treatment for 3–4 hours. To induce necrosis (pyroptosis), NIH3T3 cells were stably transfected a caspase 9 fused to FKBP (Fv) domain plus full-length GSDME. Same as above, 50–100 nM B/B treatment for 3–4 hours was sufficient to kill a majority of cells by necrosis (pyroptosis). For Jurkat cells, apoptosis was induced by 20 ng/mL TNF-α + 20 μg/mL cycloheximide for 6 hours (TNF+CHX); necrosis (necroptosis) was induced by 20 ng/mL TNF-α + 20 μg/mL cycloheximide + 100 μM zVAD-fmk for 6 hours (TCZ). For U937 cells, apoptosis was induced by 150 mJ/cm2 UV exposure. To induce necrosis (pyroptosis), U937 cells were stably retrovirally transfected with full length GSDME (U937-GE) then exposed to 150 mJ/cm2 UV. For iMacs cells, apoptosis was induced by 20 ng/mL TNF-α (peprotech) + 20 μg/mL cycloheximide (TNF+CHX); necrosis (pyroptosis) was induced by 2 μg/mL LPS (Sigma) + 500 nM 5–7-oxo-zeaenol (CalbioChem) for 3 hours. For cell death molecular probing, cells were stained with either Annexin-V-Alexa Fluor™ 647 (Thermo Fisher, 1:200) or TO-PRO3 (Thermo Fisher, 1:10,000). Cells were analyzed 5 minutes after staining.
Western blot
Cells were lysed with loading buffer (50 mM Tris pH=6.8, 2% SDS and 10% glycerol) and denatured by boiling. Protein concentration was then determined by the BCA assay (Thermo Fisher) and systematically normalized before SDS-PAGE. Following the transfer of proteins to nitrocellulose (Thermo Fisher), immunodetection was performed using the indicated primary and peroxidase-coupled secondary antibodies. Proteins were visualized by enhanced chemiluminescence (ECL, Thermo Fisher). Antibodies used include anti-Actin (Santa Cruz; sc-1616; RRID: AB_630836) and anti-GSDME (Abcam; ab216191; RRID: AB_2737000).
Image acquisition
The samples of live and program death cells were imaged using an inverted microscope (Ti2E, Nikon). The brightfield and fluorescence images were taken with a 10x objective lens and a monochrome CMOS camera (ORCA-Fusion Gen-III SCMOS Camera, Hamamatsu). A DAPI filter set was used for the fluorescence imaging of Hoechst nucleus staining. Brightfield imaging and the fluorescence imaging were performed using an exposure time shorter than 100 ms to minimize the phototoxic effect on cells. Auto focusing was performed to ensure the image remained in focus throughout the imaging experiments. To test the images collected by another imaging environment, we also used a Lionheart FX automated microscope with the software of Gen 5.
Image processing for object recognition
The goal of processing these microscope images (1.5 mm by 1.5 mm) was to yield individual cells from larger microscope images that could be easily recognized by a convolutional neural network. To obtain these individual cell images, a MATLAB (2021b) program was developed to transform the microscope images18. The images were first processed by contrast adjustment, and adaptive filtering through a 5-pixel by 5-pixel window (Fig. 1a–c). These steps prime the full image for recognition of objects. The objects exactly sitting on the border of images were eliminated. Then, we (1) binarized the images, (2) filled enclosed regions, and (3) removed small objects (smaller than 150 pixels) which are likely to be debris (Fig. 1d,e). In this manner, the program could crop objects based on the estimated centroids of enclosed regions (Fig. 1f–h). Individual objects were then cropped to 40-pixel by 40-pixel (26 μm by 26 μm) images centered around the calculated centroid and saved. This process was used for all microscope images in this work.
Fig. 1. Cell cropping process from a microscopy image.
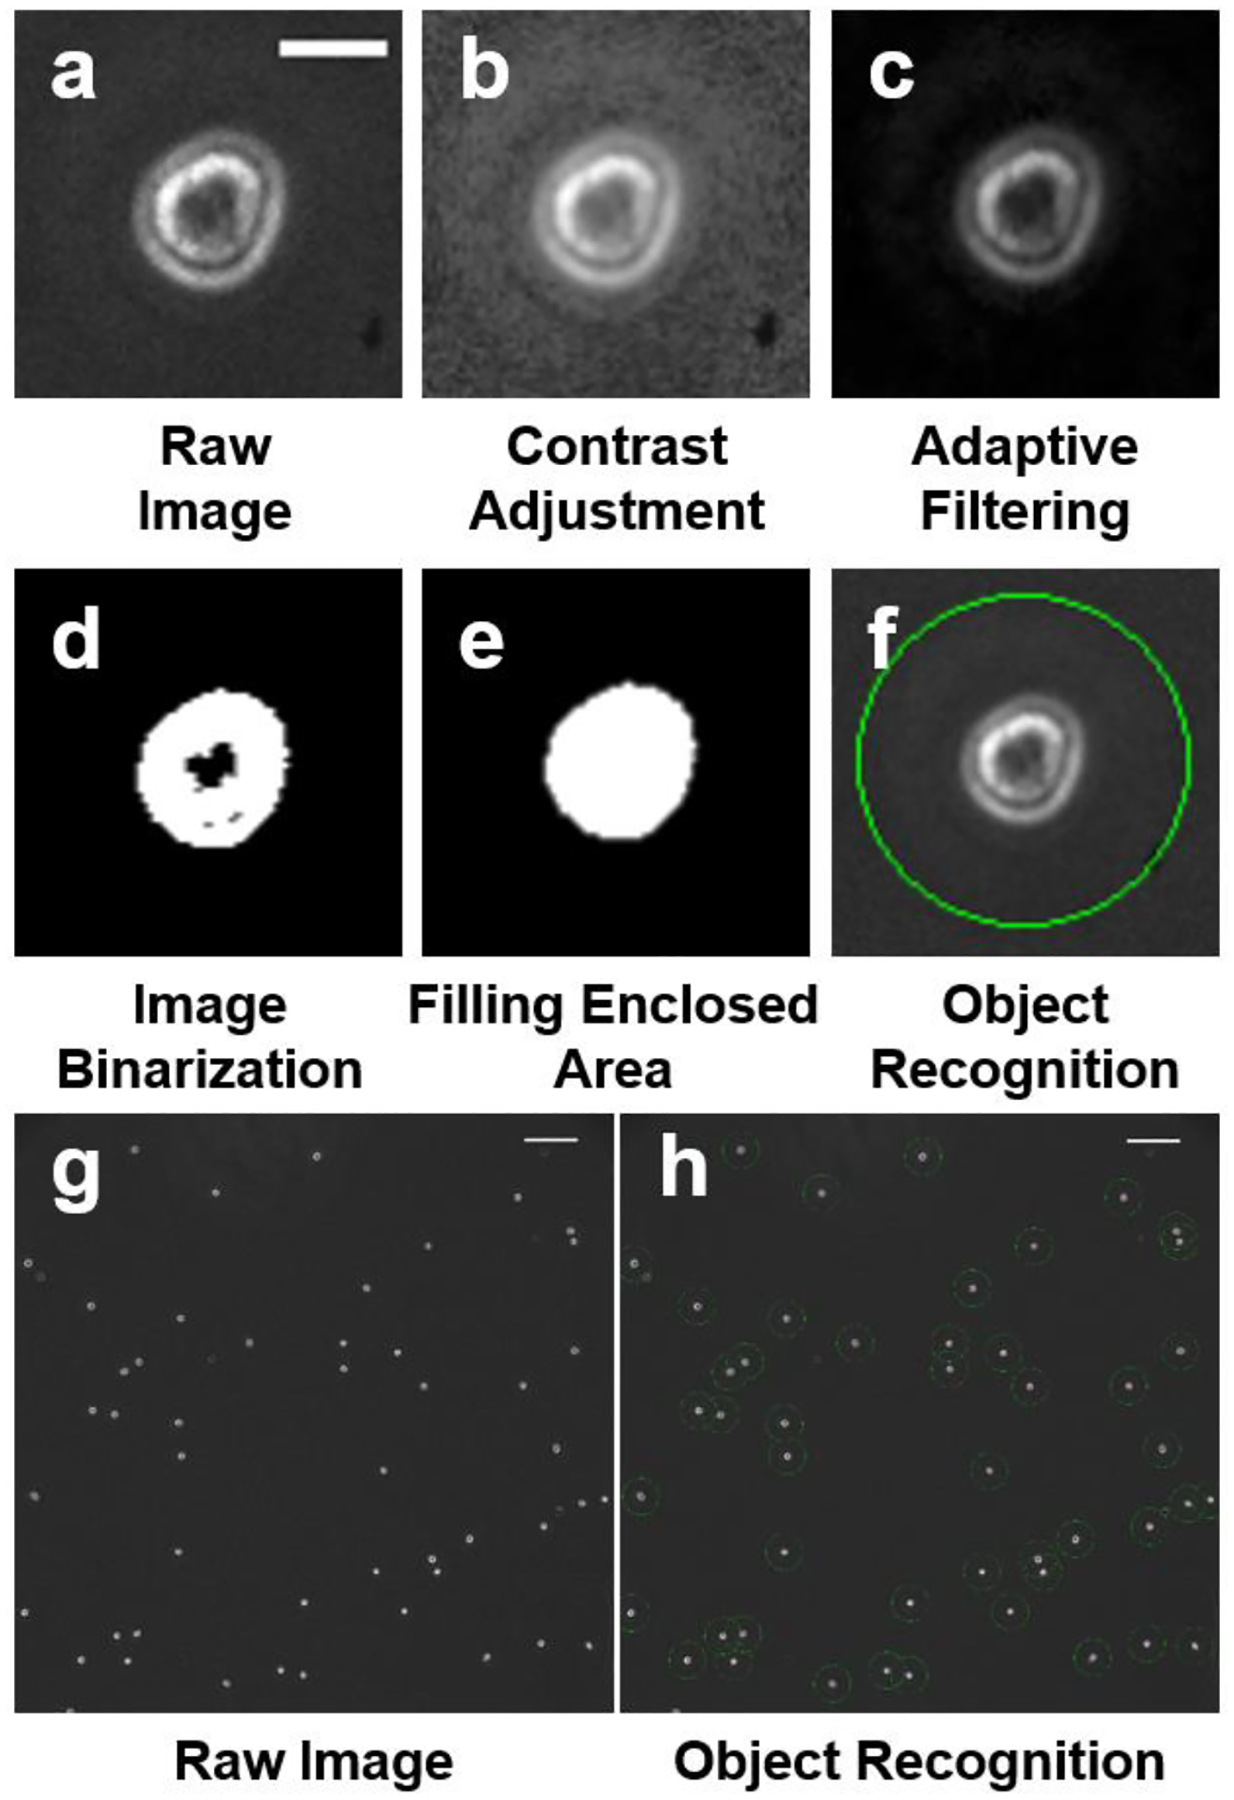
(a-f) Image processing and cropping of a single cell. (a) Unaltered raw image. (Scale bar: 13 μm). (b) Contrast adjustment for improving binarization. (c) Adaptive filtering through a 5 pixel by 5-pixel window. (d) Image binarization by a threshold. (e) Filling of an enclosed area. Areas smaller than 150 pixels were eliminated. (f) Cell cropping based on the calculated centroid. Processed images were cropped into 40×40 pixel images, (g) A raw microscopy image (scale bar: 130 μm). (h) A processed image showing all objects were successfully recognized as marked. (Scale bar: 130 μm).
Generation of a database of representative images
Representative images of ‘Live,’ ‘Apoptosis,’ ‘Necrosis,’ ‘Debris,’ and ‘Multiple’ cases were selected based on visual judgement and molecular markers to form a library for training the CNN model (Fig. S1). ‘Live’ cells were defined by their clear boundary and sharp contrast. The morphology of ‘Apoptosis’ and ‘Necrosis’ was defined based on literature.3 ‘Debris’ category includes small cell debris, and ‘Multiple’ category consists of doublets, triplets, and other cases having multiple cells in an image. Totally, the database has 1,454 images of ‘Live’ cells, 958 images of ‘Apoptosis’ cells, 984 images of ‘Necrosis’ cells, 996 images of ‘Debris,’ and 753 images of ‘Multiple.’
Architecture of convolutional neural networks
The CNNs tested (Fig. 2a, S2) combine convolutional layers for extracting features, batch normalization layers to standardize the inputs for faster training, and rectifier function layers with a convolution size of [3 3], and the number of filters ranges from 64 to 128. The rectifier function layer (ReLU) increases the non-linearity of the identified features by removing negative values from the inputs7,8. Max pooling layers were also utilized to get the maximum of a 2 × 2 rectangle from the image with a stride size of 2. The networks finally conclude with a fully connected layer and a SoftMax layer.
Fig. 2. LANCE prediction of cell status by a convolutional neural network (CNN).
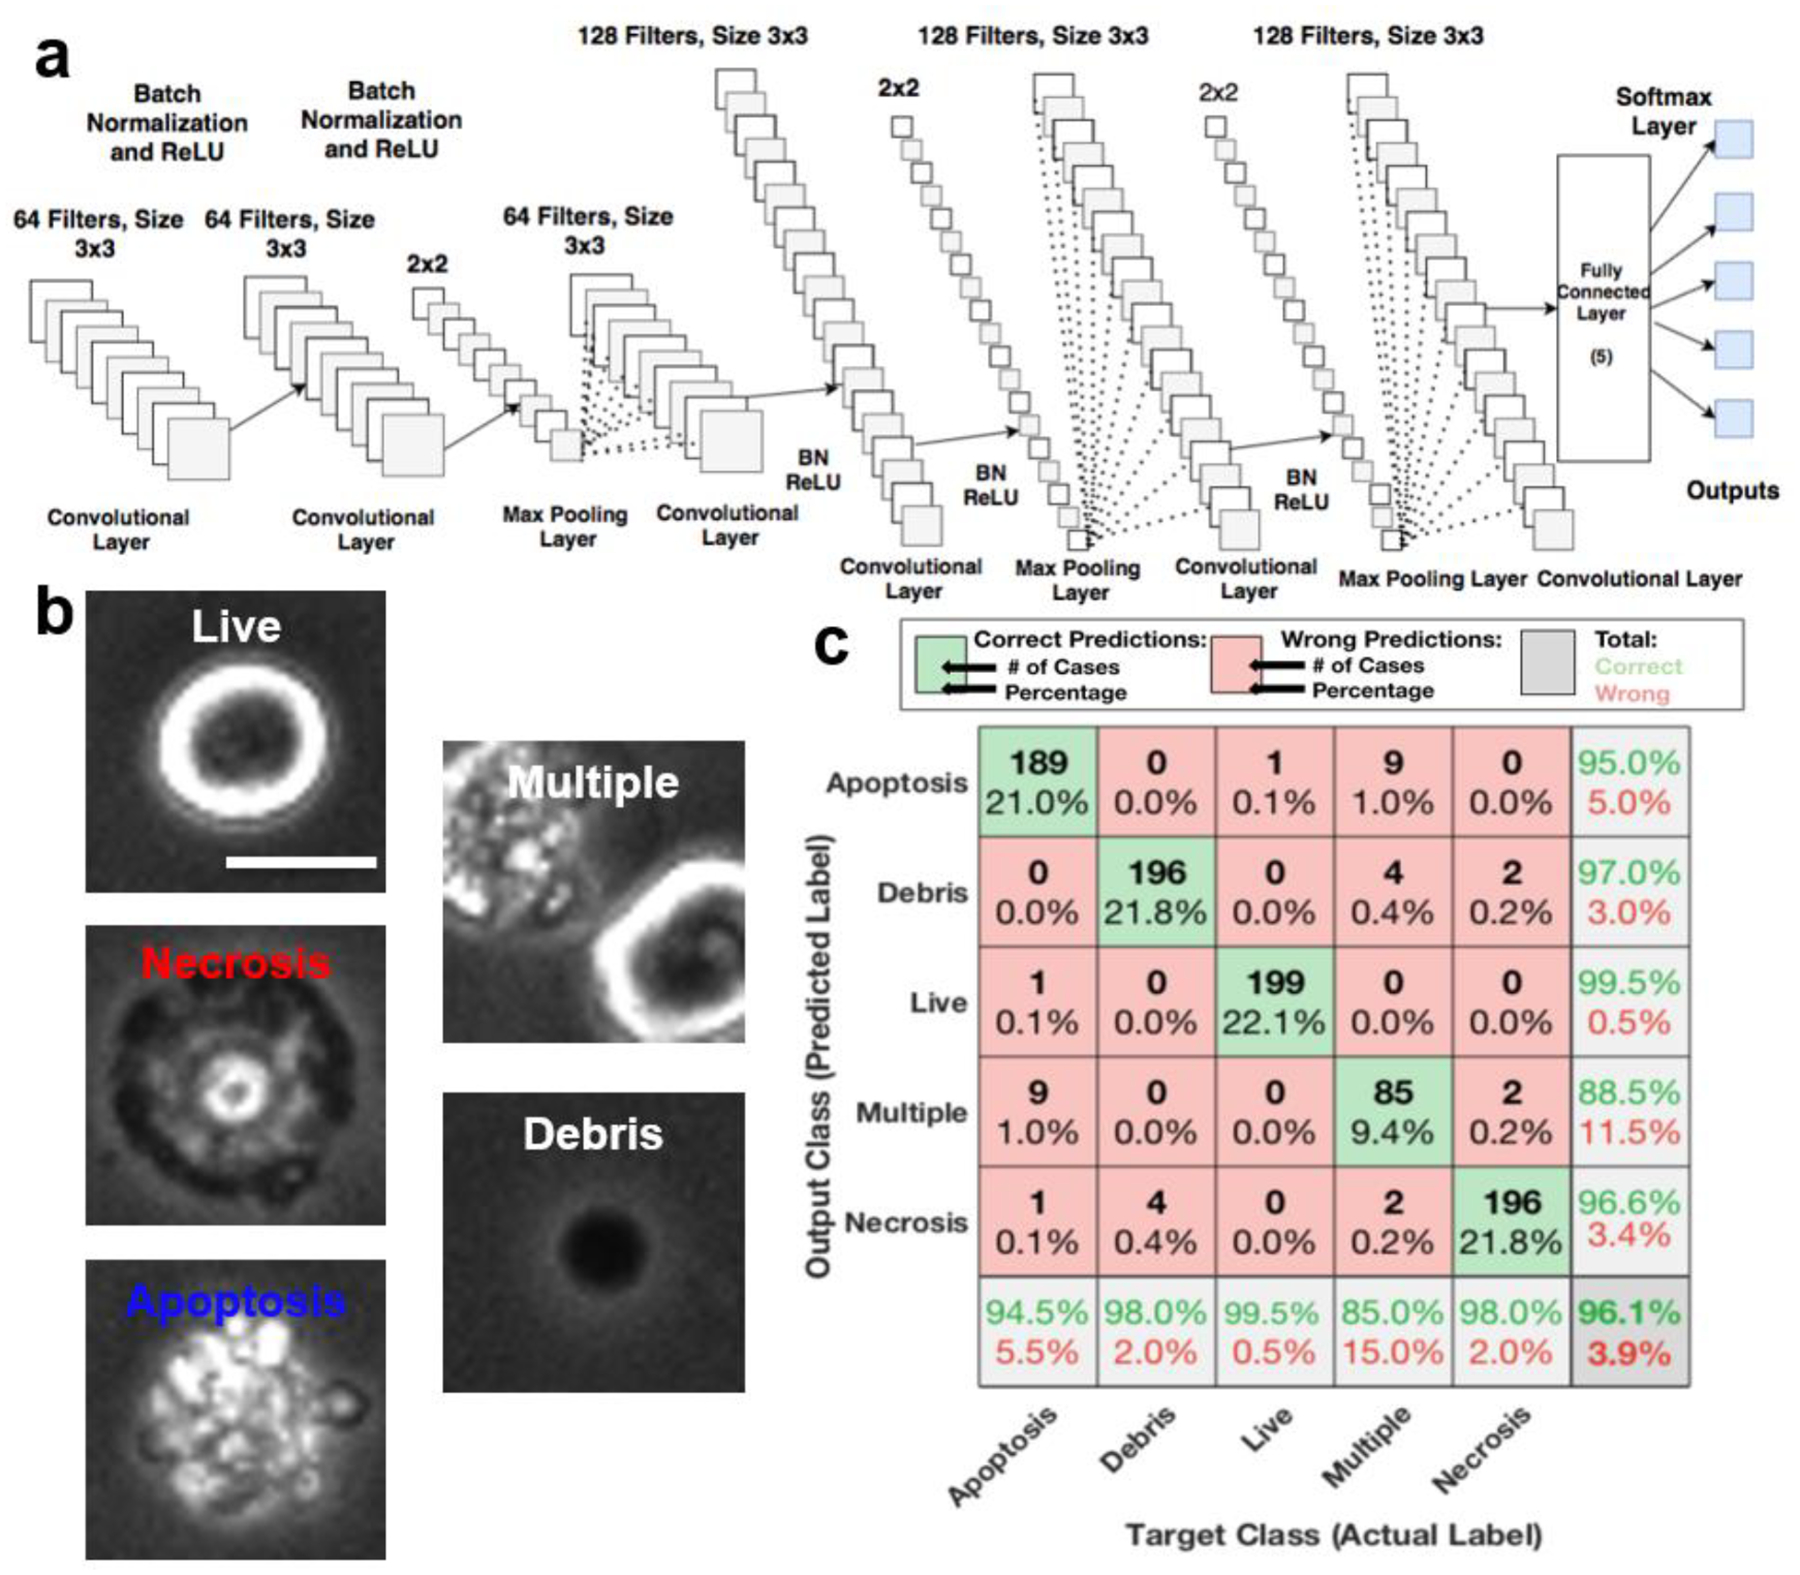
(a) CNN structure characterized by six convolutional layers. (b) Representative images of cell categories (‘Live,’ ‘Apoptosis,’ ‘Necrosis,’ ‘Debris,’ and ‘Multiple’) used in training and prediction (scale bar: 10 μm). (c) Confusion matrix of predicting testing dataset using LANCE demonstrates a high accuracy of 96.1%.
Training and validation of convolutional neural networks
Utilizing the MATLAB 2021b deep learning toolbox, we trained a CNN to classify cell images into the established 5 categories (‘Live,’ ‘Apoptosis,’ ‘Necrosis,’ ‘Debris,’ and ‘Multiple’). Following common practice in machine learning, 80% of the data was randomly selected for training, (training dataset) while the other 20% was used for examining the accuracy of the trained model (independent test dataset). Specific options were employed using parameters specified by the MATLAB training options function for similar deep learning neural networks. The Adaptive Moment Estimation (Adam) optimization algorithm was selected as the mode of training, with an initial learn rate of 0.01, 10 times the default rate of the Adam optimizer. The network was framed to have a maximum epoch, or number of full passes through the entire data set, of 100 with a validation frequency of 50. With each pass of the epoch, the training data set is fully shuffled. At every 10 epochs, the learn rate was set to drop in a piecewise manner. L2 regularization, or weight decay, was set at 0.005. The training was set to stop after 10 instances of the loss incurred exceeding the previous smallest loss, or when the maximum number of epochs were reached, whichever occurred first. The training process was visualized by ‘Verbose,’ as an indicator to display information, where the training progress was plotted in the default form. The visualized training was split into subsets for better visualization of progress as it occurred, at 128 images. The prediction accuracy and sensitivity are determined by the independent test dataset using the following formula.
All identified objects (Fig. 1) were classified using the trained CNN model. The objects classified as “Debris” and “Multiple” were excluded from the analysis, and the percentage of “Live,” “Apoptosis,” and “Necrosis” events were calculated.
RESULTS and DISCUSSION
Object recognition and image cropping
Image processing has two main goals, (1) to count the number of objects in a microscopy image and (2) to correctly classify them into the defined categories. As such, the methods previously described can be broken down into two quantifiable measures of accuracy: the percentage of correctly identified objects counted during image cropping, and the percentage of correct test data predictions ultimately yielded by the CNN. To perform the first task, we processed the images to identify cells and measure their centroids for cropping. In addition, the small objects, such as debris were eliminated. As illustrated in Fig. 1, the presented method successfully captured most objects. To quantitatively evaluate the accuracy, the process was verified by comparing machine and manual counting. The computer-aided object recognition held a high accuracy of 95.8%±1.2% over microscope images containing approximately 150 objects each. The accuracy is comparable with the prior methods with errors of 4–7%19,20. The error varied between false negatives where true objects were not detected, and false positives where a non-existent object was counted. False positives, comprising primarily of small debris, made up 72.2% of error counts. While this is not desirable, most false positive cases are ultimately classified as debris by LANCE and excluded. The remaining false negatives, which incorrectly ignore cellular objects, only account for 1% of all events. The quantitative measurement supports the reliability and accuracy of the presented cropping method.
Distinguishing live cell and programmed cell death with LANCE
Using the cell cropping program, we constructed a database of around 5,000 cell images by two commonly used mammalian cell lines NIH3T3 (mouse fibroblast) and U937 (human monocyte). Two different cell lines were used to generate a more general morphological model. Images were collected from healthy control cells as well as cells that were treated to induce programmed cell death of apoptosis and necrosis. Using the database composed of “Apoptosis,” “Live,” “Necrosis,” “Debris,” and “Multiple” events (Fig. 2b), we trained a CNN model to predict cell categories by their morphology. As shown in the confusion matrix (Fig. 2c), the trained LANCE model has an overall accuracy of 96.1% with individual recognition sensitivity of 94.5%, 99.5%, and 98.0% for apoptotic, live, and necrotic cells, respectively. Additionally, LANCE successfully detected 98.0% of debris and 85.0% of doublets. While the accuracy of detecting doublet cells is relatively lower, the absolute percentage of doublet-cell events is low of all predicted events. Thus, it would not significantly affect the results. Both debris and doublet cells were excluded from the analysis as in conventional flow cytometry assays. We trained the model 5 times using different training datasets and got a similar accuracy of 96.3±0.5% (mean ± S.D., n=5). It takes approximately 5 minutes to train the network using a single GPU (NVIDIA Quadro RTX 4000 8GB) or 50 minutes using a single CPU (2.2 GHz Intel Core i7). Once the CNN model is trained, the computer can determine the cell status of 100–1000 images per second. The variations in available computational power did not affect the accuracy of LANCE prediction.
Given some variations introduced by the random selection of images in the training process, the consistent accuracies suggest that the trained model was similar regardless of which images were randomly chosen for training or testing. Though the exact machine learning process is a black box, the convergence of training can be visualized through the generated training process plot. (Fig. S3) To further examine the causes of mis-predictions, we manually visualized all incorrect cases to understand what features correspond to what learned outcomes. Some of these features are obvious to the human eye and can be correctly sorted, such as a standard live cell with a complete nucleus and round shape. A majority of mis-predictions seemingly stemmed from test images that displayed traits of multiple cell types. (Fig. S4) Early-stage apoptosis images were occasionally sorted as live cells if the blebbing was not noticeable enough (Fig. S4a). While adding more early-stage apoptosis images to the representative apoptotic database rescued these mis-predictions, a few unconventional live cells that did not have a perfectly rounded shape began to mis-predict as apoptotic instead (Fig. S4b). The dilemma forbids us from further boosting the accuracy by optimizing the training database. In addition to the slightly deformed live cells, there was also a noticeable presence of unhealthy live cells with weak contrast (Fig. S4c). For the most part, problems stemming from the shape led more to apoptotic predictions, while problems with the contrast led themselves towards necrotic predictions. Necrotic cells were recognized by their low-contrast and dark morphology compared to other objects. Thus, relatively dark or low-contrast objects were likely predicted as necrotic, though this occurrence was rare. Additional problems came to light regarding the features specific to necrotic cells. Certain late-stage necrotic cells appeared similar to debris (Fig. S4d), and if predicted as such, would be removed from the final data. Imaging conditions (e.g., focus, contrast, and exposure time) that are not relevant to cell morphology can also greatly alter the prediction outcomes, so it is essential to maintain accurate focusing and consistent imaging conditions throughout experiments.
Optimization of the convolutional neural network models
While we attained good results using a 6-Layer, 3X3 Filter CNN model, additional test was performed for further optimization, by comparing three other network structures to determine whether the accuracy could be improved by altering either the filter size or the number of convolutional layers. A 3-Layer, 3X3 Filter, a 6-Layer, 5X5 Filter, and a 9-Layer, 3X3 Filter models were tested. As illustrated in Fig. 3, S2 and Table S1, the results suggest that the reduction of convolutional layers significantly deteriorated the prediction accuracy. However, adding more convolutional layers or enlarging the filter size would not significantly improve the accuracy. The results suggest that the selected 6-Layer, 3X3 Filter model, is suitable for LANCE, Further complication would only increase computation times but not improve accuracy.
Fig. 3. Comparison between four different network structures.
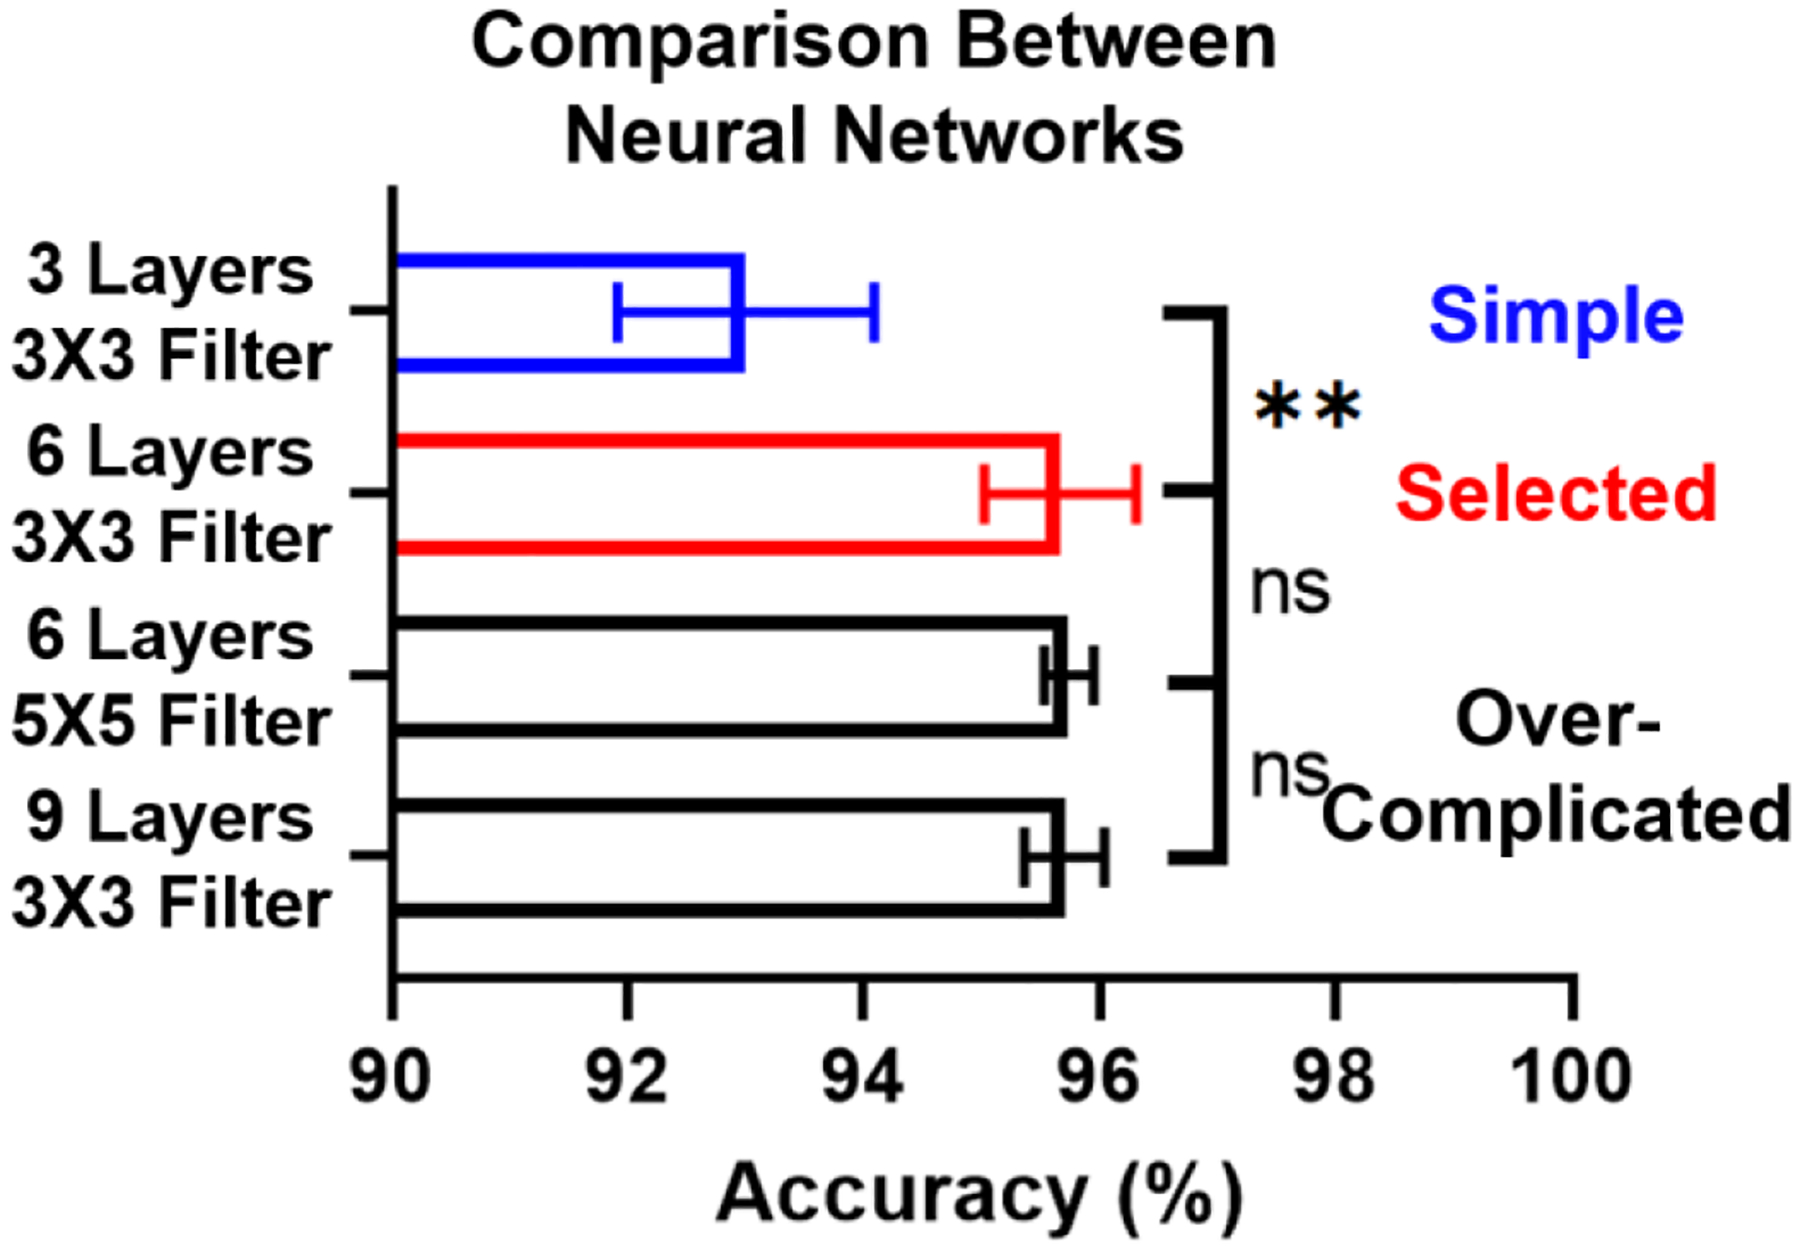
Error bar represents the standard deviation of 5 independent trials.
Validation of LANCE by different imaging environments and cell lines
To test whether the LANCE model can be used to analyze images collected in other labs with different imaging environments, we performed a side-by-side experiment to image the same samples by two imaging setups: Setup 1 (Microscope: Nikon Ti2E, Camera: Hamamatsu ORCA-Fusion Gen-III SCMOS, Objective lens: 10X) and Setup 2 (Microscope and Camera: BioTek Lionheart FX automated digital microscopy, Objective lens: 20X). As the types of microscopes, objective lens, and camera are all different, the imaging environments are distinct for testing the transferability of the LANCE model. To compensate different magnifications, the collected images were re-sized before analysis. The LANCE model was trained solely by images collected from the Setup 1. As illustrated in the Fig. 4, we got consistent cell status for images collected from two setups. The experiments clearly demonstrate the transferability of the presented method.
Fig. 4. Comparison between images taken by different microscopes.
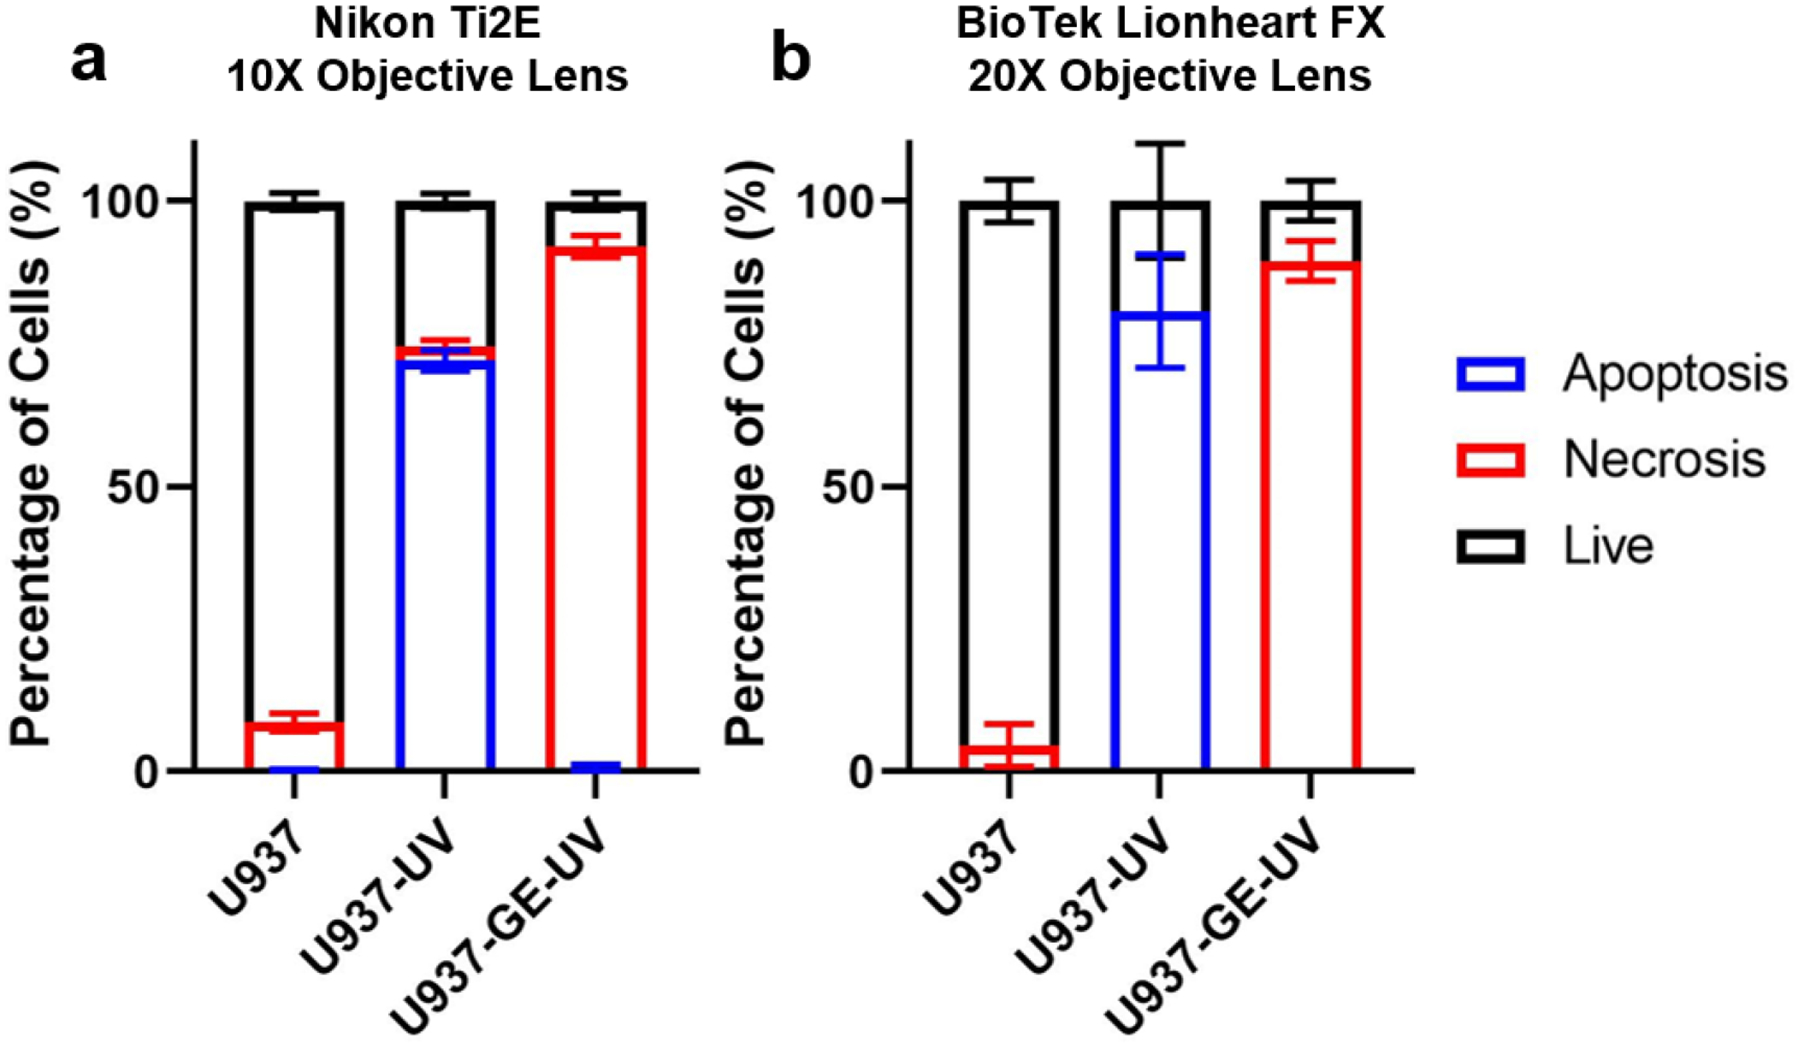
The length of bars represents the percentage of cell subsets. Error bar represents the standard deviation (N = 4 for Nikon Ti2E, and N = 5 for BioTek Lionheart FX).
In addition, we further tested the LANCE model using iMacs (murine immortalized macrophages) and Jurkat (human T lymphocytes) cell lines, which did not appear in the database. For iMacs cells, apoptosis was induced by TNF-α + cycloheximide (TNF+CHX); necrosis (pyroptosis) was induced by LPS + 5–7-oxo-zeaenol (LPS+OXO). For Jurkat cells TNF+CHX was used to induce apoptosis, and TNF + CHX + zVAD-fmk (TCZ) was used to induce necrosis.21–24. The cell status under treatments predicted by LANCE matched with the visual observations and expected inducing directions (Fig. 5). The successful demonstration using two new cell lines that were not in the training dataset supports the genericity of the LANCE model for widely applying to cell death studies.
Fig. 5. Prediction of the status of iMACs and Jurkat cells.
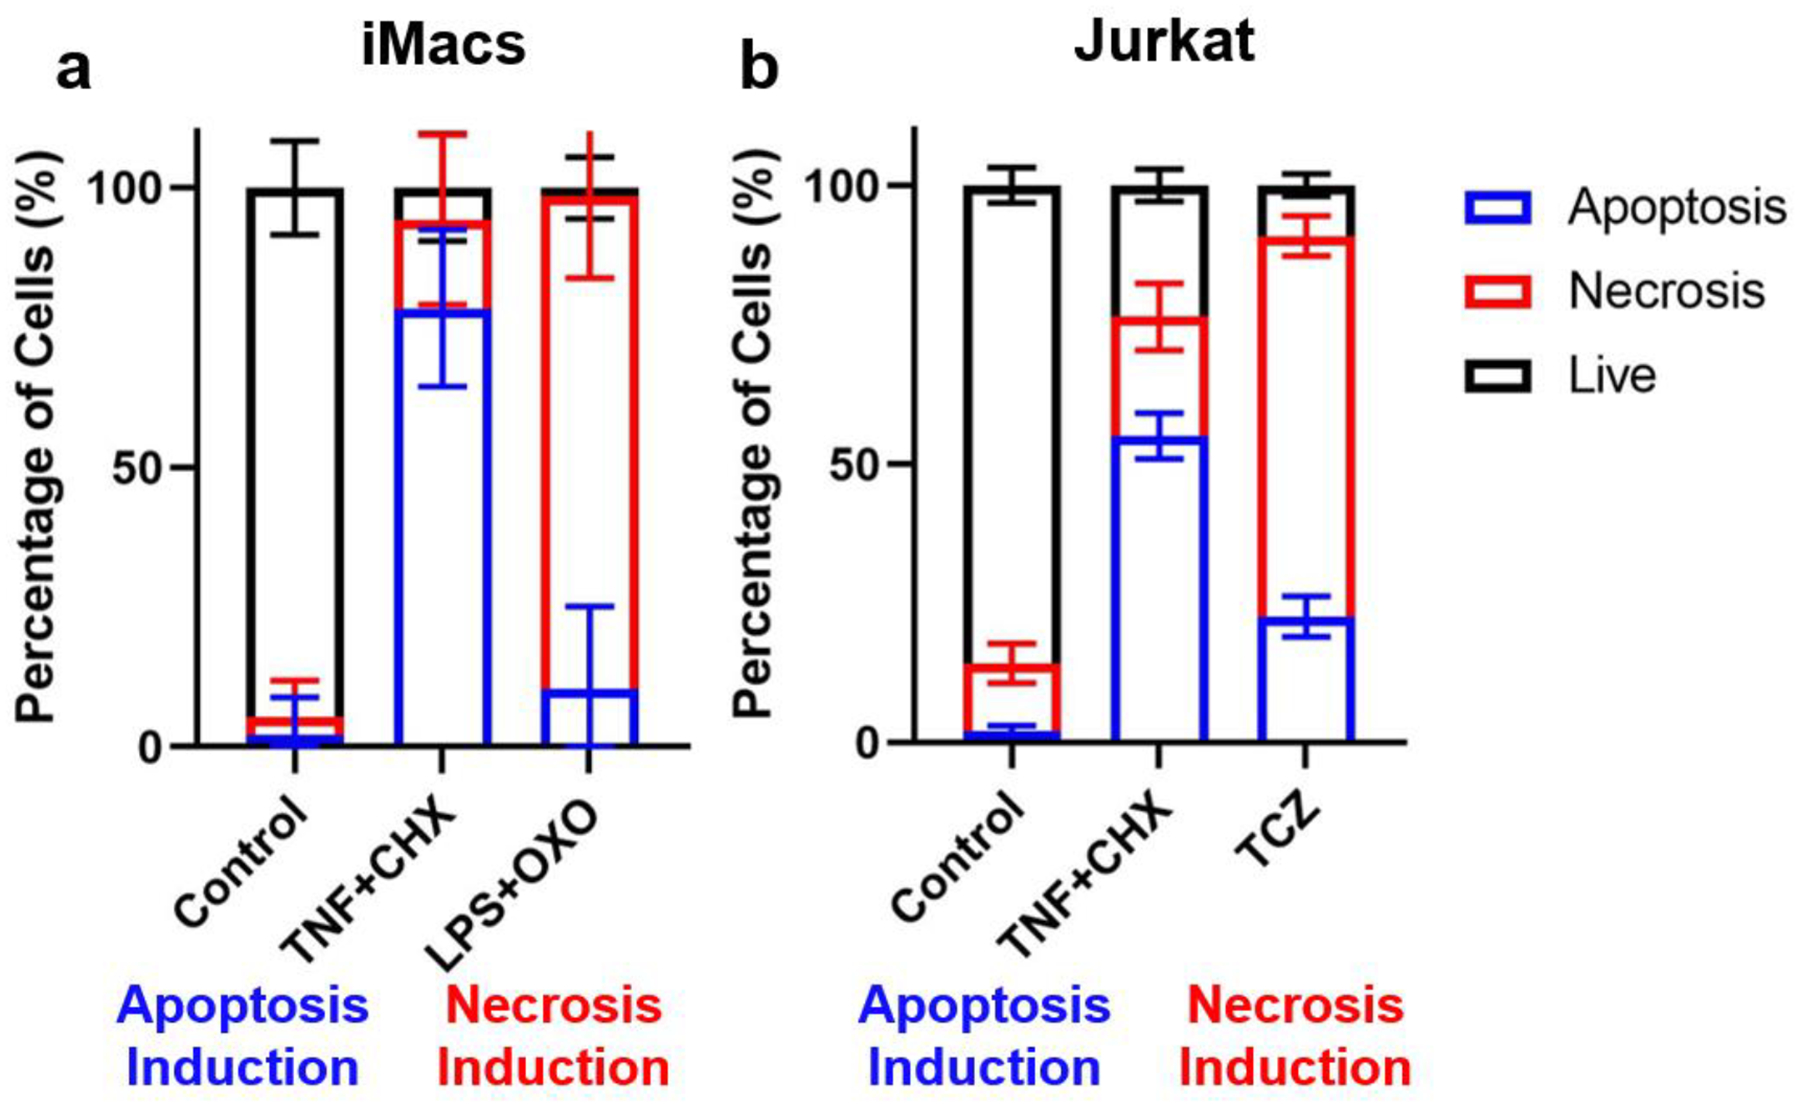
TNF+CHX was used to induce apoptosis. LPS+OXO or TCZ was used to induce necrosis. The length of bars represents the percentage of cell subsets. Error bar represents the standard deviation of 4–20 images.
LANCE tracking of cell death dynamics exhibited the pore-forming activity of Gasdermin E
In addition to the snapshot measurement of cell status, LANCE can be used to track the dynamics of cell death process. To exhibit the strength of LANCE, we employed an apoptosis-secondary necrosis cellular model. Apoptosis is mediated by effector caspases, such as caspase-3,6 and 7. However, after initial apoptosis, certain cell types can further undergo secondary necrosis. Although the secondary necrosis was believed to be un-programmed, recent studies suggest in most cases, the secondary necrosis is gasdermin E (GSDME) mediated pyroptosis25,26. GSDME is a pore-forming protein if cleaved by apoptotic caspases to release its N-terminus domain. Cells without GSDME expression cannot move to secondary necrosis phase but stay in apoptosis for a long period, with intact cell membrane structure and an apoptotic morphology.
GSDME expression is epigenetically regulated and highly related to pathological conditions, such as chemotherapy-induced side effects (inflammation) and tumorigenesis26, 27. For example, in most cancer cells, GSDME expression was attenuated as GSDME-mediated by secondary necrosis can facilitate a strong anti-tumor immunity26. U937 cells is one of the immortalized cancer cell lines that silence GSDME expression. Given that, we reconstituted GSDME expression in U937 by retroviral based transduction (U937-GE). Upon UV exposure-induced apoptotic caspase activation, GSDME could be efficiently cleaved (Fig. 6), which triggered plasma membrane damage, cell lysis and necrotic morphology. We captured images of both U937 and U937-GE every 30 minutes for 4 hours after UV exposure for LANCE analysis. The dynamics revealed that for U937 cells, cells underwent apoptosis with minimal necrosis due to lack of GSDME (Fig. 7a). More interestingly, for U937-GE cells, cells first started with apoptosis (1.5 h), but switched to necrosis later (3–4 h) due to the GSDME activation triggered by apoptotic caspases (Fig. 7b). Representative images were shown in Fig. 7c–f, S5, S6. In this experiment, LANCE precisely captured the process of the initial apoptosis and secondary necrosis, which exhibited the pore-forming activity of GSDME in cell death.
Fig. 6. Western blot of GSDME expression and cleavage in U937 and U937-GSDME cells.
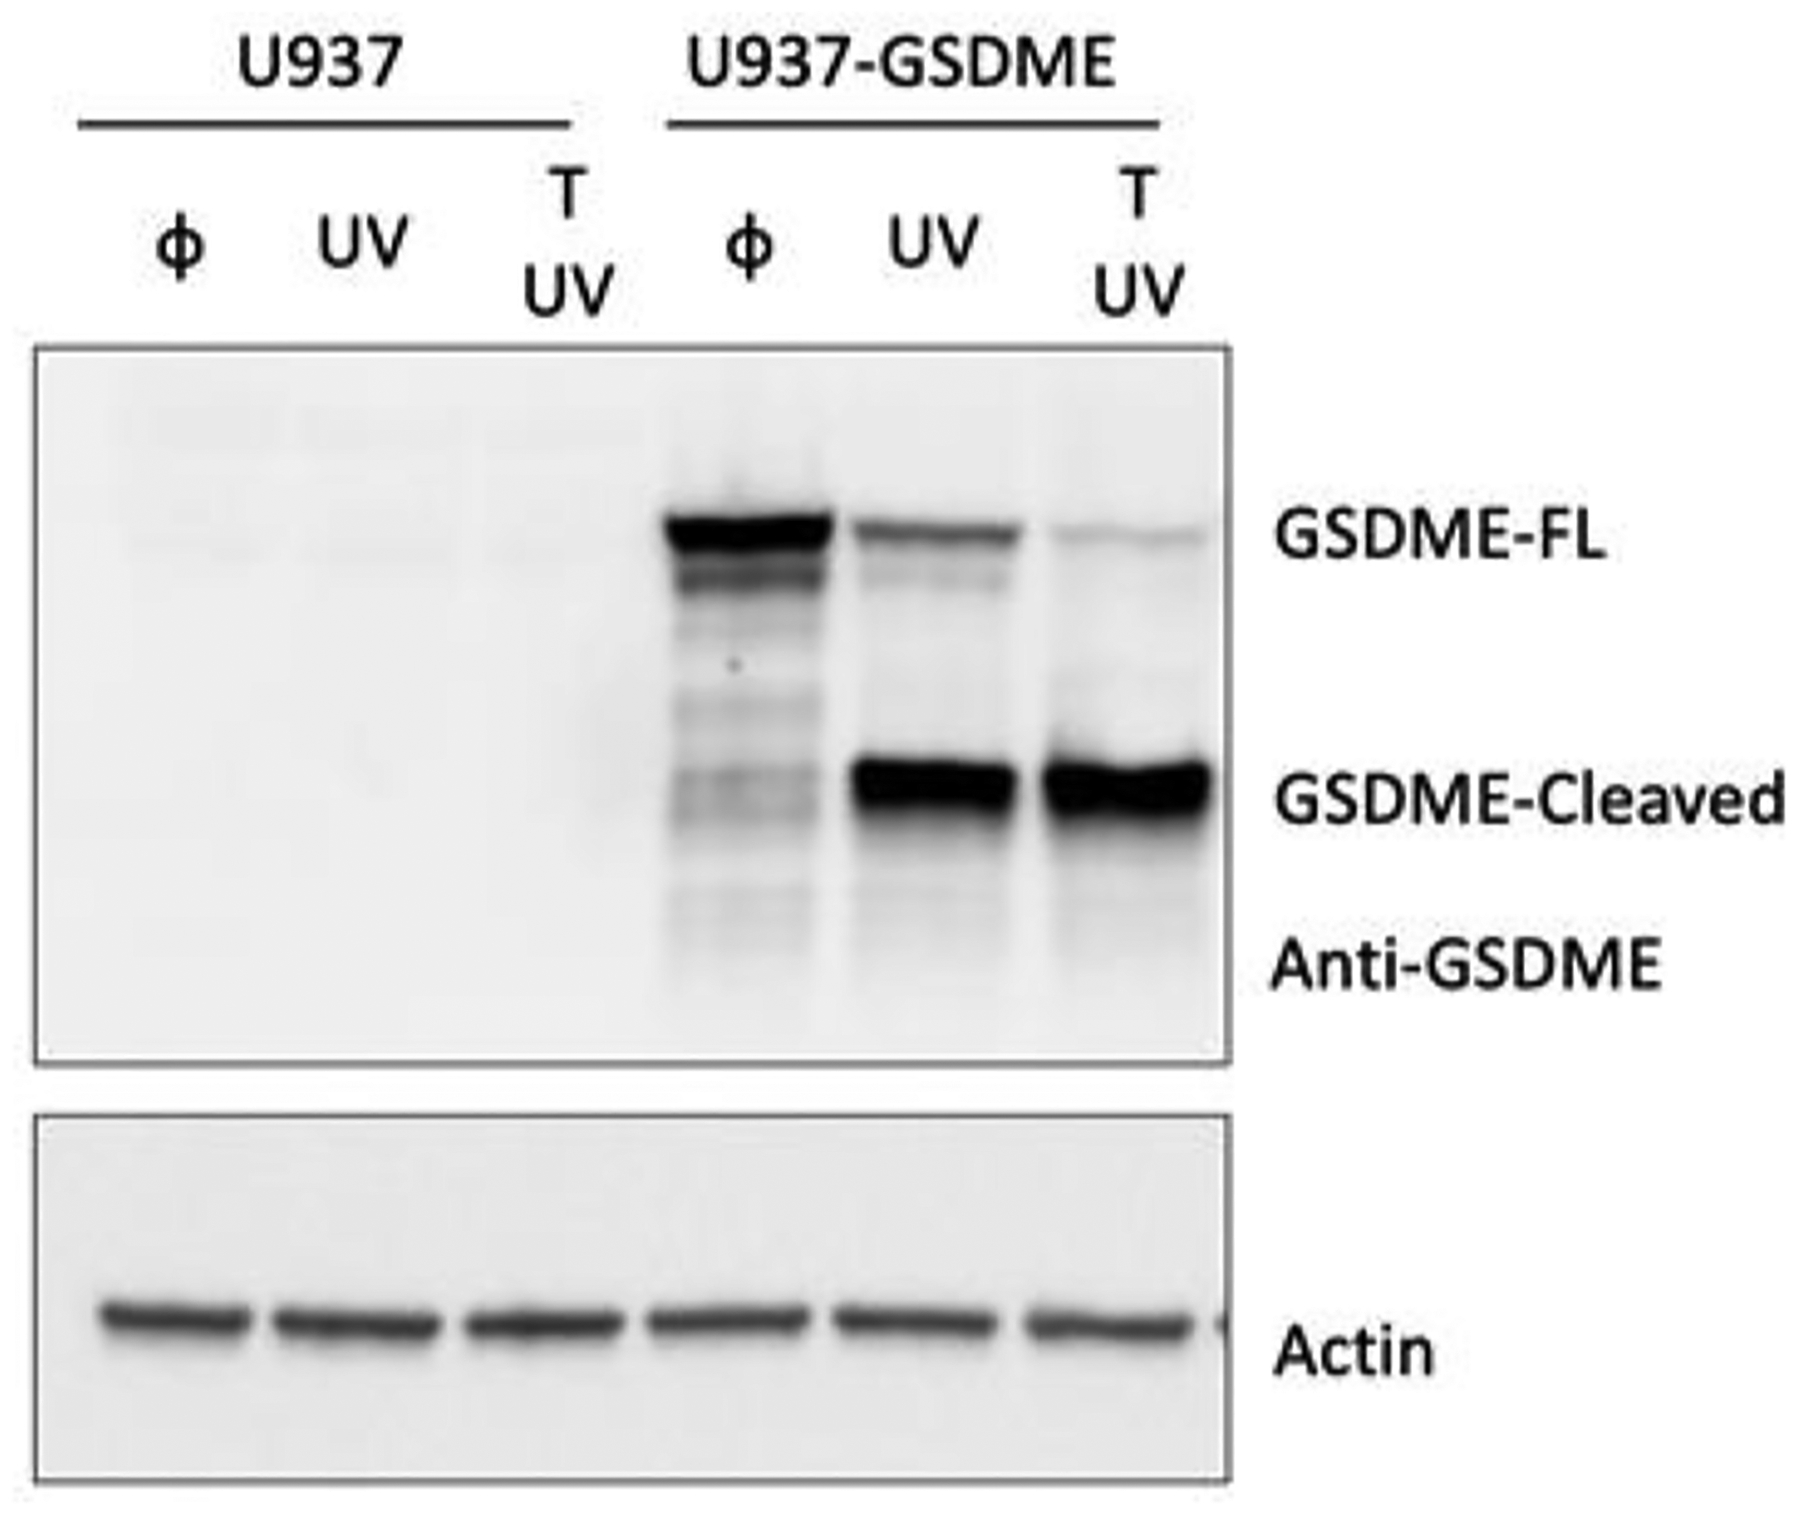
upon 150 KJ/cm2 UV irradiation (UV) with or without TNF (T) for ~2 hr.
Fig. 7. Time dynamics of cell death.
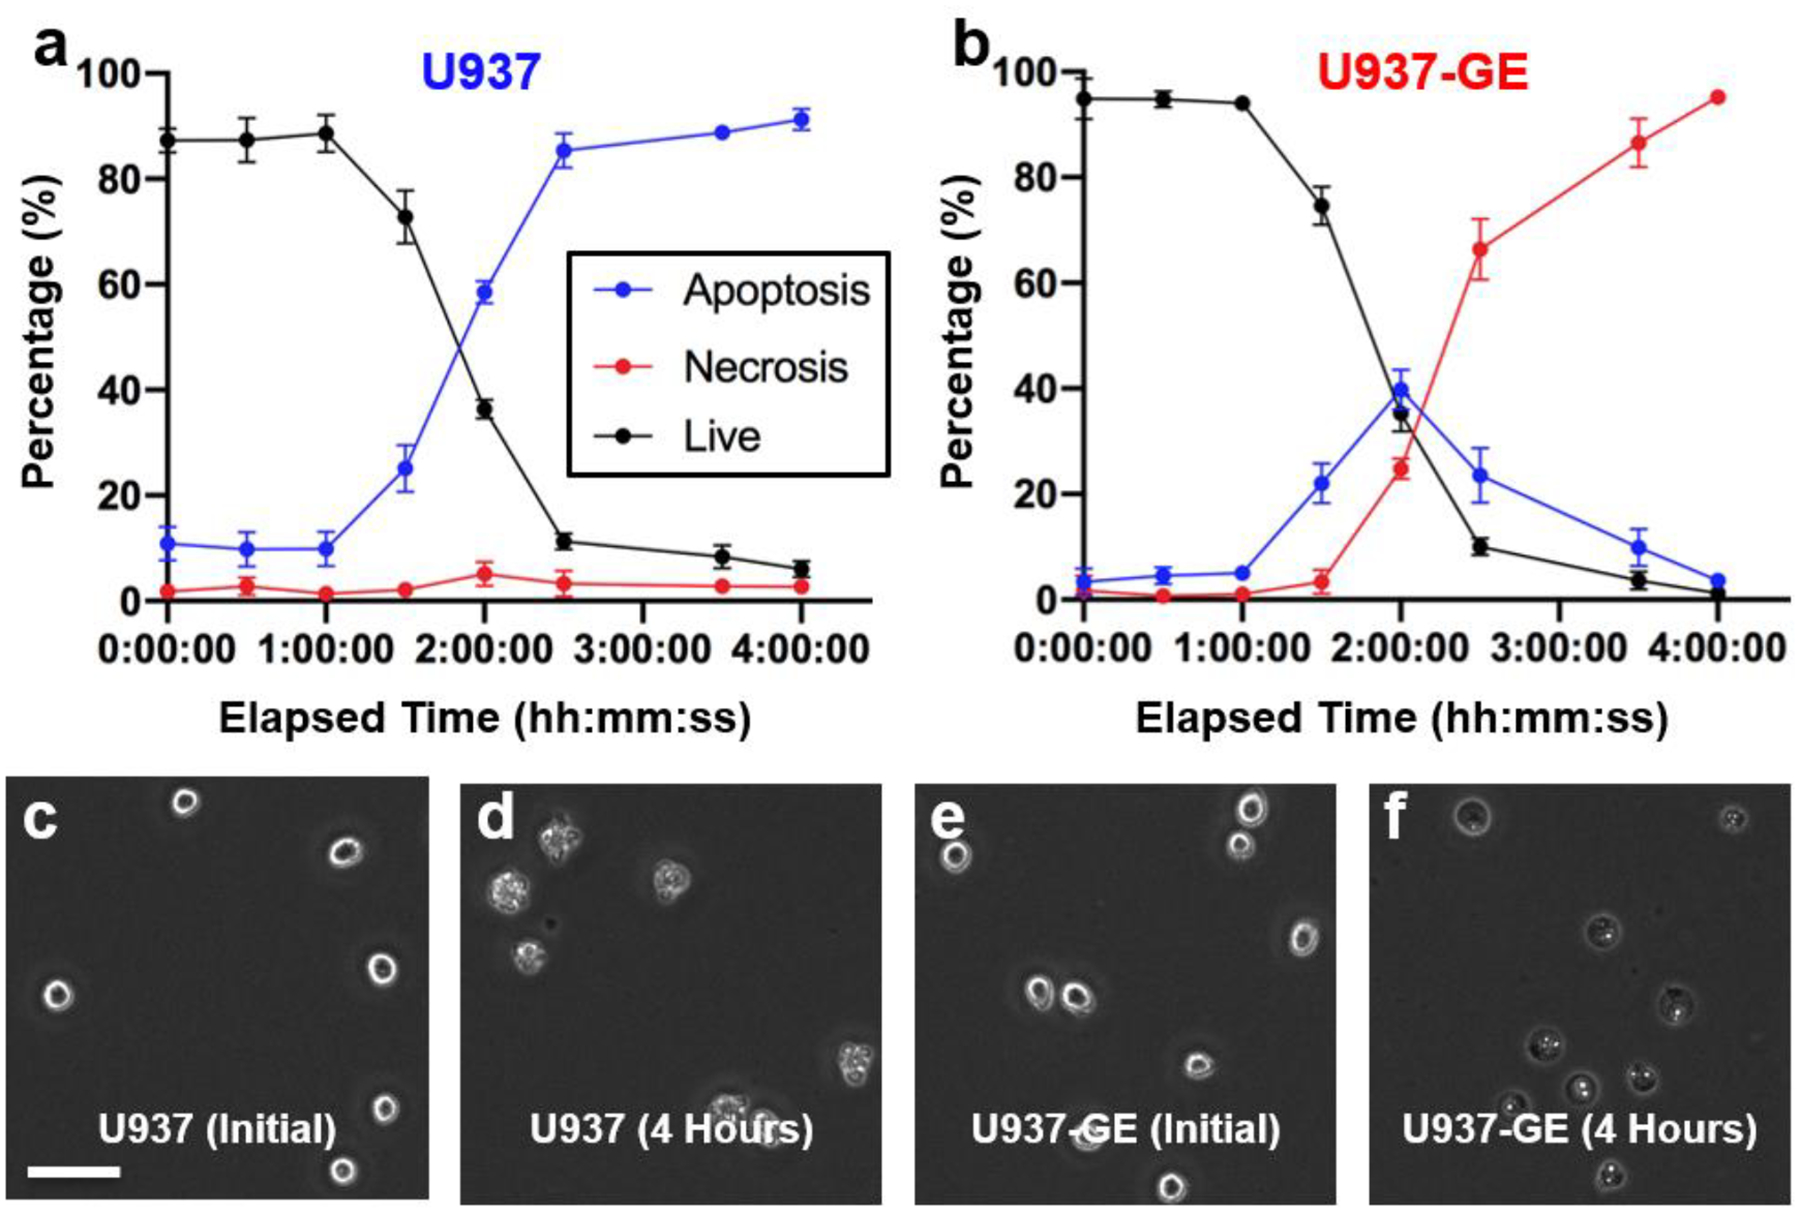
(a-b) Temporal tracking of U937 (GSDME silenced) and U937-GE (GSDME expressed) cells irradiated by 150 KJ/cm2 UV. Cells were imaged every 30 minutes for 4 hours. Error bar represents the standard deviation of 4 images at each time point. (c) Representative initial image of U937 cells. (d) Representative images of U937 cells four hours after UV irradiation. (e) Representative initial image of U937-GE cells. (f) Representative images of U937-GE cells four hours after UV irradiation. Scale bar: 50 μm.
CONCLUSION
Despite being a crucial tenant of many research applications, current methods that can assess cell death rely on staining. Label-free prediction that does not require staining allows the user to flexibly monitor the samples at any time. In this work, we developed the LANCE for label-free distinguishment of cell status utilizing machine learning techniques and succeeded in multiple facets. For the first time, we established a morphology-based approach to precisely distinguish the programmed cell death of apoptosis and necrosis using a convolutional neural network model. The LANCE can be used to assess images collected by another microscopy setup and also new cell lines that are not present in the training dataset. More importantly, the non-destructive method allows for flexible time-dynamic monitoring of the compositions of cell populations under different treatment conditions. The comprehensive tests validate the LANCE to be a fast, easy-to-use, precise, and reliable method which will change how we study programmed cell death. The success not only provides an effective tool to quantify cell status but also opens new opportunities to perform label-free measurements with machine learning.
Supplementary Material
ACKNOWLEDGEMENTS
This study was generously supported by start-up funding from Hillman Cancer Center (Y.-N.G. and Y-C.C.) and in part by awards number R21CA259457, and DP2GM146320 from the National Institutes of Health (Y.-N.G.). This project is supported in part by the Xiangya visiting scholar program to M.Z. We thank Zhen Li (Ghent University) for insightful discussions. We thank Hsi-Ming (Peter) Wang for drawing the Cover Art.
Footnotes
SUPPORTING INFORMATION
Supporting information includes Fig. S1. Representative images of living, apoptotic and necrotic cell morphology, Fig. S2. Convolutional Neural Network (CNN) models used for label-free prediction of cell status, Fig. S3. Trained convolutional filters in the 6-Layer neural network for prediction, Fig. S4. Ambiguous cell images, Fig. S5. The apoptotic process of U937 cells, Fig. S6. The necrotic process of U937-GE cells, and Table. S1. The T-Test results between the four network model structures.
COMPETING FINANCIAL INTERESTS
The authors declare no competing financial interests.
REFERENCES
- [1].Green DR The Coming Decade of Cell Death Research: Five Riddles. Cell. 2019, 177, 1094–1107, DOI: 10.1016/j.cell.2019.04.024. [DOI] [PMC free article] [PubMed] [Google Scholar]
- [2].Green DR A BH3 Mimetic for Killing Cancer Cells. Cell. 2016, 165, 1560, DOI: 10.1016/j.cell.2016.05.080. [DOI] [PubMed] [Google Scholar]
- [3].Galluzzi L; et al. Molecular mechanisms of cell death: recommendations of the Nomenclature Committee on Cell Death 2018. Cell Death Differ. 2018, 25, 486–54, DOI: 10.1038/s41418-017-0012-4. [DOI] [PMC free article] [PubMed] [Google Scholar]
- [4].Martin SJ; Reutelingsperger CP; McGahon AJ; Rader JA; van Schie RC; LaFace DM; Green DR Early redistribution of plasma membrane phosphatidylserine is a general feature of apoptosis regardless of the initiating stimulus: inhibition by overexpression of Bcl-2 and Abl. J. Exp. Med 1995, 182, 1545–1556, DOI: 10.1084/jem.182.5.1545. [DOI] [PMC free article] [PubMed] [Google Scholar]
- [5].Gong YN; Guy C; Olauson H; Becker JU; Yang M; Fitzgerald P; Linkermann A; Green DR ESCRT-III Acts Downstream of MLKL to Regulate Necroptotic Cell Death and Its Consequences. Cell. 2017, 169, 286–300 216, DOI: 10.1016/j.cell.2017.03.020. [DOI] [PMC free article] [PubMed] [Google Scholar]
- [6].La Greca A; Pérez N; Milone PM; Castañeda S; Scarafia MA; Möbbs AM; Waisman A; Moro LN; Sevlever GE; Luz-zani C; Miriuka SG Celldeath: a tool for simple detection of cell death in transmitted light microscopy images by visual deep learning analysis. PLoS One. 2020, 16 (6), DOI: 10.1371/journal.pone.0253666. [DOI] [PMC free article] [PubMed] [Google Scholar]
- [7].Habibi Aghdam H; Jahani Heravi E Convolutional Neural Networks. Guide to Convolutional Neural Networks. 2017, 85–130. DOI: 10.1007/978-3-319-57550-6_3. [DOI] [Google Scholar]
- [8].LeCun Y; Bengio Y; Hinton G Deep learning. Nature. 2015, 521 (7553), 436–444. DOI: 10.1038/nature14539. [DOI] [PubMed] [Google Scholar]
- [9].Kim D; Min Y; Oh JM; Cho Y-K AI-powered transmitted light microscopy for functional analysis of live cells. Sci.Rep 2019, 9, 18428 (2019), DOI: 10.1038/s41598-019-54961-x. [DOI] [PMC free article] [PubMed] [Google Scholar]
- [10].Zhang Z; Chen L; Wang Y; Zhang T; Chen YC; Yoon E Label-Free Estimation of Therapeutic Efficacy on 3D Cancer Spheres Using Convolutional Neural Network Image Analysis. Anal. Chem 2019. 91 (21), 14093–14100, DOI: 10.1021/acs.analchem.9b03896. [DOI] [PubMed] [Google Scholar]
- [11].Bower AJ; Marjanovic M; Zhao Y; Li J; Chaney EJ; Boppart SA Label-free in vivo cellular-level detection and imaging of apoptosis. J. Biophotonics 2016, 10 (1), 143–150. DOI: 10.1002/jbio.201600003. [DOI] [PMC free article] [PubMed] [Google Scholar]
- [12].Jung Y; Klein OJ; Wang H; Evans CL Longitudinal, label-free, quantitative tracking of cell death and viability in a 3D tumor model with OCT. Sci. Rep 2016, 6 (1), DOI: 10.1038/srep27017. [DOI] [PMC free article] [PubMed] [Google Scholar]
- [13].Koç E; Çelik-Uzuner S; Uzuner U; Çakmak R The Detailed Comparison of Cell Death Detected by Annexin V-PI Counterstain Using Fluorescence Microscope, Flow Cytometry and Automated Cell Counter in Mammalian and Microalgae Cells. J. Fluoresc 2018, 28 (6), 1393–1404, DOI: 10.1007/s10895-018-2306-4. [DOI] [PubMed] [Google Scholar]
- [14].Jiang X; Jiang Z; Xu T; Su S; Zhong Y; Peng F; Su Y; He Y Surface-Enhanced Raman Scattering-Based Sensing In Vitro: Facile and Label-Free Detection of Apoptotic Cells at the Single-Cell Level. Anal. Chem 2013, 85 (5), 2809–2816, DOI: 10.1021/ac303337b. [DOI] [PubMed] [Google Scholar]
- [15].Hoffman RA Flow Cytometry: Instrumentation, Applications, Future Trends and Limitations. Standardization and Quality Assurance in Fluorescence Measurements II. Springer. 2008, pp: 307–342. [Google Scholar]
- [16].Farhat G; Czarnota GJ; Kolios MC; Yang VXD; Miri-ampillai A Detecting apoptosis using dynamic light scattering with optical coherence tomography. J. Biomed. Opt 2011, 16 (7) 070505 DOI: 10.1117/1.3600770. [DOI] [PubMed] [Google Scholar]
- [17].Snyder GA; Hubbard WN; Messmer NN; et al. Intratumoral activation of the necroptotic pathway components RIPK1 and RIPK3 potentiates antitumor immunity. Sci Immunol. 2019, 4 (36), eaaw2004, DOI: 10.1126/sciimmunol.aaw2004. [DOI] [PMC free article] [PubMed] [Google Scholar]
- [18].Image Analyst. Image Segmentation Tutorial. MATLAB Central File Exchange. 2015, https://www.mathworks.com/matlabcentral/fileexchange/25157-image-segmentation-tutorial (accessed 2021-02-14)
- [19].Chen Y; Biddell K; Sun A; Relue PA; Johnson JD An automatic cell counting method for optical images. Proceedings of the First Joint BMES/EMBS Conference. 1999 IEEE Engineering in Medicine and Biology 21st Annual Conference and the 1999 Annual Fall Meeting of the Biomedical Engineering Society. 1999, DOI: 10.1109/IEMBS.1999.803974. [DOI] [Google Scholar]
- [20].Flight R; Landini G; Styles IB; Shelton RM; Milward MR; Cooper PR Automated noninvasive epithelial cell counting in phase contrast microscopy images with automated parameter selection. Journal of Microscopy. 2018, 271 (3) 345–354 DOI: 10.1111/jmi.12726. [DOI] [PMC free article] [PubMed] [Google Scholar]
- [21].Tang D; Lahti JM; Grenet J; Kidd VJ Cycloheximide-induced T-cell Death Is Mediated by a Fas-associated Death Domain-dependent Mechanism. J. Biol. Chem 1999, 274 (11), 7245–7252, DOI: 10.1074/jbc.274.11.7245. [DOI] [PubMed] [Google Scholar]
- [22].Inada SA; Amano H; Akasaki I; Morita A; Kobayashi K (2009). Effect of UV irradiation on the apoptosis and necrosis of Jurkat cells using UV LEDs. Proc. SPIE 7231, Light-Emitting Diodes: Materials, Devices, and Applications for Solid State Lighting XIII. 72310J. 2009, DOI: 10.1117/12.809929. [DOI] [Google Scholar]
- [23].Vu CCQ; Bortner CD; Cidlowski JA Differential Involvement of Initiator Caspases in Apoptotic Volume Decrease and Potassium Efflux during Fas- and UV-induced Cell Death*. J. Biol. Chem 2001, 276 (40), 37602–37611, DOI: 10.1074/jbc.M104810200. [DOI] [PubMed] [Google Scholar]
- [24].Zhao J; Jitkaew S; Cai Z; Choksi S; Li Q; Luo J; Liu E Mixed lineage kinase domain-like is a key receptor interacting protein 3 downstream component of TNF-induced necrosis. Proc. Natl. Acad. Sci. U. S. A 2012, 109, 5322–7. DOI: 10.1073/pnas.1200012109. [DOI] [PMC free article] [PubMed] [Google Scholar]
- [25].Rogers C; Fernandes-Alnemri T; Mayes L; Alnemri D; Cingolani G; Alnemri ES Cleavage of DFNA5 by caspase-3 during apoptosis mediates progression to secondary necrotic/pyroptotic cell death. Nat. Commun 2017, 8, 14128, DOI: 10.1038/ncomms14128. [DOI] [PMC free article] [PubMed] [Google Scholar]
- [26].Wang Y; Gao W; Shi X; Ding J; Liu W; He H; Wang K; Shao F Chemotherapy drugs induce pyroptosis through caspase-3 cleavage of a gasdermin. Nature. 2017, 547, 99–103, DOI: 10.1038/nature22393. [DOI] [PubMed] [Google Scholar]
- [27].Zhang Z; Zhang Y; Xia S; et al. Gasdermin E suppresses tumour growth by activating anti-tumour immunity. Nature. 2020, 579, 415–420, DOI: 10.1038/s41586-020-2071-9. [DOI] [PMC free article] [PubMed] [Google Scholar]
Associated Data
This section collects any data citations, data availability statements, or supplementary materials included in this article.


