

Abstract
Non-pharmaceutical interventions minimize social contacts, hence the spread of respiratory pathogens such as influenza and SARS-CoV-2. Globally, there is a paucity of social contact data from the workforce. In this study, we quantified two-day contact patterns among USA employees. Contacts were defined as face-to-face conversations, involving physical touch or proximity to another individual and were collected using electronic self-kept diaries. Data were collected over 4 rounds from 2020 to 2021 during the COVID-19 pandemic. Mean (standard deviation) contacts reported by 1456 participants were 2.5 (2.5), 8.2 (7.1), 9.2 (7.1) and 10.1 (9.5) across round 1 (April–June 2020), 2 (November 2020–January 2021), 3 (June–August 2021), and 4 (November–December 2021), respectively. Between round 1 and 2, we report a 3-fold increase in the mean number of contacts reported per participant with no major increases from round 2–4. We then modeled SARS-CoV-2 transmission at home, work, and community settings. The model revealed reduced relative transmission in all settings in round 1. Subsequently, transmission increased at home and in the community but remained exceptionally low in work settings. To accurately parameterize models of infection transmission and control, we need empirical social contact data that capture human mixing behavior across time.
Keywords: Social contact patterns, Infectious disease transmission, Mathematical modeling, COVID-19
1. Introduction
Over the last two years, estimation of empirical social contact patterns has been reinvigorated following the emergence of severe acute respiratory syndrome-corona virus-2 (SARS-CoV-2), the virus that causes coronavirus disease-19 (COVID-19). Social contact pattern data are critical to understand spread of respiratory pathogens such as SARS-COV-2 and assess the effectiveness of control efforts. Contact studies mainly use self-reported data via contact surveys to quantify “who-contacts-whom”, with typical stratifications by age, setting, and other disease-related attributes (Mossong et al., 2008a; Kiti et al., 2021). These patterns vary at multiple geographic scales primarily due to population structure, culture, and socio-economic activities (Mossong et al., 2008a; Verelst et al., 2021). Epidemiologically, workers represent an important population due to potential exposure to respiratory pathogens such as flu and SARS-CoV-2 at work (Contreras et al., 2021), increased risk of severe infection with age (Massetti et al., 2022), and the potential to transmit infections to household members during lockdowns (Madewell et al., 2020; Sun et al., 2021). Mathematical models have been widely used to simulate the transmission of SARS-COV-2 and examine the impact of different patterns of social contacts on control (Chin et al., 2021). However, patterns and rates of contacts at workplaces are poorly understood in the US (Beale et al., 2022).
Population-based contact studies conducted during the first year of the COVID-19 pandemic reported significant reductions in contact rates compared to periods before March 2020 (Liu et al., 2021). In the Spring and Summer of 2020, contact rates in North America, Western Europe and Asia dropped to 2–5 contacts per person from 7 to 26 contacts reported during pre-pandemic periods. In March 2020, local, state, and federal authorities in the US recommended non-pharmaceutical interventions (NPIs), including stay-at-home orders and closures of schools and nonessential workplaces, to decrease contact rates aiming to reduce transmission of SARS-COV-2 (Schuchat and Covid, 2020). Between April and December 2020, telework accounted for an estimated 50% of paid work hours (Barrero et al., 2021), and more than 98% (n = 304) of respondents in a survey targeting 3 companies reported ever working from home during the period April through June (Kiti et al., 2021). Non-Hispanic Blacks, those aged < 45 years, and males, reported higher contact rates and longer duration interactions with other household members compared to other groups (Beale et al., 2022). When lockdowns were relaxed in Fall 2020 and Spring 2021, workplace contacts in retail, hospitality and transportation sectors reported a rebound in the number of contacts (Nelson et al., 2021), as demonstrated by the drop in the Stringency Index (Hale et al., na) (range 0–100 depending on how stringent the physical distancing containment measures were). However, the mechanisms and impact of physical distancing interventions on SARS-CoV-2 transmission across time remains poorly understood.
Starting in April 2020, we conducted a cross-sectional study to collect data on social contact patterns among employees in 3 companies in Atlanta, Georgia, USA (Kiti et al., 2021). In subsequent rounds, these companies plus 2 others provided data at three additional timepoints up to December 2021. In this report, we describe the changing contact patterns among employees during the ongoing COVID-19 pandemic in the US.
2. Results
2.1. Description of study participants
Across four rounds of data collection, 1456 respondents reported a total of 12,198 contacts. Participation increased modestly from R1 (N = 304) to R4 (N = 433) with no major fluctuations observed in the proportions across rounds by age, sex, race, and ethnicity. 16 individuals participated in all four rounds. In total, about one third of participants (n = 442) were aged 20–29 years and 5% (n = 80) were 60 years and older. Among all participants, 64% (n = 933) were female. The majority (n = 1293; 89%) of participants had a bachelor’s degree or higher. The family structure varied from living alone (n = 222; 15%), in a nuclear family (n = 919; 63%), 9% in extended families, with roommates (10%) and the rest in other arrangements. Close to two–thirds of the participants were non-Hispanic White (n = 847; 59%) and 7% (n = 95) of Hispanic ethnicity. At the time of the study for each round, ≥ 95% of all participants reported ever working from home. In R4, 14% (60/433) of individuals reported ever having COVID-19 confirmed by a test. Out of all participants in R4, 97% (n = 420) reported having received any COVID-19 vaccine. A summary of the participants’ characteristics is provided in Table 1.
Table 1.
Baseline characteristics of study participants. This shows the number of participants across 4 rounds of data collection in five US companies, from April 2020 – December 2021. NH under Race/ Ethnicity refers to non-Hispanic ethnicity.
| Total (N (%)) | Round 1Apr – Jun ‘20 | Round 2Nov ‘20 – Jan ‘21 | Round 3Jun – Aug ‘21 | Round 4Nov `21 – Dec ‘21 | |
|---|---|---|---|---|---|
| N = 1456 | N = 304 | N = 343 | N = 376 | N = 433 | |
| Sex | |||||
| Female | 933 (64) | 184 (61) | 227 (66) | 248 (66) | 274 (63) |
| Male | 518 (36) | 116 (38) | 115 (34) | 128 (34) | 159 (37) |
| Not reported | 5 (0) | 4 (1) | 1 (0) | 0 (0) | 0 (0) |
| Age (years) | |||||
| 20–29 | 442 (30) | 90 (30) | 87 (25) | 120 (32) | 145 (33) |
| 30–39 | 413 (28) | 76 (25) | 109 (32) | 104 (28) | 124 (29) |
| 40–49 | 320 (22) | 60 (20) | 86 (25) | 80 (21) | 94 (22) |
| 50–59 | 201 (14) | 49 (16) | 39 (11) | 56 (15) | 57 (13) |
| 60 + | 80 (5) | 29 (10) | 22 (6) | 16 (4) | 13 (3) |
| Education Lower than Bachelors | 162 (11) | 17 (6) | 35 (10) | 51 (14) | 59 (14) |
| Bachelors or higher | 1293 (89) | 286 (94) | 308 (90) | 325 (86) | 374 (86) |
| Family structure | |||||
| Live alone | 222 (15) | 44 (14) | 43 (13) | 60 (16) | 75 (17) |
| Nuclear | 919 (63) | 173 (57) | 241 (70) | 236 (63) | 269 (62) |
| Extended | 138 (9) | 26 (9) | 27 (8) | 40 (11) | 45 (10) |
| With roommates | 146 (10) | 39 (13) | 28 (8) | 37 (10) | 42 (10) |
| Other | 31 (2) | 22 (7) | 4 (1) | 3 (1) | 2 (0) |
| Race/Ethnicity | |||||
| Hispanic | 95 (7) | 14 (5) | 20 (6) | 24 (6) | 37 (9) |
| Asian, NH | 281 (20) | 48 (16) | 37 (11) | 75 (20) | 121 (28) |
| Black, NH | 133 (9) | 25 (8) | 30 (9) | 35 (9) | 43 (10) |
| White, NH | 847 (59) | 169 (56) | 240 (70) | 226 (60) | 212 (55) |
| Mixed, NH | 71 (5) | 46 (15) | 12 (4) | 13 (3) | 0 (0) |
| Other, NH | 29 (2) | 2 (1) | 4 (1) | 3 (1) | 20 (5) |
| Working from home | 1396 (96) | 288 (95) | 329 (96) | 368 (98) | 411 (95) |
2.2. Contact patterns
The median (IQR) number of contacts over both days reported in R1, R2, R3 and R4 was 2 (1–4), 7 (4–10), 7 (4–12) and 8 (4–13), respectively (Table 2). The median number of contacts in R2 was 3.5 times higher than R1 and this was sustained to R4. Corresponding bootstrapped mean (standard deviation) values over both days for each round are 2.5 (0.2), 8.2 (0.9), 9.2 (0.5) and 10.1 (0.7), respectively. The increase was consistent across age, sex, education level, and race (Fig. 1). Between R1 and R4, however, we observed a 6–fold and 2.5–fold increase in median number of workplace and community contacts, respectively, whereas no change was reported at the household. We also present the median (IQR) number of contacts on day 1 only in Supplementary Materials SI.1. Across all rounds, the least contacts were reported at the workplace (1647, 14%), while a third of the contacts were reported at home (4515, 37%) and about half in the community (6036, 49%) (see SI.2). We present a summary of the number of contacts over two days reported across age, sex, setting, and type of contact (SI.2), and the median (IQR) number of contacts by setting in SI.3.
Table 2.
Distribution of number of contacts reported by participants. This shows the median and interquartile range (IQR) of contacts reported by participants across four rounds of data collection in five US companies, April 2020 – December 2021. NH refers to non-Hispanic ethnicity.
| Variable | Total* (N (%)) | Round 1Apr – Jun ‘20 | Round 2Nov ‘20 – Jan ‘21 | Round 3Jun – Aug ‘21 | Round 4Nov `21 – Dec ‘21 |
|---|---|---|---|---|---|
| Overall | 12,198 | 2 (1–4) | 7 (4–10) | 7 (4–12) | 8 (4–13) |
| Sex | |||||
| Female | 7755 (64) | 2 (1–4) | 6 (4–10) | 7 (4–12) | 8 (4–13) |
| Male | 4423 (36) | 3 (1–4) | 7 (4–10) | 7 (4–13) | 7 (4–13) |
| Not reported | 20 (0) | 1 (0–1 | 8 (8–8) | NA | NA |
| Age Group | |||||
| 20–29 | 3481 (29) | 2 (1–3) | 6 (3–9) | 8 (4–12) | 7 (3–12) |
| 30–39 | 3198 (26) | 2 (1–4) | 6 (4–9) | 6 (4–10) | 7 (4–12) |
| 40–49 | 3001 (25) | 3 (2–5) | 9 (5–12) | 9 (4–14) | 9 (4–14) |
| 50–59 | 1875 (15) | 2 (1–4) | 6 (4–9) | 10 (5–14) | 7 (4–15) |
| 60 + | 643 (5) | 2 (1–4) | 8 (4–12) | 7 (4–10) | 10 (6–16) |
| Family structure | |||||
| Live alone | 1597 (14) | 1 (0–3) | 6 (3–9) | 6 (3–10) | 9 (4–14) |
| Nuclear | 7865 (63) | 2 (1–4) | 7 (4–11) | 7 (4–12) | 7 (4–13) |
| Extended | 1263 (11) | 3 (2–5) | 8 (6–9) | 10 (6–13) | 8 (4–12) |
| With roommates | 1259 (11) | 3 (1–4) | 6 (4–9) | 9 (5–14) | 6 (3–13) |
| Other | 214 (2) | 2 (1–4) | 10 (4–19) | 5 (3–9) | 7 (6–8) |
| Setting of contact Community | 6036 (50) | 2 (1–4) | 4 (2–7) | 5 (2–9) | 5 (2–9) |
| Home | 4515 (37) | 3 (2–6) | 4 (2–6) | 3 (2–5) | 3 (2–5) |
| Work | 1647 (13) | 1 (1–10) | 6 (3–9) | 4 (2–8) | 6 (4–10) |
| Race/Hispanic | |||||
| Hispanic | 898 (7) | 3 (1–4) | 6 (4–11) | 7 (5–11) | 10 (6–19) |
| Asian, NH | 2400 (20) | 2 (1–3) | 8 (3–9) | 7 (3–11) | 7 (3–13) |
| Black, NH | 1187 (9) | 2 (1–4) | 7 (5–10) | 8 (5–11) | 6 (3–12) |
| White, NH | 7024 (60) | 3 (1–4) | 7 (4–10) | 8 (4–13) | 7 (4–12) |
| Mixed, NH | 440 (5) | 2 (1–4) | 4 (3–9) | 6 (3–10) | 0 |
| Other, NH | 249 (4) | 3 (1–4) | 4 (3–5) | 5 (3–9) | 8 (5–13) |
Each stratification refers to the number of contacts reported by the participant per strata. The values in the table refer to the two study days combined.
Fig. 1.
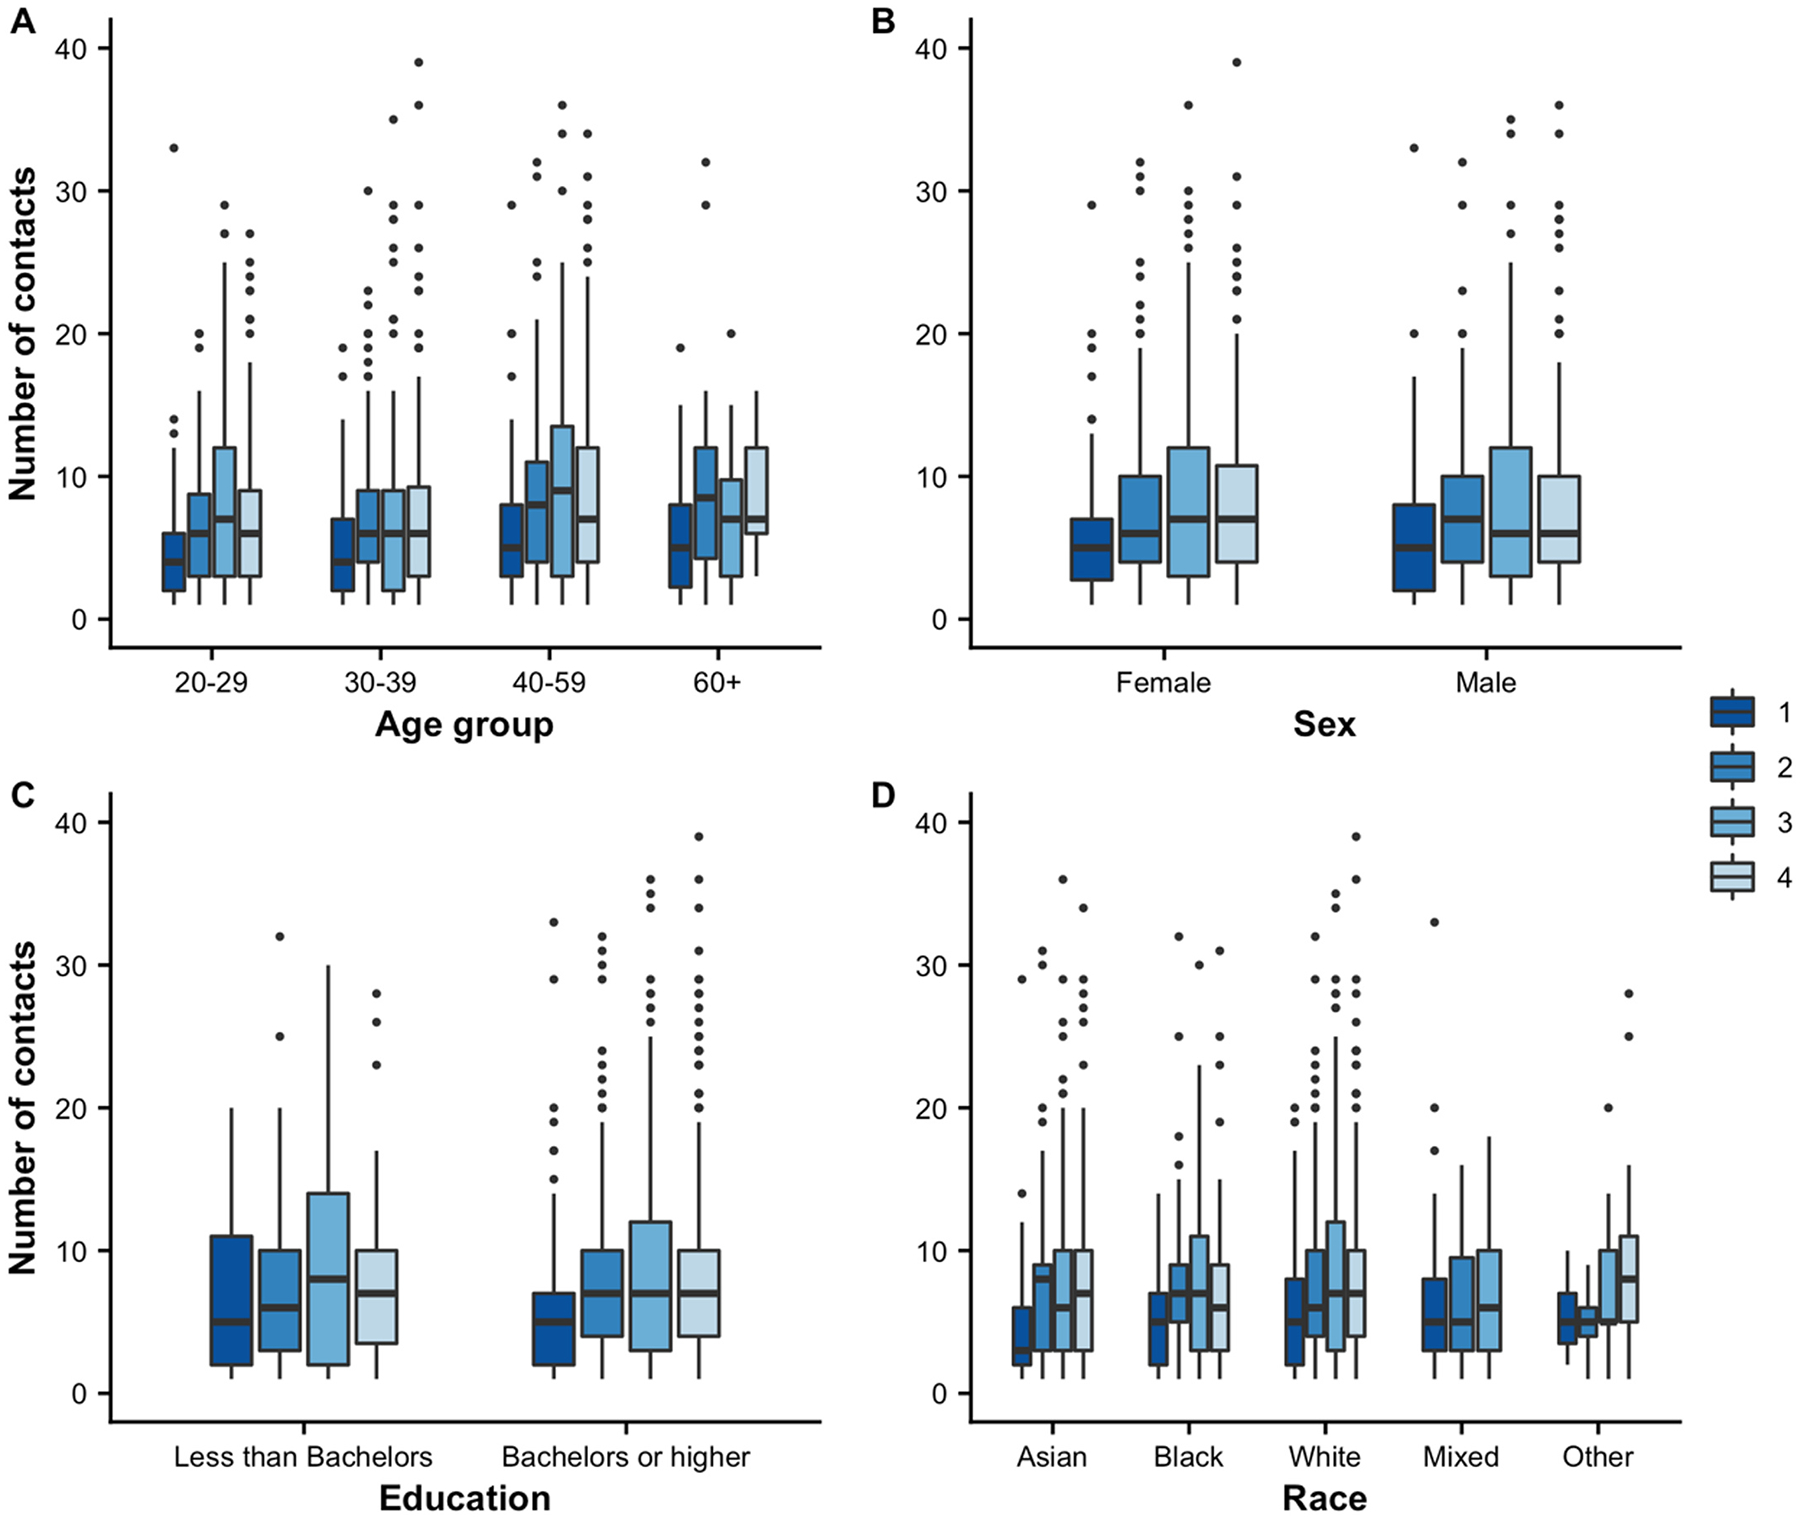
Distribution of the number of contacts over two days by various participant attributes in five US companies, April 2020 – December 2021. Panels (A), (B), (C) and (D) show the distribution of reported contact by age group, sex, education level and race for R1–R4. Each box represents the interquartile range (IQR), whereby the lower and upper edges of the box are the 25% and 75% percentile of the number of contacts, respectively. The line inside the box is the median value of the number of contacts reported by the participants. The whiskers extending from the box represent the range of the data from the minimum (lower whisker) to the maximum (upper whisker) values for the boxes without dots. The dots above the whiskers represent outliers or values that differ significantly from most of the other data points.
A 9-fold increase in median number of contacts was also noted in individuals who lived alone, from a median of 1 (IQR 0–3) to 9 (4–14) in R1 to R4, respectively, as shown in Table 2.
2.3. Contact matrices across rounds
Fig. 2 shows the mean number of age–specific contact patterns across the four rounds of data collection among employees of five US companies.
Fig. 2.
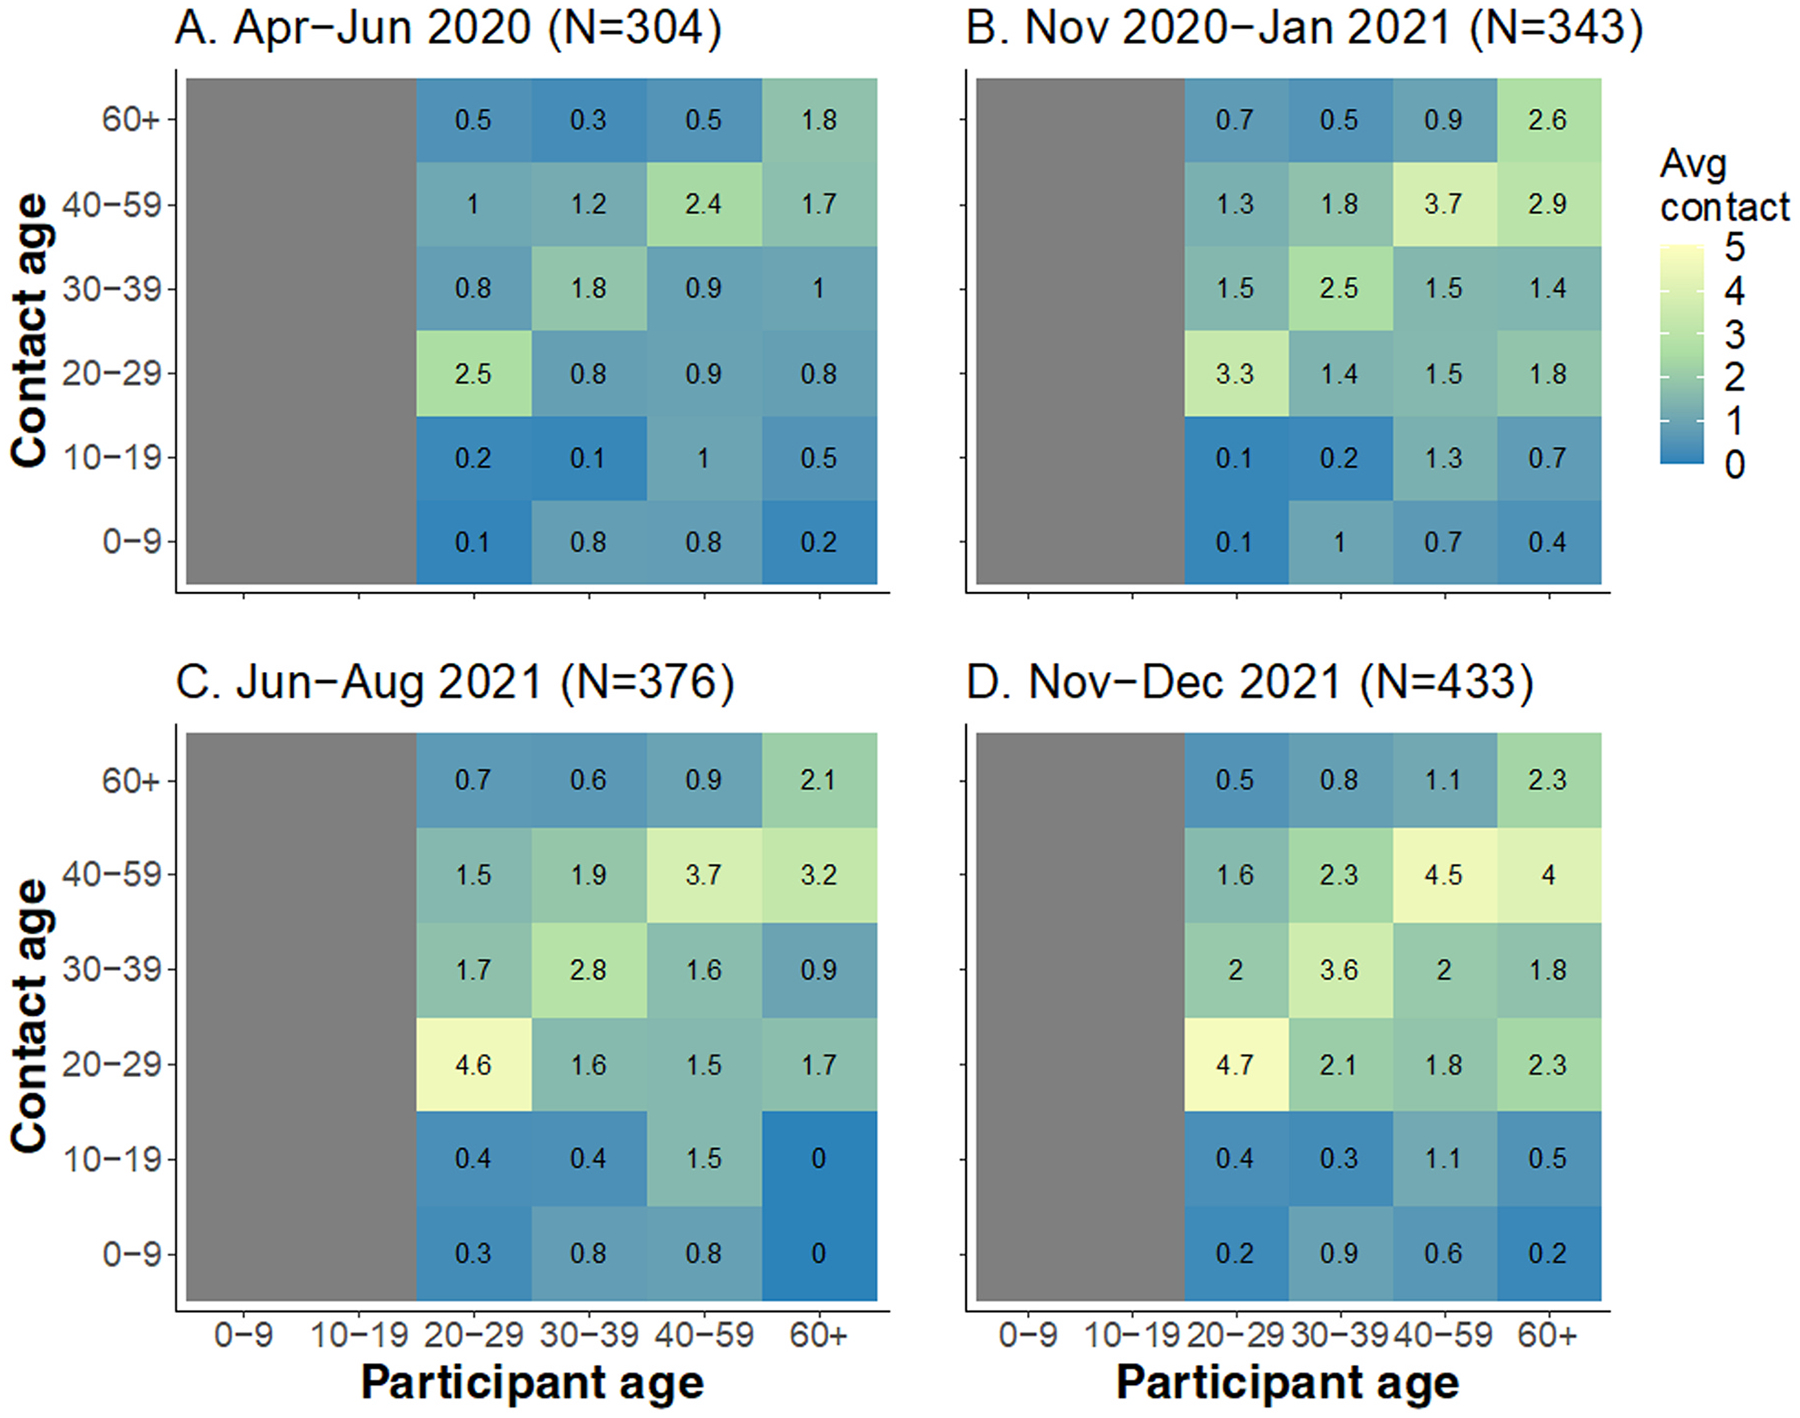
Contact matrices showing the mean number of contacts over two days for each round in employees drawn from five US companies. Panel (A) shows contacts in round 1, R1 (Apr–Jun 2020), (B) shows R2 (Nov 2020–Jan 2021), (C) shows R3 (Jun–Aug 2021), and (D) shows R4 (Nov–Dec 2021). The gray column on ages 0–19 years indicates no contacts reported by participants since all participants are employees aged ≥ 20 years. The gray bar between age 60 + and 0–19 years in panel C indicates that no contacts were reported by participants aged 60 + with 0–19-year-olds. The mean number of contacts were adjusted for population size and realized through 1000 bootstraps from the R package socialmixr (Funk and Willem, 2022). Corresponding standard deviation values are available in SI.5.
Across all rounds, we observe two key characteristics. The first is the presence of the prominent diagonal (assortative contacts), signifying a higher number of contacts between people of the same age. While the number of age assortative contacts increased subtly through the rounds, the proportion of these number of contacts remained relatively stable (see SI.4). The second observation is the presence of interactions between 30 and 39 and 40–59–year-olds with children and young adults aged 0–19 years old (inter-generational contacts). The number of these contacts also remain relatively stable across rounds, as shown by the proportion of age assortative contacts in SI.4. Lastly, in later rounds, we observed more contacts off the diagonal, indicating that contacts become less assortative as individuals started interacting more across different ages particularly in rounds 2 and 4 (Q-index values of assortativity for rounds 1, 2, 3, and 4 are 0.30, 0.03, 0.39, and 0.19, respectively. Values close to zero represent less assortative mixing).
2.4. Difference of contact patterns between rounds
In Fig. 3, we show the net difference in the age specific mean number of between consecutive rounds (panel A–C) and the first and last rounds (R1 and R4, panel D). Between rounds, the largest net positive change (increase in mean number of contacts) was observed between round 1–2 (panel A) and among working adults i.e., aged > 20 years old. This net increase occurred across all adult age groups and was highest in those aged 40–49 years was observed in ages 30–39 years and the least to no change was observed in the oldest group (60 + years). Relatively high net positive increases were observed across all working adults from rounds 1–2 and 3–4, while some ages (20–29 and 40 + years) showed net decreases. Contacts between participants ≥ 20 years old and those aged < 20 years remained exceptionally low across all rounds.
Fig. 3.

Matrices of difference in mean number of contacts between round 1–4 in employees of five US companies. The panels show increases (positive values) or decreases (negative values) between round 2 and 1 (R1–R2, panel A), R2–R3 (B), R3–R4 (C), and overall difference between R4 and R1 (D), respectively.
2.5. Contact patterns by setting
We also assess the mixing patterns by age in Fig. 4 separately for work (panel A–D), home (E–H) and community (I–L) across the four rounds. We observed differences in the number and structure of contacts across settings and rounds. Work contacts increase marginally across rounds and occur across all age groups. Home contacts displayed distinct assortative mixing patterns that increased marginally in R2 compared to R1 and do not change thereafter. We also observed the presence of intergenerational contacts between parents (30–59 years) and children (0–19 years). Community contacts displayed the highest net increase from R1–R4 with both assortative contacts and contacts between people of different ages. At home and in the community, contacts were generally high among young adults aged 20–29 years.
Fig. 4.
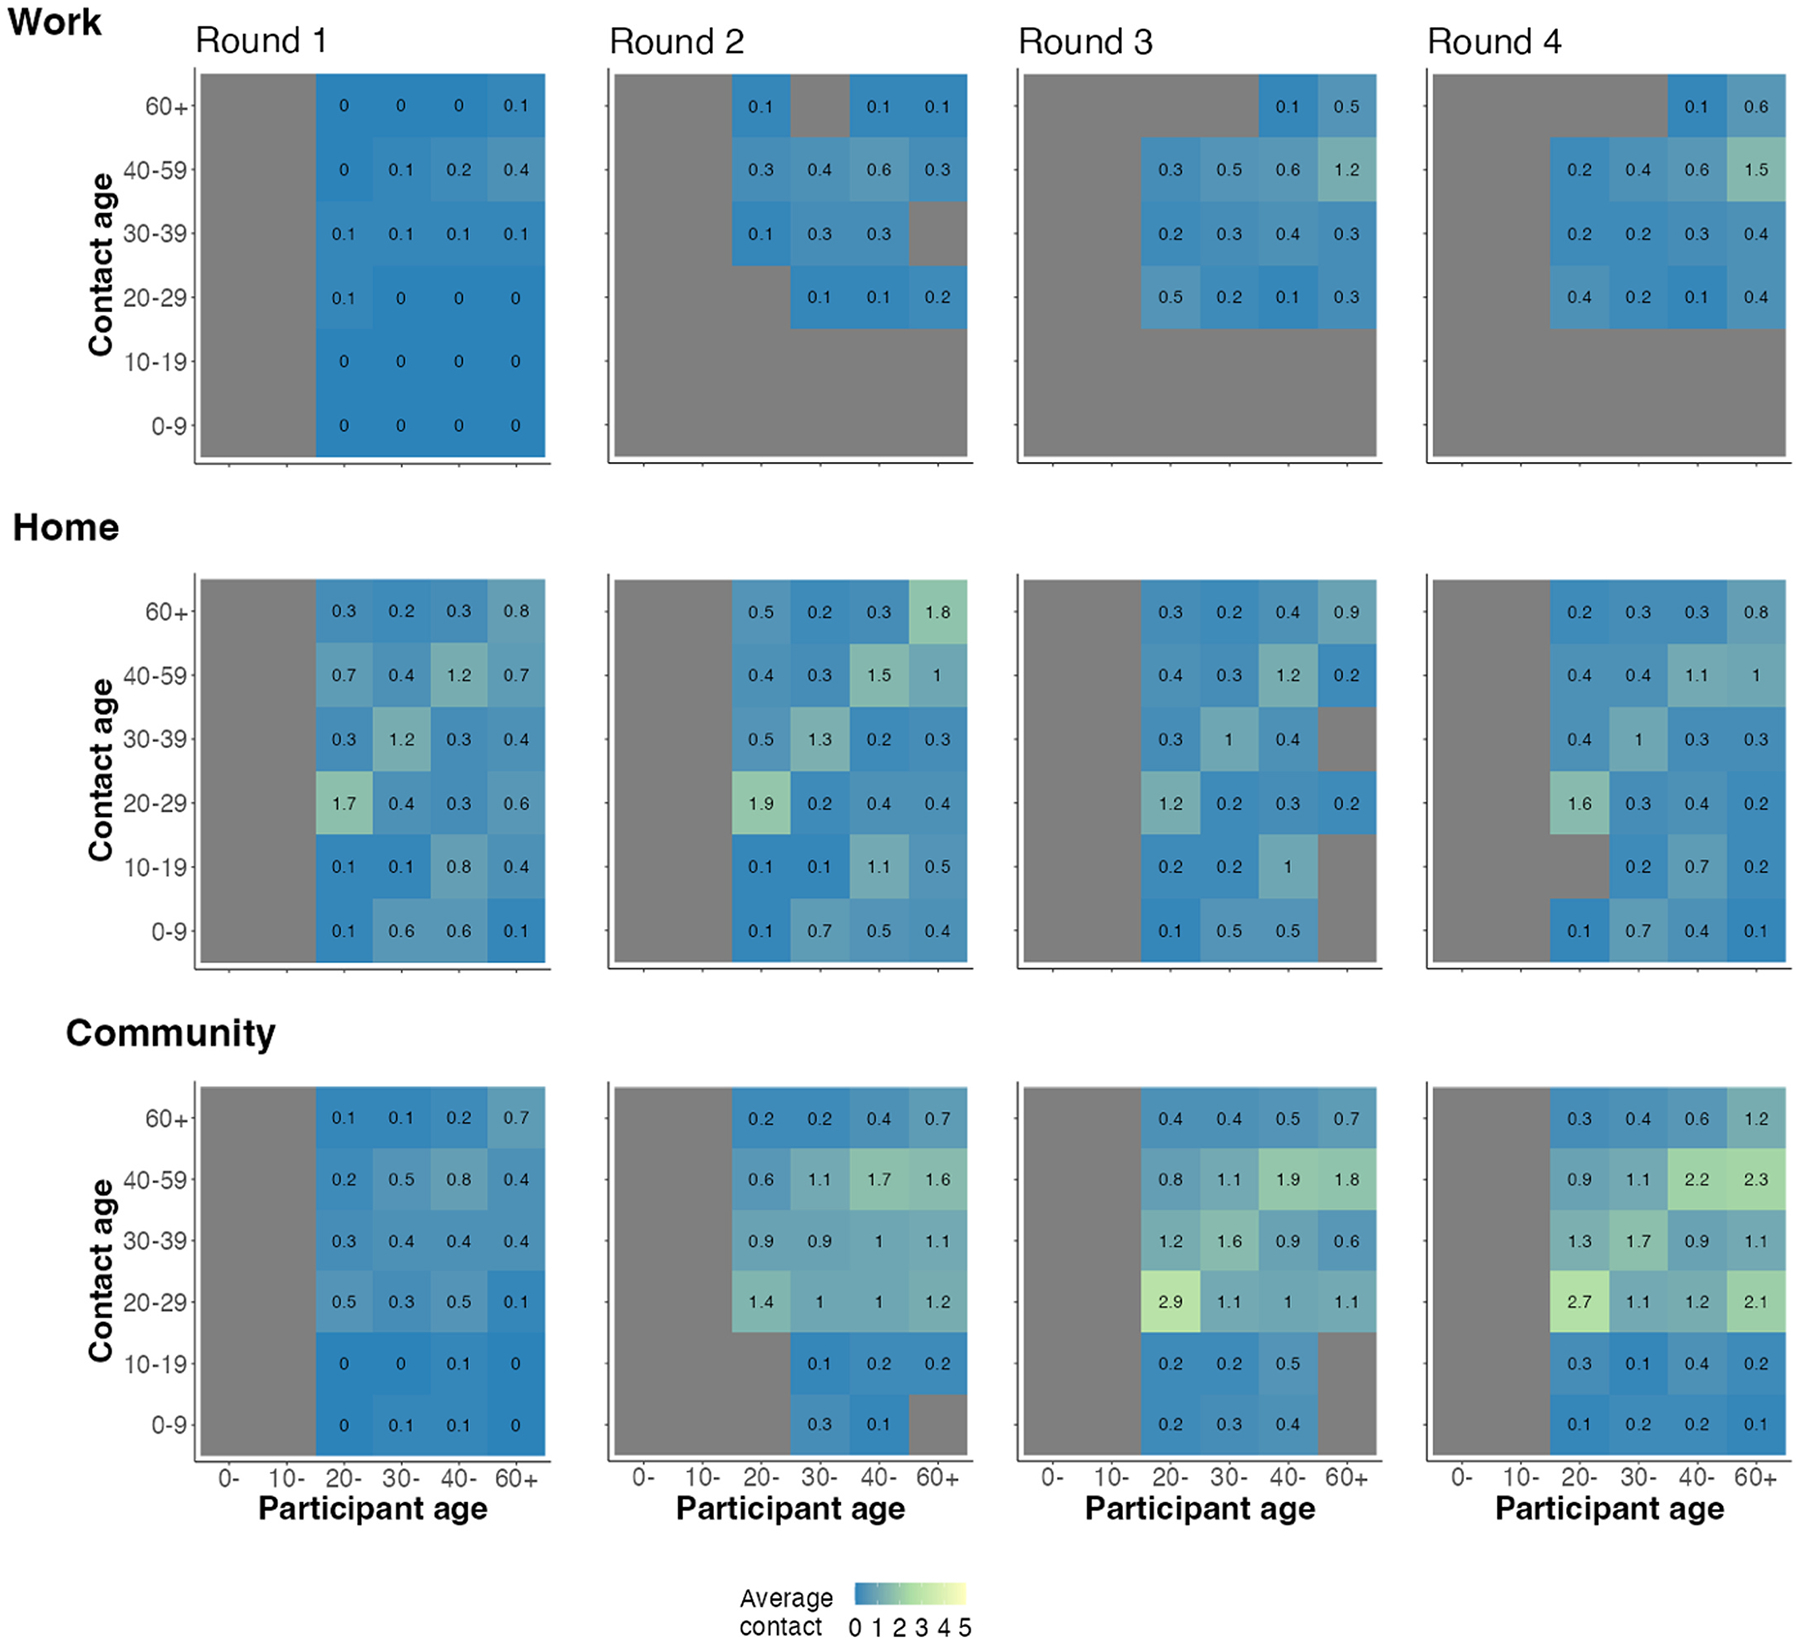
Matrices of mean number of contacts occurring exclusively at work, home, and community across data collection rounds in employees of five US companies. The top panel shows contacts at work across rows, middle panel shows contacts at home, and bottom panel contacts in the community from study rounds 1–4.
2.6. Impact of changing contacts on SARS-CoV-2 transmission potential
We estimate the impact of changing social contact on SARS-CoV-2 transmission. In round 1, reductions in contact relative to pre-pandemic periods suppressed the relative transmissibility to substantially below 1 at work and in the community but had a smaller effect at home. Increases in age-specific contacts between rounds 1 and 4 led to an increase in the relative transmissibility with varying effects across settings (Fig. 5). We estimated relative transmission to increase more at community settings such as stores, parks, and gyms than at work settings across study rounds. For all rounds, we observed that the relative transmissibility at work remained below 1. On the other hand, relative transmissibility in community settings rose after round 1 but stayed similar between rounds 2 through 4 and remained below one.
Fig. 5.
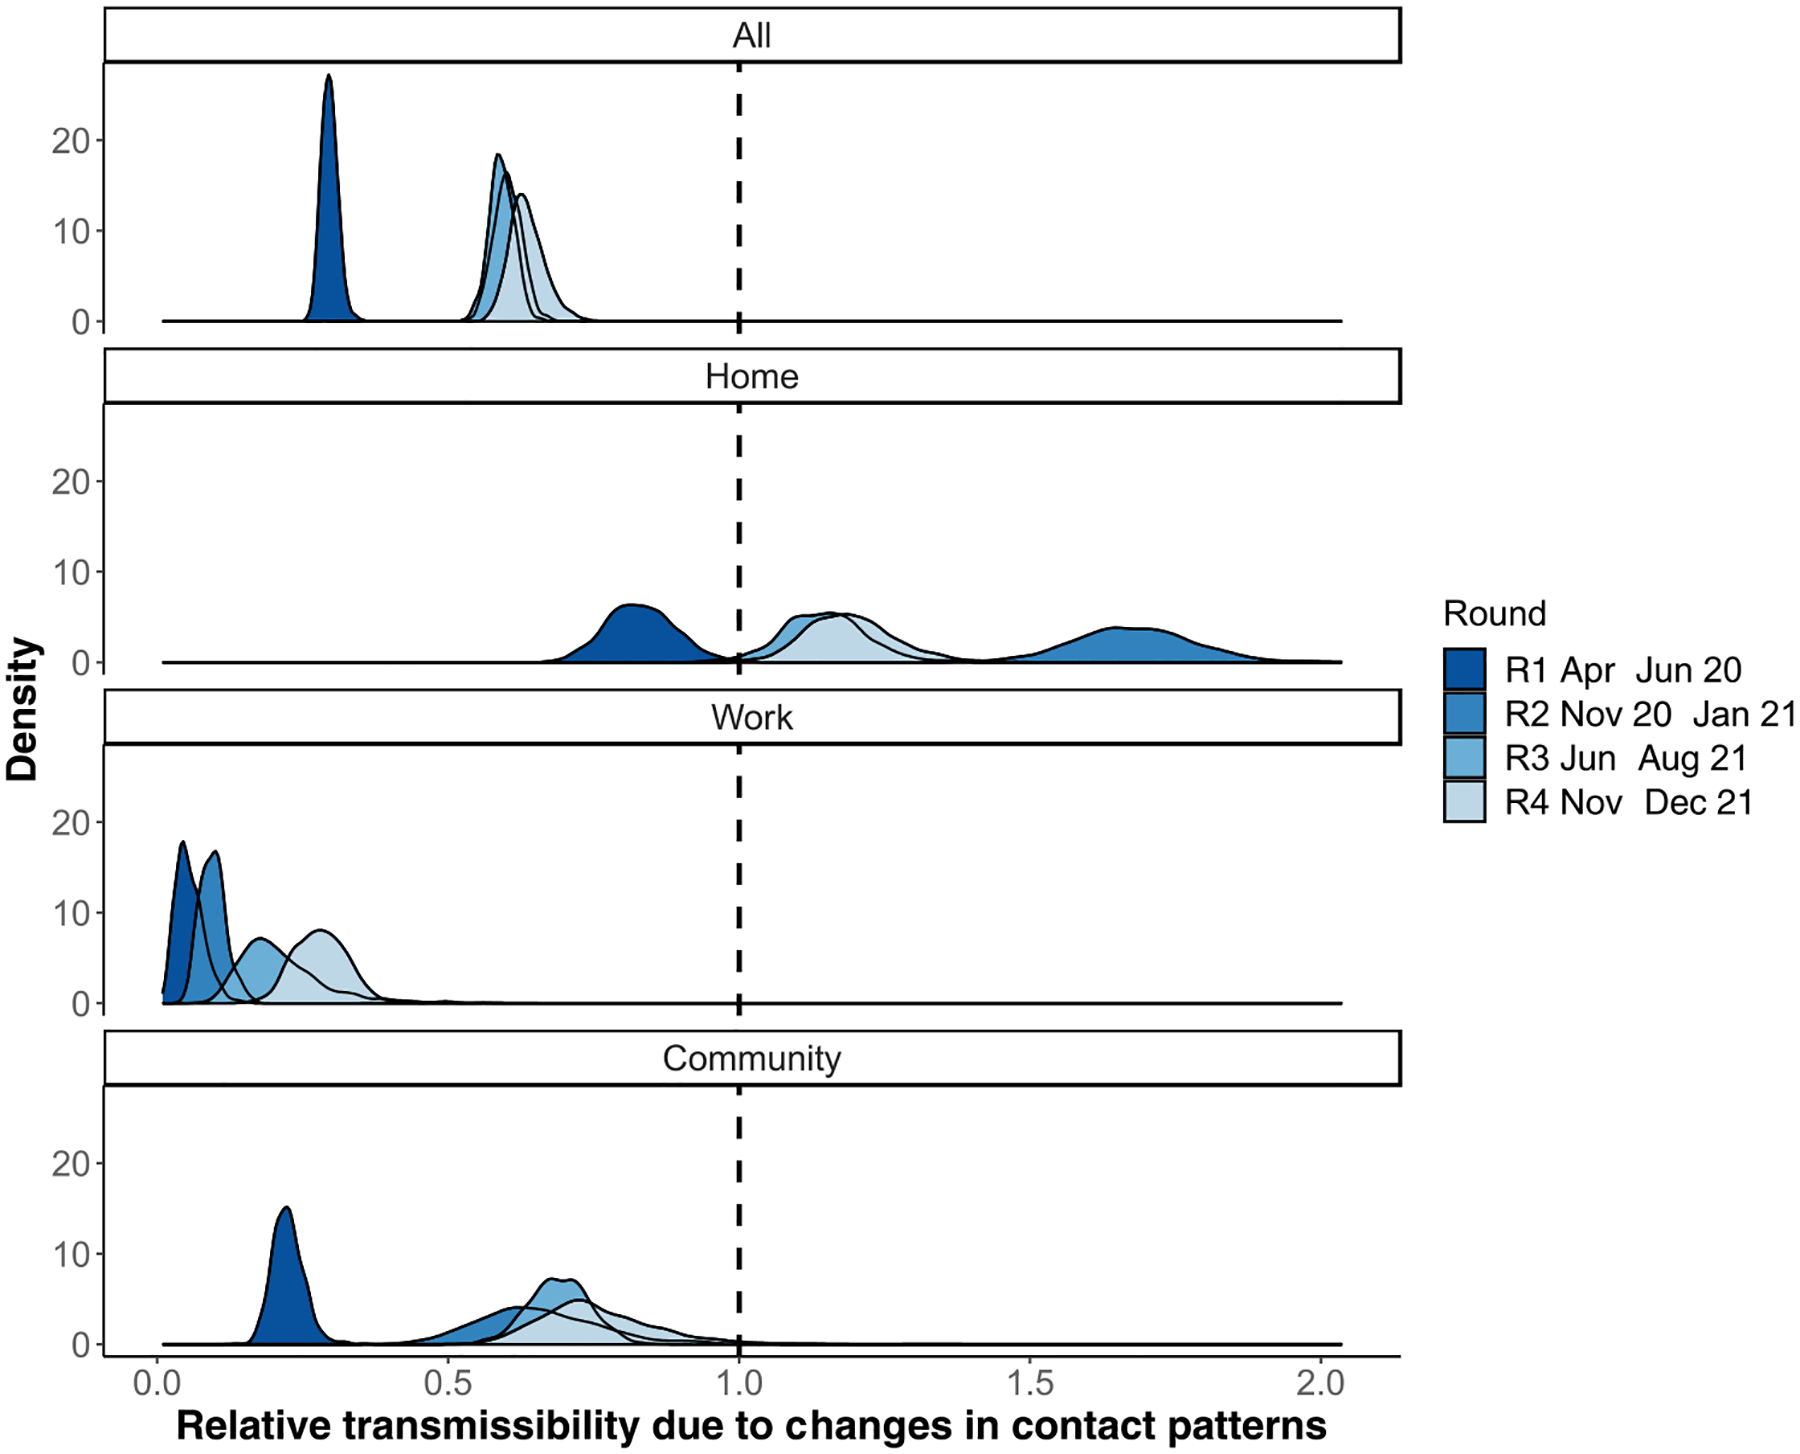
Changes in transmissibility of SARS-CoV-2 due to changes in age–specific contact patterns alone in employees of five US companies. The relative transmissibility is inferred by comparing rounds 1–4 of age-specific contact patterns to projected baseline age-specific matrices for the US (Prem et al., 2017). On the x-axis, 1.0 denotes no change in relative transmissibility, values < 1.0 denote reduced transmissibility and values > 1.0 denote increased transmissibility. The y-axis denotes the probability density.
3. Discussion
This study quantified social contact patterns among workers in selected companies in the US at multiple timepoints during the COVID-19 pandemic period from April 2020 to December 2021. Participants in our study reported a substantial increase in the median number of contacts between April 2020–June 2020 and November 2020–January 2021 across all age groups and in both workplace and community (non-household) settings. Contacts remained high after January 2021. We leveraged these data to estimate the impact of changing social contact patterns on SARS-CoV-2 transmission. In our model, we observed reduced transmissibility of SARS-COV-2 compared to transmission that would have occurred in the absence of physical distancing policies. The extent of reduction differed by setting of contact (home, school, or community). Our new findings suggest that workers reported substantial increases in the rates of contact during the study period which were an independent driver of SARS-CoV-2 transmission.
Overall, contacts were exceptionally low between April–June 2020 (median = 2) coinciding with the stringent containment measures at that time. Employees from all companies we surveyed were working from home and interactions were largely limited to family members or roommates. Contacts peaked in round 2 of data collection from November 2020 to January 2021 (median 8) with the highest percentage increase noted at work. However, the reported average number of contacts remained lower than that compared to pre-pandemic periods captured by the European POLYMOD study with mean contacts ranging between 8 (Germany) to 20 (Italy) (Mossong et al., 2008b). Similarly, by Spring 2021, multiple studies in the US (Nelson et al., 2022; Feehan and Mahmud, 2021a) reported high number of contacts reported at work. Community contacts also increased and became more heterogeneous across time as workers interacted with a wider pool of individuals. However, despite the relaxation of physical distancing policies, the average number of contacts reported per person did not rise above pre-pandemic levels. The mean number of contacts between participants and other individuals aged 0–19 years showed no substantial increases or decrease, suggesting that participants generally maintained the same number of mean contacts with individuals outside work across rounds.
We observed reduced transmission potential in the workplace when more stringent containment measures were in place (April–June 2020) compared to later periods with rollback (round 2–4, from November 2020). Our model suggests increased transmissibility in the home (transmission rate above 1 relative to pre-pandemic periods) and marginally in the community (remaining less than 1) after restrictions were rolled back. Transmissibility at work increased marginally despite significant increases in the number of contacts at work. Increased mobility outside the home and corresponding increases in heterogeneous number of contacts at work compared to earlier pandemic periods have also been observed due to easing of restrictions (Nelson et al., 2022; Gimma et al., 2022). Despite bans on gathering in US states including Georgia, we expected that contacts would have been higher than reported in this study after November 2020 due to increased mobility and home visits, potentially resulting in the infection surges observed after the 2020 Thanksgiving and Christmas holiday periods (Mehta et al., 2021). Our results, highlighting low contact numbers during early phase of the pandemic, are consistent with previous studies in the US (Nelson et al., 2022; Feehan and Mahmud, 2021b), UK (Gimma et al., 2022) and China (Zhang et al., 2020). Studies that collect data on changing contact patterns over time and in various settings remains important at this stage in the pandemic. With the persistence of individuals hesitant to get vaccinated (Yasmin et al., 2021) and the emergence of more transmissible variants (Iuliano et al., 2022), and limited understanding of the extent of SARS-CoV-2 immunity (Fergie and Srivastava, 2021), there remains the need to use empirical social contact data and mathematical models to better inform workplace infection prevention policies such as frequency of testing, work-from-home, and adequate protection for those who cannot telework.
This research has some limitations. First, this was an opt-in survey administered online to employees of five companies in Atlanta, Georgia, thus subject to selection bias. Our study requested company managers to send periodic emails to all staff on their company mailing list. This was different from some other surveys that have used existing population panels (Feehan and Mahmud, 2021a) or conducted random sampling of the population (Nelson et al., 2022; Gimma et al., 2022), with the latter having potentially substantial cost implications and logistic challenges. There is a possibility that emails sent from the company managers were categorized as spam mail thus inhibiting participation. Similar studies should consider requesting the companies to whitelist their domains so that emails are received directly into their email inboxes. We were unable to get the exact number of individuals and demographic composition to whom the survey links was sent so we could not compare the demographic composition of our respondents to the company workforce. However, compared to the US population of adults working in companies with similar occupations, participants aged 20–29 years and 60 + were underrepresented in this study. In addition, our respondents were highly educated, majority White individuals working in private companies. Thus, we cannot claim representativeness of the study sample to the US workforce. However, some of the findings have been shown in other US studies (Nelson et al., 2022), which suggest that the behavior of the current sample does not appear to differ in a meaningful way from a general sample of workers in the USA. To encourage higher survey uptake, we offered a $40.00 gift card upon completion of each survey and held meetings with employees to inform them of study progress and explain the importance of our studies. Lastly, we assumed that the change in transmissibility was due to changes in contact patterns only despite the implementation of other public health interventions including mask wearing and availability of vaccines from round 2 (Nov–Dec 2020). In our estimates for relative transmissibility, we assume a fully susceptible population and that transmissibility of SARS-CoV-2 is invariable by age. Moreover, as no empirical data from the US were available prior to the pandemic, we used published estimates inferred from European contact structure (Prem et al., 2017) which may be less reflective of pre-pandemic contacts in the US. Despite these limitations, our findings on reduced transmission were similar to previous modeling studies.
In conclusion, we present a unique study that observed changing contact patterns among members of a specific sector of the U.S. workforce during the ongoing COVID-19 pandemic. We found that the transmission of SARS-CoV-2 was dependent on setting-specific contact patterns. While the social contact patterns were used to understand changes in human behavior during the SARS-CoV-2 outbreak and its impact on SARS-CoV-2 transmission, these data are also relevant for other endemic pathogens such as influenza that are transmitted through close contacts.
4. Materials and methods
4.1. Experimental design
The objective of this study was to characterize the patterns of social contact and mixing in non-healthcare workplace settings in select large companies in the United States. This was an online cross-sectional study recruiting participants from five private companies based in Georgia, US. These companies include workers falling under the “educational services”, “management occupations”, “business and financial operations occupations”, “computer and mathematical occupations” and “life physical and social science occupations” sectors as defined by the US Bureau of Labor Statistics (Bureau, 2021). Between April 2020 and December 2021, we conducted four rounds of data collection: April–June 2020 (Round 1, abbreviated as R1), November 2020–January 2021 (R2), June–August 2021 (R3), and November–December 2021 (R4). Individuals could participate in multiple rounds. Study periods coincided with periods of active SARS-CoV-2 transmission in the US. R1 represents a transition period of non-pharmaceutical interventions leading to the Stringency Index dropping from highs of 70 in April to < 60 in June (Hale, Thomas). On 1st May 2020, mandatory stay-at-home orders were lifted for persons at minimal risk of infection in the state of Georgia (Moreland et al., 2020) where most of our participants resided and 98% had reported working from home (Kiti et al., 2021). R2 occurred during the large SARS-COV-2 winter wave in 2020 when schools were closed, and masking was mandatory in selected spaces (Hale, Thomas). R3 and R4 occurred when most of the containment measures had been rolled back, and the latter round occurred during the Omicron surge in the winter of 2021 (Iuliano et al., 2022). During R3 and R4, vaccinations were widely available in the US (Pingali et al., 2021).
4.2. Data collection
Recruitment procedures were as described previously for R1 (Kiti et al., 2021). Individuals voluntarily opted into the study. On enrolment, we collected data on participant demographics (age, sex, education, race, job role, family size and composition, current residence, and work setting) and company details (name, office size, teleworking schedule).
One day following enrollment, each participant received a weblink to complete a survey to report the number of individuals with whom they had contact with over two continuous workdays (Monday to Friday). All contacts irrespective of setting were reported. We defined a contact as either proximate (no conversation and no physical contact but within 6 feet of another person for more than 20 s, e.g., sitting next to someone in public transport or standing in line), conversational (a two-way conversation with three or more words exchanged in the physical presence of another person), or physical (directly touching someone (skin-to-skin contact) or the clothes they are wearing, intentionally or unintentionally, including a handshake, fist bump, elbow bump, foot bump, hug, and kiss). The 20–second duration was selected to capture the fastest social interactions between individuals in a social setting (Cattuto et al., 2010). For each contact, participants recorded their age in years (0–9, 10–19, 20–29, 30–39, 40–59, 60 +), sex (male, female), relationship to participant, setting of contact, and participation in perceived higher-risk activities such as attending school, work, indoor/outdoor gatherings, gym, going to restaurants, living in a nursing home, or air travel. Setting of contact was categorized as home, work, and community, whereby community represented all other areas apart from home and work. All other definitions remain the same as reported in R1 (Kiti et al., 2021). The full questionnaire is available in Supplementary Information 1 (SI.5).
4.3. Statistical analyses
All analyses were performed with R v4.1.2. All code and data are available on Github and Zenodo (L. Willem).
4.3.1. Descriptive statistics
We described characteristics of participants by age (20–29, 30–39, 40–49, 50–59 and 60 + years old), sex (male, female), race (Asian, Black, White, Mixed or Other), ethnicity (Hispanic or not), and family structure. Family structure was categorized as living alone, nuclear family (combination of respondent, spouse, and children), extended family (nuclear family plus relatives), or living with unrelated roommates. All companies circulated the survey link to their employees living and working in the USA.
4.3.2. Average contacts
We calculated the median number of contacts per person and their associated interquartile ranges (IQR). We report contacts by age groups, sex, race, ethnicity, family structure and setting of contact. Unless otherwise stated, all analyses in the main text include contact made cumulatively over both survey days. To account for low sample sizes by age and population distribution of employees in similar companies as the ones we surveyed, we computed the mean number of contacts and their s.d. using 1000 bootstraps weighted by age using the socialmixr package in R package (Funk and Willem, 2022).
4.3.3. Contact matrices by age
We divided the age group-specific number of contacts by the number of participants in that age group to get the mean number of age-specific contacts. We computed 1000 bootstraps and weighted the data as described above. Contact matrices were stratified by round and setting of contact. We used four age groups for the participants (20–29, 30–39, 40–59, 60 + years) consistent with R1 data and six age groups for the contacts (0–9, 10–19, 20–29, 30–39, 40–59, 60 + years) (Kiti et al., 2021). We compute matrices of difference between average number of contacts between successive rounds, that is, round 2 – round 1, round 3 – round 2, round 4 – round 3, and overall round 4 – round 1. Positive values signify that there was an increase in the mean number of contacts between age groups between successive rounds. We calculate the proportion of contacts between age groups as the number of contacts reported between ages divided by the total number of contacts per round. We also compute a measure of assortative mixing given by the Q-index (Del Fava et al., 2021). The Q-index has values ranging from – 1–1; values closer to 1 represent assortative mixing while values closer to – 1 represent disassortative mixing.
4.3.4. Impact of social contacts on SARS-COV-2 transmission
We estimated the impact of changing social contact patterns on SARS-CoV-2 transmission by comparing age-specific contact patterns for each round to synthetic pre-pandemic contact rates (henceforth called “baseline”) for the US as derived from projecting estimates from the POLYMOD study onto the U.S. population structure (Prem et al., 2017; Mossong et al., 2008b). Since individuals aged < 20 years old did not participate in our study, we generated square matrices by imputing child – child and child – adult contacts. Imputation was done by using the ratio between the dominant eigenvalues of matrices from each study round to the baseline matrix. As the scaling factor, we took the ratio between the dominant eigenvalues of the baseline and empirical matrices generated from this study, for all age groups present in both studies, stratified by setting.
We used a method published previously (Jarvis et al., 2020) to quantify relative changes in transmission due to changing age-specific social mixing patterns during the pandemic in the UK. Briefly, the Next Generation Matrix (NGM) quantifies the number of secondary infections generated in each age group based on heterogeneous mixing patterns between and within age group (Diekmann et al., 1990). We computed the relative transmissibility as the ratio of the dominant eigenvalues during the study rounds, R0/Rt, where R0 was the dominant eigenvalue of the next generation matrix using baseline age-specific social contact matrix and Rt was the NGM using empirical data over each round. This captures the changes in transmissibility due to changes in mixing patterns. Estimates of relative transmissibility derived from this approach have limitations. We assumed that infectiousness and susceptibility did not vary by age group or by contact location, and that schools remained closed during our study data collection periods and thus we did not account for contacts that may have occurred at school and used contacts projected from POLYMOD onto the U.S. population structure as pre-pandemic empirical estimates are unavailable. We also did not account for the emergence of variants of concern throughout the study period and other factors that impacted the risk of transmission upon contact such as vaccination or physical distancing.
Supplementary Material
Acknowledgments
We thank the employees of the five companies that participated in this study.
Funding
CDC/NCEZID grant 5U01CK00057 (MCK, OGA, AZ, NA, HC, JB, CYL, KNN, SJ, AM, FA, FM, BL, SBO). NIH/NICHD grant 5R01HD097175 (MCK, OGA, AZ, NA, HC, JB, CYL, KNN, SJ, AM, FA, FM, BL, SBO). European Research Council Consolidator Grant IMMUNE Project grant 101003183 (AM).
Footnotes
Ethics statement
I confirm that all methods were performed in accordance with the Declaration of Helsinki. Ethical approval was given by Yale University Institutional Review Board (IRB# 2000026906). All participants signed an electronic informed consent form. Participants received a $40 gift card upon completion and submission of the questionnaire. All data were de-identified before analysis.
CRediT authorship contribution statement
SBO, BL, FA: Funding acquisition. SBO, BL: Conceptualization. MCK, AZ, FM: Validation. MCK, OGA, AZ, NA, CYL, KNN, SJ, AM, FA, FM, BL, SBO: Methodology. MCK, OGA: Investigation. MCK, JB, HC, CYL: Formal analysis. MCK, JB, HC, CYL: Visualization. MCK, OGA, AZ, NA, HC: Supervision. MCK, OGA: Writing—original draft. MCK, OGA, AZ, NA, KNN, SJ, AM, FA, FM, BL, SBO: Writing—review & editing. MCK, HC, JB: Data curation. OGA, AZ, NA, FA: Project administration:
Declaration of Competing Interest
None.
Disclaimer
The findings and conclusions in this report are those of the authors and do not necessarily represent the official position of the Centers for Disease Control and Prevention.
Appendix A. Supporting information
Supplementary data associated with this article can be found in the online version at doi:10.1016/j.epidem.2023.100727.
Data Availability
I have shared a link to my data and code.
References
- Mossong J, Hens N, Jit M, Beutels P, Auranen K, Mikolajczyk R, Massari M, Salmaso S, Tomba GS, Wallinga J, Heijne J, Sadkowska-Todys M, Rosinska M, Edmunds WJ, 2008a. Social contacts and mixing patterns relevant to the spread of infectious diseases. PLoS Med 5, e74. [DOI] [PMC free article] [PubMed] [Google Scholar]
- Kiti MC, Aguolu OG, Liu CY, Mesa AR, Regina R, Woody M, Willebrand K, Couzens C, Bartelsmeyer T, Nelson KN, Jenness S, Riley S, Melegaro A, Ahmed F, Malik F, Lopman BA, Omer SB, 2021. Social contact patterns among employees in 3 U.S. companies during early phases of the COVID-19 pandemic, April to June 2020. Epidemics 36, 100481. [DOI] [PMC free article] [PubMed] [Google Scholar]
- Verelst F, Hermans L, Vercruysse S, Gimma A, Coletti P, Backer JA, Wong KLM, Wambua J, van Zandvoort K, Willem L, Bogaardt L, Faes C, Jarvis CI, Wallinga J, Edmunds WJ, Beutels P, Hens N, 2021. SOCRATES-CoMix: a platform for timely and open-source contact mixing data during and in between COVID-19 surges and interventions in over 20 European countries. BMC Med. 19 (1), 7. [DOI] [PMC free article] [PubMed] [Google Scholar]
- Contreras Z, Ngo V, Pulido M, Washburn F, Meschyan G, Gluck F, Kuguru K, Reporter R, Curley C, Civen R, Terashita D, Balter S, Halai U-A, 2021. Industry sectors highly affected by worksite outbreaks of coronavirus disease, Los Angeles County, California, USA, March 19–September 30, 2020. Emerg. Infect. Dis 27, 1769–1775. [DOI] [PMC free article] [PubMed] [Google Scholar]
- Massetti GM, Jackson BR, Brooks JT, Perrine CG, Reott E, Hall AJ, Lubar D, Williams IT, Ritchey MD, Patel P, Liburd LC, Mahon BE, 2022. Summary of guidance for minimizing the impact of COVID-19 on individual persons, communities, and health care systems — United States, August 2022. MMWR Morb. Mortal. Wkly. Rep 71, 1057–1064. [DOI] [PMC free article] [PubMed] [Google Scholar]
- Madewell ZJ, Yang Y, Longini IM, Halloran ME, Dean NE, 2020. Household transmission of SARS-CoV-2: a systematic review and meta-analysis. JAMA Netw. Open 3, e2031756. [DOI] [PMC free article] [PubMed] [Google Scholar]
- Sun K, Wang W, Gao L, Wang Y, Luo K, Ren L, Zhan Z, Chen X, Zhao S, Huang Y, Sun Q, Liu Z, Litvinova M, Vespignani A, Ajelli M, Viboud C, Yu H, 2021. Transmission heterogeneities, kinetics, and controllability of SARS-CoV-2. Science 371, eabe2424. [DOI] [PMC free article] [PubMed] [Google Scholar]
- Chin T, Feehan DM, Buckee CO, Mahmud AS, 2021. Contact surveys reveal heterogeneities in age-group contributions to SARS-CoV-2 dynamics in the United States, 09.25 medRxiv 2021, 21264082. [Google Scholar]
- Beale S, Hoskins S, Byrne T, Fong WLE, Fragaszy E, Geismar C, Kovar J, Navaratnam AMD, Nguyen V, Patel P, Yavlinsky A, Johnson AM, Van Tongeren M, Aldridge RW, Hayward A, 2022. Workplace contact patterns in England during the COVID-19 pandemic: Analysis of the Virus Watch prospective cohort study. Lancet Reg. Health - Eur 16, 100352. [DOI] [PMC free article] [PubMed] [Google Scholar]
- Liu CY, Berlin J, Kiti MC, Del Fava E, Grow A, Zagheni E, Melegaro A, Jenness SM, Omer SB, Lopman B, Nelson K, 2021. Rapid review of social contact patterns during the covid-19 pandemic. Epidemiology 32, 781–791. [DOI] [PMC free article] [PubMed] [Google Scholar]
- Schuchat A, Covid C, 2020. Public health response to the initiation and spread of pandemic COVID-19 in the United States. Febr. 24–April 21, 2020 69 (6). [DOI] [PMC free article] [PubMed] [Google Scholar]
- Barrero Jose Maria, Bloom Nicholas, Davis Stephen J., Why Working from Home Will Stick. doi: 10.3386/w28731, 2021. [DOI] [Google Scholar]
- Nelson K, Siegler AJ, Sullivan PS, Bradley H, Hall E, Luisi N, Hipp-Ramsey P, Sanchez T, Shioda K, Lopman B, Nationally Representative Social Contact Patterns in the United States, August 2020-April 2021. medRxiv, 2021.09.22.21263904 (2021). [DOI] [PMC free article] [PubMed] [Google Scholar]
- Hale Thomas, Atab Tilve, Hallas Laura, Kira Beatriz, Phillips Toby, Petherick Anna, Annalena Pott, “Variation in US states’ responses to COVID-19″ (3.0, University of Oxford); 〈www.bsg.ox.ac.uk/covidtracker〉.
- Funk S, Willem L, socialmixr: Social Mixing Matrices for Infectious Disease Modelling., (2022); 〈https://github.com/epiforecasts/socialmixr〉.
- Prem K, Cook AR, Jit M, 2017. Projecting social contact matrices in 152 countries using contact surveys and demographic data. PLoS Comput. Biol 13, 1–21. [DOI] [PMC free article] [PubMed] [Google Scholar]
- Mossong J, Hens N, Jit M, Beutels P, Auranen K, Mikolajczyk R, Massari M, Salmaso S, Tomba GS, Wallinga J, Heijne J, Sadkowska-Todys M, Rosinska M, Edmunds WJ, 2008b. Social contacts and mixing patterns relevant to the spread of infectious diseases. PLoS Med. 5, 0381–0391. [DOI] [PMC free article] [PubMed] [Google Scholar]
- Nelson KN, Siegler AJ, Sullivan PS, Bradley H, Hall E, Luisi N, Hipp-Ramsey P, Sanchez T, Shioda K, Lopman BA, 2022. Nationally representative social contact patterns among U.S. adults, August 2020-April 2021. Epidemics 40, 100605. [DOI] [PMC free article] [PubMed] [Google Scholar]
- Feehan DM, Mahmud AS, 2021a. Quantifying population contact patterns in the United States during the COVID-19 pandemic. Nat. Commun 12. [DOI] [PMC free article] [PubMed] [Google Scholar]
- Gimma A, Munday JD, Wong KLM, Coletti P, van Zandvoort K, Prem K, 2022. CMMID COVID-19 working group, Klepac P, Rubin GJ, Funk S, Edmunds WJ, Jarvis CI, Changes in social contacts in England during the COVID-19 pandemic between March 2020 and March 2021 as measured by the CoMix survey: A repeated cross-sectional study. PLoS Med 19, e1003907. [DOI] [PMC free article] [PubMed] [Google Scholar]
- Mehta SH, Clipman SJ, Wesolowski A, Solomon SS, 2021. Holiday gatherings, mobility and SARS-CoV-2 transmission: results from 10 US states following Thanksgiving. Sci. Rep 11, 17328. [DOI] [PMC free article] [PubMed] [Google Scholar]
- Feehan DM, Mahmud A, 2021b. Quantifying interpersonal contact in the United States during the spread of COVID-19: first results from the Berkeley Interpersonal Contact Study. Nat. Commun 12, 8.33397891 [Google Scholar]
- Zhang J, Litvinova M, Liang Y, Wang Y, Wang W, Zhao S, Wu Q, Merler S, Viboud C, Vespignani A, Ajelli M, Yu H, 2020. Changes in contact patterns shape the dynamics of the COVID-19 outbreak in China. Science 368, 1481–1486. [DOI] [PMC free article] [PubMed] [Google Scholar]
- Yasmin F, Najeeb H, Moeed A, Naeem U, Asghar MS, Chughtai NU, Yousaf Z, Seboka BT, Ullah I, Lin C-Y, Pakpour AH, 2021. COVID-19 Vaccine Hesitancy in the United States: A Systematic Review. Front. Public Health 9, 770985. [DOI] [PMC free article] [PubMed] [Google Scholar]
- Iuliano AD, Brunkard JM, Boehmer TK, Peterson E, Adjei S, Binder AM, Cobb S, Graff P, Hidalgo P, Panaggio MJ, Rainey JJ, Rao P, Soetebier K, Wacaster S, Ai C, Gupta V, Molinari N-AM, Ritchey MD, 2022. Trends in disease severity and health care utilization during the early omicron variant period compared with previous SARS-CoV-2 high transmission periods — United States, December 2020–January 2022. MMWR Morb. Mortal. Wkly. Rep 71, 146–152. [DOI] [PMC free article] [PubMed] [Google Scholar]
- Fergie J, Srivastava A, 2021. Immunity to SARS-CoV-2: lessons learned. Front. Immunol 12, 654165. [DOI] [PMC free article] [PubMed] [Google Scholar]
- U.S. Bureau of Labor Statistics, 2021. 〈https://www.bls.gov〉.
- Moreland A, Herlihy C, Tynan MA, Sunshine G, McCord RF, Hilton C, Poovey J, Werner AK, Jones CD, Fulmer EB, Gundlapalli AV, Strosnider H, Potvien A, García MC, Honeycutt S, Baldwin G,, CDC Public Health Law Program, CDC COVID-19 Response Team, Mitigation Policy Analysis Unit, CDC Public Health Law Program, Clodfelter C, Howard-Williams M, Jeong G, Landsman L, Shelburne J, , CDC COVID-19 Response Team, Mitigation Policy Analysis Unit, Brown A, Cramer R, Gilchrist S, Hulkower R, Limeres A, Popoola A, 2020. Timing of state and territorial COVID-19 stay-at-home orders and changes in population movement — United States, March 1–May 31, 2020. MMWR Morb. Mortal. Wkly. Rep 69, 1198–1203. [DOI] [PMC free article] [PubMed] [Google Scholar]
- Pingali C, Meghani M, Razzaghi H, Lamias MJ, Weintraub E, Kenigsberg TA, Klein NP, Lewis N, Fireman B, Zerbo O, Bartlett J, Goddard K, Donahue J, Hanson K, Naleway A, Kharbanda EO, Yih WK, Nelson JC, Lewin BJ, Williams JTB, Glanz JM, Singleton JA, Patel SA, 2021. COVID-19 vaccination coverage among insured persons aged ≥16 years, by race/ethnicity and other selected characteristics — eight integrated health care organizations. U. S, Dec. 14, 2020–May 15, 2021 70 (6). [DOI] [PMC free article] [PubMed] [Google Scholar]
- Cattuto C, van den Broeck W, Barrat A, Colizza V, Pinton JF, Vespignani A, 2010. Dynamics of person-to-person interactions from distributed RFID sensor networks. PLoS ONE 5, 1–9. [DOI] [PMC free article] [PubMed] [Google Scholar]
- Willem L, Hoang TV, Funk S, Coletti P, Beutels P, Hens N, SOCRATES: An online tool leveraging a social contact data sharing initiative to assess mitigation strategies for COVID-19. 11. [DOI] [PMC free article] [PubMed] [Google Scholar]
- Del Fava E, Adema I, Kiti MC, Poletti P, Merler S, Nokes DJ, Manfredi P, Melegaro A, 2021. Individual’s daily behaviour and intergenerational mixing in different social contexts of Kenya. Sci. Rep 11. [DOI] [PMC free article] [PubMed] [Google Scholar]
- Jarvis CI, van Zandvoort K, Gimma A, Prem K, Klepac P, James RG, Edmonds JW, 2020. Quantifying the impact of physical distance measures on the transmission of COVID-19 in the UK. BMC Med. 18, 21. [DOI] [PMC free article] [PubMed] [Google Scholar]
- Diekmann O, Heesterbeek JAP, Metz JAJ, 1990. On the definition and the computation of the basic reproduction ratio R0 in models for infectious diseases in heterogeneous populations. J. Math. Biol 28, 365–382. [DOI] [PubMed] [Google Scholar]
Associated Data
This section collects any data citations, data availability statements, or supplementary materials included in this article.
Supplementary Materials
Data Availability Statement
I have shared a link to my data and code.