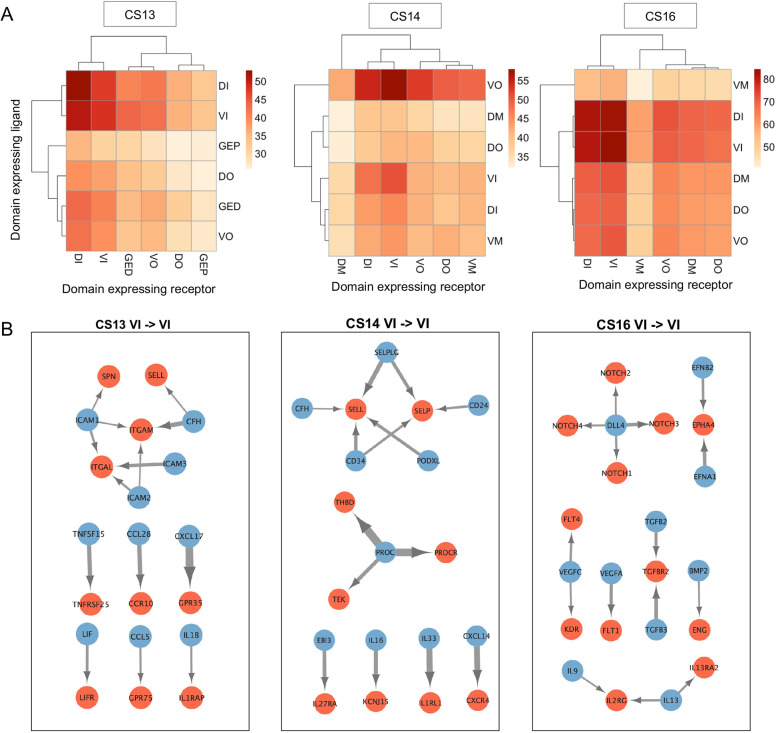
Fig. 4.
Stage-specific molecular interactions within the AoV during IAHC/HSC formation. (A) Heatmap of the number of predicted ligand-receptor interactions between spatial domains for CS13, CS14 and CS16 (detection threshold 0.2). DI, dorsal inner; DM, dorsal mid; DO, dorsal outer; GED, gonadal epithelium distal; GEP, gonadal epithelium proximal; VI, ventral inner; VM, ventral mid; VO, ventral outer. (B) Network map of top ligand (blue)-receptor (red) interactions for VI→VI for CS13, CS14 and CS16. Arrow width correlates with specificity score.

