

Summary
Ferroptosis, an iron-dependent programmed cell death triggered by excessive lipid peroxidation, has shown promising therapeutic potentials in human diseases. Here, we describe a protocol of a CRISPR-Cas9 loss-of-function screen to identify regulators in response to different inducers of ferroptosis. We emphasize the steps of library amplification, drug treatment, high-throughput sequencing preparation, and bioinformatics analysis using model-based analysis of genome-wide CRISPR-Cas9 knockout (MAGeCK). We also present a method to discover the regulators of ferroptosis and verify the potential targets efficiently.
For complete details on use and execution of this protocol, please refer to Yang et al. (2023).1
Subject areas: Bioinformatics, Sequence analysis, Cell Biology, Cell culture, Cell-based Assays, Sequencing, Molecular Biology, CRISPR
Graphical abstract
Highlights
-
•
Detailed instructions for performing CRISPR-Cas9 screen
-
•
Cell death-based screen using four ferroptosis-inducing conditions
-
•
Instructions for high-throughput sequencing preparation and for analysis using MAGeCK
-
•
Detailed examples for target selection from different ferroptosis induction screens
Publisher’s note: Undertaking any experimental protocol requires adherence to local institutional guidelines for laboratory safety and ethics.
Ferroptosis, an iron-dependent programmed cell death triggered by excessive lipid peroxidation, has shown promising therapeutic potentials in human diseases. Here, we describe a protocol of a CRISPR-Cas9 loss-of-function screen to identify regulators in response to different inducers of ferroptosis. We emphasize the steps of library amplification, drug treatment, high-throughput sequencing preparation, and bioinformatics analysis using model-based analysis of genome-wide CRISPR-Cas9 knockout (MAGeCK). We also present a method to discover the regulators of ferroptosis and verify the potential targets efficiently.
Before you begin
Libraries introduced in this protocol can be obtained from Addgene. The following two libraries have been shown to be efficient to identify regulators of ferroptosis. Liu Human CRISPR Knockout Library targets 18,436 human genes with 185,634 sgRNAs, composed of two sub-libraries (H1 and H2, five gRNAs per gene in each sub-libraries). Human CRISPR Metabolic Gene Knockout Library targets 2,981 human metabolic genes with 29,790 guide RNAs.2 Importantly, high-quality amplification of the libraries and packaging of the lentivirus are essential for the success of screening. Alternatively, researchers can obtain pre-packaged lentivirus directly from Addgene.
Although we recommend conducting the screening in specific specialized libraries (e.g., the metabolic gene knockout library), by using a genome-wide library, many unexpected targets are identified. Nevertheless, researchers need to modify the experimental procedures by using different libraries. For example, there are significant differences in the resources required during the experimental procedures, such as supplies for cell culture, commercial kits usage, the depth of sequencing et al. between genome-wide and specialized libraries. Moreover, different libraries use different backbones and systems for the transduction of sgRNAs. Thus, the detailed procedures, particularly the PCR steps to amplify sgRNA, may vary. We provide two first-step PCR P7 primers suitable for the backbone of LentiCrispr-V1 and LentiCrispr-V2 (Step 28). We also provide a single plasmid system without fluorescence-based selection, which makes it suitable to perform multiple screenings using various conditions and drugs to induce ferroptosis simultaneously (Figure 1).
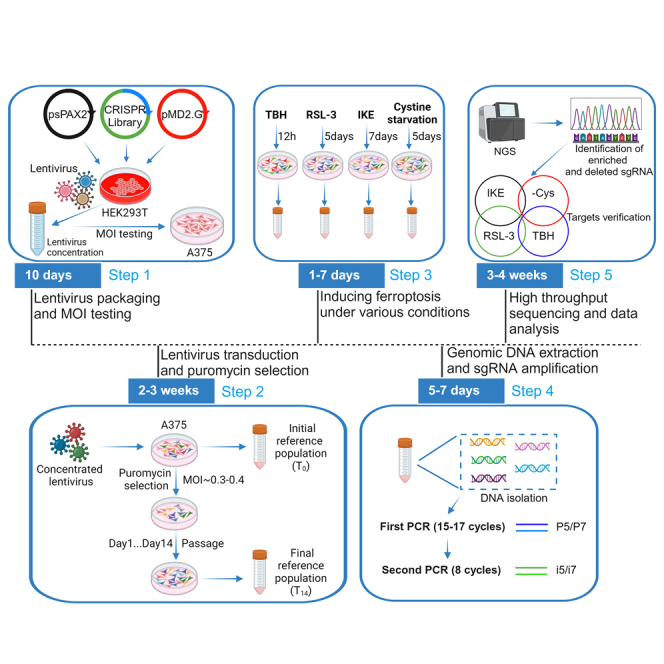
Figure 1.

Timeline of the screening for the regulators of ferroptosis
Experiments
Library amplification
Timing: 2–3 days
-
1.
Thaw ElectroMAX Stbl4 cells on ice.
-
2.
Add 1 μL library DNA (50 ng/μL) to a 1.7 mL Eppendorf tube.
-
3.
Add 50 μL Stbl4 cells into the tube containing library DNA, mix gently, and incubate for 1 min on ice.
-
4.
Pipette the DNA/cell mixture into a 2 mm cuvette and put the cuvette into Bio-Rad Gene Pluser Xcell Electroporation System.
Note: Electroporation conditions: 2.4 kV, 25 μF, 200 Ω.
-
5.
Remove the cuvette from the chamber and immediately add 1 mL pre-heated (37°C) S.O.C broth.
-
6.
Gently resuspend the cells with a Pasteur pipette and transfer the solution to a 15-mL centrifuge tube.
-
7.
Incubate the tube at 37°C for 1 h with shaking at 225–250 rpm.
-
8.
Prewarm LB agar plates at 37°C (15-cm Petri plate) for colony formation and determination of transformation efficiency.
-
9.
After the recovery period of the transformation, dilute the transformed cells first by adding 10 μL of the pooled cells to 990 μL of S.O.C broth to make a 100-fold dilution, followed by adding 100 μL of the 100-fold dilution to 900 μL of S.O.C broth to make a 1,000-fold dilution.
-
10.
Plate 100 μL of the 1,000-fold dilution on a pre-warmed LB agar plate.
Note: This is a 10,000-fold dilution of the total transformation to estimate the transformation efficiency. We recommend performing a triplicate of 10,000-fold dilution to ensure the determination of accurate transformation efficiency.
-
11.
Mix 4 mL S.O.C broth to the pooled transformed cells.
-
12.
Spread the electroporated cells on pre-warmed 15-cm LB plates containing 100 μg/mL ampicillin and incubate at 37°C for 20 h.
Note: The number of plates used is based on the number of sgRNAs in the library. We recommend 100 15-cm LB plates for the Liu Human CRISPR Knockout Library H2 and 35 15-cm LB plates for the Human CRISPR Metabolic Gene Knockout Library.
-
13.
Count the colonies on the 10,000-fold dilution plate(s).
Note: The number of colonies × 10,000 = the total number of colonies. Proceed to the next step only if the total number of colonies is greater than 20 per sgRNA in the library. For example, for Liu Human CRISPR Knockout Library, the colonies over 185 (92817 × 20/10000) per plate could be defined as good efficiency. If this efficiency is not achieved, discard plates and transform the library again.
-
14.
Collect all colonies: pipette 2 mL LB medium onto each 15-cm LB plate and scrape all colonies off with a cell lifter.
-
15.
After collection, weigh the bacteria and split them into 0.4 g per tube per sample.
-
16.
Perform a library plasmid extraction step using the QIAGEN Plasmid Maxi Kit (link: https://www.qiagen.com/us/products/discovery-and-translational-research/dna-rna-purification/dna-purification/plasmid-dna/qiagen-plasmid-kits).
-
17.
Determine the concentration of the library DNA by NanoDrop and send the prepared library for deep sequencing following the procedures in “preparation for high-throughput sequencing.”
-
18.
Analyze the sgRNA coverage of the library according to Step 35 and define the sgRNA coverage by 100% minus the percentage of missing sgRNA in the library.
CRITICAL: High coverage of sgRNAs in the library (typically higher than 95%) is required for effective screening.
Determining the conditions to induce ferroptosis
Different cell lines have different sensitivity to ferroptosis, depending on the status of intracellular pro- and anti-ferroptosis pathways.3,4 Prior to the screening experiment, we recommend determining the conditions to induce ferroptosis. We typically choose the conditions that cause around 75% of cell death. In this protocol, we use four ferroptosis-inducing conditions: 1) RSL-3, a GPX4 inhibitor5; 2) imidazole ketone erastin (IKE), a second-generation SLC7A11 inhibitor, which restrains the import of cystine into cells6; 3) cystine starvation7; 4) tert-butyl hydroperoxide (TBH), an organic peroxide to generate reactive oxygen species (ROS), which has been shown to induce ferroptosis efficiently.8 All four treatments induce ferroptosis by elevating lipid peroxidation levels, which can be inhibited by ferroptosis inhibitors, e.g., ferrostatin-1 (Ferr-1), liproxstatin-1 (Lipro-1), or deferoxamine (DFO), an iron-chelating compound.
-
19.Determine the cell death upon RSL-3, IKE, and TBH treatment.
-
a.On day 0, seed A375 cells onto a 96-well plate with 5,000 cells and 90 μL final volume of each well.Note: We provide examples of the screening under optimized conditions to induce ferroptosis using human melanoma A375 cells, a preferred cell line to study ferroptosis by our lab. There are two advantages to using A375 as the cell line for CRISPR-Cas9 screens: 1) A375 cells are sensitive to various ferroptosis inducers; 2) A375 cells have high proliferation rates (the doubling time of wild-type A375 cells is around 18 h) under standard cell culture conditions.CRITICAL: Use a certified sterile hood, sterilized equipment, and solutions to maintain aseptic conditions when working with cells.
-
b.On day 1, after 16 h of incubation, add 10 μL of 10× concentrated indicated drugs into the 96-well plate to achieve the final concentration needed for the treatment.
-
c.Determine the cell death after the designated treatment time.Note: 12 h for TBH treatment, 48 h for RSL-3 treatment, and 24 h for IKE treatment.
-
i.Equilibrate the plate and CellTiter-Glo 2.0 reagent to 25°C for approximately 30 min.
-
ii.Add 100 μL CellTiter-Glo 2.0 reagent into every well.
-
iii.Record luminescence according to the manufacturer’s protocol (link: https://www.promega.com/products/cell-health-assays/cell-viability-and-cytotoxicity-assays/celltiter_glo-2_0-assay).Note: Based on this protocol, investigators need to adjust the conditions when using different types of cell lines, especially those rare tumor cell lines and cell lines of other disease models.
-
i.
-
a.
-
20.Determine the cell death upon cystine starvation treatment.
-
a.Seed A375 cells onto a 96-well plate with 5,000 cells using media containing cystine at the indicated concentration.
-
b.Determine the cell death after 36 h of incubation.
-
i.Equilibrate the plate and CellTiter-Glo 2.0 reagent to 25°C for approximately 30 min.
-
ii.Add 100 μL CellTiter-Glo 2.0 reagent into every well.
-
iii.Record luminescence according to the manufacturer’s protocol.
-
i.
-
a.
-
21.
Calculate the percentage of cell viability by comparing the luminescence of the treated group to the luminescence of the untreated group.
-
22.
Use nonlinear regression analysis to measure the fit curves of cell viability and calculate the IC50 value by GraphPad Prism 8.0.
Note: Long-term treatment may enlarge the edge effects of 96-well plates; thus, any anomalous outcomes from edge wells should be carefully documented and, if necessary, excluded from the analysis. We also recommend repeating these cell viability assays using the sgRNA-expressing pool cells. Because after puromycin selection, the sensitivity of A375 sgRNA-expressing pool cells to ferroptosis induction may change compared to parental A375 cells.
Note: Although all induction conditions trigger ferroptosis consistently, the underlying mechanisms are different (Figure 2A). Based on recent studies, Acyl-CoA synthetase long chain family member 4 (ACSL4) and peroxisomes contribute to the synthesis of phosphatidylethanolamine (PE) and ether phospholipid (ePL) with polyunsaturated fatty acyl tails (PUFAs), which are the main substrates for GPX4 activity.9,10,11 It is unsurprising that ACSL4 is the top hit in the screens upon RSL-3 treatment. However, ferroptosis under cystine-deprived conditions is more complicated because not only the cystine import and GSH synthesis are inhibited, but the pathways dependent on cystine are also blocked, such as the ROS elimination pathways and imbalanced Fe-S clusters et al.12 Although IKE has the same effects as cystine starvation, which blocks the cystine import, the top hit of IKE treatment is again ACSL4, indicating the multifaceted roles of ACSL4 upon cystine starvation and IKE treatment.1 Last, TBH-induced ferroptosis is independent of ACSL4 status.13 It is well-established that ACSL4-dependent PUFA-PE synthesis and AGPAT3-dependent PUFA-ePL synthesis play an important role in GPX4 inactivation-induced ferroptosis.9,10,11 TBH-induced ferroptosis provides the opportunity to study the involvement of undescribed mechanisms. Given the tight relationship between stress response and elevated ROS, ferroptosis induced by TBH, the ROS mimic reagent, requires further investigation (Figure 2A). Upon IKE, RSL-3, TBH, or cystine starvation treatment for an indicated time, typical ferroptotic morphology can be observed, including narrowing ER area and ballooning of the plasma membrane (Figures 2B and 2D). Cell viability curves of A375 cells were obtained, from which the dosage to cause 75% cell death was determined (Figures 2C and 2E–2G). Under these conditions, we found the most significant differences in sgRNA abundance between ferroptosis-resistant and ferroptosis-sensitive cells.
Figure 2.

Determining the conditions of ferroptosis inducers
(A) Model demonstrating the crucial regulators of ferroptosis and the mechanisms of drugs used in this protocol.
(B) Representative bright-field images of A375 cells treated with 200 μM TBH without or with DFO (50 μM) for 8 h. Scale bars, 100 μm.
(C) Cell viability of A375 cells upon TBH treatment for 12 h.
(D) Representative bright-field images of A375 cells treated with 2.5 μM IKE, 0.5 μM RSL-3, or 1 μM cystine-containing media without or with DFO (50 μM) for 24 h. Scale bars, 100 μm.
(E) Cell viability of A375 cells upon RSL-3 treatment for 48 h.
(F) Cell viability of A375 cells upon IKE treatment for 24 h.
(G) Cell viability of A375 cells cultured in 1 μM cystine-containing media for 36 h.
(H) Timeline of TBH, IKE, RSL-3, or cystine starvation treatments.
For (C), (E), (F), and (G), data are represented as mean ± SD.
Key resources table
| REAGENT or RESOURCE | SOURCE | IDENTIFIER |
|---|---|---|
| Bacterial strains | ||
| ElectroMAX Stbl4 competent cells | Thermo Fisher Scientific | 11635018 |
| Chemicals, peptides, and recombinant proteins | ||
| Dulbecco’s modified Eagle’s medium (DMEM) | Corning | 10-013-CV |
| Glutamine, methionine, and cystine-deficient DMEM | Thermo Fisher Scientific | 21013024 |
| Fetal bovine serum (FBS) | Gibco | 10437-028 |
| Penicillin-Streptomycin (10,000 U/mL) | Gibco | 15140-122 |
| Phosphate-buffered saline 10× | Corning | 46-013-CM |
| Pure ethanol 200 proof | Decon Labs | 2071 |
| Nuclease-free water | Cytiva | SH30538.02 |
| DNA ladder | NEB | N0550L |
| GelPilot DNA loading dye, 5× | QIAGEN | 239901 |
| Agarose | Thermo Fisher Scientific | BP1356 |
| Puromycin dihydrochloride | Sigma-Aldrich | P9620; CAS: 58-58-2 |
| Cystine | Sigma-Aldrich | C7602; CAS: 56-89-3 |
| Methionine | Sigma-Aldrich | M5308; CAS: 63-68-3 |
| Glutamine | Sigma-Aldrich | G8540; CAS: 56-85-9 |
| Tert-butyl hydroperoxide (TBH) | Sigma-Aldrich | 458139; CAS: 75-91-2 |
| Imidazole ketone erastin (IKE) | MedChemExpress | HY-114481; CAS:1801530-11-9 |
| 1S,3R-RSL-3 | Sigma-Aldrich | SML2234; CAS:1219810-16-8 |
| SYTOX green dead cell stain | Thermo Fisher Scientific | S34860; CAS: 2383063-37-2 |
| Lipofectamine CRISPRMAX Cas9 | Thermo Fisher Scientific | CMAX00015 |
| Polyethylenimine, linear, MW 25,000 (PEI) | Polysciences | 23966-1 |
| TrueCut Cas9 protein v2 | Thermo Fisher Scientific | A36498 |
| Critical commercial assays | ||
| CellTiter-Glo 2.0 cell viability assay | Promega | G9243 |
| Wizard Genomic DNA Purification Kit | Promega | A1120 |
| QIAquick PCR Purification Kit | QIAGEN | 28104 |
| QIAquick Gel Extraction Kit | QIAGEN | 28706 |
| Plasmid Maxi Kit | QIAGEN | 12163 |
| Lenti-X concentrator | Takara | 631232 |
| Deposited data | ||
| RSL-3 and IKE CRISPR-screen results | Yang et al., 20231 | Mendeley data https://doi.org/10.17632/8mxhzbr3v3.1 |
| TBH and cystine starvation CRISPR-screen results | This study | Mendeley data https://doi.org/10.17632/65pfcj4j4m.1 |
| Experimental models: Cell lines | ||
| Human: HEK293T | ATCC | CRL-3216 |
| Human: A375 | ATCC | CRL-1619 |
| Oligonucleotides | ||
| P5 | N/A | TCGTCGGCAGCGTCAGATG TGTATAAGAGACAGTTGT GGAAAGGACGAAACACCG |
| P7-lentiCrispr V1 | N/A | GTCTCGTGGGCTCGGAGATGT GTATAAGAGACAGTCTACTATT CTTTCCCCTGCACTGT |
| P7-lentiCrispr V2 | N/A | GTCTCGTGGGCTCGGAGATGT GTATAAGAGACAGCCAATTCC CACTCCTTTCAAGACCT |
| i5 index N502 | N/A | AATGATACGGCGACCACCGAGATCT ACACCTCTCTATTCGTCGGCAGCGTC |
| i5 index N503 | N/A | AATGATACGGCGACCACCGAGATCTA CACTATCCTCTTCGTCGGCAGCGTC |
| i5 index N505 | N/A | AATGATACGGCGACCACCGAGATCT ACACGTAAGGAGTCGTCGGCAGCGTC |
| i5 index N506 | N/A | AATGATACGGCGACCACCGAGATCTA CACACTGCATATCGTCGGCAGCGTC |
| i5 index N507 | N/A | AATGATACGGCGACCACCGAGATCTA CACAAGGAGTATCGTCGGCAGCGTC |
| i7 index N701 | N/A | CAAGCAGAAGACGGCATACGAGAT TCGCCTTAGTCTCGTGGGCTCGG |
| i7 index N702 | N/A | CAAGCAGAAGACGGCATACGAGA TCTAGTACGGTCTCGTGGGCTCGG |
| i7 index N703 | N/A | CAAGCAGAAGACGGCATACGAGAT TTCTGCCTGTCTCGTGGGCTCGG |
| i7 index N704 | N/A | CAAGCAGAAGACGGCATACGAGA TGCTCAGGAGTCTCGTGGGCTCGG |
| i7 index N705 | N/A | CAAGCAGAAGACGGCATACGAGATA GGAGTCCGTCTCGTGGGCTCGG |
| i7 index N706 | N/A | CAAGCAGAAGACGGCATACGAGATCA TGCCTAGTCTCGTGGGCTCGG |
| i7 index N707 | N/A | CAAGCAGAAGACGGCATACGAGAT GTAGAGAGGTCTCGTGGGCTCGG |
| Recombinant DNA | ||
| Liu human CRISPR knockout library | Addgene | 1000000132 |
| Human CRISPR metabolic gene knockout library | Addgene | 110066 |
| pMD.2G | Addgene | 12259 |
| psPAX2 | Addgene | 12260 |
| Software and algorithms | ||
| GraphPad Prism 8.0 | GraphPad Software | https://www.graphpad.com/ |
| CRISPOR | Concordet and Haeussler14 | http://crispor.tefor.net/crispor.py |
| MAGeCK | Li et al.15 | https://github.com/liulab-dfci/MAGeCK |
| R (v 4.0.5) | R project | http://r-project.org/ |
| Other | ||
| Cell culture 96-well microplate | PerkinElmer | 6005689 |
| 0.45 μm filter (PES) | Thermo Fisher Scientific | 1580045 |
Materials and equipment
DMEM formula for A375 and HEK293T cell culture
| Reagent | Final concentration | Amount |
|---|---|---|
| DMEM | N/A | 440 mL |
| FBS | 10% | 50 mL |
| NEAA (50 x) | 1× | 5 mL |
| Penicillin-Streptomycin (100 x) | 1× | 5 mL |
| Total | N/A | 500 mL |
Note on storage conditions: 4°C, 4 weeks.
Step-by-step method details
Virus packaging
In this protocol, we apply a lentivirus transduction system to transfect the sgRNA library into A375 cells.
-
1.
Seed HEK293T cells into 15-cm tissue culture dishes with 20 mL of media.
-
2.
Proceed to the transfection step if the cell confluence reaches 70%–80% after 16 h of incubation.
Note: For transfection of each 15-cm dish, add 22.5 μg library plasmid, 16.9 μg psPAX2 packaging plasmid, 6.75 μg pMD2.G envelope plasmid, and 184 μL PEI in 3 mL serum-free Opti-MEM.
-
3.
Mix well and incubate for 20 min at 25°C. Add the mix dropwise gently to the plated cells and swirl to disperse the mixture evenly.
-
4.
Incubate the cells at 37°C, 5% CO2, for 6 h, and replace the media with the transfection mixture with 20 mL fresh media per plate.
-
5.
Incubate the cells at 37°C, 5% CO2 for 42 h.
-
6.
Collect the media from the culture and transfer to a 50 mL Falcon tube and store at 4°C.
-
7.
Add 20 mL fresh media per plate and incubate at 37°C, 5% CO2 for 24 h.
-
8.
Collect the media from the culture and mix it with the media collected the day before. Filter the media through a 0.45 μm filter (PES) to remove the cells.
-
9.
Concentrate the virus with Lenti-X Concentrator according to the manufacturer’s protocol (link: https://www.takarabio.com/products/gene-function/viral-transduction/lentivirus/lentivirus-concentration).
Note: We typically collect the media twice to yield around 37.5 mL of virus-containing supernatant. Add 12.5 mL Lenti-X Concentrator, mix well, and keep the tubes at 4°C for 24 h. Then, centrifuge the tubes at 1,500 g for 45 min. Discard the supernatant and resuspend the virus with 3.75 mL DMEM to obtain the 10 × concentrated virus.
-
10.
Split the 10 × concentrated virus into 15-mL centrifuge tubes.
-
11.
Virus may be stored at 4°C for a few days and should be frozen at −80°C for long-term storage.
Pause point: Virus can be stored at −80°C for up to 6 months without substantial loss of infection efficiency.
Lentivirus infection and MOI testing
Multiplicity of infection (MOI) must be determined for each new cell line. Ensure appropriate lentivirus infection that every single cell is infected with only one sgRNA. MOI of 0.3–0.4 is an optimal condition.
-
12.
Seed human melanoma A375 cells into two 6-well plates with 1.5 × 10⁵ cells per well.
Note: Before the experiment, the researcher should determine the doubling time of the cell line and test the minimal dosage of puromycin to kill all the cells after 48 h of puromycin treatment.
-
13.
Together with 5 μg/mL polybrene, add the titered virus (10 × concentrated lentivirus from Step 30) into the wells at volumes of 0 μL, 0 μL, 6.25 μL, 12.5 μL, 25 μL, 37.5 μL, 50 μL, 62.6 μL, 75 μL, 87.5 μL, 100 μL, and 125 μL.
Note: We recommend two uninfected wells. One without puromycin is the negative control for measuring MOI. The other one with puromycin is the positive control.
-
14.After incubating cells at 37°C, 5% CO2, for 24 h, change the media for all the wells.
-
a.Add puromycin into wells.
-
b.Maintain the cell culture until all the cells in the well without infection are dead.
-
a.
Note: During the process, if the well without selection is confluent, split the cells into a new well and record the cell passaging ratio for MOI testing.
-
15.
Count the number of cells in the wells with or without puromycin and determine the MOI.
Note: If the cells in the well as positive control are still alive after 48 h of puromycin selection, replace media with puromycin again and check after 24 h. If not enough cells are dying, repeat this experiment by increasing the concentration of puromycin.
-
16.
Record the amount of virus used in Step 13 as Y.
CRISPR-screen
To obtain reliable results from the CRISPR-Cas9 screening, over 400-fold (400 x) coverage of every sgRNA is required. For example, Liu Human CRISPR Knockout Library H2 contains 92871 sgRNAs; to achieve 400 × coverage, 3.68 × 10⁷ (92871 × 400) cells should be infected in one screen. Considering the Poisson distribution during infection, multiple surviving cells will have more than one sgRNA. Thus, the total number of A375 cells prepared for infection of MOI 0.35 is 1.247 × 10⁸ (3.68 × 10⁷ / (1-e−0.35)).
-
17.
Mix the cells and virus into 15-cm culture plates:
| Reagent | Final concentration | Amount |
|---|---|---|
| A375 cells | N/A | X mL |
| Polybrene (10 mg/mL) | 5 μg/mL | 10 μL |
| Viral dose | N/A | (18∗Y) μL |
| Cell culture media | N/A | to 20 mL |
Note: The ratio of the surface area between the 15-cm plate and one well of the 6-well plate is 18. The number of 15-cm tissue culture plates used for infection is 46 (1.247 × 10⁸ / (1.5 × 105 × 18). We also recommend setting up puromycin-selected, uninfected control and non-selected, uninfected control at this step.
-
18.
Mix gently with a shaker for 10 min at 25°C.
-
19.
Incubate the cells at 37°C, 5% CO2 for 24 h, change the media, and add puromycin.
-
20.
After 48 h of puromycin selection, passage the infected cells into the fresh medium. With the remaining cells, freeze two pellets (one for backup) for DNA extraction as the initial population (T0) at −80°C.
Note: Make sure the coverage of the library is always at 400 × coverage of the library. For example, Liu Human CRISPR Knockout Library H2 requires at least 3.68 × 10⁷ cells to achieve 400 × coverage. For the Human CRISPR Metabolic Gene Knockout Library, we recommend 1,000-fold coverage.
-
21.
Continue to passage cells, maintaining the required coverage of the library at each passage.
Note: We typically passage A375 cells every two days to ensure the cells double at least twice between passages.
-
22.
On day 14 (about 7 passages for A375 cells), collect the cell pellets as the final population (T14) and freeze the pellets at −80°C. At the same time, seed the cells for ferroptosis induction (Figure 2H).
-
23.Treat A375 cells with different ferroptosis-inducing conditions.
-
a.High levels of ROS treatment: DMSO or 300 μM TBH for 12 h.
-
b.GPX4 inhibitor RSL-3 treatment: DMSO or 0.75 μM RSL-3 for 5 days.
-
c.SLC7A11 inhibitor IKE treatment: DMSO or 5 μM IKE for 7 days.
-
d.Cystine starvation (-Cys) treatment: culture cells with media containing 1 μM cystine for 5 days.
-
a.
Note: The treatment begins when the cells are seeded (purple line, Figure 2H). Glutamine, methionine, and cystine-deficient DMEM is supplemented with 4 mM glutamine, 200 μM methionine, 1 μM cystine, and 10% FBS is the media containing 1 μM cystine.
Note: For long-term treatment (IKE, RSL-3, and cystine starvation treatment), check the conditions of the cells every day. Change the media to prevent the perturbing of dead cells according to the timeline in Figure 2H. We recommend at least two biological repeats for every treatment to obtain reliable results. We also recommend using T14 as the only control for all ferroptosis induction groups to save labor and time (see ”troubleshooting 1″).
-
24.
When the cells reach set time points, wash the cells with PBS and collect cells.
Note: To eliminate the dead cells, we suggest centrifuging the cell pellets at low speed (500 g for 3 min).
-
25.
Count cells and collect the required coverage of cells. Freeze cell pellets in 50-mL centrifuge tubes at −80°C.
Preparation for high-throughput sequencing
To analyze the sgRNA abundance present in each sample, genomic DNA (gDNA) is extracted from frozen cell pellets, and the sgRNA sequences are amplified by double-step PCR.
-
26.
Thaw the collected samples and extract gDNA using the Wizard Genomic DNA purification Kit according to the manufacturer’s instructions (link: https://www.promega.com/products/nucleic-acid-extraction/genomic-dna/wizard-genomic-dna-purification-kit).
Note: During the procedures of genome DNA extraction, prolonging the centrifugation time is helpful. In theory, 1 million cells contain 6.6 μg genomic DNA. We typically obtain 220 μg genomic DNA from 3.68 × 10⁷ cells.
-
27.
Quantitate the concentration of the extracted gDNA by NanoDrop.
-
28.Perform the first step of the double-step sgRNA amplification PCR.
-
a.Perform 96 separate 50 μL reactions with 1–4 μg genomic DNA in each reaction using Phusion Plus DNA Polymerase with the following reagents and reaction program.First step PCR master mix
Reagent Amount 5 × Phusion Plus Buffer 10 μL 10 mM dNTPs 1 μL 10 μM Forward Primer 1 μL 10 μM Reverse Primer 1 μL gDNA 1–4 μg Phusion Plus DNA Polymerase 1 μL 5 × Phusion GC Enhancer 10 μL Nuclease-Free Water to 50 μL First step PCR cycling conditionsSteps Temperature Time Cycles Initial Denaturation 98°C 30 s 1 Denaturation 98°C 10 s 15–17 cycles Annealing 60°C 10 s Extension 72°C 25 s Final extension 72°C 5 min 1 Hold 4°C forever Note: To find the best PCR condition, perform PCR reactions using titered gDNA (0.5 μg, 1 μg, 2 μg, 3 μg, 4 μg, and 5 μg) with 30 cycles of amplification step. A bright band (212 bp for Liu Human CRISPR Knockout Library and 277 bp for Human CRISPR Metabolic Gene Knockout Library) between 200 bp and 300 bp should be obtained. Choose the condition with the brightest band for further analysis. Thus, the number of reactions is not strictly 96. The results of titered PCR testing determine the number of reactions. At least 200 μg genomic DNA extracted from each sample is required for adequate coverage at this step.CRITICAL: P5 is a universal forward primer for both libraries we introduced. P7-lentiCrispr V1 is used for Human CRISPR Metabolic Gene Knockout Library and P7-lentiCrispr V2 is used for Liu Human CRISPR Knockout Library. -
b.Combine the resulting amplicons (around 4.8 mL) in a 50-mL centrifuge tube.
-
c.Add 480 μL 3M sodium acetate and 12 mL 100% ethanol. Then, put the tube into −80°C for 16 h.CRITICAL: Avoid contact with ethanol with eyes and skin. Keep ethanol away from heat, sparks, and flame because ethanol is highly flammable.
-
d.Centrifuge the ethanol precipitation mixture at 20,000 g for 30 min and resuspend the pellets with 400 μL Nuclease-Free Water.
-
e.Separate the concentrated PCR product using 1% agarose gel.CRITICAL: Avoid contact with Ethidium Bromide (EB), because it can cause irritation to the skin, eyes, mouth, and upper respiratory tract. Personal protective equipment must be used when handling EB-stained gel.
-
f.Extract the DNA using the QIAquick Gel Extraction Kit and resuspend the PCR product with 80 μL Nuclease-Free Water (link: https://www.qiagen.com/us/products/discovery-and-translational-research/dna-rna-purification/dna-purification/dna-clean-up/qiaquick-gel-extraction-kit).Note: This step aims to eliminate the interference of genomic DNA in the second PCR step. The PCR product is invisible in the gel. Load a positive control to ensure the gel is cut at the right place.
-
a.
-
29.Second step of two-step sgRNA amplification PCR.
-
a.Perform four separate 50 μL reactions with 10 μL first step PCR product in each reaction using barcoded primers with the following reagents and reaction program.Second step PCR master mix
Reagent Amount 5 × Phusion Plus Buffer 10 μL 10 mM dNTPs 1 μL 10 μM Forward Primer 1 μL 10 μM Reverse Primer 1 μL First step PCR product 10 μL Phusion Plus DNA Polymerase 1 μL 5 × Phusion GC Enhancer 10 μL Nuclease-Free Water 16 μL Second step PCR cycling conditionsSteps Temperature Time Cycles Initial Denaturation 98°C 30 s 1 Denaturation 98°C 10 s 8 cycles Annealing 60°C 10 s Extension 72°C 25 s Final extension 72°C 5 min 1 Hold 4°C forever -
b.Combine the PCR product in a 1.7 mL tube and purify with the QIAquick PCR purification Kit (link: https://www.qiagen.com/us/products/discovery-and-translational-research/dna-rna-purification/dna-purification/dna-clean-up/qiaquick-pcr-purification-kit).
-
c.Resuspend purified DNA with 20 μL Nuclease-Free Water.
-
d.Check the second step PCR product by loading 1 μL purified DNA by electrophoresis.Note: The second step PCR product should be a single band around 281 bp for Liu Human CRISPR Knockout Library and 346 bp for Human CRISPR Metabolic Gene Knockout Library.
-
e.Determine the DNA concentration by Qubit dsDNA HS Assay.
-
f.Check DNA quality using a Bioanalyzer system.
-
g.Pool all example DNA products together with equal amounts for high-throughput sequencing.Note: We typically send 10 μL of pool library at 2 nM for sequencing using Illumina NextSeq 550 system.
-
a.
-
30.
Sequencing was conducted by Illumina NextSeq 550 system using NextSeq 75 cycle High Output Kit V2.5 in Columbia University. Reads that passed QC were analyzed with FASTQ Generation (Version: 1.0.0).
Data analysis
MAGeCK (version 0.5.7), a commonly used pipeline, employs a sophisticated statistical model considering the inherent noise and variability in CRISPR screening data. This model-based approach helps to reduce false positives and increase the accuracy of the results. MAGeCK can also effectively distinguish true signals from background noise, making it suitable for analyzing large-scale screening datasets. For experiments involving two experimental conditions, we highly recommend using MAGeCK-RRA for the identification of essential targets from CRISPR knockout screens. MAGeCK-RRA allows researchers to assess the statistical significance of each observed change between the two states, providing valuable insights into the genes that play a crucial role in the biological processes under investigation. By comparing the gene-level effect sizes and conducting statistical tests, MAGeCK-RRA helps identify differentially essential genes, which are essential for understanding the underlying mechanisms and potential therapeutic targets in the context of the experimental conditions. Therefore, we utilize the MAGeCK pipeline to identify the essential targets.
-
31.
Download and back up raw sequencing FASTQ files from BaseSpace of Illumina.
> basemount BaseSpace
>cd BaseSpace/Projectid/sampleid/Files; i=Sample_T14
> cat ∗_R1_00∗.fastq.gz > /data2/output/${i}_1.fastq.gz
Note: The raw sequencing FASTQ files are automatically uploaded to our BaseSpace account, which provides 1 TB of storage. We use the BaseMount tool to efficiently move the reads from BaseSpace to our local server to access the files locally. This allows us to work with the data on our local infrastructure while releasing the storage of BaseSpace.
-
32.
Download the Human CRISPR Metabolic Gene Knockout Library file targets 2,981 human genes with 29,790 guide RNAs (https://www.addgene.org/pooled-library/sabatini-human-crispr-metabolic-knockout/) as lentiCRISPR_v1_library.txt.
Note: This library includes 499 negative control sgRNAs, which proves valuable for counting normalization across different time points. These negative control sgRNAs serve as a helpful baseline reference, enabling accurate comparisons and analyses of the experimental data. The library file (lentiCRISPR_v1_library.txt) consists of three essential columns: the sgRNA ID, the sgRNA sequence, and the gene it is designed to target.
-
33.
Install MAGeCK version 0.5.7 (http://mageck.sourceforge.net) through Anaconda platform with bioconda channel.
> conda create -c bioconda -n mageck-vispr mageck
> conda activate mageck-vispr
Note: After installing Anaconda (https://docs.anaconda.com/free/anaconda/install), we recommend creating an isolated software environment for MAGeCK by executing.
-
34.
Run the MAGeCK count command to generate a count table and distribution of read counts for each sample (Figure 3A).
> i=Sample_T14
> mageck count -l lentiCRISPR_v1_library.txt -n ${i} --sample-label ${i} --fastq ${i}_1.fastq.gz --pdf-report
Note: Since version 0.5.6, MAGeCK is now able to determine the trimming length and sgRNA length automatically. However, researchers can manually trim the reads under option --trim-5 22 (Figure 3B).
-
35.
Quality control is conducted using the generated count summary file, which provides a comprehensive overview of basic QC scores at the raw count level. These QC scores include map ratio, Gini index, and NegSelQC.
> library(MAGeCKFlute)
>countsummary<-read.table("sample_countsummary.txt",header=T,sep="∖t")
> MapRatesView(countsummary)
>IdentBarView(countsummary, x = "Label", y = "GiniIndex", ylab = "Gini index", main = "Evenness of sgRNA reads")
>countsummary$Missed = log10(countsummary$Zerocounts)
>IdentBarView(countsummary, x = "Label", y = "Missed", fill = "#394E80", ylab = "Log10 missed gRNAs", main = "Missed sgRNAs")
Note: By analyzing these metrics, we can assess the overall quality and reliability of the data, ensuring that the subsequent analyses are based on accurate and robust information.
-
36.
Compare samples using the MAGeCK test subcommand to compare IKE treatment vs. T14 condition (Steps 20–25) based on the generated read count table.
> t1=Sample_T14; t2=Sample_IKE_1; i=${t2}_${t1}
> mageck test -k ${i}_count.txt -t ${t2} -c ${t1} --control-sgrna lentiCRISPR_v1_negative.list --normcounts-to-file --norm-method control -n ${i}_negcontrol
Note: The list of negative control sgRNAs is extracted from the raw library, and we can examine the normalized counts of these negative control sgRNAs using a violin plot (Figure 3C). We typically compare T14 vs. T0 to obtain the effects of gene ablation, especially the common essential genes for A375 cells. Next, we further analyze the different treatments (IKE, RSL-3, TBH, or cystine starvation) vs. T14 to obtain the effects of gene ablation on ferroptosis induced under various conditions.
-
37.
To compare MAGeCK RRA scores between replicates, we utilized the R script points_cor_sele.r (Figure 3D). The output generated is a point plot, which displays the coefficient index (R = 0.84) and p-value (p < 2.2e-16), allowing for a visual comparison of the scores between the replicates.
> awk -F "∖t" -v OFS="∖t" 'NR==FNR{a[$1]=-log($3)/log(10)}NR>FNR{if($1 in a){print $1,-log($3)/log(10),a[$1]}}' IKE2.gene_summary.txt IKE1.gene_summary.txt | tail -n +2 > temp
> Rscript ∼/bin/perl/r-script/points_cor_sele.r temp 2,3 IKE1_RRA,IKE2_RRA 0,16 IKE_2rep_negcontrol
Note: This analysis provides valuable insights into the consistency and reproducibility of the results across different experimental replicates, ensuring the reliability of the MAGeCK RRA scores.
-
38.
Visualize the intriguing target location on the dot plot (Figure 3E) and the count change of each sgRNA for the intriguing target between two conditions on the line plot (Figure 3F).
> t1=Sample_T14; t2=Sample_IKE_1; i=${t2}_${t1}
> Rscript ∼/bin/perl/r-script/rra_dotplot_countchange.r ${i}_negcontrol VKORC1L1 T14,IKE ${i}_output
Note: The files generated by the MAGeCK test subcommand have the prefix ${i}_negcontrol. In the output figures, we aim to highlight VKORC1L1. The conditions T14 and IKE represent the control and case conditions, respectively.
-
39.
The maximum likelihood estimation (MLE) module of MAGeCK can improve the challenge of estimating gene effects across sgRNA screens. FDR and beta score of each gene were also estimated to detect the candidate hits using the MAGeCK-MLE algorithm under the method normalizing to the negative control sgRNAs.
> t1= Sample_T14; t2= Sample_IKE_1; i=${t2}_${t1}
> mageck mle --count-table ${i}_enrich_count.txt --design-matrix design.txt --norm-method control --control-sgrna lentiCRISPR_v1_negative.list -n ${i}_enrich --threads 40
Note: Once we have identified potential hits from the RRA scores, we can conduct further confirmation using the beta score and FDR estimated by the MAGeCK-MLE algorithm.
Figure 3.

Quality control of the CRISPR library and potential targets identification
(A) The frequency plots illustrate the distribution of log2-transformed read counts for sgRNAs in each sample.
(B) A snapshot depicts the sequence structure of reads.
(C) A violin plot displays the normalized counts of negative control sgRNAs in two conditions. The p-value is estimated using a two-sided Student’s t-test to assess the statistical significance between the two conditions.
(D) Pearson correlations of RRA score between two replicates. Each dot represents a gene from the CRISPR library.
(E) A dot plot depicts the rank of genes based on the RRA score. VKORC1L1, positioned at rank 61, is prominently highlighted in red color.
(F) A line plot presents the normalized counts change of sgRNA between two conditions. Each color corresponds to an individual sgRNA on VKORC1L1.
Target selection and verification
After target selection, validate the candidates by generating gene-specific knockouts using individual sgRNAs.
-
40.
Design at least two highly efficient sgRNAs targeting the selected gene by CRISPOR tool.
-
41.
Synthesize sgRNAs by Synthego company.
Note: This process usually takes one week.
-
42.
Seed A375 cells into 6-well plates with 1 × 10⁵ cells per well.
-
43.
Perform the transfection after 16 h of incubation with the following reagents.
Tube 1: mix 125 μL serum-free Opti-MEM with 1.25 μL TrueCut Cas9 Protein v2 (5 mg/mL), 50 nmol sgRNAs, and 12.5 μL Cas9 Plus Reagent.
Tube 2: mix 125 μL serum-free Opti-MEM with 7.5 μL Lipofectamine CRISPRMAX Reagent.
-
44.
Mix the content from tube 1 and tube 2. After 15 min of incubation, add the mixture to the medium of the 6-well plate.
-
45.
72 h after transfection, collect sgRNAs-expressing pool A375 cells for Western blot analysis and passage cells for further experiments.
Note: If the knockout efficiency is over 50% determined by Western blot, proceed to the next step.
-
46.
Seed sgRNAs expressing pool A375 cells to a 12-well plate with 4 × 10⁴ cells per well.
-
47.
After 16 h of incubation, add the indicated drugs into the 12-well plate with 30 nM SYTOX green dye to stain dead cells.
Note: Observe the differences in the cell morphology and green fluorescence signaling between the negative control and sgRNA-expressing cells upon ferroptotic stresses. If the results are consistent with the CRISPR-Cas9 screening results, proceed to the next step.
-
48.
Dilute the cells to allow the formation of clones from single cells to obtain knockout cells of the gene for further analysis.
Expected outcomes
As shown in Figures 4A and 4B, the best condition for amplifying the two libraries is determined by titered PCR reactions. The first round PCR of Liu Human CRISPR Knockout Library, which uses LentiCrispr V2 as a backbone, generated a bright band at 212 bp (Figure 4A). Moreover, we obtained the best amplification condition by using 4 μg genomic DNA template per reaction. We obtained similar results from the Human CRISPR Metabolic Gene Knockout Library (Figure 4B). After the second round of PCR, the barcode was added, and a clear shift of the second PCR product can be observed by gel electrophoresis (Figures 4C and 4D). Furthermore, a Bioanalyzer system was used to analyze the product. A bioanalyzer assay should clearly show a ladder pattern between 300 bp and 400 bp (Figure 4E).
Figure 4.

Analysis of the preparation of two libraries
(A) Representative of electrophoresis of first PCR product of Liu Human CRISPR Knockout Library with titered genome DNA as template. The backbone of this library is LentiCrispr V2. The best PCR condition is 4 μg genome DNA per reaction.
(B) Representative of electrophoresis of first PCR product of Human CRISPR Metabolic Gene Knockout Library with titered genome DNA as template. The backbone of this library is LentiCrispr V1. The best PCR condition is 3 μg genome DNA per reaction.
(C) Representative of electrophoresis of first and second PCR product of Liu Human CRISPR Knockout Library. For the second step PCR, primer pairs “i5 index N502” and “i7 index N701” were used.
(D) Representative of electrophoresis of first and second PCR product of Human CRISPR Metabolic Gene Knockout Library. For the second step PCR, primer pairs “i5 index N502” and “i7 index N701” were used.
(E) Upper panel: Representative bioanalyzer electropherograms of human metabolic libraries using an Agilent DNA 1000 kit. Lower panel: Representative bioanalyzer gel images of the same human metabolic libraries.
To select the most important hits, we combine all screen results from the same batch and choose the instances where the same genes are consistently the negative- or positive-selected genes in more than one screen. The threshold for negative- or positive-selected hits is p-value equal to or lower than 0.05. Most importantly, choosing the important metabolite genes for both genome-wide and metabolism-specific screens is recommended. We also recommend performing functional annotation and enrichment analyses of these top-selected genes using Database for Annotation, Visualization, and Integrated Discovery (DAVID). The analyses provide significant enrichment for gene products localized at specific intracellular compartments, biological processes, and molecular functions.
As shown in Figure 5, we provide examples to help readers choose candidates who are highly likely to be involved in the regulation of ferroptosis. Genes that occur as positively selected hits under all ferroptosis induction conditions are most likely the typical oxidative modulator (green area, Figure 5A). KEAP1 is the top hit of all the screens because KEAP1 is the E3 ligase and degrader of NRF2, a master regulator in anti-oxidative stresses.16 Interestingly, although ACSL4 is critical for GPX4-inactivation-induced ferroptosis,9,10 we have demonstrated that ACSL4 is dispensable upon high levels of ROS-induced ferroptosis.13 AGPAT3, another crucial metabolic gene for ether PUFA-PE synthesis,11 has a similar role as ACSL4 to be the top hit in RSL-3, IKE, or cystine starvation screens, but not TBH screens (blue area, Figure 5A). Through the TBH and cystine starvation screens, our recent study reveals the regulatory network of TBH-induced ferroptosis through GPAT3-mediated PA synthesis and PHLDA2/ALOX12-mediated PA peroxidation17 (unpublished data, cyan area, Figure 5A). Although the mechanisms involved in GPX4-inactivation-induced ferroptosis are extensively studied, the mechanism of ferroptosis initiated by high levels of ROS is still unclear. Considering high levels of ROS are pathological indicators in diverse diseases,18 the CRISPR screen is a powerful tool to investigate the inner mechanism of human cancer and other pathophysiological disease models.
Figure 5.

Example for target selection
(A and B) Venn diagrams and examples of targets selection for positively (A) or negatively (B) selected hits.
For the genes responsible for sensitizing cells to ferroptosis after knocking out, the hits obtained from all the ferroptosis-inducing conditions are likely involved in typical anti-oxidative pathways, particularly the cystine-GSH pathway (yellow area, Figure 5B). The most famous genes are SLC7A11, GCLC, and et al. However, recent studies have identified a list of metabolites, Radical-Trapping Antioxidants (RTAs), that react with peroxidized phospholipids and inhibit ferroptosis. The RTAs modulators, such as Vitamin K reductases FSP1 and VKORC1L1, are also the top hits of all ferroptosis-inducing conditions.1,19,20 Interestingly, the negatively selected hits, specifically of IKE or cystine starvation screens, are likely functional for maintaining the Fe-S homeostasis (gray area, Figure 5B). Cysteine is the sulfur source for Fe-S cluster during biogenesis in eukaryotic mitochondria; thus, restrained cystine uptake exposes cells' vulnerabilities to the loss of Electron Transport Chain (ETC) genes.21
Limitations
Although the CRISPR-Cas9 screen has been widely used for the identification of novel targets or dissecting specific pathways, there are certain limitations. Firstly, the process is relatively time-consuming and labor-cost, which takes over two months. Secondly, because of the off-target issues of sgRNAs, eliminating false positive hits is also a critical step. In addition, identifying critical genes that are functionally redundant is also limited through individual gene ablation screens. Last, ferroptosis is a programmed cell death dependent on numerous metabolic pathways, it is very likely that the effects of some positive hits from the screening are tissue-specific and context-dependent.22 Thus, combining the CRISPR-Cas9 screen with metabolite profiling provides a more reliable way to discover the critical pathways involved in ferroptosis regulation than solely relying on the CRISPR-Cas9 screen.
Troubleshooting
Problem 1
Reproducibility issues of the identified target.
Potential solution
-
•
CRISPR screens may lack robustness and reproducibility between each experiment, especially the targets with limited sgRNA coverage. We recommend performing all screens under various ferroptosis-inducing conditions at the same time (Step 23).
-
•
MOI higher than 0.4 may cause a high possibility of a single cell being infected with multiple sgRNAs, which may produce complex effects and difficulties interpreting the results (Steps 13–15). In addition, if the expected results are not obtained (for example, ACSL4 should be the positive control upon RSL-3 treatment), the rest of the results are doubtful, and investigators need to reconsider the entire screening process.
-
•
The deep sequencing involved in CRISPR screenings should be independently repeated at least twice. After confirming the high reproducibility of the two repeats, the potential hits can then be identified by overlapping the results obtained from the two replicates. Moreover, genes that appear on the top of the list of hits may still be false positive hits. The genes that consistently appear in the results (p-value < 0.05) derived from multiple ferroptosis-inducing conditions are recommended to be selected.
Problem 2
A low titer of virus.
Potential solution
-
•
HEK293T cells are not in good condition. Investigators need to test the cells for mycoplasma contamination regularly. Over 95% cell viability of HEK293T cells is also required.
-
•
High HEK293T cell confluence (70%–80%) is required for the transfection step.
-
•
The DNA quality of the library and packaging plasmids is low. Check the 260/280 ratio and the concentration of the plasmids by NanoDrop.
-
•
In the virus concentration step, keep the virus at 4°C and increase the incubation time to obtain the best yield (Step 9).
-
•
For each cell line, the optimal concentration of polybrene for virus infection is different. When starting to use a new type of cell line, the optimal concentration of polybrene needs to be tested.
-
•
The pore diameter of the filter used is smaller than 0.45 μm. PES 0.45 μm filters are recommended.
-
•
The virus has been frozen and thawed repeatedly (Step 11).
Problem 3
Low coverage of the mapped reads.
Potential solution
-
•
The library amplification has issues. Inadequate and biased amplification of the library causes the loss of sgRNAs and aberrant sgRNA abundance, which is the main reason for the low coverage of the mapped reads. Thus, deep sequencing of the first-use library is recommended to ensure the library’s quality after amplification.
-
•
During the screen processes, infecting and passaging cells should have over 400× coverage for the genome-wide library and over 1000× coverage for the metabolism library to ensure the sufficient presentation of sgRNAs (Step 22).
-
•
Inaccurate calculation of MOI. The real MOI is lower than 0.3–0.4, causing fewer infected cells and, consequently, lower coverage (Steps 13–15).
-
•
Low efficiency of genome DNA extraction and sgRNA amplification. In theory, 1 million cells contain 6.6 μg genomic DNA. At least 200 μg genomic DNA per sample is required from adequate amplification of sgRNA. We also recommend testing the optimal conditions for PCR before sgRNA amplification (Step 28).
Problem 4
sgRNA design bias.
Potential solution
-
•
The effectiveness of sgRNAs can vary based on their sequences and targeting locations. sgRNAs may have differences in their knockout efficiencies, leading to biased results. As a result, we may observe conflicting findings where one sgRNA of one gene exhibits effects that are inconsistent with the effects of the other sgRNAs of the same gene.
-
•
Setting the percentage of good sgRNA to more than 60% for potential targets.
-
•
Combining the result of RRA and MLE to confirm the final targets.
Problem 5
Rank has low accuracy for the genes exhibiting mild effects in screening.
Potential solution
-
•
When the differences in effects between the genes are subtle, their rankings may be close together, making it challenging to identify the real ranking with high confidence.
-
•
The ranking of the genes with the highest dropout sgRNAs is considered reliable based on the RRA or beta score.
-
•
We can extract the top 100 or 150 potential hits and use them for further analysis by integrating them with other published data. By combining our results with existing datasets, we can gain additional insights into the functional relevance and biological context of these potential hits.
Resource availability
Lead contact
Further information and requests for resources and reagents should be directed to and will be fulfilled by the lead contact, Wei Gu (wg8@cumc.columbia.edu).
Materials availability
This study did not generate new unique reagents.
Data and code availability
This study did not generate any codes. All experimental data in the paper are available upon reasonable request to the lead contact. Original data have been deposited to Mendeley Data: https://doi.org/10.17632/65pfcj4j4m.1
Acknowledgments
This work was supported by the National Cancer Institute of the National Institutes of Health under Award R35CA253059, RO1CA258390, and R01CA254970 to W.G. and R35GM118015 to Z.Z. The content is solely the responsibility of the authors and does not necessarily represent the official views of the National Institutes of Health.
Author contributions
Conceptualization, X.Y., S.D., Z.Z., and W.G.; writing – original draft, X.Y., S.D., Z.L., and Z.W.; writing – reviewing, X.Y., S.D., N.K., Z.Z., and W.G.
Declaration of interests
The authors declare no competing interests.
Contributor Information
Zhiguo Zhang, Email: zz2401@cumc.columbia.edu.
Wei Gu, Email: wg8@cumc.columbia.edu.
References
- 1.Yang X., Wang Z., Zandkarimi F., Liu Y., Duan S., Li Z., Kon N., Zhang Z., Jiang X., Stockwell B.R., Gu W. Regulation of VKORC1L1 is critical for p53-mediated tumor suppression through vitamin K metabolism. Cell Metab. 2023;35:1474–1490.e8. doi: 10.1016/j.cmet.2023.06.014. [DOI] [PMC free article] [PubMed] [Google Scholar]
- 2.Birsoy K., Wang T., Chen W.W., Freinkman E., Abu-Remaileh M., Sabatini D.M. An essential role of the mitochondrial electron transport chain in cell proliferation is to enable aspartate synthesis. Cell. 2015;162:540–551. doi: 10.1016/j.cell.2015.07.016. [DOI] [PMC free article] [PubMed] [Google Scholar]
- 3.Chen X., Kang R., Kroemer G., Tang D. Broadening horizons: the role of ferroptosis in cancer. Nat. Rev. Clin. Oncol. 2021;18:280–296. doi: 10.1038/s41571-020-00462-0. [DOI] [PubMed] [Google Scholar]
- 4.Jiang X., Stockwell B.R., Conrad M. Ferroptosis: mechanisms, biology and role in disease. Nat. Rev. Mol. Cell Biol. 2021;22:266–282. doi: 10.1038/s41580-020-00324-8. [DOI] [PMC free article] [PubMed] [Google Scholar]
- 5.Yang W.S., SriRamaratnam R., Welsch M.E., Shimada K., Skouta R., Viswanathan V.S., Cheah J.H., Clemons P.A., Shamji A.F., Clish C.B., et al. Regulation of ferroptotic cancer cell death by GPX4. Cell. 2014;156:317–331. doi: 10.1016/j.cell.2013.12.010. [DOI] [PMC free article] [PubMed] [Google Scholar]
- 6.Zhang Y., Tan H., Daniels J.D., Zandkarimi F., Liu H., Brown L.M., Uchida K., O'Connor O.A., Stockwell B.R. Imidazole ketone erastin induces ferroptosis and slows tumor growth in a mouse lymphoma model. Cell Chem. Biol. 2019;26:623–633.e9. doi: 10.1016/j.chembiol.2019.01.008. [DOI] [PMC free article] [PubMed] [Google Scholar]
- 7.Badgley M.A., Kremer D.M., Maurer H.C., DelGiorno K.E., Lee H.-J., Purohit V., Sagalovskiy I.R., Ma A., Kapilian J., Firl C.E.M., et al. Cysteine depletion induces pancreatic tumor ferroptosis in mice. Science. 2020;368:85–89. doi: 10.1126/science.aaw9872. [DOI] [PMC free article] [PubMed] [Google Scholar]
- 8.Jiang L., Kon N., Li T., Wang S.-J., Su T., Hibshoosh H., Baer R., Gu W. Ferroptosis as a p53-mediated activity during tumour suppression. Nature. 2015;520:57–62. doi: 10.1038/nature14344. [DOI] [PMC free article] [PubMed] [Google Scholar]
- 9.Kagan V.E., Mao G., Qu F., Angeli J.P.F., Doll S., Croix C.S., Dar H.H., Liu B., Tyurin V.A., Ritov V.B., et al. Oxidized arachidonic and adrenic PEs navigate cells to ferroptosis. Nat. Chem. Biol. 2017;13:81–90. doi: 10.1038/nchembio.2238. [DOI] [PMC free article] [PubMed] [Google Scholar]
- 10.Doll S., Proneth B., Tyurina Y.Y., Panzilius E., Kobayashi S., Ingold I., Irmler M., Beckers J., Aichler M., Walch A., et al. ACSL4 dictates ferroptosis sensitivity by shaping cellular lipid composition. Nat. Chem. Biol. 2017;13:91–98. doi: 10.1038/nchembio.2239. [DOI] [PMC free article] [PubMed] [Google Scholar]
- 11.Zou Y., Henry W.S., Ricq E.L., Graham E.T., Phadnis V.V., Maretich P., Paradkar S., Boehnke N., Deik A.A., Reinhardt F., et al. Plasticity of ether lipids promotes ferroptosis susceptibility and evasion. Nature. 2020;585:603–608. doi: 10.1038/s41586-020-2732-8. [DOI] [PMC free article] [PubMed] [Google Scholar]
- 12.Bonifácio V.D.B., Pereira S.A., Serpa J., Vicente J.B. Cysteine metabolic circuitries: Druggable targets in cancer. Br. J. Cancer. 2021;124:862–879. doi: 10.1038/s41416-020-01156-1. [DOI] [PMC free article] [PubMed] [Google Scholar]
- 13.Chen D., Chu B., Yang X., Liu Z., Jin Y., Kon N., Rabadan R., Jiang X., Stockwell B.R., Gu W. iPLA2β-mediated lipid detoxification controls p53-driven ferroptosis independent of GPX4. Nat. Commun. 2021;12:3644. doi: 10.1038/s41467-021-23902-6. [DOI] [PMC free article] [PubMed] [Google Scholar]
- 14.Concordet J.-P., Haeussler M. intuitive guide selection for CRISPR/Cas9 genome editing experiments and screens. Nucleic Acids Res. 2018;46:W242–W245. doi: 10.1093/nar/gky354. [DOI] [PMC free article] [PubMed] [Google Scholar]
- 15.Li W., Xu H., Xiao T., Cong L., Love M.I., Zhang F., Irizarry R.A., Liu J.S., Brown M., Liu X.S. MAGeCK enables robust identification of essential genes from genome-scale CRISPR/Cas9 knockout screens. Genome Biol. 2014;15:554. doi: 10.1186/s13059-014-0554-4. [DOI] [PMC free article] [PubMed] [Google Scholar]
- 16.Baird L., Yamamoto M. The molecular mechanisms regulating the KEAP1-NRF2 pathway. Mol. Cell Biol. 2020;40:e00099-20. doi: 10.1128/MCB.00099-20. [DOI] [PMC free article] [PubMed] [Google Scholar]
- 17.Chu B., Kon N., Chen D., Li T., Liu T., Jiang L., Song S., Tavana O., Gu W. ALOX12 is required for p53-mediated tumour suppression through a distinct ferroptosis pathway. Nat. Cell Biol. 2019;21:579–591. doi: 10.1038/s41556-019-0305-6. [DOI] [PMC free article] [PubMed] [Google Scholar]
- 18.Liu Z., Ren Z., Zhang J., Chuang C.-C., Kandaswamy E., Zhou T., Zuo L. Role of ROS and nutritional antioxidants in human diseases. Front. Physiol. 2018;9:477. doi: 10.3389/fphys.2018.00477. [DOI] [PMC free article] [PubMed] [Google Scholar]
- 19.Bersuker K., Hendricks J.M., Li Z., Magtanong L., Ford B., Tang P.H., Roberts M.A., Tong B., Maimone T.J., Zoncu R., et al. The CoQ oxidoreductase FSP1 acts parallel to GPX4 to inhibit ferroptosis. Nature. 2019;575:688–692. doi: 10.1038/s41586-019-1705-2. [DOI] [PMC free article] [PubMed] [Google Scholar]
- 20.Doll S., Freitas F.P., Shah R., Aldrovandi M., da Silva M.C., Ingold I., Goya Grocin A., Xavier da Silva T.N., Panzilius E., Scheel C.H., et al. FSP1 is a glutathione-independent ferroptosis suppressor. Nature. 2019;575:693–698. doi: 10.1038/s41586-019-1707-0. [DOI] [PubMed] [Google Scholar]
- 21.Brzóska K., Meczyńska S., Kruszewski M. Iron-sulfur cluster proteins: electron transfer and beyond. Acta Biochim. Pol. 2006;53:685–691. [PubMed] [Google Scholar]
- 22.Magtanong L., Mueller G.D., Williams K.J., Billmann M., Chan K., Armenta D.A., Pope L.E., Moffat J., Boone C., Myers C.L., et al. Context-dependent regulation of ferroptosis sensitivity. Cell Chem. Biol. 2022;29:1409–1418.e6. doi: 10.1016/j.chembiol.2022.06.004. [DOI] [PMC free article] [PubMed] [Google Scholar]
Associated Data
This section collects any data citations, data availability statements, or supplementary materials included in this article.
Data Availability Statement
This study did not generate any codes. All experimental data in the paper are available upon reasonable request to the lead contact. Original data have been deposited to Mendeley Data: https://doi.org/10.17632/65pfcj4j4m.1