Abstract
Background
There was evidence that significant bidirectional associations between psoriasis and inflammatory bowel diseases (IBDs), which influences management strategy of the patients, so the investigation on the mechanisms by which these two diseases co‐occur is important.
Methods
The Gene Expression Omnibus (GEO) database was used to download gene expression profiles of psoriasis and IBD. The differentially expressed genes (DEGs) between disease and health control groups for each data set were calculated, and Venn diagram was used to obtain for intersection. We performed Gene ontology (GO) and Kyoto Encyclopedia of Genes and Genomes (KEGG) enrichment analysis on the intersection, followed by developing a protein–protein interaction network and module construction, and identified hub genes by cytoHubba. Thereafter, least absolute shrinkage and selection operator algorithms was used to identify the co‐biomarkers of psoriasis and IBD from the top 50 hub genes. The biomarkers were used to construct a screening model, the discriminatory capacity of which was verified by receiver operating characteristic (ROC) curves. CIBERSORT algorithm was utilized to estimate the compositional patterns of immune cell infiltration in biomarkers of psoriasis and IBD. Spearman rank correlation analysis was used to further evaluate the correlation between the identified biomarkers and immune cells.
Results
A total of 271 shared DEGs were screened. The GO and KEGG enrichment analysis indicated that the shared DEGs were mainly enriched in response to lipopolysaccharide, secretory granule lumen, cytokine activity, and interleukin (IL)‐17 signaling pathway. Fifty genes such as IL1B, IL6, were identified as hub genes, based on which, FOS, IFI44, MMP9, MNDA, PTGS2, S100A9, and STAT1 were identified as biomarkers of psoriasis. CCL20, CD274, CTGF, CXCL1, CXCL10, CXCL2, CXCL9, FCGR3B, FOS, GBP1, GZMB, IFI27, IFI6, IL1RN, ISG15, ISG20, LCN2, LILRB2, MMP12, MMP7, S100A8, TLR8, and TNFSF13B were identified as biomarkers of IBD. FOS was the common biomarker of psoriasis and IBD. Screening models were validated in the validation data set (Psoriasis: area under the curve (AUC) = 1.000, IBD: AUC = 0.870). Immunocyte infiltration analysis showed the macrophages cells, mast cells resting, and T cells CD4 memory activated have the common characteristics in psoriasis and IBD.
Conclusions
FOS may play a key role in the occurrence and development of psoriasis complicated with IBD and macrophages cells may be an entrance for treating this comorbidity.
Keywords: biomarkers, comorbidity, immunoinfiltration analysis, inflammatory bowel disease, psoriasis, screening model
1. INTRODUCTION
Psoriasis is a chronic autoimmune disorder with a complicated genetic background, 1 , 2 as the concordance rates in monozygotic and dizygotic twins were approximately 70% and 20%, respectively. 3 At the time when plasma cell like dendritic cells are activated by genetic and/or environmental factors, it will produce a large number of pro‐inflammatory cytokines, including tumor necrosis factor (TNF)‐α, interferon‐γ, interleukin (IL)‐17/22/23/1β, psoriasis occurs. 4
Compared with ordinary people, psoriatic patients have an increased risk of complications, including inflammatory bowel disease (IBD), 4 an immune‐mediated inflammatory polygenic disease. 5 , 6 Scholars have found that psoriatic patients were prone to IBD. 5 , 7 , 8 , 9 , 10 Although the mechanism of the co‐occurrence of these two diseases has not yet been fully elucidated, some scholars considered that few shared genetic susceptibility loci and pathogenetic mechanisms between the two disease may be the source for this connection. 11 , 12 , 13 , 14 , 15
Although previous studies have separately explored biomarkers or key genes associated with psoriasis 16 , 17 or IBD, 18 or used meta‐analyses on genome‐wide association studies to explore their genetic correlation. 12 However, the genetic mechanism of psoriasis complicated with IBD were not clear, so we conduct this study to dig out the common immune mechanisms of psoriasis complicated with IBD, and further construct a screening model based on biomarkers, which may improve earlier diagnosis of patients with comorbidities and provide evidence for prognosis.
2. MATERIALS AND METHODS
2.1. Data sets
We used “psoriasis”, “ulcerative colitis”, and “Crohn's disease” as the searching words in the Gene Expression Omnibus (GEO) database (https://www.ncbi.nlm.nih.gov/geo/), and selected eligible datasets according to the following criteria 1 : The species source of these datasets is human (Homo sapiens), 2 Samples for sequencing are tissues.
The gene IDs were converted to gene symbols based on the corresponding annotation matrix information, and missing values were deleted. The gene expression values were averaged when multiple probes corresponded to one gene. Because of the different study types and experimental conditions of these datasets. The package “limma” and “sva” of R software (version 4.2.3) was utilized to preprocess and perform batch effect correction when merging the datasets, and Principal Components Analysis (PCA) plots was constructed to evaluate the effect on correction. 19
2.2. Differentially expressed genes identification
The R package “limma” 20 was utilized to identify the differentially expressed genes (DEGs) between psoriasis and healthy control, IBD and healthy control, a difference threshold of |logFC| ≥ 0.5, and adjusted p value < 0.05. The “ggplot2” 21 and “pheatmap” packages in R was utilized to generate volcano plots and heat maps of DEGs respectively. Genes with logFC ≥ 5.5 and p ≤ 0.0001 of psoriasis and logFC ≥ 2 and p ≤ 0.0001 of IBD were labeled in the volcano plots.
Venn diagram (http://www.ehbio.com/test/venn/#/) was used to obtain for intersection of the DEGs of two diseases to further analyze.
2.3. Functional annotation
R software “clusterProfiler” 22 package was conducted to execute Gene Ontology (GO) 23 and Kyoto Encyclopedia of Genes and Genomes (KEGG) 24 enrichment. The threshold that conformed to both p‐value < 0.05 and q‐value < 0.05 were supposed to be remarkably significant enrichment. The “ggplot2” 21 in R was utilized to visualize enrichment analyses results.
2.4. Protein–protein interaction analysis
The STRING 25 (https://string‐db.org/), an online protein network database, was utilized to establish the interactions of the co‐DEGs. Cytoscape software (http://cytoscape.org/; version 3.8.1) was utilized to visualize the results of Protein–protein interaction (PPI) network. Then, maximal clique centrality (MCC) algorithm of cytoHubba in Cytoscape software were used to identify the hub genes.
2.5. Screening of biomarkers
Least absolute shrinkage and selection operator (LASSO) algorithm was performed with “glmnet” package in R, was utilized to further screen for biomarkers in psoriasis and IBD in the top 50 hub genes sifted by cytoHubba to enhance forecast precision. Then the biomarkers in the validation set was substituted into the model. Receiver operating characteristic (ROC) 26 curves and the area under the curve (AUC) were utilized to prove the predictive significance of the screening model.
2.6. Immune infiltration analysis and the association between biomarkers and immune cells
The CIBERSORT algorithm in R software was used to carry out immunocyte infiltration analysis, based on LM22 gene set. Spearman analysis was applied to calculate the association between the identified biomarkers and immune cells. What's more, the proportion of various immune cells in patients and control groups was evaluated. The “reshape2”, “corrplot”, and “ggcorrplot” packages were utilized to visualize the results (p‐value < 0.05 as the significance threshold).
3. RESULTS
3.1. Batch effect correction of the data and identification of DEGs
Five psoriasis and 8 IBD gene expression profiling data sets were included in this research (Table 1).
TABLE 1.
Characteristics of Gene Expression Omnibus datasets used in this study.
| Data set | Platform | Related diseases | Normal samples | Lesion samples | Total | Group |
|---|---|---|---|---|---|---|
| GSE166388 | GPL570 | Psoriasis | 4 | 4 | 8 | Test set |
| GSE14905 | GPL570 | Psoriasis | 21 | 33 | 54 | Test set |
| GSE78097 | GPL570 | Psoriasis | 6 | 13 | 19 | Test set |
| GSE109248 | GPL10558 | Psoriasis | 14 | 17 | 31 | Validation set |
| GSE13355 | GPL570 | Psoriasis | 64 | 58 | 122 | Validation set |
| GSE112366 | GPL13158 | IBD | 26 | 141 | 167 | Test set |
| GSEL186582 | GPL570 | IBD | 13 | 196 | 209 | Test set |
| GSE47908 | GPL570 | IBD | 15 | 45 | 60 | Test set |
| GSE13367 | GPL570 | IBD | 10 | 17 | 27 | Test set |
| GSE95095 | GPL14951 | IBD | 12 | 24 | 36 | Validation set |
| GSE186582 | GPL570 | IBD | 12 | 147 | 159 | Validation set |
| GSE38713 | GPL570 | IBD | 13 | 30 | 43 | Validation set |
| GSE95452 | GPL570 | IBD | 5 | 21 | 26 | Validation set |
Abbreviation: IBD, inflammatory bowel disease.
After batch effect correction and integration of the data sets, PCA plots were utilized to evaluate data quality before and after the action from both group and dataset aspects. PCA plots showed that more evenly distributed expressions of genes were obtained after batch effect correction (Figure S1).
A total of 3514 DEGs (1664 upregulated and 1850 downregulated) of psoriasis and 626 DEGs (398 upregulated and 228 downregulated) of IBD were screened out. The differential expression results were visualized in Volcano plots and heatmaps (Figures 1A and B). The heatmaps showed that the two groups are significantly separated, indicating that the outcomes were reliable. Two hundred seventy‐one co‐DEGs (Table S1) between psoriasis and IBD were shown in Venn diagram (Figure 1C).
FIGURE 1.
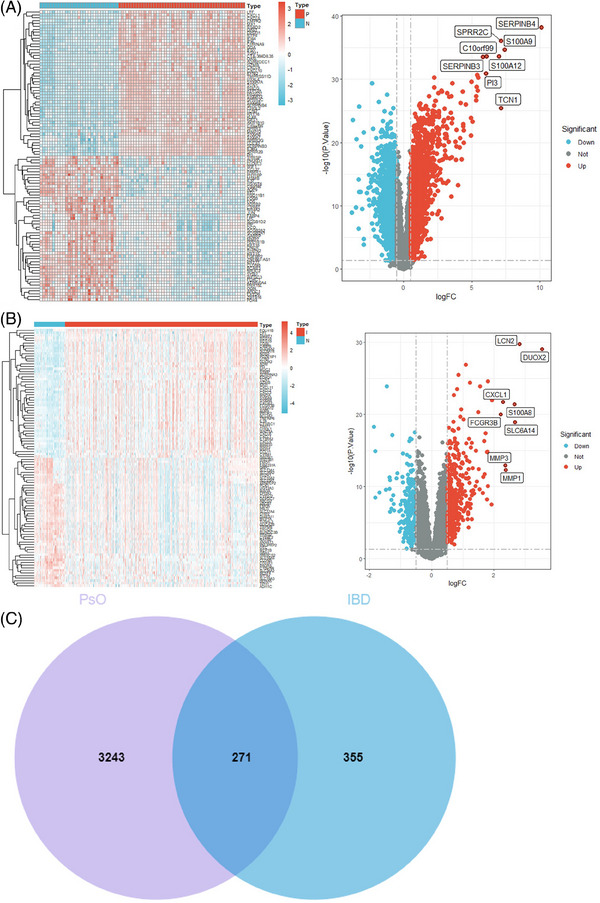
(A) Heatmap and volcano plot of psoriasis. (B) Heatmap and volcano plot of IBD. (C) Venn diagram of psoriasis and IBD. IBD, inflammatory bowel disease.
3.2. Functional enrichment analysis of co‐DEGs
The GO analysis of 271 co‐DEGs yielded 910 results, including 817 biological processes (BP), 30 cellular components (CC), and 63 molecular functions (MF). The GO analysis indicated that co‐DEGs were related to BP in response to lipopolysaccharide (p = 2.03E‐19) and molecule of bacterial origin (p = 1.28E‐18), CC in secretory granule lumen (p = 2.03E‐07) and tertiary granule (p = 2.07E‐07), and MF in cytokine activity (p = 2.20E‐07) and chemokine activity (p = 3.42E‐07) (Figure 2A). The KEGG analysis revealed that co‐DEGs were related to IL‐17 signaling pathway (p = 1.42E‐08), leishmaniasis (p = 1.29E‐06), and TNF signaling pathway (p = 7.36E‐06) (Figure 2B).
FIGURE 2.
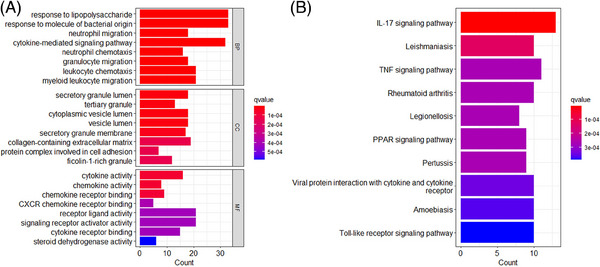
(A) The results of shared GO enrichment analysis, including BPs, CCs, and MFs. (B) The results of KEGG enrichment analysis. GO, Gene ontology. BP, biological process; CC, cellular component; Kyoto Encyclopedia of Genes and Genomes; MF, molecular function.
3.3. Construction of PPI network and identification of hub genes
STRING database was utilized to establish a PPI network with moderate evidence interaction scores (>0.4) of co‐DEGs, and isolated node genes were removed (Figure 3A). Cytoscape software was used to visualize the PPI network (Figure 3B). Top 50 hub genes identified by MCC were shown in Table 2.
FIGURE 3.
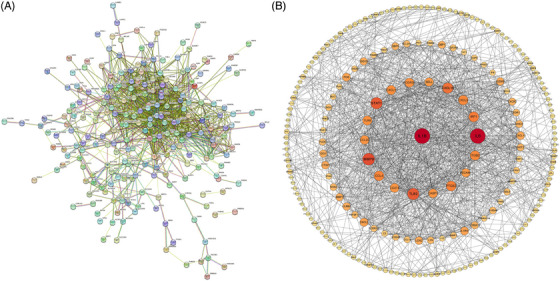
(A) PPI network diagram of co‐DEGs. (B) The processed PPI network diagram of co‐DEGs. Larger shape and darker colors of the node indicated weightier “evidence” of the gene. DEGs, differentially expressed genes; PPI, protein‐protein interaction.
TABLE 2.
Top 50 hub genes in network ranked by maximal clique centrality method.
| Name | Score | Name | Score |
|---|---|---|---|
| IL1B | 5.75E+09 | IDO1 | 8.90E+07 |
| IL6 | 5.74E+09 | TNFSF13B | 4.79E+07 |
| TLR2 | 5.74E+09 | MMP1 | 2.26E+07 |
| CXCL10 | 5.73E+09 | ITGB2 | 1.00E+07 |
| CCL4 | 5.71E+09 | CCL18 | 8387524 |
| STAT1 | 4.98E+09 | LCN2 | 7708097 |
| CASP1 | 4.77E+09 | GBP5 | 4370598 |
| CD274 | 4.34E+09 | S100A12 | 3246055 |
| CXCL1 | 4.33E+09 | S100A9 | 2283318 |
| CCL20 | 3.24E+09 | S100A8 | 2278128 |
| MMP9 | 3.19E+09 | LILRB2 | 1614148 |
| CXCL2 | 3.03E+09 | MNDA | 1532670 |
| SELL | 2.82E+09 | FOS | 1262538 |
| PTGS2 | 2.34E+09 | NCF2 | 1260384 |
| TLR8 | 2.17E+09 | ISG15 | 999481 |
| FCGR3B | 2.12E+09 | GBP1 | 914448 |
| GZMB | 1.46E+09 | MMP7 | 813846 |
| IRF1 | 1.42E+09 | MMP12 | 771240 |
| CXCL9 | 1.41E+09 | CTGF | 758434 |
| NOS2 | 1.01E+09 | PLAU | 740880 |
| CXCR2 | 6.01E+08 | AQP9 | 733368 |
| CXCL11 | 3.69E+08 | ISG20 | 312480 |
| PECAM1 | 2.88E+08 | IFI44 | 211680 |
| IL1RN | 1.96E+08 | IFI6 | 171360 |
| SELE | 1.75E+08 | IFI27 | 136080 |
3.4. Identification of biomarkers using LASSO logistic regression
Biomarkers of psoriasis and IBD were screened using LASSO analysis from the top 50 hub genes, which selected 7 psoriasis‐related features, 23 IBD‐related features, and corresponding coefficients (Figures. 4A–D). FOS, IFI44, MMP9, MNDA, PTGS2, S100A9, and STAT1 were recognized as potential biomarkers of psoriasis, and a screening model of IBD containing 23 genes (CCL20, CD274, CTGF, CXCL1, CXCL10, CXCL2, CXCL9, FCGR3B, FOS, GBP1, GZMB, IFI27, IFI6, IL1RN, ISG15, ISG20, LCN2, LILRB2, MMP12, MMP7, S100A8, TLR8, and TNFSF13B) was developed. FOS is the shared biomarkers between psoriasis and IBD.
FIGURE 4.
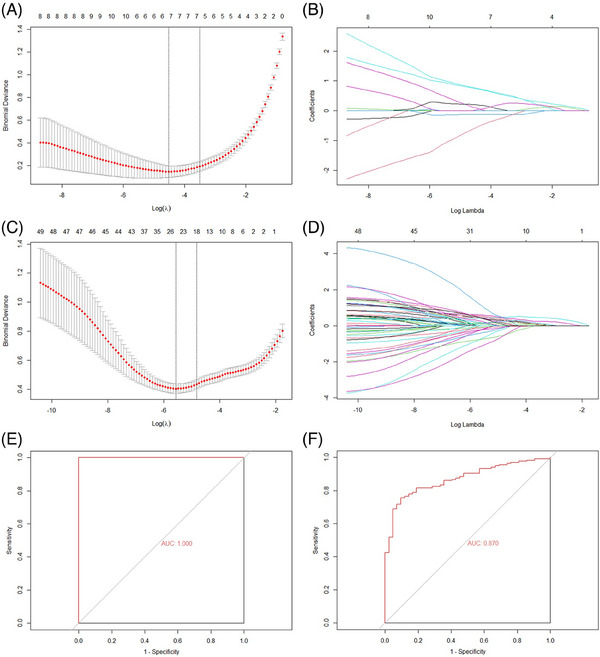
Construction of screening models and screening of biomarkers of the psoriasis and IBD by LASSO regression analysis, and then executes verification. (A)–(B) Tuning feature selection and profiles of the model coefficients of psoriasis. (C)–(D) Tuning feature selection and profiles of the model coefficients of IBD. (E)–(F) ROC curves for assessing the psoriasis and IBD model's screening performance. IBD, inflammatory bowel disease; LASSO, least absolute shrinkage and selection operator.
The above results indicate that FOS may be a key biomarker of the comorbidity of psoriasis and IBD.
The AUC scores in the validation sets of psoriasis (Figure 4E) and IBD (Figure 4F) were 1.000 and 0.870, respectively.
3.5. Immune infiltration analysis and association between identified biomarkers and immune cells
The histogram (Figures 5A and B) shows the proportion of 22 types of immune cells in each specimen. Immunocyte infiltration analysis indicated that the proportions of macrophages M2, mast cells resting, NK cells activated, and plasma cells in psoriasis tissue were remarkably lower than those in control tissue (Figure 6A), and the proportions of B cells naive, macrophages M0, macrophages M1, NK cells resting, T cells CD4 memory activated, T cells CD4 memory resting, and T cells follicular helper in psoriasis tissue were remarkably higher than those in control tissue (Figure 6B). Immunocyte infiltration analysis showed that the proportions of macrophages M2, mast cells resting, B cells memory, dendritic cells resting, and T cells CD8 in IBD tissue were remarkably lower than those in tissue (Figure 7A), and the proportions of macrophages M0, macrophages M1, T cells CD4 memory activated, mast cells activated, neutrophils, plasma cells, and eosinophils in IBD tissue were remarkably higher than those in normal tissue (Figure 7B).
FIGURE 5.

(A) Evaluation and visualization of immune cell infiltration in psoriasis and normal groups. Size of blocks represents different proportions, and its total is equal to 100%. (B) Evaluation and visualization of immune cell infiltration in IBD and normal groups. IBD, inflammatory bowel disease.
FIGURE 6.
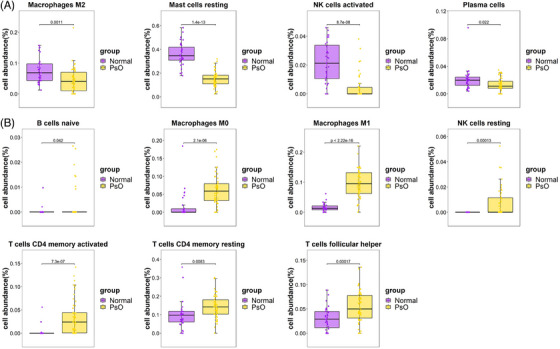
(A) The proportions of immune cells with significantly low expression in psoriasis tissue. (B) The proportions of immune cells with significantly high expression in psoriasis tissue.
FIGURE 7.
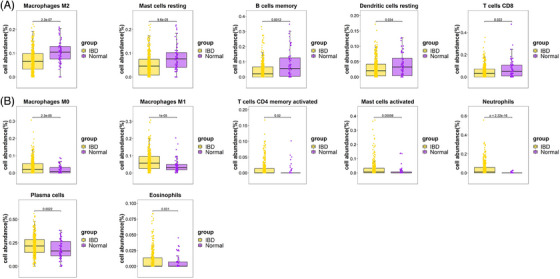
(A) The proportions of immune cells with significantly low expression in IBD tissue. (B) The proportions of immune cells with significantly high expression in IBD tissue. IBD, inflammatory bowel disease.
Compared with the normal group, the macrophages, mast cells resting, and T cells CD4 memory activated have the common characteristics in psoriasis and IBD, and among the subgroups of lymphocytes, the macrophages M0 and M1, and T cells CD4 memory activated are highly expressed in tissues of psoriasis and IBD.
In order to identify the biomarkers related to the immune cells, the research investigated it by Spearman rank correlation analysis. The heatmaps (Figures 8A and B) showed macrophages M0 and macrophages M1 had a significant positively correlation with the biomarkers of psoriasis and IBD, respectively, and neutrophils has a significant positively correlation with IBD, but not with psoriasis. FOS, the common biomarker of psoriasis and IBD, was positively correlated with Mast cells resting and NK cells activated in psoriasis.
FIGURE 8.
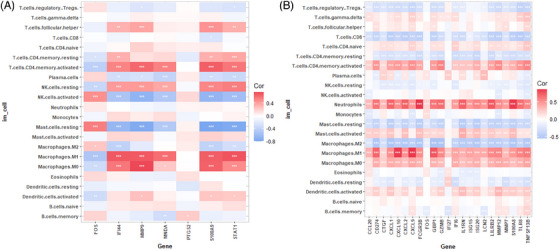
(A) Heatmap of the identified biomarkers of psoriasis and immune cells (* p value < 0.05; ** p‐value < 0.01; *** p‐value < 0.001). (B) Heatmap of the identified biomarkers of IBD and immune cells. IBD, inflammatory bowel disease.
4. DISCUSSION
This study indicated FOS was the shared biomarkers between psoriasis and IBD, and further constructed a screening model with excellent diagnostic capabilities based on individual biomarkers. The discovery of the shared susceptibility genes, biomarkers, immune mechanisms, and the construction of the screening model may 1 provide a foundation for further exploration on the shared pathogenesis of psoriasis and IBD and the development of precise drug targets with dual effects. 2 prompt the occurrence of comorbidities for populations with the screening gene models, predict the direction of disease development, and provide a basis for personalized diagnosis and treatment plans for specific populations. 3 change the current system‐based disease classification methods and shift to defining diseases based on their occurrence and development patterns.
FOS was found as a shared biomarker of psoriasis and IBD. FOS has been proven to be the main regulatory factor for autoimmunity and inflammation in the central nervous system. 27 C‐Fos, a member of the Fos family, showed a correlation with Th1 and Th17 cell‐associated chemokines. 28 However, Th1, Th17 cells and secretion of cytokines can drive underlying pathology of psoriasis, and the imbalance of Th17 promotes IBD. 29 , 30 Recently, the effects of Fra‐1(Fos‐related antigen1), one of the clans of the FOS family in activator protein, are gradually revealed in psoriasis. 31 A significant increase in the proportion of Fos related antigen‑1‑positive intestinal mucosa epithelial cells in active IBD. 32 The above evidence indicates that we need to pay attention to FOS in the population with psoriasis complicated with IBD.
IL1B had the highest score in hub genes ranked by MCC method in both psoriasis and IBD in this research, which is consonant with the conclusions expressed by Wu et al. 33 IL1B was also the hub gene of CD in the research constructed by da Costa et al. 34 An increased IL1B gene expression was detected in affected‐skin psoriasis, when compared to control skin and non‐affected skin psoriasis (p < 0.001). 34
GO and KEGG enrichment analysis indicated that the co‐DEGs of psoriasis and IBD were mainly associated with response to lipopolysaccharide, secretory granule lumen, cytokine activity, and IL‐17 signaling pathway. This result support the viewpoint that psoriasis and IBD were widely recognized as IL‐17‐driven diseases. 35
Compared with the control group, the macrophages, mast cells resting, and T cells CD4 memory activated have the common characteristics in psoriasis and IBD, and among the above subgroups of lymphocytes, the macrophages M0 and M1, and T cells CD4 memory activated are highly expressed in tissues of psoriasis and IBD.
Macrophages are generally divided into two different subgroups named inflammatory M1 and anti‐inflammatory M2 macrophages, and the polarization of macrophages is extremely crucial to lymphocyte activation and proliferation, facilitating the inflammatory process in psoriasis. 36 , 37 Studies reported that multiple molecules and drugs, such as PSORI‐CM02, Shikonin combined with methotrexate have therapeutic effects on psoriasis by modulating the polarization of macrophages. 38 , 39 Results revealed by Gong et al 40 and Su et al 41 indicated that macrophages M0/M1 and T cells CD4 memory activated were significantly increased in psoriatic skin, while mast cells resting was significantly decreased. Similar conclusions existed in IBD, such as the proportions of macrophages M0 in IBD tissues were significantly higher, while mast cells resting were significantly lower compared to the normal tissues. 42 Our results showed that macrophages M0/M1 were significantly increased and macrophages M2 were visible decreased in both psoriasis and IBD, the results are consistent with above previous researches, and further illustrated that macrophages cells were instrumental in these two immune‐mediated inflammatory disorders.
Biologic drugs have prominently altered the therapy of chronic systemic immune‐mediated inflammatory diseases, including psoriasis and IBD, by repressing highly selected cytokine signaling pathways. 5 However, using biologic drugs as the treatment for one disease could lead to the exacerbation of some other diseases. For example, psoriatic patients treated with ixekizumab, an IL‐17A antagonist, might lead to exacerbations of IBD, and there is also a significant worsening of IBD in psoriasis patients treated with IL‐17 inhibitor brodalumab. 5 It is essential to dig out therapy targets for psoriasis complicated with IBD, as FOS detected in this study. In future, FOS and its conjugates may be the future pharmaceutical analysis targets.
This study has the following limitations: (1) This is a bioinformatic study, also it was performed with verification of datasets, the hub genes together with biomarker did not have external verification in vitro or in vivo model, which was the main limitation of this research. (2) The sample of this study was only taken from human tissue; it may not represent the blood situation of the two diseases.
In conclusion, we recognize a similarity of the genetic and immune mechanism between psoriasis and IBD. FOS may contribute to the generation and development of psoriasis complicated with IBD and macrophages cells may provide a new target cell type for treating co‐existed diseases.
CONFLICT OF INTEREST STATEMENT
The authors declare that they have no conflict of interest. The relevant data were obtained on the basis that the GEO ethics committees are open and public; therefore, approval was not required.
Supporting information
Supporting Information
Supporting Information
ACKNOWLEDGMENTS
We sincerely acknowledge all authors who contributed their research data to GEO public databases. This research did not receive any specific grant from funding agencies in the public, commercial, or not‐for‐profit sectors.
Ding R‐L, Zheng Y, Bu J. Exploration of the biomarkers of comorbidity of psoriasis with inflammatory bowel disease and their association with immune infiltration. Skin Res Technol. 2023;29:e13536. 10.1111/srt.13536
DATA AVAILABILITY STATEMENT
The data analyzed in this study is subject to the following licenses/restrictions: The data used in this study came from the Gene Expression Omnibus (GEO) database (https://www.ncbi.nlm.nih.gov/geo/). The data that support the findings of this study are available from J.B. (dr.jinbu@gmail.com) upon reasonable request. Requests to access these datasets should be directed to J.B. (dr.jinbu@gmail.com).
REFERENCES
- 1. Masalha M, Ben‐Dov IZ, Ram O, et al. H3K27Ac modification and gene expression in psoriasis. J Dermatol Sci. 2021;103(2):93‐100. [DOI] [PubMed] [Google Scholar]
- 2. Li F, Zhang Y‐L, Chen X, et al. Mental stress affects the occurrence and development of psoriasis through neuroendocrine‐immune regulation: a narrative review. Int J Dermatol Venereol. 2023;6(2):87‐95. [Google Scholar]
- 3. Lee EB, Wu KK, Lee MP, Bhutani T, Wu JJ. Psoriasis risk factors and triggers. Cutis. 2018;102(5S):18‐20. [PubMed] [Google Scholar]
- 4. Korman NJ. Management of psoriasis as a systemic disease: what is the evidence? Br J Dermatol. 2020;182(4):840‐888. [DOI] [PMC free article] [PubMed] [Google Scholar]
- 5. Alinaghi F, Tekin HG, Burisch J, Wu JJ, Thyssen JP, Egeberg A. Global prevalence and bidirectional association between psoriasis and inflammatory bowel disease‐a systematic review and meta‐analysis. J Crohns Colitis. 2020;14(3):351‐360. [DOI] [PubMed] [Google Scholar]
- 6. Kelsen JR, Sullivan KE. Inflammatory bowel disease in primary immunodeficiencies. Curr Allergy Asthma Rep. 2017;17(8):57. [DOI] [PMC free article] [PubMed] [Google Scholar]
- 7. Fu Y, Lee CH, Chi CC. Association of psoriasis with inflammatory bowel disease: a systematic review and meta‐analysis. JAMA Dermatol. 2018;154(12):1417‐1423. [DOI] [PMC free article] [PubMed] [Google Scholar]
- 8. Jiraskova Zakostelska Z, Reiss Z, Tlaskalova‐Hogenova H, Rob F. Paradoxical reactions to anti‐TNFα and anti‐IL‐17 treatment in psoriasis patients: are skin and/or gut microbiota involved? Dermatol Ther. 2023;13(4):911‐933. [DOI] [PMC free article] [PubMed] [Google Scholar]
- 9. Shaw CA, Kole LCS, Elewski BE. Association of psoriasis/psoriatic arthritis with inflammatory bowel disease influences management strategy. J Eur Acad Dermatol Venereol. 2019;33(11):e431‐e2. [DOI] [PubMed] [Google Scholar]
- 10. Bu J, Ding R, Zhou L, Chen X, Shen E. Epidemiology of psoriasis and comorbid diseases: a narrative review. Front Immunol. 2022;13:880201. [DOI] [PMC free article] [PubMed] [Google Scholar]
- 11. Brand S. Crohn's disease: Th1, Th17 or both? The change of a paradigm: new immunological and genetic insights implicate Th17 cells in the pathogenesis of Crohn's disease. Gut. 2009;58(8):1152‐1167. [DOI] [PubMed] [Google Scholar]
- 12. Ellinghaus D, Ellinghaus E, Nair RP, et al. Combined analysis of genome‐wide association studies for Crohn disease and psoriasis identifies seven shared susceptibility loci. Am J Hum Genet. 2012;90(4):636‐647. [DOI] [PMC free article] [PubMed] [Google Scholar]
- 13. Furiati SC, Catarino JS, Silva MV, et al. Th1, Th17, and Treg responses are differently modulated by TNF‐α inhibitors and methotrexate in psoriasis patients. Sci Rep. 2019;9(1):7526. [DOI] [PMC free article] [PubMed] [Google Scholar]
- 14. Freuer D, Linseisen J, Meisinger C. Association between inflammatory bowel disease and both psoriasis and psoriatic arthritis: a bidirectional 2‐sample mendelian randomization study. JAMA Dermatol. 2022;158(11):1262‐1268. [DOI] [PMC free article] [PubMed] [Google Scholar]
- 15. Cottone M, Sapienza C, Macaluso FS, Cannizzaro M. Psoriasis and inflammatory bowel disease. Dig Dis. 2019;37(6):451‐457. [DOI] [PubMed] [Google Scholar]
- 16. Gupta RK, Gracias DT, Figueroa DS, et al. TWEAK functions with TNF and IL‐17 on keratinocytes and is a potential target for psoriasis therapy. Sci Immunol. 2021;6(65):eabi8823. [DOI] [PMC free article] [PubMed] [Google Scholar]
- 17. Luo Y, Luo Y, Chang J, Xiao Z, Zhou B. Identification of candidate biomarkers and pathways associated with psoriasis using bioinformatics analysis. Hereditas. 2020;157(1):30. [DOI] [PMC free article] [PubMed] [Google Scholar]
- 18. de Lange KM, Moutsianas L, Lee JC, et al. Genome‐wide association study implicates immune activation of multiple integrin genes in inflammatory bowel disease. Nat Genet. 2017;49(2):256‐261. [DOI] [PMC free article] [PubMed] [Google Scholar]
- 19. Chen ST, Yang N. Constructing ferroptosis‐related competing endogenous RNA networks and exploring potential biomarkers correlated with immune infiltration cells in asthma using combinative bioinformatics strategy. BMC Genom. 2023;24(1):294. [DOI] [PMC free article] [PubMed] [Google Scholar]
- 20. Ritchie ME, Phipson B, Wu D, et al. limma powers differential expression analyses for RNA‐sequencing and microarray studies. Nucleic Acids Res. 2015;43(7):e47. [DOI] [PMC free article] [PubMed] [Google Scholar]
- 21. Ito K, Murphy D. Application of ggplot2 to pharmacometric graphics. CPT Pharmacometrics Syst Pharmacol. 2013;2(10):e79. [DOI] [PMC free article] [PubMed] [Google Scholar]
- 22. Yu G, Wang LG, Han Y, He QY. clusterProfiler: an R package for comparing biological themes among gene clusters. Omics. 2012;16(5):284‐287. [DOI] [PMC free article] [PubMed] [Google Scholar]
- 23. Gene ontology consortium: going forward. Nucleic Acids Res. 2015;43(Database issue):D1049‐1056. [DOI] [PMC free article] [PubMed] [Google Scholar]
- 24. Kanehisa M, Furumichi M, Tanabe M, Sato Y, Morishima K. KEGG: new perspectives on genomes, pathways, diseases and drugs. Nucleic Acids Res. 2017;45(D1):D353‐d361. [DOI] [PMC free article] [PubMed] [Google Scholar]
- 25. Szklarczyk D, Gable AL, Nastou KC, et al. The STRING database in 2021: customizable protein‐protein networks, and functional characterization of user‐uploaded gene/measurement sets. Nucleic Acids Res. 2021;49(D1):D605‐d612. [DOI] [PMC free article] [PubMed] [Google Scholar]
- 26. Robin X, Turck N, Hainard A, et al. pROC: an open‐source package for R and S+ to analyze and compare ROC curves. BMC Bioinform. 2011;12:77. [DOI] [PMC free article] [PubMed] [Google Scholar]
- 27. He S, Peng Y, Chen X, Ou Y. Causality between inflammatory bowel disease and the cerebral cortex: insights from Mendelian randomization and integrated bioinformatics analysis. Front Immunol. 2023;14:1175873. [DOI] [PMC free article] [PubMed] [Google Scholar]
- 28. Xie L, Lv J, Saimaier K, et al. The novel small molecule TPN10518 alleviates EAE pathogenesis by inhibiting AP1 to depress Th1/Th17 cell differentiation. Int Immunopharmacol. 2023;123:110787. [DOI] [PubMed] [Google Scholar]
- 29. Jiang Z, Jiang X, Chen A, He W. Platelet activation: a promoter for psoriasis and its comorbidity, cardiovascular disease. Front Immunol. 2023;14:1238647. [DOI] [PMC free article] [PubMed] [Google Scholar]
- 30. Medina TS, Murison A, Smith M, et al. The chromatin and single‐cell transcriptional landscapes of CD4 T cells in inflammatory bowel disease link risk loci with a proinflammatory Th17 cell population. Front Immunol. 2023;14:1161901. [DOI] [PMC free article] [PubMed] [Google Scholar]
- 31. He YY, Zhou HF, Chen L, et al. The Fra‐1: Novel role in regulating extensive immune cell states and affecting inflammatory diseases. Front Immunol. 2022;13:954744. [DOI] [PMC free article] [PubMed] [Google Scholar]
- 32. Wang X, Guo R, Lv Y, Fu R. The regulatory role of Fos related antigen‑1 in inflammatory bowel disease. Mol Med Rep. 2018;17(1):1979‐1985. [DOI] [PubMed] [Google Scholar]
- 33. Wu S, Zeng L, Wang J. A diagnostic model based on gene biomarkers for Crohn's disease. Gen Physiol Biophys. 2023;42(4):339‐347. [DOI] [PubMed] [Google Scholar]
- 34. da Costa LCO, Gardinassi LG, Veras FP, et al. Expression of B lymphocyte‐induced maturation protein 1 (Blimp‐1) in keratinocyte and cytokine signalling drives human Th17 response in psoriasis. Arch Dermatol Res. 2023;315(3):481‐490. [DOI] [PubMed] [Google Scholar]
- 35. Kumar R, Theiss AL, Venuprasad K. RORγt protein modifications and IL‐17‐mediated inflammation. Trends Immunol. 2021;42(11):1037‐1050. [DOI] [PMC free article] [PubMed] [Google Scholar]
- 36. Hou Y, Zhu L, Tian H, et al. IL‐23‐induced macrophage polarization and its pathological roles in mice with imiquimod‐induced psoriasis. Protein Cell. 2018;9(12):1027‐1038. [DOI] [PMC free article] [PubMed] [Google Scholar]
- 37. Liu S, Liu F, Zhang Z, Zhuang Z, Yuan X, Chen Y. The SELP, CD93, IL2RG, and VAV1 genes associated with atherosclerosis may be potential diagnostic biomarkers for psoriasis. J Inflamm Res. 2023;16:827‐843. [DOI] [PMC free article] [PubMed] [Google Scholar]
- 38. Li L, Zhang HY, Zhong XQ, et al. PSORI‐CM02 formula alleviates imiquimod‐induced psoriasis via affecting macrophage infiltration and polarization. Life Sci. 2020;243:117231. [DOI] [PubMed] [Google Scholar]
- 39. Tao T, Chen Y, Lai B, et al. Shikonin combined with methotrexate regulate macrophage polarization to treat psoriasis. Bioengineered. 2022;13(4):11146‐11155. [DOI] [PMC free article] [PubMed] [Google Scholar]
- 40. Gong X, Wang W. Profiles of innate immune cell infiltration and related core genes in psoriasis. Biomed Res Int. 2021;2021:6656622. [DOI] [PMC free article] [PubMed] [Google Scholar]
- 41. Su W, Wei Y, Huang B, Ji J. Identification of hub genes and immune infiltration in psoriasis by bioinformatics method. Front Genet. 2021;12:606065. [DOI] [PMC free article] [PubMed] [Google Scholar]
- 42. Tang Q, Shi X, Xu Y, et al. Identification and validation of the diagnostic markers for inflammatory bowel disease by bioinformatics analysis and machine learning. Biochem Genet. 2023, Jun 23. Online ahead of print. doi: 10.1007/s10528-023-10422-9 [DOI] [PubMed] [Google Scholar]
Associated Data
This section collects any data citations, data availability statements, or supplementary materials included in this article.
Supplementary Materials
Supporting Information
Supporting Information
Data Availability Statement
The data analyzed in this study is subject to the following licenses/restrictions: The data used in this study came from the Gene Expression Omnibus (GEO) database (https://www.ncbi.nlm.nih.gov/geo/). The data that support the findings of this study are available from J.B. (dr.jinbu@gmail.com) upon reasonable request. Requests to access these datasets should be directed to J.B. (dr.jinbu@gmail.com).


