Abstract
This study was conducted to quantitatively examine the effects of respiratory protective equipment (respirators) and various other types of protectors in preventing the scattering of vocalization droplets. Each of 12 adult male volunteers was asked to vocalize intermittently for 1 min at a target intensity of approximately 100 dBA in an experimental room adjusted to a humidity of approximately 60–70%. The subjects vocalized while wearing respirators, other types of protectors, or no protectors at all. The droplet concentration in a particle size range of 0.3 to 10 μm was measured under each experimental condition, and the transmitted particle concentration and penetration were calculated. The concentration and penetration of particles transmitted from the respirators were lower than those transmitted from the other protectors examined. The probability of infection reduction through the use of the protectors was estimated from the data obtained on the effectiveness of the protectors in preventing the scattering of droplets. We concluded that there is no need for additional droplet scattering prevention in various work settings when appropriate respirators are used under optimal conditions.
Keywords: Airborne particulate matter, Infectious disease transmission, Protective devices, Respiratory infections/prevention
Introduction
In addition to the established infection routes of surface contact, air, and droplets, a new infection route has recently been drawing attention with the spread of COVID-19. The terms “micro-droplet infection” and “aerosol infection” have come into use to describe this new transmission route, and new infection-prevention measures are now required in conjunction with the other measures conventionally applied.
A review published in 2020 provided a schematic diagram of the particle size distribution of droplets generated from a person when coughing, and the distance reached by droplets generated by coughing or sneezing1). The size and number of droplets expelled by a person greatly depend on factors such as the productive action (coughing, sneezing, vocalization, etc.), the vocalization intensity, gender, and various environmental factors. They are also reported to be bimodal2) and difficulties in droplet measurement have limited the number of reports and produced highly variable results2,3,4,5,6). Among the droplets expelled by humans, large particles of more than 10 μm in diameter deposit on the floor and walls of a room in a relatively short time, and smaller droplets remain airborne and gradually shrink to a microscopic size through evaporation. There has been some speculation that a microscopic droplet of this type may become a source of infection by floating in air for a long period and becoming the nucleus of a larger droplet. It is also believed to be important to secure a physical distance to prevent infection, as a relatively larger droplet expelled in normal conversation or through coughing can directly reach a distance of 1 to 2 m1).
According to an analysis of droplet penetration by particle size range in a computational fluid dynamics (CFD) simulation of droplets using the supercomputer FUGAKU7), masks are more efficient in collecting larger particles. The investigators performing the analysis calculated the droplet penetration in the CFD simulation based on the particle-collection efficiency of a mask demonstrated experimentally. Their results showed that about 40–50% of the particles smaller than 10 μm corresponded to aerosol leaked from the mask. Further, a mask made from non-woven fabric is difficult to breathe through, which results in a high rate of droplet transmission from the gaps on the sides of the mask and a low rate of transmission through the front. A cloth mask, in contrast, is easy to breathe through, which results in a high droplet transmission from the front. While some behavior analyses of droplets have been carried out through CFD simulations8), many experimental studies have been performed to clarify the effects of masks9,10,11,12,13,14,15,16,17,18,19,20,21,22,23,24,25,26).
Fischer et al. performed optimal imaging experiments to examine the filtration of expelled droplets during speech through the wearing of a face mask or substitute (protector)9). Compared to that without a protector, the droplet count was reduced to the following approximate levels by the protectors tested: <1/1,000 by a fit-tested N95 respirator, <1/100 by a surgical mask, <1/20 by a polypropylene mask or polypropylene/cotton mask, <1/10–1/5 by cotton masks of various types, and <1/10–1/5 by a N95 respirator fitted with an exhaust valve. The droplet count while wearing a neck gaiter was equivalent to that without a protector. With a bandana, the total droplet count exceeded 50% of that without a protector. Rodriguez-Palacios et al. applied a bacterial suspension spray simulation model that emitted droplets through a sneezing-like action10). They investigated the degree to which common fabric masks reduced splashes on a surface placed within 1.8 m, the minimum distance recommended as a “social distance” for protection against SARS-CoV-2 infection, from the emission source. Asadi et al. performed experiments with various types of masks using 10 healthy non-smokers (6 men and 4 women) aged 18–45 yr11). Subjects with or without masks were placed in an experimental booth equipped with a droplet-collecting funnel and asked to perform various types of breathing and vocalizations. The number of particles with aerodynamic diameters in a range from 0.3 to 20 µm was counted using an aerodynamic diameter measuring device (APS). Cowling et al., Long et al. and Tcharkhtchi et al. reviewed the effects of protectors in preventing the splashing of droplets during speech27,28,29). Locke et al. systematically reviewed the aerosol transmission of infectious disease and the efficacy of personal protective equipment30). Technical challenges have held back the various experiments done to verify the protective effects of masks and protectors, especially those in which the data verified have been from human subjects.
Our group conducted this study to develop and verify an experimental approach for the assessment of vocalization droplet prevention and to quantitatively evaluate the preventive performance of protectors and respirators. We examined the droplets generated during vocalization before and after various protectors were attached, to measure the change in the number of particles in the particle size range corresponding to aerosol, 0.3 to 10 μm. The target subjects were adult men, as the work space of interest under the grant funding this study was a construction site. We believe, however, that the results can be applied to work spaces of various other types, as well.
Methods
Protectors
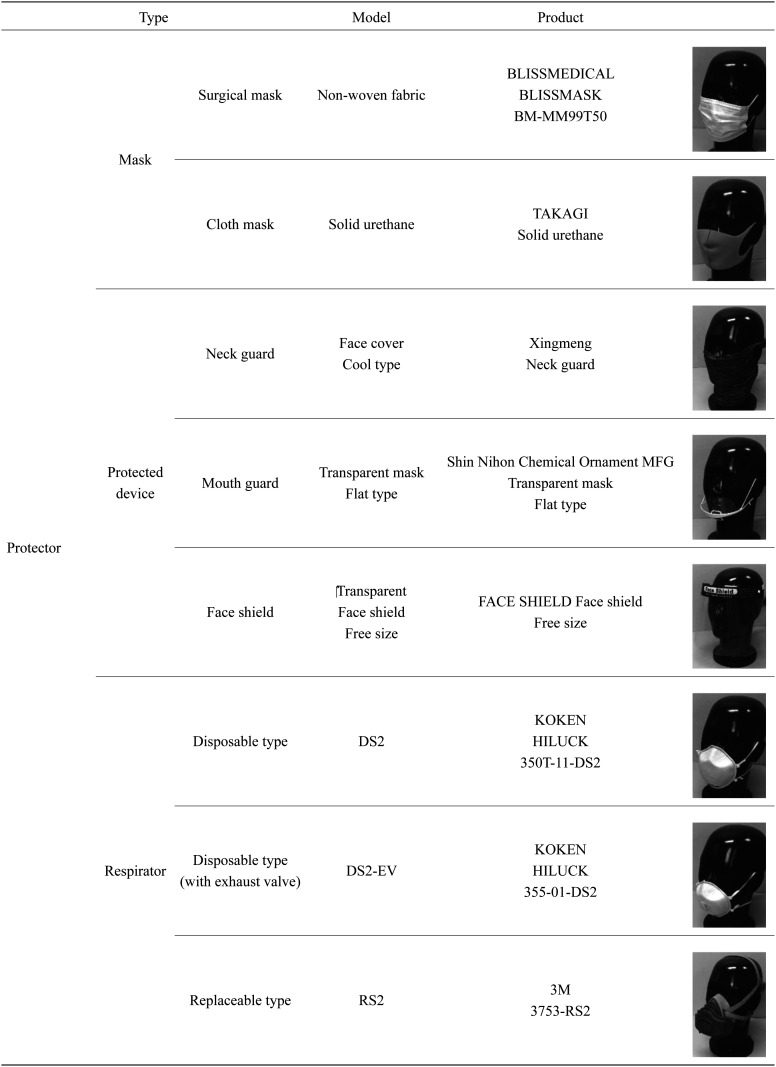
Table 1 shows the protectors and respirators used in this study. Three types of protective wear were assessed: masks (the surgical and cloth types most frequently used in Japan), protective devices (a mouth guard, face shield, and neck guard), and respirators (disposable type DS2/N95-equivalent respirator, replaceable type RS2 respirator). The experiments with the surgical mask were performed under two conditions: with the mask worn over the nose and with the nose exposed.
Table 1. Masks, protected devices and respirators.
Experimental conditions
The following conditions were set based on the results of the previous research, the performance of the measuring instrument, and preliminary experiments.
1) As the workspace of interest under the grant funding this study was a construction site, the target subjects were adult males (22–50 yr old, 12 persons in total) in the present study. We also took into account the current situation in which most construction workers were male and it was difficult to secure a sufficient number of female subjects due to COVID-19.
2) The particle size range was set to 0.3 to 10 μm. This range corresponded to aerosol, and thus was expected to result in the highest possible rates of particle penetration through the protectors.
3) The subjects were asked to vocalize the vowel “ɑː” intermittently for 1 min at a target vocalization intensity of 100 dBA, as measured by an NL-21 Sound Level Meter (RION Co., Ltd., Tokyo, Japan) placed beside an optical particle counter (TSI OPS Model 3330; TSI Incorporated, Shoreview, MN, USA).
4) The humidity was adjusted to approximately 60–70% using an air purifier with a humidification function (SHARP KI-EX75W; Sharp Corporation, Osaka, Japan).
Experimental procedure
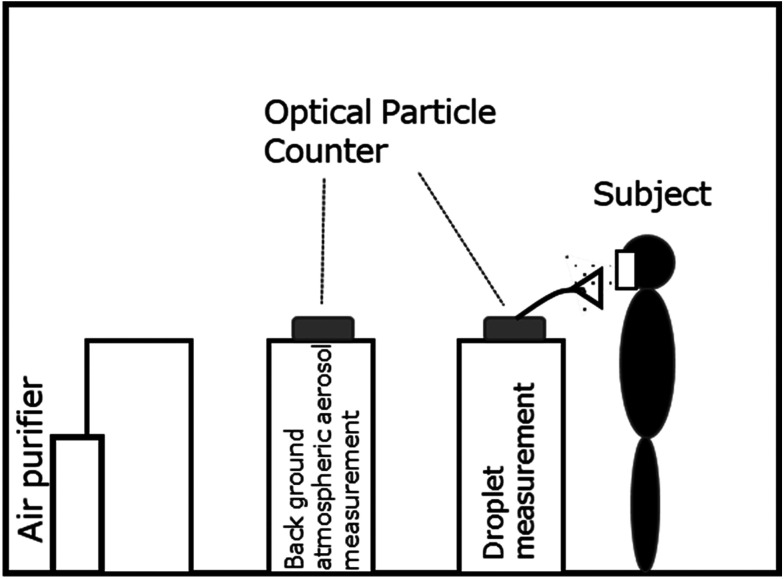
An outline of the experimental system is shown in Fig. 1. The experiment was conducted in an experimental room equipped with a local exhaust ventilation system (width 2.5 m × depth 2.0 m × height 2.0 m=volume 10 m3) equipped with an air purifier. The particle concentration was measured using two optical particle counters: one to measure the particle concentration in the background atmospheric aerosol in the room, the other to measure the droplet concentration in the vicinity of the subject’s mouth during vocalization.
Fig. 1.
Experimental setup.
Once the subject was stationed at a predetermined position in the room, an optical particle counters (TSI OPS Model 3330, installed at a predetermined measurement point) quantified the concentration of aerosol in each of the following light-scattering diameter ranges (within the total range of 0.3 to 10 μm): 0.3 μm<, 0.5 μm<, 1.0 μm<, 2.0 μm<, 5.0 μm<. After confirming that these particle concentrations were sufficiently reduced and stable, the droplet concentration measurements were commenced. The experiment was performed several times for each subject using all of the protectors examined.
The background aerosol concentration in the experimental room measured in an unmanned state was greatly affected by the weather and other parameters. Under normal conditions, the number concentration was about 10–70 particles/cm3 for the total particle size range (0.3–10 μm). In sub-ranges within this total, the concentrations were as follows: 8–60 particles/cm3 for 0.3 μm<, 1–9 particles/cm3 for 0.5 μm<, 0.1–1 particles/cm3 for 1.0 μm<, 0.02–0.5 particles/cm3 for 2.0 μm<, 0.001–0.01 particles/cm3 for 5.0 μm<. When the air purifier was in operation, the total number concentration of particles was reduced to approximately 2–20 particles/cm3. The concentrations were reduced to the following levels in the respective size ranges: 1.5–17 particles/cm3 for 0.3 μm<, 0.2–2 particles/cm3 for 0.5 μm<, 0.04–0.4 particles/cm3 for 1.0 μm<, 0.01 to 0.15 particles/cm3 for 2.0 μm<, and 0.001 to 0.005 particles/cm3 for 5.0 μm< (listed as reference data in Table 2). Note that the movements of humans in the laboratory during the experiment generated fine particles. The resulting increase in the aerosol concentration, together with fluctuations in time position, may have contributed to experimental error.
Table 2. Experimental results on vocalization droplets and atmospheric aerosol.
| Particle size range (0.3–10) [μm] | Vocalization droplet [particles/cm3] (N=12, logarithmic mean ± 95%CI) | Atmospheric aerosol [particles/cm3] without air purifier (Concentration range) | Atmospheric aerosol [particles/cm3] with air purifier (Concentration range) | |
|---|---|---|---|---|
| Number concentration | Total | 2.1 ± 0.3 | 10–70 | 2–20 |
| 0.3< | 1.4 ± 0.2 | 8–60 | 1.5–17 | |
| 0.5< | 0.30 ± 0.05 | 1–9 | 0.2–2 | |
| 1< | 0.13 ± 0.02 | 0.1–1 | 0.04–0.4 | |
| 2< | 0.10 ± 0.02 | 0.02–0.5 | 0.01–0.15 | |
| 5< | 0.007 ± 0.002 | 0.001–0.01 | 0.001–0.005 |
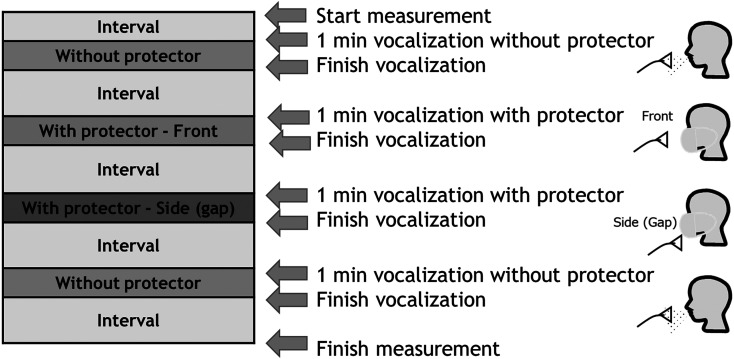
Figure 2 shows the timetable for the measurements of the vocalization droplet concentrations in this study. The optical particle sizer (OPS) used to measure the background particle concentration remained in operation throughout the whole experiment, and the OPS for droplet measurement was switched on when the subject arrived at the predetermined measurement position in the room. First, the concentration of generated droplets was measured for 1 min as the subject vocalized without wearing any protector. The protector was then attached, after waiting for a predetermined interval to allow the background aerosol concentration in the room to stabilize. The droplet concentration was then measured at two locations: one at a distance of about 10 cm from the fronts of subject’s mouth (fronts), the other at a distance of about 10 cm from the gaps in the sides of the protector (sides). The particle and droplet concentrations were measured by the OPS at a flow rate of 1 L/min. Finally, the droplet concentration was measured again as the subject vocalized without wearing the protector, and the change in the concentration was observed.
Fig. 2.
Timetable for the experiment. First, the concentration of the generated droplets was measured for 1 min as the subject vocalized without wearing any protector. The protector was then attached, after waiting for a predetermined interval to allow the background aerosol concentration in the room to stabilize. The droplet concentration was then measured at two locations: one at a distance of about 10 cm from the front of the subject’s mouth (front), the other at a distance of about 10 cm from a gap in the side of the protector (side). Finally, the droplet concentration was measured again as the subject vocalized without wearing the protector.
Results
First, we quantified the droplet concentration generated during vocalization. Next, we calculated the transmitted particle number concentration and particle penetration through the protectors. The concentration and penetration of particles transmitted from the respirators were lower than those transmitted from the various other protectors examined. The concentration and penetration of particles transmitted from the surgical mask were lower than those from the cloth mask, neck guard, mouth guard, and face shield. The number of leaked particles increased, however, when the surgical mask was worn with the nose exposed. The details follow below.
Quantification of the droplets generated during vocalization
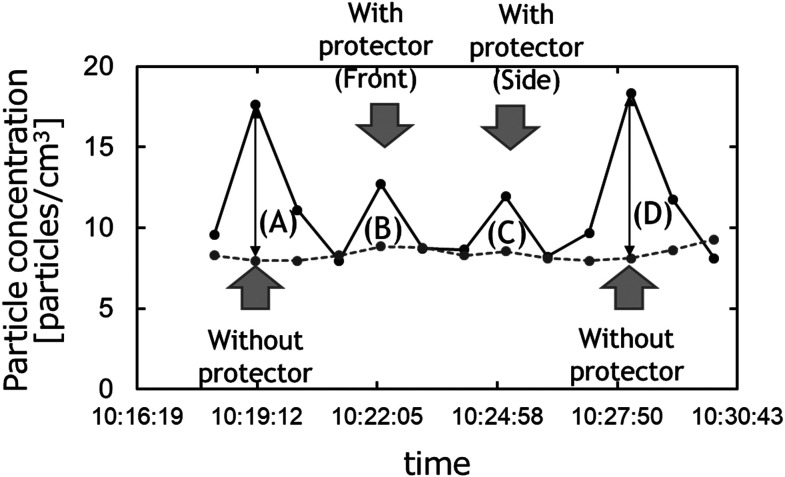
We will begin this section by describing our method for quantifying the droplets generated (total number concentration of the particles). Figure 3 shows an example of the total number concentration measured using the procedure described in the last section. The horizontal axis shows time and the vertical axis shows the particle number concentration. The dotted and solid lines plot the background particle concentration and the particle concentration during vocalization, respectively. The peaks of the solid lines at positions (A) to (D) indicate the particle concentrations, inclusive of the droplet particles, with and without protectors. The number of droplet particles generated with and without protectors can be calculated from the difference (arrow) between the peak of the solid line at each position (A) to (D) and the background particle concentration plotted by the dotted line. The droplet concentration was defined by the following equation.
Fig. 3.
An example of the experimental results obtained on the total particle number concentration. First, the concentration of generated droplets was measured without any protector (A). The protector was then attached, after waiting for a predetermined interval to allow the background aerosol concentration in the room to stabilize. The droplet concentration was then measured at two locations: one at a distance of about 10 cm from the front of subject’s mouth (front, B), the other at a distance of about 10 cm from a gap in the side of the protector (side, C). Finally, the droplet concentration was measured again as the subject vocalized without wearing the protector (D).
Droplet concentration = (Particle concentration plotted by solid line – Background particle concentration plotted by dotted line) at (A) to (D) in Fig. 3 (1)
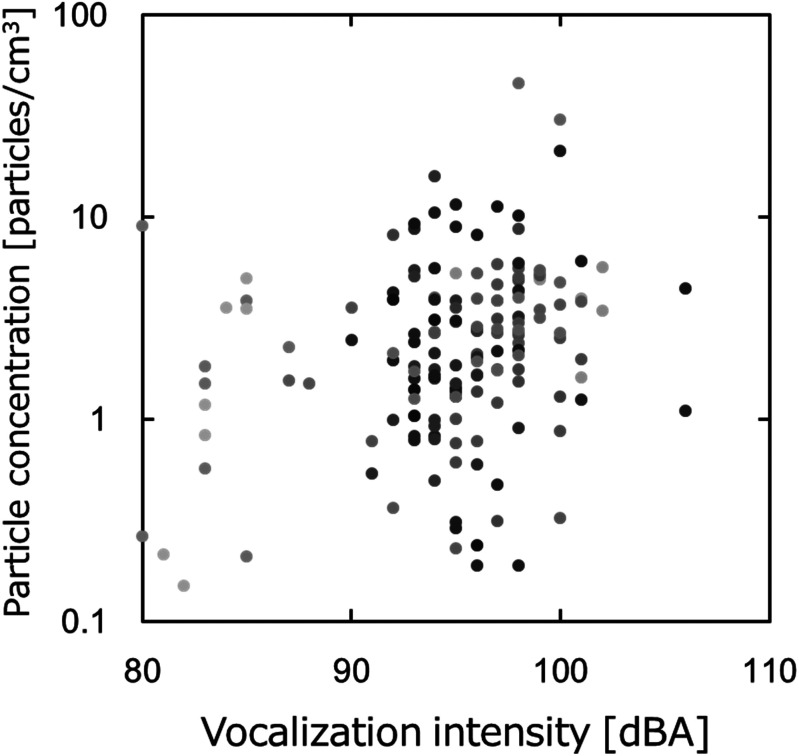
Next, we will describe the relationship between the vocalization intensity and the amount of droplets (total particle number concentration) generated during vocalization, and the variation in the amount of droplets generated. Figure 4 shows the relationship between the vocalization intensity and the amount of droplets observed without a protector. Although the data points showing abundant droplets tend to increase as the vocalization intensity increases, we can see differences between the samples owing to instances of high-intensity generation accompanied by small amounts of droplets. In addition to large individual differences, we may also need to consider the environmental influences. And for data points with extremely high number concentrations, we should also consider the influence of any pre-existing contamination by atmospheric aerosol.
Fig. 4.
Relationship between the vocalization intensity and total particle concentration without a protector (plots colored by subject).
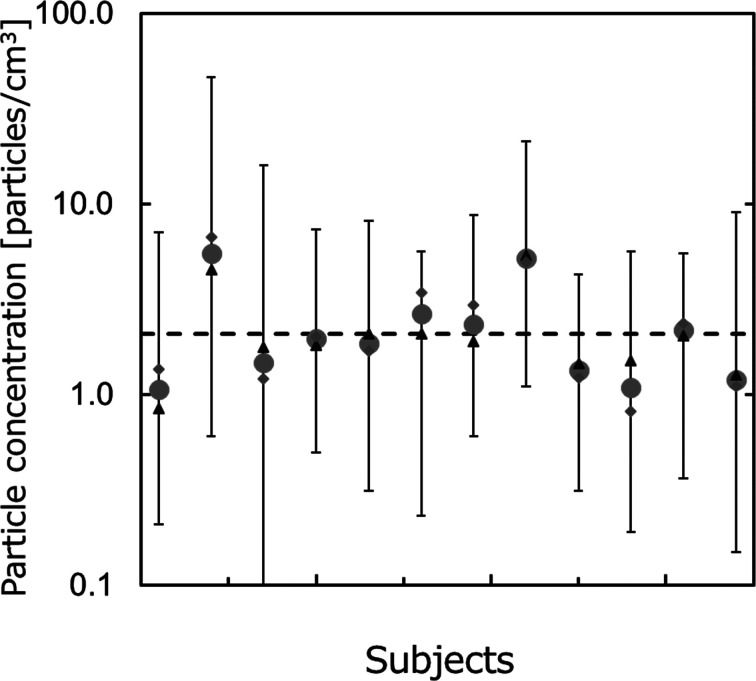
Figure 5 shows the vocalization droplet concentration for each subject without a protector. The horizontal and vertical axes respectively represent the subjects and droplet levels generated during vocalization (total number concentrations of the particles), expressed as logarithmic means of the particle concentrations in (A) and (D). The bars are the maximum and minimum values. The total mean value of each subject is about 1–7 particles/cm3, and the variation of each subject is 0–6 times the mean. The dashed line represents the average droplet amount calculated for all subjects. The droplet level at the time of vocalization is thought to be greatly affected by individual differences and the environment. While the data are not broken down for each particle size, the number concentration rises as the particle size decreases and tends to decrease by about an order of magnitude for each stepwise increase in the particle size range. These tendencies are similar to those shown in previous works and previous measurements of atmospheric aerosol.
Fig. 5.
Fluctuation of the number concentration of vocalization droplets.
(●, Total mean; ▲, Mean for (A) in Fig. 3;◆, Mean for (D) in Fig. 3; bar, max and min.
In addition, the logarithmic mean number concentration of droplets generated during vocalization is 2.1 ± 0.3 particles/cm3 for particles in the total size range. As the particle size increases, the number concentration decreases: 1.4 ± 0.2 particles/cm3 for 0.3 μm<, 0.30 ± 0.05 particles/cm3 for 0.5 μm<, 0.13 ± 0.02 particles/cm3 for 1.0 μm<, 0.10 ± 0.02 particles/cm3 for 2.0 μm<, 0.007 ± 0.002 particles/cm3 for 5.0 μm< (these values are shown in Table 2 for reference). Note, moreover, that the droplet amount generated is much smaller than the concentration of fine particles in the atmosphere shown previously.
Even in the preliminary experiments and previous research, the amount and distribution of droplets during coughing, sneezing, and vocalization vary widely due to individual differences and environmental influences. When the intensity of coughing, sneezing, and vocalization increases, the droplet amount is likely to increase. The difference is several times higher at most, on average, however, and individualdifferences have a very large influence. For these reasons, we decided to set the target utterance intensity to 100 dBA in our experiments, for guidance. Further, our calculation for the particle penetration took account of the average vocalization particle concentration without a protector for each subject by considering the error in the denominator.
Calculation of the particle penetration
The particle penetration was defined by Equation (2) and calculated by the following method.
(2)
where, the peaks at positions (B) and (C) in Fig. 5 are the particle concentrations measured experimentally at the fronts and sides of a subject wearing a protector, respectively.
The mean droplet concentrations for each subject without a protector at positions (A) and (D) (shown by a triangle (▲) and rhombus (◆), respectively) are compared with the total mean concentration for each subject (shown by a circle (●)). The experimental fluctuation increases as the total number concentration rises, and the error stays within 30% at maximum. That is, there is almost no difference in the average droplet amount between the measurements taken before the protector was attached ((A) ▲) and measurements taken after the protector was removed ((D) ◆). The mean measured at each measurement time is close to the average for each subject, with an error considerably smaller than the variation of each measured value. Therefore, we calculated the penetration with Equation (3) using the mean concentration of each subject in the denominator of Equation (2).
(3)
The penetration in each particle size range was determined by the same calculation
Transmitted particle number concentration
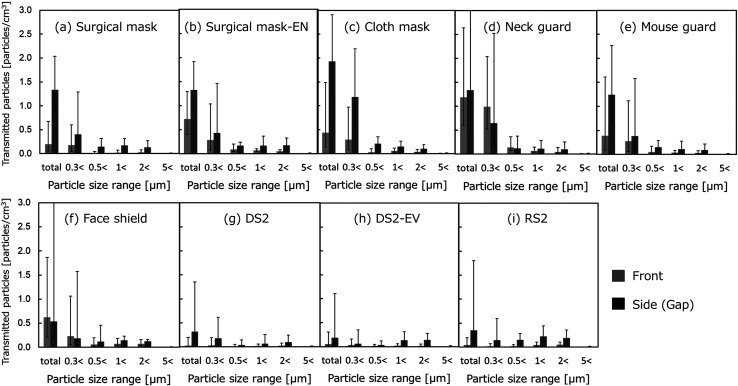
Figure 6 (a)–(i) show the transmitted particle number concentrations calculated for each particle size range with the various protectors attached. The results measured from the fronts and sides of the protectors are shown in gray and black, respectively. The error bars indicate the confidence interval (95% CI). Many of the droplets measured in the particle size range corresponding to aerosol (from 0.3 to 10 μm) fell in the particle size range of 0.3 to 1 μm, the range used as the controlling factor for the total number concentration. The absolute value of the number concentration of the transmitted particles of less than 0.5 μm was relatively small for all of the protectors.
Fig. 6.
Experimental results on the transmitted particles (N=12, logarithmic mean ± 95% CI).
As seen from the results of the measurements taken with correctly fitted surgical masks (Fig. 6 (a)) and with surgical masks worn with the nose exposed (Fig. 6 (b)), the leakage of the finest particles was more notable from the gaps around the sides of the mask than from the front. When the masks were attached with the nose exposed, the number of particles leaking from the front increased.
The cloth mask and neck guard were easier to breathe through than the surgical mask, and thus allowed more leakage from the front. While the cloth mask seemed to fit, there were still gaps around the sides of the mask from which leaks seemed to occur. The thin fabric of the neck guard, on the other hand, seemed to allow the leakage of particles from every part of the guard.
The mouth guard and face shield had plastic walls directly in front of the face, hence particles were unlikely to splash directly out from the protectors to the front. Compared to the other protectors, however, the distance (space) between the mouth and the mouth guard or face shield allowed the subject to breathe freely, with no resistance. As a result, leakage seemed to occur from all sides of these protectors, leading to a diffusion of particles leaking from the spaces within these protectors.
The respirators, whether disposable or replaceable, or equipped with an exhaust valve or not, allowed the transmission of fewer particles than the other types of protectors. Judging from the observations of the particles in front, some displacement of the respirators was thought to occur when the subjects opened and closed their mouths to produce loud vocalizations. While the performance of the respirators in this state may not reflect strict particle collection, the respirators blocked the transmission of almost all of the droplets in most of the particle size ranges.
Penetration
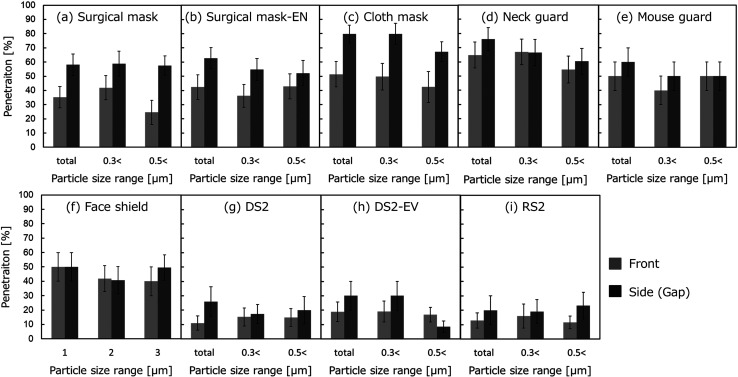
Figure 7 (a)–(i) show the particle penetrations calculated for each particle size with the various protectors attached. The measurement results from the fronts and sides of the protectors are shown in gray and black, respectively. The error bars indicate the confidence interval (68% CI; ± σ). As the particle size increases in the calculations of penetration, the particle concentration decreases (as denoted in Sections 1 and 3), and the denominator of Equation (1) decreases, as well. On the other hand, the number concentration of droplets in the size range above 0.5 μm was particularly small in the experimental results. Therefore, we note that the chance of contamination with background particle contamination is substantial. For this reason, even one contaminating particle may have had an extremely large effect on penetration, leading to an overestimation of the penetration value. Note, also, that no calculations were done to determine the penetration for the size range over 1.0 μm, as the mean number concentration of droplets generated during vocalization in the size range above 1.0 μm was lower than about 0.1 particles/cm3.
Fig. 7.
Experimental results on penetration (N=12, average ± 68% CI).
As shown in the results for the surgical masks (Fig. 7 (a) and (b)), the penetration rate was about 30% from the front and exceeded 40% from the sides, when the mask was correctly worn. Particles may have leaked from the gaps on the sides of the mask covering the mouth and nose, as the mask made breathing difficult and easily bunched, creating gaps. In this case, some of the measurement results from the front may actually represent leaks from the sides. In other words, we assume that the higher rate of penetration compared to the simulation result can be explained by difficulty in strictly distinguishing between transmission and leakage in the experiment. When the mask was worn with the nose exposed, on the other hand, the penetration rate was as high as that measured with the mask correctly worn. In addition to exhaling directly from the front, the protruding nose caused the mask to slacken, which tended to allow the formation of many gaps from which leaks were likely to occur.
The cloth mask and neck guard both had coarser pores (SEM images of all protectors are published in the report funded by Health and Labor Sciences Research Grant 2020 in Japan (Grant No. 20CA2043)). They were also more breathable than the surgical mask, and were shown to be relatively leaky, with penetration rates on the fronts as high as about 50–60%. The cloth mask seemed to fit, but parts of it were open. Additional leakage was caused by gaps that seemed to form in the cloth mask, especially when the mouth opened to vocalize. The neck guard was composed of a thin fabric and seemed to slacken in some locations, leading to added leakage beyond that taking place through the neck guard fabric.
The experimental penetration through the mouth guard and face shield varied widely. We believe that the high variability of the results can be attributed to the various open spaces surrounding the plastic plate blocking penetration at the front. The particles were evenly diffused into the room from those spaces, which resulted in extremely high or low concentrations of experimental particles in the front in some cases. The average penetration rate was about 40–50%, approximately matching those of the cloth mask and neck guard. Caution in interpretation is due here, however, as our experiment may have not fully captured the behavior of the leaked particles.
As mentioned in our results on the transmitted particle number concentration, almost no vocalization droplets were observed in the assessments of the respirators. The penetration rates were as low as 10–20% on both the fronts and sides of the respirators. The high particle collection performance of the respirators strongly prevented the scattering of droplets.
Discussion
Table 3 shows the logarithmic mean of the number concentration of transmitted particles and the particle penetration rate obtained experimentally for each subject, and the 68% CI and average particle penetration rate. The number of transmitted particles is expressed to 2 to 3 digits after the decimal point, and the particle penetration rate is expressed as an integer.
Table 3. Experimental results on the splash-preventive effects of various protectors averaged transmitted particles and penetration (N=12).
| Type | Size range [μm] | Transmitted particles [particles/cm3] (logarithmic mean) | Penetration [%] (average ± 68% CI) | ||
|---|---|---|---|---|---|
| Front | Side | Front | Side | ||
| (a) Surgical mask (non‐woven fabric) | Total | 0.2 | 1.34 | 35 ± 8 | 58 ± 8 |
| 0.3< | 0.18 | 0.4 | 42 ± 9 | 59 ± 9 | |
| 0.5< | 0.01 | 0.15 | 25 ± 8 | 57 ± 7 | |
| 1< | 0.02 | 0.17 | - | - | |
| 2< | 0.024 | 0.14 | - | - | |
| 5< | 0.002 | 0.008 | - | - | |
| (b) Surgical mask, exposed nose (EN) (non‐woven fabric) | Total | 0.72 | 1.33 | 42 ± 9 | 63 ± 7 |
| 0.3< | 0.29 | 0.43 | 36 ± 8 | 55 ± 8 | |
| 0.5< | 0.094 | 0.72 | 43 ± 9 | 52 ± 9 | |
| 1< | 0.07 | 0.17 | - | - | |
| 2< | 0.054 | 0.18 | - | - | |
| 5< | 0.0004 | 0.01 | - | - | |
| (c) Cloth mask (urethane) | Total | 0.44 | 1.93 | 51 ± 9 | 80 ± 6 |
| 0.3< | 0.29 | 1.19 | 50 ± 9 | 80 ± 7 | |
| 0.5< | 0.03 | 0.21 | 40 ± 10 | 67 ± 7 | |
| 1< | 0.051 | 0.15 | - | - | |
| 2< | 0.037 | 0.097 | - | - | |
| 5< | 0.002 | 0.005 | - | - | |
| (d) Neck guard | Total | 1.19 | 1.34 | 65 ± 9 | 76 ± 8 |
| 0.3< | 0.99 | 0.65 | 67 ± 9 | 67 ± 9 | |
| 0.5< | 0.14 | 0.12 | 55 ± 9 | 60 ± 9 | |
| 1< | 0.067 | 0.11 | - | - | |
| 2< | 0.043 | 0.1 | - | - | |
| 5< | 0.004 | 0.009 | - | - | |
| (e) Mouth guard | Total | 0.39 | 1.24 | 50 ± 10 | 60 ± 10 |
| 0.3< | 0.28 | 0.38 | 40 ± 10 | 50 ± 10 | |
| 0.5< | 0.054 | 0.15 | 50 ± 10 | 50 ± 10 | |
| 1< | 0.036 | 0.11 | - | - | |
| 2< | 0.034 | 0.09 | - | - | |
| 5< | 0.003 | 0.008 | - | - | |
| (f) Face shield | Total | 0.63 | 0.54 | 50 ± 10 | 50 ± 10 |
| 0.3< | 0.23 | 0.18 | 42 ± 9 | 41 ± 9 | |
| 0.5< | 0.056 | 0.12 | 40 ± 10 | 50 ± 9 | |
| 1< | 0.074 | 0.15 | - | - | |
| 2< | 0.07 | 0.12 | - | - | |
| 5< | 0.003 | 0.005 | - | - | |
| (g) Disposable type DS2 | Total | 0.027 | 0.32 | 11 ± 5 | 30 ± 10 |
| 0.3< | 0.031 | 0.18 | 15 ± 6 | 17 ± 7 | |
| 0.5< | 0.012 | 0.037 | 15 ± 6 | 20 ± 9 | |
| 1< | 0.016 | 0.066 | - | - | |
| 2< | 0.022 | 0.1 | - | - | |
| 5< | 0.002 | 0.004 | - | - | |
| (h) Disposable type (with exhaust valve) DS2-EV | Total | 0.057 | 0.19 | 19 ± 7 | 30 ± 10 |
| 0.3< | 0.031 | 0.062 | 19 ± 7 | 30 ± 10 | |
| 0.5< | 0.015 | 0.033 | 17 ± 5 | 9 ± 4 | |
| 1< | 0.022 | 0.14 | - | - | |
| 2< | 0.016 | 0.14 | - | - | |
| 5< | 0.002 | 0.008 | - | - | |
| (i) Replaceable type RS2 | Total | 0.04 | 0.35 | 13 ± 5 | 20 ± 10 |
| 0.3< | 0.014 | 0.15 | 16 ± 8 | 19 ± 8 | |
| 0.5< | 0.019 | 0.15 | 12 ± 5 | 23 ± 9 | |
| 1< | 0.041 | 0.22 | - | - | |
| 2< | 0.05 | 0.19 | - | - | |
| 5< | 0.002 | 0.008 | - | - | |
CI: confidence interval.
As mentioned previously, since the droplets generated from human vocalization are unstable and the amounts and distributions have poor uniformity, an accurate comparison cannot be unconditionally performed. When the values are converted to particle penetration by Equation (3), the results are in good agreement with the simulation results7). While the face shield and mouth guard are fitted with protective plastic sheets directly in front of the mouth, the diffusion range of the scattered droplets is wide due to the large release space. We cannot rule out an underestimation of the penetration, as our instruments may have failed to completely capture the widely diffused particles.
The non-woven surgical masks and respirators were highly effective in preventing the scattering of particles. Our findings suggested, however, that particles may have escaped preferentially from pathways, such as the gaps that formed. In addition, the collection performance of a filter was usually higher for larger particles, and large particles were thought to be collected by inertia even when leaks were observed. Further, the atmospheric concentration of particles of the size produced by vocalization was relatively high. Considering the large influence of the contaminating particles, the leaked exhaled air may have entrained the surrounding air, and the atmospheric aerosol within the entrained air may have been counted as droplets. We should therefore note that the true particle leakage rate of 1 μm< is quite small, as the denominator is small and the penetration may be overestimated.
The splash-prevention effects of the thick but coarse cloth mask and the neck guard composed of thin fabric were not as remarkable as that of the non-woven surgical mask, which was generally consistent with the results of previous research. Although the mouth guard and face shield had large open spaces, the plastic sheets at the fronts of these protectors blocked the direct splashing of droplets. The experimental results varied widely, however, and the splashing droplets spread in directions other than the front. The mouth guard and face shield did not robustly prevent the splashing of droplets, and they cannot be expected to be effective in preventing the spread of infectious diseases. The appropriate use of effective protectors is recommended in indoor workspaces with poor ventilation.
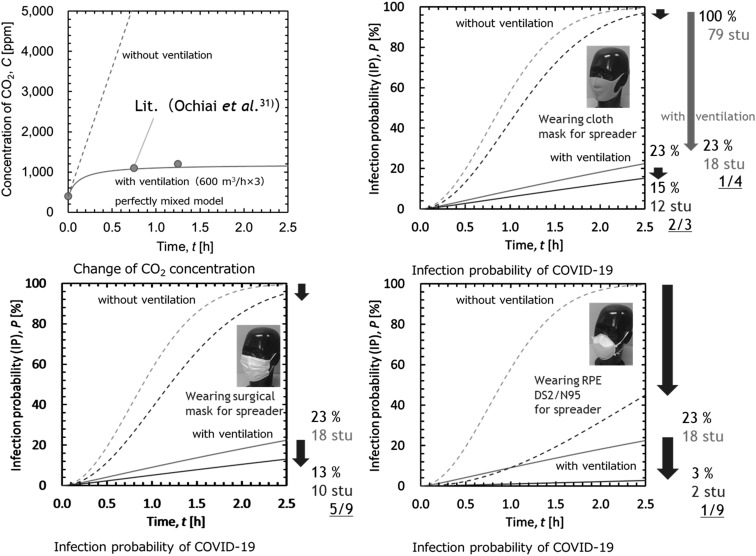
Finally, we conducted a simulation to estimate the relative effect of the protectors in reducing the infection probability by preventing the scattering of vocalization droplets in a lecture room populated by 80 students, including a spreader, based on an earlier experiment by Ochiai et al. to examine the ventilation efficiency of carbon dioxide concentration measurements31). First, we estimated the carbon dioxide concentration in the room based on the breath volume, ventilation volume, and room volume, assuming a perfect mixing model. Next, we estimated the infection probability in the room using the Rudnick & Milton model based on the Wells–Riley equation32, 33).
(4)
where, P is the infection probability (IP), f is the rebreathing ratio, q is the quanta generation rate, p is the penetration, t is time, and n is the number of persons.
One of our earlier reports described the combined use a perfect mixing model and the Rudnick & Milton model, for application to a lecture room34). The quanta generation rate was assumed to be 500, as it was proposed to be about 15–1,000 for COVID-1935,36,37). The penetration was set to 0.65 for the cloth mask, assuming a 5 to 5 flow ratio between the front and side (front:side=5:5), 0.56 for the surgical mask (front:side=1:9), and 0.12 for the DS2 RPE (front:side=9.5:0.5), based on the experimental results.
Figure 8 shows the calculated carbon dioxide concentration and infection probabilities in the simulated lecture room. The change of carbon dioxide concentration was accurately represented by the model. From the results of the change in the estimated relative infection probability, appropriate ventilation was found to be one of the most effective measures for infectious disease control. Within a ventilated environment, the wearing of a cloth mask or surgical mask by the spreader is expected to reduce the infection probability by an additional 8% (from 23% to 15%) and 10% (from 23% to 13%), respectively. The wearing of the RPE DS2/N95 respirator by the spreader is expected to reduce the infection probability by an additional 20% (from 23% to 3%).
Fig. 8.
Estimated results on the carbon dioxide concentration and infection probabilities in the simulated lecture room.
The Centers for Disease Control and Prevention (CDC) points out that it is effective to wear a cloth mask on top of a surgical mask (double masking)38). A surgical mask tied behind the ears is also fashioned with folds to reduce gaps and reduce leaks. A normal mask, however, has a sufficient effect, and the degree to which a double mask improves the infection suppression effect is unknown. Further, the doubling of disposable masks such as surgical masks, and the layering of other masks on top of N95 masks, are not recommended.
Conclusion
All of the protectors examined in our experiments to assess their droplet-prevention effects showed some effect in preventing droplets within the particle size range corresponding to aerosol, the range we measured.
The protectors that were less easy to breathe through than the surgical mask and respirators, and significantly decreased leakage from the front during vocalization with a loud voice. Leakage from the sides due to gaps or the like caused by misalignment remained distinctly possible, however, under the loud vocalization condition. We concluded that a subject wearing a respirator did not require additional droplet prevention, provided that the respirator was appropriate and was used under optimal conditions.
The cloth protectors that were relatively easy to breathe through, namely, the cloth mask and neck guard, leaked more from the front than the surgical mask and respirators, by dint of their high breathability.
The mouth guard and face shield showed the same level of penetration as the cloth mask and neck guard. The structure of these protectors, however, prevented direct splashing to the front while allowing large open spaces elsewhere. This structure permitted the particles to move with a high degree of freedom, thus allowing a free scattering of droplets in complicated patterns. Caution must therefore be taken in interpretation, as the leaked particles may be impossible to trace experimentally.
Based on our results, we would only strictly recommend the wearing of a mask indoors, or in a crowded situation where ventilation tends to be insufficient. If distance is sufficiently maintained between people, the wearing of masks outdoors does not appear to be necessary. In addition to the experimental results and simulation results of the present and previous research, the work environment and usability of the protectors should be comprehensively considered. We recommend that working persons select protectors that are optimally suited for the types of work they perform and their work space environments.
Disclosures
Approval of the research protocol: This study was approved by the Ethics Committee of the University of Occupational and Environmental Health, Japan in 2020 (Reference No. R2-028). Informed consent: Written consent was obtained from all participants. Competing interest statement: The authors have no competing interests to declare.
Funding
This work was supported by a Health and Labor Sciences Research Grant 2020 in Japan (Grant No. 20CA2043).
References
- 1.Shinohara N. (2020) Reference researches on indoor environment valuable for infection control of coronavirus. Indoor Environ 23, 99–106(in Japanese). [Google Scholar]
- 2.Johnson GR, Morawska L, Ristovski ZD, Hargreaves M, Mengersen K, Chao CYH, Wan MP, Li Y, Xie X, Katoshevski D, Corbett S. (2011) Modality of human expired aerosol size distributions. J Aerosol Sci 42, 839–51. [DOI] [PMC free article] [PubMed] [Google Scholar]
- 3.Duguid JP. (1946) The size and the duration of air-carriage of respiratory droplets and droplet-nuclei. J Hyg (Lond) 44, 471–9. [DOI] [PMC free article] [PubMed] [Google Scholar]
- 4.Loudon RG, Roberts RM. (1967) Droplet expulsion from the respiratory tract. Am Rev Respir Dis 95, 435–42. [DOI] [PubMed] [Google Scholar]
- 5.Chao CYH, Wan MP, Morawska L, Johnson GR, Ristovski ZD, Hargreaves M, Mengersen K, Corbett S, Li Y, Xie X, Katoshevski D. (2009) Characterization of expiration air jets and droplet size distributions immediately at the mouth opening. J Aerosol Sci 40, 122–33. [DOI] [PMC free article] [PubMed] [Google Scholar]
- 6.Chen SC, Chio CP, Jou LJ, Liao CM. (2009) Viral kinetics and exhaled droplet size affect indoor transmission dynamics of influenza infection. Indoor Air 19, 401–13. [DOI] [PubMed] [Google Scholar]
- 7.Tsubokura M. Prediction of virus droplet infection in indoor environment and countermeasures. https://www.r-ccs.riken.jp/fugaku/history/corona/projects/tsubokura/ (in Japanese). Accessed January 6, 2023.
- 8.Dbouk T, Drikakis D. (2020) On respiratory droplets and face masks. Phys Fluids 32, 063303. [DOI] [PMC free article] [PubMed] [Google Scholar]
- 9.Fischer EP, Fischer MC, Grass D, Henrion I, Warren WS, Westman E. (2020) Low-cost measurement of face mask efficacy for filtering expelled droplets during speech. Sci Adv 6, eabd3083–1–5. [DOI] [PMC free article] [PubMed] [Google Scholar]
- 10.Rodriguez-Palacios A, Cominelli F, Basson AR, Pizarro TT, Ilic S. (2020) Textile masks and surface covers—a spray simulation method and a “universal droplet reduction model” against respiratory pandemics. Front Med (Lausanne) 7, 260. [DOI] [PMC free article] [PubMed] [Google Scholar]
- 11.Asadi S, Cappa CD, Barreda S, Wexler AS, Bouvier NM, Ristenpart WD. (2020) Efficacy of masks and face coverings in controlling outward aerosol particle emission from expiratory activities. Sci Rep 10, 15665. [DOI] [PMC free article] [PubMed] [Google Scholar]
- 12.Li Y, Wong T, Chung J, Guo YP, Hu JY, Guan YT, Yao L, Song QW, Newton E. (2006) In vivo protective performance of N95 respirator and surgical facemask. Am J Ind Med 49, 1056–65. [DOI] [PubMed] [Google Scholar]
- 13.Rengasamy S, Eimer B, Shaffer RE. (2010) Simple respiratory protection—evaluation of the filtration performance of cloth masks and common fabric materials against 20–1000 nm size particles. Ann Occup Hyg 54, 789–98. [DOI] [PMC free article] [PubMed] [Google Scholar]
- 14.Noti JD, Lindsley WG, Blachere FM, Cao G, Kashon ML, Thewlis RE, McMillen CM, King WP, Szalajda JV, Beezhold DH. (2012) Detection of infectious influenza virus in cough aerosols generated in a simulated patient examination room. Clin Infect Dis 54, 1569–77. [DOI] [PMC free article] [PubMed] [Google Scholar]
- 15.Milton DK, Fabian MP, Cowling BJ, Grantham ML, McDevitt JJ. (2013) Influenza virus aerosols in human exhaled breath: particle size, culturability, and effect of surgical masks. PLoS Pathog 9, e1003205. [DOI] [PMC free article] [PubMed] [Google Scholar]
- 16.Lindsley WG, Noti JD, Blachere FM, Szalajda JV, Beezhold DH. (2014) Efficacy of face shields against cough aerosol droplets from a cough simulator. J Occup Environ Hyg 11, 509–18. [DOI] [PMC free article] [PubMed] [Google Scholar]
- 17.Davies A, Thompson KA, Giri K, Kafatos G, Walker J, Bennett A. (2013) Testing the efficacy of homemade masks: would they protect in an influenza pandemic? Disaster Med Public Health Prep 7, 413–8. [DOI] [PMC free article] [PubMed] [Google Scholar]
- 18.Bałazy A, Toivola M, Adhikari A, Sivasubramani SK, Reponen T, Grinshpun SA. (2006) Do N95 respirators provide 95% protection level against airborne viruses, and how adequate are surgical masks? Am J Infect Control 34, 51–7. [DOI] [PubMed] [Google Scholar]
- 19.Aydin O, Emon B, Cheng S, Hong L, Chamorro LP, Saif MTA. (2020) Performance of fabrics for home-made masks against the spread of COVID-19 through droplets: a quantitative mechanistic study. Extreme Mech Lett 40, 100924. [DOI] [PMC free article] [PubMed] [Google Scholar]
- 20.Xiao LI, Sakagami H, Miwa N. (2020) A new method for testing filtration efficiency of mask materials under sneeze-like pressure. In Vivo 34Suppl, 1637–44. [DOI] [PMC free article] [PubMed] [Google Scholar]
- 21.Verma S, Dhanak M, Frankenfield J. (2020) Visualizing the effectiveness of face masks in obstructing respiratory jets. Phys Fluids 32, 061708. [DOI] [PMC free article] [PubMed] [Google Scholar]
- 22.Leung NHL, Chu DKW, Shiu EYC, Chan KH, McDevitt JJ, Hau BJP, Yen HL, Li Y, Ip DKM, Peiris JSM, Seto WH, Leung GM, Milton DK, Cowling BJ. (2020) Respiratory virus shedding in exhaled breath and efficacy of face masks. Nat Med 26, 676–80. [DOI] [PMC free article] [PubMed] [Google Scholar]
- 23.Ho KF, Lin LY, Weng SP, Chuang KJ. (2020) Medical mask versus cotton mask for preventing respiratory droplet transmission in micro environments. Sci Total Environ 735, 139510. [DOI] [PMC free article] [PubMed] [Google Scholar]
- 24.Konda A, Prakash A, Moss GA, Schmoldt M, Grant GD, Guha S. (2020) Aerosol filtration efficiency of common fabrics used in respiratory cloth masks. ACS Nano 14, 6339–47. [DOI] [PubMed] [Google Scholar]
- 25.Ueki H, Furusawa Y, Iwatsuki-Horimoto K, Imai M, Kabata H, Nishimura H, Kawaoka Y. (2020) Effectiveness of face masks in preventing airborne transmission of SARS-CoV-2. MSphere 5, e00637–20. [DOI] [PMC free article] [PubMed] [Google Scholar]
- 26.Kähler CJ, Hain R. (2020) Fundamental protective mechanisms of face masks against droplet infections. J Aerosol Sci 148, 105617. [DOI] [PMC free article] [PubMed] [Google Scholar]
- 27.Cowling BJ, Zhou Y, Ip DKM, Leung GM, Aiello AE. (2010) Face masks to prevent transmission of influenza virus: a systematic review. Epidemiol Infect 138, 449–56. [DOI] [PubMed] [Google Scholar]
- 28.Long Y, Hu T, Liu L, Chen R, Guo Q, Yang L, Cheng Y, Huang J, Du L. (2020) Effectiveness of N95 respirators versus surgical masks against influenza: a systematic review and meta-analysis. J Evid Based Med 13, 93–101. [DOI] [PMC free article] [PubMed] [Google Scholar]
- 29.Tcharkhtchi A, Abbasnezhad N, Zarbini Seydani M, Zirak N, Farzaneh S, Shirinbayan M. (2020) An overview of filtration efficiency through the masks: mechanisms of the aerosols penetration. Bioact Mater 6, 106–22. [DOI] [PMC free article] [PubMed] [Google Scholar]
- 30.Locke L, Dada O, Shedd JS. (2021) Aerosol transmission of infectious disease and the efficacy of personal protective equipment (PPE): a systematic review. J Occup Environ Med 63, e783–91. [DOI] [PMC free article] [PubMed] [Google Scholar]
- 31.Ochiai N, Yamashita K, Sakamoto I, Hamamura M, Fukuzawa Y, Hashimoto Y, Matsuoka A, Onda H. (2010) Indoor carbon dioxide of Shimane university lecture room and control of air quality. Bull Univ Shimane Jr Coll Izumo Campus 4, 39–45(in Japanese). [Google Scholar]
- 32.Riley EC, Murphy G, Riley RL. (1978) Airborne spread of measles in a suburban elementary school. Am J Epidemiol 107, 421–32. [DOI] [PubMed] [Google Scholar]
- 33.Rudnick SN, Milton DK. (2003) Risk of indoor airborne infection transmission estimated from carbon dioxide concentration. Indoor Air 13, 237–45. [DOI] [PubMed] [Google Scholar]
- 34.Higashi H. (2020) Professional view: indoor environment and infection risk. Health Dev 25, 7–12(in Japanese). [Google Scholar]
- 35.Dai H, Zhao B. (2020) Association of the infection probability of COVID-19 with ventilation rates in confined spaces. Build Simul 13, 1321–7. [DOI] [PMC free article] [PubMed] [Google Scholar]
- 36.Miller SL, Nazaroff WW, Jimenez JL, Boerstra A, Buonanno G, Dancer SJ, Kurnitski J, Marr LC, Morawska L, Noakes C. (2021) Transmission of SARS-CoV-2 by inhalation of respiratory aerosol in the Skagit Valley Chorale superspreading event. Indoor Air 31, 314–23. [DOI] [PMC free article] [PubMed] [Google Scholar]
- 37.Buonanno G, Stabile L, Morawska L. (2020) Estimation of airborne viral emission: quanta emission rate of SARS-CoV-2 for infection risk assessment. Environ Int 141, 105794. [DOI] [PMC free article] [PubMed] [Google Scholar]
- 38.Brooks JT, Beezhold DH, Noti JD, Coyle JP, Derk RC, Blachere FM, Lindsley WG. (2021) Maximizing fit for cloth and medical procedure masks to improve performance and reduce SARS-CoV-2 transmission and exposure, 2021. MMWR Morb Mortal Wkly Rep 70, 254–7. [DOI] [PMC free article] [PubMed] [Google Scholar]


