

Abstract
Background:
Pronounced asymmetric changes in ocular globe size during eye development have been observed in a number of species ranging from humans to lizards. In contrast, largely symmetric changes in globe size have been described for other species like rodents. We propose that asymmetric changes in the three-dimensional structure of the developing eye correlate with the types of retinal remodeling needed to produce areas of high photoreceptor density. To test this idea, we systematically examined three-dimensional aspects of globe size as a function of eye development in the bifoveated brown anole, Anolis sagrei.
Results:
During embryonic development, the anole eye undergoes dynamic changes in ocular shape. Initially spherical, the eye elongates in the presumptive foveal regions of the retina and then proceeds through a period of retraction that returns the eye to its spherical shape. During this period of retraction, pit formation and photoreceptor cell packing are observed. We found a similar pattern of elongation and retraction associated with the single fovea of the veiled chameleon, Chamaeleo calyptratus.
Conclusions:
These results, together with those reported for other foveated species, support the idea that areas of high photoreceptor packing occur in regions where the ocular globe asymmetrically elongates and retracts during development.
Keywords: anole, chameleon, development, eye, fovea, lizard, myopia, ocular morphogenesis
1 |. INTRODUCTION
Decades of experimental work have revealed a great deal about the developmental mechanisms that govern the patterning, differentiation, and growth of the vertebrate eye. Much of this understanding has come from functional studies in mouse, rat, chicken, Xenopus, zebrafish, and medaka.1,2 Additional insights have come through genetic studies of human syndromes that feature eye defects.3 Consequently, we know a great deal about the genes and signaling pathways that regulate development of the core structures common to all vertebrate eyes, including the cornea, lens and retina.4–7 Missing from our current understanding of vertebrate eye development, however, is detailed knowledge about the developmental pathways that regulate the formation of specialized structures that are only present in the eyes of certain vertebrate species. These structures include the conus papillaris, areas or streaks, and foveae. Studies of eye formation in diverse vertebrate groups are needed to determine how these specialized structures form and to achieve a more complete understanding of vertebrate eye development and evolution. Notably, modern investigations of eye development have almost completely excluded reptiles, a tremendously successful amniote group represented by over 10 000 extant species.8
Although eye development in reptiles remains poorly studied, other aspects of reptilian biology have been actively explored. For instance, Anolis, a lizard genus with approximately 400 recognized species, has served as an important model system for studies of evolution, ecology, physiology, behavior, and neuroendocrinology for many years.9 More recently, Anolis has also emerged as a system to investigate reptile development and the mechanisms that contribute to morphological evolution.10–16 The brown anole lizard, Anolis sagrei, is particularly wellsuited for developmental studies due its small size, ease of husbandry, continuous egg production, high fertility, and low cost. In addition, ex ovo culture systems and geneediting have been established for this species, which presents the opportunity for pharmacological and genetic manipulation of Anolis embryos during development.12,17,18 Of interest for studies of eye development, Anolis lizards possess specialized structures that include a bifoveated retina and a highly vascularized conus papillaris.19–23
The fovea is a pit-like structure found in a region of the retina that contributes to an animal’s high acuity vison.23–25 Anolis lizards possess a large fovea in the central retina as well as a second smaller fovea in the temporal retina.19–23 This group of lizards is thought to depend on their high visual acuity to communicate with each other using complex patterns of head-bobbing and dewlap signaling as well as their ability to hunt and capture prey.19,26 The central fovea is thought to be important for capturing monocular visual information, and the temporal fovea is thought handle binocular input.26
Here we describe morphological and histological aspects of eye development in A. sagrei. We pay particular attention to alterations in ocular globe shape, which is an interesting, but poorly understood, aspect of eye development. Although typically only studied postnatally in the context of myopia in humans,27–29 changes in ocular shape during embryonic development have been observed in a number of foveated species, including humans,30–36 and non-human primates,32,37 as well as geckos,38,39 suggesting the presence of a conserved morphogenetic mechanism. The bifoveated brown anole is a good model system in which to study the mechanisms underlying fovea development in a vertebrate eye. In this study, we provide the first systematic three-dimensional assessment of the dynamic changes in ocular shape with an emphasis on ocular elongation and retraction and its association with fovea formation.
2 |. RESULTS
2.1 |. Anatomy of the adult anole eye
Laterally positioned in the skull, the adult eye externally is oblate spheroid in shape with a prominent convex cornea slightly biased toward the nasal region (Figure 1A,B). Peripheral to the cornea is the sclera sulcus, whose curvature is supported by 14 sclera ossicles (Figure 1B,C). The sclera ossicles are uniformly oriented in a patterned ring except for a slight extension in the temporal region of the eye (Figure 1C). The anole’s radial pupil is positioned centrally, fashioned by a heavily pigmented iris with an array of iridophores and melanophores that extend into the circumferential sclera sulcus (Figure 1B,C). The iris is asymmetric with dorsal and ventral notches defining the boundary between the larger temporal and smaller nasal region (Figure 1C, arrowheads). Dorsally, a protruding blood vessel is present that extends from the optic nerve, wraps around the region of the center fovea (a small bulge in the medial region), and dissipates toward the dorsal nasal area of the eye (Figure 1B, narrow arrowheads). The optic nerve (not shown) exits the eye ventrally and temporally ~10 ± 3° from the central fovea or ~ 25 ± 5° from the optical axis, which is the central or mid-point of the eye.
FIGURE 1.
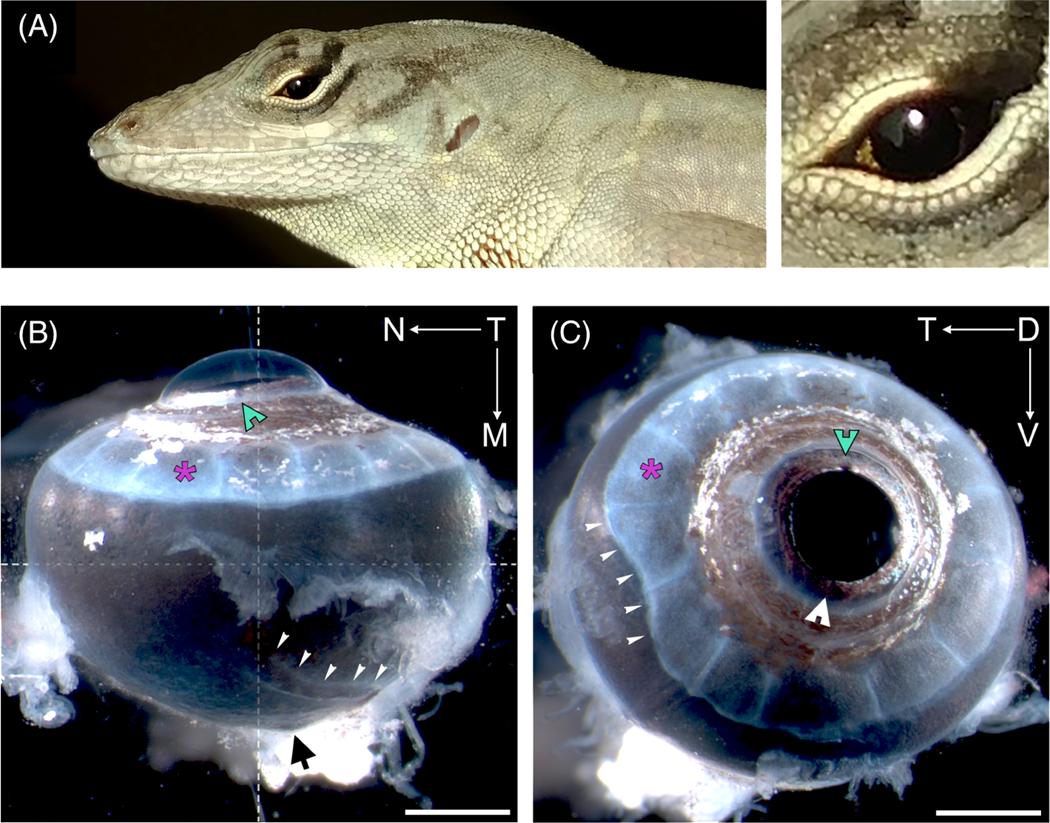
Adult anole eye. Top panel A shows adult male lizard with an enlarged view of its left eye. Bottom panels show a lateral view, B, and dorsal view, C, of a right eye. Directionality is designated by arrows and the letters T—temporal, N—nasal, D—dorsal, and V—ventral. Markers indicate: white arrow heads with notches—dorsal (green) and ventral (white) iris notches; asterisks (magenta)—individual sclera ossicle sheets; narrow white arrow heads, B—dorsal blood vessel, C, temporal sclera ossicle deformation; black arrow—optic nerve; crosshair—dorsal optical axis; and scale bars—1 mm
Internally, the adult anole eye is very similar to other vertebrates, possessing a cornea, iris, ciliary body, lens, retina, retinal pigmented epithelium, and choroidal and sclera layers (Figure 2A). Details about the anterior eye are presented elsewhere.40 The neural retina is avascular and composed of a ganglion cell layer (GCL), inner and outer plexiform layers (IPL and OPL), inner and outer nuclear layers (INL and ONL) (Figure 2B,C).
FIGURE 2.

Anole eye organization and retinal architecture at the horizontal meridian. Hematoxylin-and eosin (H&E)-stained paraffin-embedded sections cut horizontally through an adult eye. Left panel A shows the relationships of the anterior and posterior structures in a horizontal section of the adult eye. Right panels show magnified views of temporal, B, and center, C, foveae. Temporal fovea shown in panel B is 150 μm deep to the plane of section in panel A. Markers indicate GCL—ganglion cell layer; INL—inner nuclear layer; ONL—outer nuclear layer; RPE—retina pigmented epithelium; Ch—choroid; Scl—sclera; and scale bars—1 mm, A, and 50 μm, B and C
Each eye has two foveae with one in the central retina and a second in the temporal retina (Figure 2), as has been previously described for other anoles.19–22 The central fovea is evident as a deep convexiclivate structure located slightly temporal (4–5°) to the optical axis (Figure 2A). The retina at the fovea center is characterized by a higher density of photoreceptors than the peripheral retina and lack of the ganglion, inner and outer cell layers (Figure 2A,C). The retina at the center of the pit has a mean thickness of 55 μm (SD = 5.9, N = 4 adult males) as measured in histological sections. No corrections were made to account for the shrinkage that occurred during the embedding process. The region of retina that circumscribes the foveal pit—the parafoveal region—is thicker than that of the peripheral retina (Figure 2A). At its thickest, the parafoveal retina in adult males (N = 4) has a mean thickness of 338 μm (SD = 16.6) compared to a mean thickness of 193 μm (SD = 9.3) for the peripheral nasal retina. This increase in thickness is associated with increased numbers of cells in the outer, inner and ganglion cell layers (Figure 2A,C). With respect to the outer nuclear layer, the mean maximum density of photoreceptor cells in the parafoveal retina was 3.3 times greater than in the peripheral retina (N = 4 adult males, 1 eye each). The numbers of cells that make up the GCL, INL, and ONL steadily decrease as a function of distance from rim of the pit until they reach the numbers characteristic of the peripheral retina (Figure 2A). For quantitative purposes, we defined the outer limit of the parafoveal region as the location, measured from the center of the pit, at which the density of photoreceptor cell bodies in the ONL equaled that of the peripheral retina. In adult male lizards (N = 4 animals, 1 eye each), the parafoveal region of the central fovea encompassed a circular patch of retina with a mean diameter of 1565.5 μm (SD = 60.2), which corresponds to a width of ~22 visual degrees.
A second, shallower fovea is located in the temporal retina roughly 45° from the optical axis or 40° from the center of the central fovea (Figure 2). In the eyes of the same adult male lizards used above, the temporal fovea encompassed a circular area with a mean diameter of 886.3 μm (SD = 291.4), which corresponds to a width of ~10 visual degrees. At its center, all the retinal cell layers are retained, but layers are thinner than the surrounding peripheral retina (Figure 2B). The mean thickness of the temporal fovea at its center is 143 μm (SD = 14.3) compared to a mean thickness of 218 μm (SD = 3.5) for the surrounding peripheral retina. The mean maximum density of photoreceptor cells in the temporal fovea was 1.7 times greater than in the peripheral retina. Thus, the temporal fovea is approximately one-third the area of the central fovea (6.2 × 105 μm3 and 19.3 × 105 μm3, respectively) and has about half the maximum density of photoreceptor cells of the central fovea.
2.2 |. Eye formation
In anoles, fertilization takes place internally and embryonic development occurs over a 30–33 day period.41 As a consequence, the earliest stages of eye development take place while the eggs are in the oviduct. Embryonic stages pre-egg lay are denoted with the prefix “PL.” Stages postegg lay use the Sanger staging series41 and are denoted using the prefix “St.” Stages PL 3–5 correspond to Sanger stages St 1–3.41 For these earliest timepoints we use the PL nomenclature to help distinguish pre-lay stages (PL 1–5) from post-lay stages (Sanger St 4–19).
The initial stages of eye development occur between PL 1 and PL 5. Optic vesicle formation is evident in embryos at PL 1 (Figure 3A), which is about 1 day after fertilization and 3 days before egg lay. The lens placode is visible at PL 2 (see Eye Development Poster in Supporting Information). By PL 3, the optic cup and lens pit are present (Figure 3B). Rapidly following this period, the cornea separates (PL 5) from the newly minted lens vesicle (PL 4) and the optic fissure begins to close (PL 5) (Supporting Information, Eye Development Poster). At the time of egg lay (~St 4), the anole eye is spherical, trace amounts of pigmentation are evident in the temporal region of the eye (Figure 3C) and present nasally by St 5 (Figure 3D). At this time (St 5), the prospective central and temporal foveal regions are evident as thickenings in the retina, also defined as retinal mounding (Figure 3G). St 5 also marks the first appearance of the sclera sulcus, evidenced by a slight depression in the temporal area, which extends to the nasal side by St 6 (Figure 3D). Eventually, the sclera sulcus forms a complete ring encircling the cornea (Supporting Information, Eye Development Poster, whole eye stages 6–8). Shortly following this period, pigment begins to increase—initially in the iris between St 6–10 and then throughout the rest of the eye. In the iris, pigment is deposited first as a narrow band along the horizontal axis (St 6–7) before radiating outward throughout the dorsal and ventral regions (St 8–9) (Supporting Information, Eye Development Poster, Whole eye). By St 10, pigment in the iris is black and evenly distributed. Granules are also just becoming obvious throughout the whole eye, but more so in the temporal region. At St 13, retinal mounding is no longer present in the central and reduced in the temporal foveal regions (Figure 3H). The eye is a light brown color which darkens between St 15–17 and is completely black by the time of hatching (Figure 4B; Supporting Information, Eye Development Poster). During this period the sclera ossicles that shape the sulcus and provide support to the underlying ocular structures, are starting to form. The sclera anlagen first manifests as a ring of pale conjunctiva papillae around the cornea between St 11–12. By St 13, scleral sheets are present although they are small and by St 15–16 these expand, radiating outward and eventually overlapping (St 17) with the neighboring plates (Supporting Information, Eye Development Poster). Iridophores (reflective pigments) scattered throughout the iris and sclera sulcus region, are also apparent during this time.
FIGURE 3.

Developmental series of early, mid, and late embryonic stages of eye morphogenesis. Top panel shows an array of early-stage embryos (PL1, PL3, and St 4) during optic vesicle, A, len’s pit, B, and lens separation, C. Panels D to I show representative later stages (St 5, 13, and Hch) along with along with corresponding hematoxylin-and eosin-stained paraffin-embedded histological sections cut through the eye’s center horizontal plane. D and G, Stage 5 embryo. E and H, Stage 13 embryo. F and I, Hatchling. Black arrow—temporal eye region; open arrows—center and closed arrows—temporal retinal and fovea regions; and scale bars are 250 μm, A to C, G to I, and 1 mm, D to F
FIGURE 4.

Anole eyes undergo asymmetrical ocular elongation followed by retraction during embryonic development. A, Diagram illustrating orientation of - (green), - (blue), and -axis (magenta) ocular measurements. Color key in panel A is the same for panels C and D. B, Lateral (top) and dorsal (bottom) views of whole right eyes from early (St 5), mid (St 13), and late (Hch) stages. Ocular elongation and retraction phases are evident in the stage 13 embryo and hatchling, respectively. All eyes are to scale with one another; scale bar is 1 mm. C, Graph displaying trends in ocular morphogenesis throughout development (St 4-Hch) and adulthood (Adt F—adult female; Adt M—adult male). This graph was generated by taking each lizard’s ocular dimensions (y-axis and normalized - and ) and dividing it by the mean (μ) hatchling ocular dimensions (-, -, and -axis) to calculate a ratio. D, Direct comparison of ocular length along different axes reveals the degree of ocular elongation (St 13–14) and subsequent retraction (St 18-Hch) in the anole eye
2.3 |. Eye morphogenesis
The anole eye exhibits conspicuous asymmetric changes in morphology during development (Figure 4). To assess potentially complex changes in the three-dimensional shape of the globe, measurements were made along the three anatomical axes of the eye at different stages of development. For this study, the dorsoventral axis was defined as the -axis, the nasotemporal axis was defined as the -axis, and the lateromedial axis was defined as the -axis (Figure 4A). The lateromedial () axis is also the optical axis and passes through anterior (iris and lens) and posterior (retina) structures of the eye.
At St 5, the ocular globe is mostly spherical in shape (Figure 4B), with similar lengths along the three anatomical axes. At late mid-gestation (St 13–14), the ocular globe has acquired a complex shape, more conical in appearance than spherical, with increased lengths along the nasotemporal () and lateromedial () axes compared to the length of the dorsoventral axis (Figure 3E,H; Figure 4B). Interestingly, whereas the nasal surface of the globe has a rounded appearance, both the temporal and medial surfaces have angular shapes. These differences in surface geometry suggest that elongation in the nasotemporal and lateromedial planes occurred largely by changes in the temporal and medial regions of the globe, respectively. The medial region of the globe corresponds to the area of the retina that gives rise to the central fovea, and the temporal region corresponds to that of the temporal fovea (Figure 3G–I). The exterior surface of the bulbus oculi at this stage also exhibits considerably less pigmentation in the apex of the conically shaped region of the globe (denoted with an asterisk in Figure 4B) compared to the more spherically shaped lateral surface of the globe (region near the cornea in Figure 4B). At hatching, the ocular globe has a spherical shape with uniform pigmentation (Figure 3I; Figure 4B). Remarkably, the globe at this stage has a smaller surface area than that of mid-gestational embryos (Figure 4B). The change in morphology and size of the globe in a hatchling compared to that of a mid-gestational embryo suggests that the eye undergoes asymmetric retraction in the areas encompassing the developing central and temporal foveae during the period between mid-gestation and hatching.
To better understand the dynamics of globe morphogenesis in the brown anole, axial measurements along the three anatomical planes were made of eyes at embryonic stages St 4–18, hatchlings (Hch), and adults (Adt) (Figure S1 and Table S1). To facilitate a quantitative comparison of changes in the three-dimensional shape of the eye, the three measurements of each eye were converted to a standardized metric (see Whole Eye Measurements in Methods). Briefly, in this metric the axial length of the -axis, which did not exhibit appreciable elongation and retraction during development, was used as a normalization factor for measurements along the - and -axes. Variance due to differences in embryo body and eye size within an individual’s stage group was handled by multiplying the normalized measurements for each individual by the group mean value () for the -axis (Figure S1 and Table S1). This operation resulted in an overall reduction in variance seen at each stage in both - and datasets, which suggests that the degree to which an eye elongates and retracts is proportional to the embryo’s eye size (Figure S2).
Using the hatchling eye as a reference, regional differences in globe morphogenesis as a function of developmental stage were assessed by taking the raw -axis dataset and the normalized datasets (- and ) from every lizard and dividing these values with the corresponding mean of the raw -, -, and -axial lengths of the hatchling (see Whole Eye Measurements in Methods). This analysis revealed four distinct phases in ocular morphogenesis (Figure 4C).
Phase 1, which occurs between embryonic St 4–8, is characterized by rapid growth of the eye. In embryos at St 4–5, the globe appears to expand uniformly along all three axes, which suggests that ocular growth during this period is equally distributed across the eye. Although the St 5 eye is 50% smaller than the hatchling eye, the eye at these two stages is quite similar in overall shape (Figure 4B,C; Table S1). At St 6, the globe begins to exhibit asymmetric expansion, with more growth along the nasotemporal and lateromedial axes compared the dorsoventral axis. By St 7, expansion along the lateromedial axis is greater than along the nasotemporal axis.
The start of phase 2 is defined as the developmental timepoint when morphological asymmetry of the globe is clearly visible. This condition is met at St 8. It is also at this point that the overall globe size is similar to that of the hatchling. Between St 8 and the close of the second phase at St 14, the globe continues to expand asymmetrically along the nasotemporal and lateromedial axes, with the more pronounced expansion along the lateromedial axis (Figure 4C,D). The globe reaches maximum lengths along the nasotemporal and lateromedial axes by St 14. At this stage the length of the lateromedial axis is 1.4x that of the hatchling, and the length of the nasotemporal axis is 1.2x that of the hatchling (Figure 4B,C).
Phase 3 is the epoch during which the globe begins to shorten in length along the nasotemporal and lateromedial axes to regain a spherical shape. This phase encompasses St 15–18 (Figure 4C,D), and corresponds to the time during which the foveae acquire their distinctive morphological characteristics (Figure 3H,I). Upon completion of retraction, the eyes are slightly smaller than those of hatchlings (St 17–18; Figure 4C,D). The fourth, and final, phase is characterized by a uniform expansion of the globe, which begins at the close of St 18 and continues into adulthood (Figure 4C). From hatching, the eye doubles in size by the time the lizard reaches adulthood (Figure 4C).
To determine the magnitude of the asymmetric shape changes during ocular morphogenesis, measurements capturing the maximum extent of elongation (St 13–14, Figure 4C) were compared to those capturing the maximum extent of retraction (St 18-Hch, Figure 4C). Axial measurements of globes from lizards at St 13, 14 and 18, and hatching were compared using a Kruskal-Wallis H test; normalized values were used for the nasotemporal and lateromedial axes (for mean and SD, see Table S1). Although measurements along the dorsoventral axis were not statistically different across these four developmental time periods (-value .1585; alpha = 0.05), significant differences were observed for measurements along both the nasotemporal and lateromedial axes (-value <.0001 for both; alpha = 0.05).
Differences between the groups were compared using the Mann-Whitney test (Figure 4D). Among the normalized nasotemporal () datasets, St 13 and 14 measurements were significantly different from the St 18 and the hatchling (-value <.0001 for both; alpha = 0.05) but not between St 13 and 14 (-value .1244). Similar results were observed among the normalized lateromedial () measurements. For St 18 compared to hatchling, and lengths were significantly different (-value <.0001, and -value of .0017, respectively). This suggests that by St 18 ocular retraction is finished and the expansion phase is already well underway by the time of hatching. The large difference in mean - and lengths between St 14 and 18 ( 2647 to 1807 μm; , 2663 to 2151 μm) equated to a 32% and 19% reduction in the central and temporal regions, respectively (Figure 4D).
Changes in intraocular pressure (IOP) can be one mechanism that drives globe expansion and retraction. Unfortunately, devices that are commonly used to measure intraocular pressure in mammals and birds do not work to measure IOP in the developing anole due to small size of its cornea (data not shown); therefore, a qualitative assessment of IOP was made. Using an inflated ball as a model, morphological indicators of a pressurized globe could include a taut ocular surface that resists deformation. Conversely, using an under-inflated ball as a model, a previously-pressurized globe that has lost pressure might exhibit wrinkles or folds of the surface and be more flaccid. The surfaces of globes prior to St 16 were smooth and taut to the touch. In contrast, starting at St 17, the exterior ocular surface was easily depressed with a pair of dull forceps and wrinkles could be clearly seen in about half of the eyes examined (7/13 St 17 lizards) (Figure 5). At St 18, wrinkling could still be detected (8/19 lizards), although it was not as pronounced. By hatching, the majority of globes (9/10 lizards) were completely smooth and once again the ocular surface was taut (Figure 5A). For developmental stages between St 14 and hatching, wrinkled eyes tended to have reduced normalized measurements along the lateromedial () compared to smooth eyes (Figure 5C).
FIGURE 5.

The formation of surface wrinkles coincides with ocular retraction. A, Dorsal views of whole right eyes from stages 16—Hatchling showing the progressive steps of ocular retraction; scale bar—1 mm. B, An enlarged view of the St 17 eye from panel A; arrow heads mark folds/wrinkles present along the outer ocular surface. C, ocular dimensions along the -axes relative to the hatchling eye; eyes where folds/wrinkles were observed are indicated in magenta
2.4 |. Ocular elongation & retraction in other foveated lizards
To test if ocular elongation and retraction occurs in other foveated lizards, ocular morphogenesis was examined in the veiled chameleon lizard, Chamaeleo calyptratus. This species was chosen because it possesses a single, deep convexiclivate central fovea that at its center is completely devoid of cell bodies.42 Chameleon embryos were collected at several time points throughout development. To facilitate comparison with anoles, chameleon embryos were staged following criteria described by Diaz et al43 and Diaz et al44 and then matched to the anole using Sanger’s morphological criteria.41,43,44 Only embryonic stages were used for this study; chameleon embryos collected just prior to the expected hatching date are denoted as pre-hatch “pHch” (Table S2).
As observed for A. sagrei, ocular globe morphogenesis in C. calyptratus includes pronounced asymmetric elongation along the lateromedial axis (Figure 6). In contrast with A. sagrei, C. calyptratus embryos exhibit comparable expansion along both the dorsoventral and nasotemporal axes (Figure 6). As with the anole, ocular elongation is followed by a period of retraction that ends when the globe regains a spherical shape. Compared with the anole, the elongated region in chameleon is less acute and occurs over a broader area; in the anole, the elongated medial face appears more acute and funnel-like (Compare St 13 chameleon in Figure 6B to St 13 anole in Figure 4B). Despite this difference in morphology, the onset of ocular elongation and retraction timing is nearly identical to anoles. For instance, ocular elongation begins around stage 6 and peaks by stage 14. This is followed by ocular retraction, which starts at stage 15 and plateaus just before hatching (Figure 6C). The chameleon fovea also develops during the period of retraction (between stages 16–18) (Figure 6C), and its progression also matches that of the anole (data not shown).
FIGURE 6.

Chameleon eyes also undergo asymmetrical ocular elongation followed by retraction during embryonic development. Diagram A demonstrates how - (green), - (blue), and -axis (magenta) ocular measurements were made. Image B shows lateral (top) and dorsal (bottom) views of whole fixed right eyes from early (St 6), mid (St 13), and late (St 18) embryonic development. Like the anole, ocular elongation (St 13) and retraction (St 18) phases are evident. All eyes are to scale; scale bar is 1 mm. Graph C summarizes trends in chameleon ocular morphogenesis throughout stages 4-pHch (pHch—just prior to hatching). This graph was generated by taking each lizard’s ocular dimensions (-axis and normalized - and ) and dividing it by the mean () pHch ocular dimensions (-, -, and -axis) to calculate a ratio. Graph D compares the degree of ocular elongation (St 14) and subsequent retraction (Hch and pHch) between anoles (grey circles) and chameleons (color triangles: -axis—green, —blue, and —magenta). Calculations were made following same formula outlined above in graph C for each respective species. Graph E indicates the relative percentage of retraction occurring in chameleons between stage 14 and pHch. C and D color schemes are the same as panel A
3 |. DISCUSSION
The work we present here is a first step in establishing the brown anole as a new model organism for fovea developmental studies. A primary motivation for choosing this lizard is that the anole eye contains two foveae that together represent the extremes of foveal morphology: a central fovea with a pit devoid of all retina cell layers and a temporal fovea with a shallow pit that retains the retinal layers. Most vertebrate species do not have fovea, but in those that do, the fovea can differ greatly in pit shape, depth, and diameter.19,24,45,46 In humans, for example, the fovea is characterized by lateral displacement of the ganglion and inner nuclear retinal layers, but not the outer nuclear layer, resulting in a broad and relatively shallow foveal pit with a high density of photoreceptor cells at its center.36,47–51 This foveal architecture is also found in most foveated non-human primates; however, in some species, the GCL and/or INL are also retained in the fovea, resulting in an only just visible pit.46,52–55 At the more dramatic end of the morphological spectrum are the fovea of birds. Many bird species possess a distinctive convexiclivate fovea in the central retina.45,56–58 The pit of the central fovea is usually deep compared to that of the haplorrhine primates, but among bird species, pit depth can be shallow, medium or deep.23,24 In several bird species with a deep fovea, the fovea center is devoid of cell bodies.23,45,59–63 Some birds, like the anole, are bifoveated, with a second, shallower fovea in the temporal retina.45,56,58
Anoles are the only squamate genus known to have a bifoveated retina. Among the anole species studied, all have a prominent central fovea devoid of cell layers and a shallower temporal fovea that retains these layers.19,20,64 Slight variations in pit depth have been observed across anoles and correlate with prey size.19 For instance, anole species that routinely eat smaller prey have considerably deeper temporal foveae. As in birds, the location of the fovea in different squamate reptiles varies. In diurnal geckos only a temporal fovea is present.22,65–68 Although all layers are generally present in these lizards, the degree of lateral displacement ranges from partial to full layer retention. In Lygodactylus, which is a gekkonid, and Gonatodes, which is a sphaerodacylid, the GCL is nearly absent, while the INL is only thinned and ONL packing is present at the foveal pit center.66 In contrast, Phelsuma geckos have only the shallowest of depressions absent of any pronounced displacement of GCL and INL, resulting in a pit similar to the temporal fovea of anoles.66,67 In other lizards, including chameleons, the opposite is generally true, with most having a large prominent central fovea in which the center is devoid of cell bodies.42,69
We observed four distinct phases of ocular morphogenesis in anoles and chameleons. The first was a period of symmetrical growth that occurred during the first week of embryonic development post-fertilization. At the end of this period, the retina was thicker and exhibited a mounded appearance in the prospective foveal regions (Figure 3G). This was followed by a second period, defined by asymmetrical growth, where the regions that eventually gave rise to the fovea became strikingly elongated. Coincidingly, this period also marks the gradually disappearance of retinal mounding within the foveal regions (compare Figure 3G with 3 hours; Supporting Information, Eye Development Poster). By late development, when the foveae take on their characteristic morphology, these regions appear to undergo retraction coincident with retinal remodeling, that is, pit formation and photoreceptor cell packing. The fourth phase was characterized by a uniform expansion of the globe. In both brown anoles and veiled chameleons the regions that undergo asymmetric elongation and retraction are localized to areas of the retina where the foveae develop. Additionally, these foveal regions, characterized by early retinal mounding, undergo retina differentiation and lamination prior to the rest of the retina (Supporting Information, Eye Development Poster). These observations suggest a relationship between changes in retinal differentiation, ocular shape, and foveal development.
We propose that asymmetric ocular elongation followed by retraction are necessary steps in the retinal remodeling needed to generate a fovea in vertebrates. Consistent with this idea, evidence of asymmetrical globe development can be seen in the eyes of diurnal, but not nocturnal, gecko species. Examples of this phenomenon can be seen in Figures 2 and 3 of the publication by Guerra-Fuentes and colleagues addressing the embryology of the retinal pigmented epithelium in five species of sphaerodactyls,38 and in Figures 3 and 4 of the publication by Griffing, Gamble and Bauer addressing pigment development in nocturnal gekkonids (Gekko kuhli, Lepidodactylus lugubris) and diurnal gekkonids (Phelsuma laticauda, Sphaerodactylus macrolepis).39 Among mammals, asymmetric globe development has been observed only for foveated haplorrhine primates but not for non-foveated primates or other mammalian species.30–37 Together, these observations suggest that fovea morphogenesis is similar among foveated vertebrates. It will be interesting to learn if the eyes of foveated birds and fish undergo similar morphogenetic changes during development.
In the brown anole, we noted that the magnitude of asymmetric ocular shape changes during development appeared proportional to the extent of retinal remodeling associated with formation of the morphologically dramatic central fovea compared to the less distinct temporal fovea. We speculate that the process of elongation and retraction required for fovea formation, and that the relative extent to which an eye elongates and retracts during fovea-genesis is directly proportional to the amount of retinal remodeling required to make that particular fovea. If true, this may explain the variability of fovea morphology present within each foveated species.
Several different mechanisms could mediate changes in the size and shape of the ocular globe during development. We hypothesize that changes in intraocular pressure (IOP) contribute to ocular morphogenesis in the lizard. This idea arises from our observations that the embryonic anole eye appears to be pressurized during the period when the globe was increasing in size and deflated during the period when it was contracting to the size at hatching.
The globes of both lizards at mid-development are larger than at hatching (Figures 4B and 6B). In C. calyptratus, expansion and contraction of the globe during embryonic development occur more or less symmetrically along the nasotemporal () and dorsoventral () axes and asymmetrically along the lateromedial axis (). In A. sagrei, expansion and contraction during embryonic development occur asymmetrically along the nasotemporal and lateromedial axis, and appears to occur symmetrically along the dorsoventral axis. Although not as obvious or pronounced as the chameleon, in the anole the length of the globe along the dorsoventral axis at mid-development is longer than at the time of hatching (see Figure S1A). Changes in globe size along this axis are symmetric as indexed to globe center. The more pronounced change along the dorsoventral axis in C. calyptratus relative to A. sagrei likely reflects differences between these two species in their relative eye sizes. The eyes of C. calyptratus are larger than those of A. sagrei (compare Figure 6B with Figure 4B, the scale bar is 1 mm in both panels). Although the globes of both lizard species at mid-development are larger than at hatching (Figures 6B and 4B), the difference between the size of the globe at mid-development relative to the size at hatching is greater for the chameleon than for the anole. For both lizards, these observations suggest that regions of the globe associated with a fovea expand and contract to a greater degree than non-foveated regions.
The idea that IOP can drive ocular growth is not a new one. Previous studies have shown that IOP plays a pivotal role in regulating normal ocular growth in chick70 and increases in IOP can lead to induced myopia (generalized axial elongation of the globe) in this animal.71,72 In foveated primates, Hendrickson and Springer proposed a model where high IOP induces pit formation due to inherent increased elasticity present at the foveal avascular zone, while “retinal stretching” induced by ocular growth, facilitates the centripetal movement of photoreceptor cells toward the foveal center.73–75 Although, it is possible that lack of blood vessels would predispose this region of the primate retina to be more susceptible to IOP and, therefore, form a pit, this cannot explain pit formation in the lizard. Anoles have a retina that is entirely avascular.64 This suggests that if regional differences in retinal elasticity are present in the anole, they are unlikely to be caused by avascular zones. Another challenge with this model, as applied to anoles, is that it requires IOP to be high for pit formation to occur. In the brown anole, pit formation occurs during the period that the eye is soft, indicating that IOP is low.
We propose, for anoles and chameleons at least, that high IOP is involved in facilitating expansion of the globe overall and asymmetric elongation of prospective foveal regions during embryonic development, and that a reduction in IOP allows for contraction of the globe and foveal pit formation. Once a device that can accurately measure IOP in the anole eye becomes available, we will be able to directly test this hypothesis. As with Hendrickson and Springer’s model, there must be additional mechanisms that mediate regional differences in the elasticity of the foveal anlagen compared to other regions of the ocular globe. We think it likely that regional and dynamic changes in the elasticity of the tissues associated with the outer surface of the globe are required for normal eye development in foveated lizards, and may be true for primates as well.
The reduction in pigment observed in the asymmetrically elongating regions of the globes of both A. sagrei and C. calyptratus midway through development suggests that the RPE cells in these regions are altered relative to the RPE cells in more darkly pigmented regions of the globe. A simple explanation for the reduction in pigment is that the RPE cells in the hypopigmented regions are being stretched, resulting in pigment granules becoming more dispersed within the cell and giving these elongated regions the appearance of less pigmentation. These regions would become darker during ocular retraction as the cells returned to a more compact shape. Consistent with this idea, RPE cells in birds, rodents and primates are known to change in size to accommodate ocular growth that occurs after proliferation of the RPE cells has largely ceased.76–80 A more interesting idea is that the RPE cells associated with the foveal regions are different than those associated with the peripheral retina. Consistent with this idea, the RPE in humans differs in its spatial organization between the macular and peripheral regions.78,81 Interestingly, these regional differences become apparent during the period of eye developing during which the fovea is forming.34,78,79
The most interesting idea is that the RPE is an active participant in fovea formation. There is growing evidence that the RPE plays an active role in folding the optic vesicle into an optic cup.82,83 Most dramatically, optic cup morphogenesis occurs in organoid cultures, indicating that the forces needed to fold the neural retina are generated by the cells in the retinal organoids themselves.83–85 Current evidence suggests that at the time of optic cup formation the RPE is stiffer than the neural retina and that this differential tension may be important for neural retina invagination.83 While speculative, the possibility that the RPE, rather than being a passive bystander in eye development, plays an active role in ocular morphogenesis provides some interesting avenues of research for which the lizard is well suited as a new vertebrate eye model in which to study fovea development.
4 |. EXPERIMENTAL PROCEDURES
4.1 |. Animals
All experimental procedures were conducted in accordance with the National Institutes of Health Guide for the Care and Use of Laboratory Animals under protocols approved and overseen by the University of Georgia (anoles) and Stowers Institute for Medical Research (chameleons #2020–115) Institutional Animal Care and Use Committees. Anolis sagrei lizards were maintained in a breeding colony at the University of Georgia following guidelines described by Sanger et al.86 Eggs were collected weekly from natural matings and placed in 100 × 15 mm lidded petri dishes containing moist vermiculite and incubated at 27 to 28°C and 70% humidity. Adults and hatchlings were euthanized using methods consistent with the American Veterinary Medical Association (AVMA) Guidelines for the Euthanasia of Animals.87,88 Chamaeleo calyptratus were maintained in a breeding colony at the Stowers Institute for Medical Research (Kansas City, Missouri) following guidelines described by Diaz et al89 and Diaz et al.44 Eggs were collected at the time of oviposition and incubated at 26°C to 28°C and 50% humidity on damp vermiculite. Male and female embryos of both species were used for these studies.
4.2 |. Staging
Embryonic development of Anolis lizards typically takes place over a 30 to 33 day period, starting with fertilization, which takes place internally.41 Early embryogenesis proceeds within the oviduct. A. sagrei embryos obtained from eggs that were collected after egg-laying were staged as described by Sanger et al.41 Embryos younger than those captured by the Sanger staging series were denoted with the prefix “PL” for pre-laying followed by a number. We describe here 5 PL timepoints, which includes the first few embryos of the Sanger staging series (Sanger St 1–3 correspond to PL 3–5). PL stage embryos were collected from gravid adult females following euthanasia. C. calyptratus embryos were staged following criteria described by Diaz et al43 and Diaz et al44 and stage matched to the anole using Sanger’s morphological criteria.41,43,44
4.3 |. Dissection
Lizard embryos were removed from their shells using a blunt pair of forceps and iris scissors in 1× phosphate-buffered saline (PBS; 137 mM NaCl, 2.7 mM KCl, 10 mM Na2HPO4, 1.8 mM KH2PO4, pH 7.4). Upon removal of yolk and amniotic sac with fine forceps, embryos were placed into 60 mL of fresh 1× PBS solution with 1 mL of 0.4% pharmaceutical grade, neutrally buffered tricaine (TRICAINE-S; Western Chemical Inc) to anesthetize for imaging. Eyes were enucleated from embryo stages >4 with fine forceps and placed in Bouin’s fixative at 4°C overnight on a rocker. Following fixation, eyes were washed five times at 15 minutes per wash in 1× PBS. Specimens were stored in 70% ethanol solution (EtOH) at 4°C until processed for histology. Whole chameleon embryos were dissected from eggs in a similar manner, fixed in Bouin’s at 4°C overnight, washed in 1× PBS, and stored in 70% EtOH prior to shipment from the Stowers Institute for Medical Research. Upon arrival at the University of Georgia, embryos were slowly rehydrated in a series of graded EtOH/PBS solutions. Once fully rehydrated, eyes were carefully removed from embryos.
4.4 |. Whole eye measurements
Prior to fixing, anole eyes were positioned in both a lateral and dorsal orientation and imaged with a ZEISS Discovery V12 SteREO microscope and AxioCam while in 1× PBS solution. AxioVision 4 software (Carl Zeiss MicroImaging) was used to take axial measurements along the dorsoventral (), nasotemporal (), and lateromedial () aspects of imaged eyes from embryos at Sanger stages 4–18, the hatchling (Hch), and the adult (Adt). The lateral view, which encompassed the whole cornea, was used to measure the - and -axes, whereas the dorsal view was imaged to obtain - and -axes. Because -axial measurements can be acquired from both views, we included only the dorsal -axial value in our dataset and used the other value as a control for proper orientation. Measurements from eyes that were not correctly positioned were excluded from the dataset. We normalized the - and -axial measurements from each lizard to that same individual’s -axis and then multiplied this number to the mean () of that individual’s stage group -axis (), . To identify trends in ocular growth, a ratio was then calculated for each axis by taking the raw -axis dataset and the normalized datasets (- and ) from every lizard and dividing these values with the corresponding of the raw , , and -axial lengths of the hatchling, . Chameleon eyes were processed as reported above except imaging was performed post-fixation and rehydration. Prism 7 (GraphPad Software) and JMP V14.1 (JMP SAS) were used for graph generation and data analyses. As a few of the sample groups did not have a normal distribution, we opted to use a nonparametric Kruskal-Wallis and Mann-Whitney for our statistical analyses.
4.5 |. Paraffin sectioning
Eyes were dehydrated in a series of graded ethanol solutions 70%, 80%, 90%, 96%, and 100% (twice) for a minimum of 15 minutes each and then soaked in xylene for a total of 30 minutes for all embryonic stages. Tissue specimens were incubated in a series of 3 paraffin wax jars for 30 minutes at 65°C, embedded in paraffin, and serially sectioned horizontally at 10 μm. In adult specimens, the dorsal aspect of the eye was punctured with a 0.15 mm minutien pin prior to processing in xylenes and paraffin waxes to facilitate wax entry. Processing time in xylene in the adult was extended up to a total of 2 hours. Eyes were serial sectioned on a horizontal plane. Sections were stained with hematoxylin & eosin (H&E) following standard protocols and mounted in Cytoseal (Thermo Scientific Richard-Allan Scientific).
4.6 |. Image capture and quantitative assessments of the retina
Photomosaic images were generated using a 40× objective on a KEYENCE BZ-700 microscope with Keyence image stitching software. Adobe Photoshop CC (2017.01 release) was used to digitally enhance contrast and adjust white balance of images.
Retinal thickness and photoreceptor cell densities for the adult eye were assessed from high-resolution photomosaic images of H&E-stained paraffin-embedded sections cut horizontally through the eyes of four adult male lizards. Visual angle was determined using ray-tracing methods.45 Retinal thickness was measured from the retinovitreal border to the border between the retinal pigmented epithelium and sclera. The outer edge of the parafoveal regions of the central and temporal foveae were defined as the locations, spatially indexed to the foveal pits, where photoreceptor cell density dropped to match that of the peripheral retina. Macular diameter (fovea + parafovea) was obtained by measuring the distance between the outer edges of the parafoveal region at the widest point. Photoreceptor cells within the central and temporal macular areas were counted and compared to that of the surrounding peripheral retina. Only clearly defined cell bodies were counted. Mean and SD was recorded for both macular measurements and ONL cell counts. The specific counting intervals for determining cellular densities within the macula were determined empirically so as to capture the greatest change in cell densities which occurred symmetrically around the foveal pit. Cell density was calculated by dividing the total number of photoreceptor cell bodies by area counted for each eye. No corrections were applied for the slight shrinkage that occurred during the embedding process nor were any corrections applied to account for the problems associated with estimating cell density from histological sections.90–92 Therefore, while the numbers captured in our data are reproducible between animals, they are likely low relative to the actual photoreceptor cell densities found in the different regions of the retina in the live animal. Because all data was collected in the same way, the relative relationships in maximum cell density between central and temporal foveal regions compared to the peripheral retina are likely to accurately reflect the regional differences found in the retinae of live lizards.
Supplementary Material
ACKNOWLEDGMENTS
The authors thank Aaron Alcala, Sergio Minchey, Sukhada Samudra, Christina Sabin, and Rebecca Ball of the Menke and Lauderdale research groups at the University of Georgia, and Diana Baumann, Richard Kupronis, David Jewell, Alex Muensch and Nikki Inlow of the Reptile and Aquatic Facility at the Stowers Institute for Medical Research, for their help with animal husbandry, maintenance and care of the anolis and chameleon colonies, respectively. The authors thank Drs. Jonathan Eggenschwiler, Heike Kroeger and Robert Hufnagel, and Christina Sabin, Sukhada Samudra, and Rida Osman for helpful discussions about this project and comments on the manuscript. The UGA Honors Program and the Center for Undergraduate Research Opportunities provided Ms. Katie Irwin, Ms. Sherry Luo, Ms. Hannah Kim and Ms. M. Austin Wahle with funding support in the form of CURO Research Assistantships and CURO Summer Fellowships. This work was funded by National Science Foundation awards 1149453 to D.B.M. and 1827647 to D.B.M. and J.D.L. and a Society for Developmental Biology Emerging Models grant to A.M.R. A.M.R. was supported by NIH training grant T32GM007103 and by an ARCS Foundation Scholarship. P.A.T. is supported by the Stowers Institute for Medical Research.
Funding information
Achievement Rewards for College, Scientists Foundation; Directorate for, Biological Sciences, Grant/Award, Numbers: 1149453, 1827647; National, Institute of General Medical Sciences, Grant/Award Number: T32GM007103; Stowers Institute for Medical Research
CONFLICT OF INTEREST
The authors declare no potential conflict of interest. The funders of this research had no role in study design, data collection and analysis, decision to publish, or preparation of the manuscript.
Footnotes
SUPPORTING INFORMATION
Additional supporting information may be found online in the Supporting Information section at the end of this article.
REFERENCES
- 1.Tsonis PA. Animal Models in Eye Research. San Diego, CA: Elsevier/Academic Press; 2008. [Google Scholar]
- 2.Wittbrodt J, Shima A, Schartl M. Medaka—a model organism from the far east. Nat Rev Genet. 2002;3(1):53–64. 10.1038/nrg704. [DOI] [PubMed] [Google Scholar]
- 3.McKusick VA. Mendelian inheritance in man and its online version, OMIM. Am J Hum Genet. 2007;80(4):588–604. 10.1086/514346. [DOI] [PMC free article] [PubMed] [Google Scholar]
- 4.Miesfeld JB, Brown NL. Eye organogenesis: a hierarchical view of ocular development. Curr Top Dev Biol. 2019;132:351–393. 10.1016/bs.ctdb.2018.12.008. [DOI] [PubMed] [Google Scholar]
- 5.Chow RL, Lang RA. Early eye development in vertebrates. Annu Rev Cell Dev Biol. 2001;17:255–296. [DOI] [PubMed] [Google Scholar]
- 6.Fuhrmann S. Eye morphogenesis and patterning of the optic vesicle. Curr Top Dev Biol. 2010;93:61–84. 10.1016/b978-0-12-385044-7.00003-5. [DOI] [PMC free article] [PubMed] [Google Scholar]
- 7.Saha MS, Servetnick M, Grainger RM. Vertebrate eye development. Curr Opin Genet Dev. 1992;2(4):582–588. [DOI] [PubMed] [Google Scholar]
- 8.Uetz P, Stylianou A. The original descriptions of reptiles and their subspecies. Zootaxa. 2018;4375(2):257–264. 10.11646/zootaxa.4375.2.5. [DOI] [PubMed] [Google Scholar]
- 9.Losos JB, Schneider CJ. Anolis lizards. Curr Biol. 2009;19(8): R316–R318. 10.1016/j.cub.2009.02.017. [DOI] [PubMed] [Google Scholar]
- 10.Eckalbar WL, Lasku E, Infante CR, et al. Somitogenesis in the anole lizard and alligator reveals evolutionary convergence and divergence in the amniote segmentation clock. Dev Biol. 2012; 363(1):308–319. 10.1016/j.ydbio.2011.11.021. [DOI] [PubMed] [Google Scholar]
- 11.Park S, Infante CR, Rivera-Davila LC, Menke DB. Conserved regulation of hoxc11 by pitx1 in Anolis lizards. J Exp Zool B Mol Dev Evol. 2014;322(3):156–165. 10.1002/jez.b.22554. [DOI] [PubMed] [Google Scholar]
- 12.Sanger TJ, Kircher BK. Model clades versus model species: Anolis lizards as an integrative model of anatomical evolution. Methods Mol Biol. 2017;1650:285–297. 10.1007/978-1-4939-7216-6_19. [DOI] [PubMed] [Google Scholar]
- 13.Sanger TJ, Revell LJ, Gibson-Brown JJ, Losos JB. Repeated modification of early limb morphogenesis programmes underlies the convergence of relative limb length in Anolis lizards. Proc Biol Sci. 2012;279(1729):739–748. 10.1098/rspb.2011.0840. [DOI] [PMC free article] [PubMed] [Google Scholar]
- 14.Sanger TJ, Seav SM, Tokita M, et al. The oestrogen pathway underlies the evolution of exaggerated male cranial shapes in Anolis lizards. Proc Biol Sci. 2014;281(1784):20140329. 10.1098/rspb.2014.0329. [DOI] [PMC free article] [PubMed] [Google Scholar]
- 15.Tollis M, Hutchins ED, Stapley J, et al. Comparative genomics reveals accelerated evolution in conserved pathways during the diversification of anole lizards. Genome Biol Evol. 2018;10(2): 489–506. 10.1093/gbe/evy013. [DOI] [PMC free article] [PubMed] [Google Scholar]
- 16.Infante CR, Mihala AG, Park S, et al. Shared enhancer activity in the limbs and phallus and functional divergence of a limbgenital cis-regulatory element in snakes. Dev Cell. 2015;35(1): 107–119. 10.1016/j.devcel.2015.09.003. [DOI] [PMC free article] [PubMed] [Google Scholar]
- 17.Infante CR, Rasys AM, Menke DB. Appendages and gene regulatory networks: lessons from the limbless. Genesis. 2018;56(1): 1–8. 10.1002/dvg.23078. [DOI] [PMC free article] [PubMed] [Google Scholar]
- 18.Rasys AM, Park S, Ball RE, Alcala AJ, Lauderdale JD, Menke DB. CRISPR-Cas9 gene editing in lizards through microinjection of unfertilized oocytes. Cell Rep. 2019;28(9): 2288. 10.1016/j.celrep.2019.07.089. [DOI] [PMC free article] [PubMed] [Google Scholar]
- 19.Fite KV, Lister BC. Bifoveal vision in anolis lizards. Brain Behav Evol. 1981;19(3–4):144–154. 10.1159/000121639. [DOI] [PubMed] [Google Scholar]
- 20.Sannan NS, Shan X, Gregory-Evans K, Kusumi K, Gregory-Evans CY. Anolis carolinensis as a model to understand the molecular and cellular basis of foveal development. Exp Eye Res. 2018;173:138–147. 10.1016/j.exer.2018.05.012. [DOI] [PubMed] [Google Scholar]
- 21.Makaretz M, Levine RL. A light microscopic study of the bifoveate retina in the lizard Anolis carolinensis: general observations and convergence ratios. Vision Res. 1980;20(8):679–686. [DOI] [PubMed] [Google Scholar]
- 22.Underwood G. Reptilian retinas. Nature. 1951;167(4240):183–185. [DOI] [PubMed] [Google Scholar]
- 23.Walls GL. The Vertebrate Eye and its Adaptive Radiation. Bloomfield Hills, Michigan: The Cranbrook Institute of Science; 1942:1–785. [Google Scholar]
- 24.Slonaker JR. A Comparative Study of the Area of Acute Vision in Vertebrates. Vol 1. Boston: Ginn & company; 1897:445–502. [Google Scholar]
- 25.Underwood G. The eye. In: Gans C, Parsons TS, eds. Biology of the Reptilia, Volume 2. Morphology B. Vol 2. London and New York: Academic Press; 1970:1–93. [Google Scholar]
- 26.Fleishman LJ. The influence of the sensory system and the environment on motion patterns in the visual displays of anoline lizards and other vertebrates. Am Nat. 1992;139: S36–S61. [Google Scholar]
- 27.Chakraborty R, Read SA, Vincent SJ. Understanding myopia: pathogenesis and mechanisms. Updates on Myopia. Singapore: Springer; 2020:65–94. [Google Scholar]
- 28.Harper AR, Summers JA. The dynamic sclera: extracellular matrix remodeling in normal ocular growth and myopia development. Exp Eye Res. 2015;133:100–111. 10.1016/j.exer.2014.07.015. [DOI] [PMC free article] [PubMed] [Google Scholar]
- 29.Young TL. Molecular genetics of human myopia: an update. Optom Vis Sci. 2009;86(1):E8–E22. 10.1097/OPX.0b013e3181940655. [DOI] [PMC free article] [PubMed] [Google Scholar]
- 30.Badtke G. Entwicklungsmechanische Faktoren bei der Formgebung des embryonalen Augapfels. Albrecht von Graefes Archiv für Ophthalmologie. 1952;152(6):671–688. 10.1007/BF00685239. [DOI] [PubMed] [Google Scholar]
- 31.Ehlers N, Matthiessen ME, Andersen H. The prenatal growth of the human eye. Acta Ophthalmol. 1968;46(3):329–349. [DOI] [PubMed] [Google Scholar]
- 32.Pilleri G. Comparative anatomical examination of the “protuberantia scleralis” of the eye. Acta Anat (Basel). 1960;41: 131–137. [PubMed] [Google Scholar]
- 33.van Pilleri GL. Morphological research on the “scleral protuberance”. Albrecht Von Graefes Arch Ophthalmol. 1961;163:1–9. 10.1007/bf00684908. [DOI] [PubMed] [Google Scholar]
- 34.Streeten BW. Development of the human retinal pigment epithelium and the posterior segment. Arch Ophthalmol. 1969;81 (3):383–394. [DOI] [PubMed] [Google Scholar]
- 35.Sondermann R. Die Bedeutung der Vererbung für die Entwicklung der Myopie. Albrecht Von Graefes Arch Klin Exp Ophthalmol. 1950;151(1):200–208. [PubMed] [Google Scholar]
- 36.Hendrickson A. Development of retinal layers in prenatal human retina. Am J Ophthalmol. 2015;166:29–35. [DOI] [PMC free article] [PubMed] [Google Scholar]
- 37.Springer AD, Hendrickson aE. Development of the primate area of high acuity, 3: temporal relationships between pit formation, retinal elongation and cone packing. Vis Neurosci. 2005;22(2):171–185. 10.1017/S095252380522206X. [DOI] [PubMed] [Google Scholar]
- 38.Guerra-Fuentes RA, Bauer AM, Daza JD. The embryology of the retinal pigmented epithelium in dwarf geckos (Gekkota: Sphaerodactylinae): a unique developmental pattern. BMC Dev Biol. 2014;14(1):29. 10.1186/1471-213X-14-29. [DOI] [PMC free article] [PubMed] [Google Scholar]
- 39.Griffing AH, Gamble T, Bauer AM. Distinct patterns of pigment development underlie convergent hyperpigmentation between nocturnal and diurnal geckos (Squamata: Gekkota). BMC Evol Biol. 2020;20(1):40. 10.1186/s12862-020-01604-9. [DOI] [PMC free article] [PubMed] [Google Scholar]
- 40.Rasys AM, Pau SH, Irwin KE, Luo S, Menke DB, Lauderdale JD. Anterior eye development in the brown anole, Anolis sagrei. Bio-Rxiv. 2021;1–21. 10.1101/2021.02.15.429783. [DOI] [Google Scholar]
- 41.Sanger TJ, Losos JB, Gibson-Brown JJ. A developmental staging series for the lizard genus Anolis: a new system for the integration of evolution, development, and ecology. J Morphol. 2008;269(2):129–137. 10.1002/jmor.10563. [DOI] [PubMed] [Google Scholar]
- 42.Hulke JW. On the chameleon’s retina; a further contribution to the minute anatomy of the retina of reptiles. Philos Trans R Soc Lond. 1866;156:223–229. [Google Scholar]
- 43.Diaz RE Jr, Bertocchini F, Trainor PA. Lifting the veil on reptile embryology: the veiled chameleon (Chamaeleo calyptratus) as a model system to study reptilian development. Methods Mol Biol. 2017;1650:269–284. 10.1007/978-1-49397216-6_18. [DOI] [PubMed] [Google Scholar]
- 44.Diaz RE Jr, Shylo NA, Roellig D, Bronner M, Trainor PA. Filling in the phylogenetic gaps: induction, migration, and differentiation of neural crest cells in a squamate reptile, the veiled chameleon (Chamaeleo calyptratus). Dev Dyn. 2019;248(8):709–727. 10.1002/dvdy.38. [DOI] [PubMed] [Google Scholar]
- 45.Fite KV, Rosenfield-Wessels S. A comparative study of deep avian foveas. Brain Behav Evol. 1975;12:97–115. [DOI] [PubMed] [Google Scholar]
- 46.Ross CF. The tarsier fovea: functionless vestige or nocturnal adaptation? In: Ross CF, Kay RF, eds. Anthropoid Origins: New Visions. Boston, MA: Springer US; 2004:477–537. [Google Scholar]
- 47.Hendrickson A. A morphological comparison of foveal development in man and monkey. Eye (Lond). 1992;6(Pt 2):136–144. 10.1038/eye.1992.29. [DOI] [PubMed] [Google Scholar]
- 48.Hendrickson a, Drucker D. The development of parafoveal and mid-peripheral human retina. Behav Brain Res. 1992;49(1):21–31. 10.1016/S0166-4328(05)80191-3. [DOI] [PubMed] [Google Scholar]
- 49.Hendrickson A, Possin D, Vajzovic L, Toth CA. Histologic development of the human fovea from midgestation to maturity. Am J Ophthalmol. 2012;154(5):767–778e2. 10.1016/j.ajo.2012.05.007. [DOI] [PMC free article] [PubMed] [Google Scholar]
- 50.Hendrickson AE, Yuodelis C. The morphological development of the human fovea. Ophthalmology. 1984;91(6):603–612. [DOI] [PubMed] [Google Scholar]
- 51.Yuodelis C, Hendrickson A. A qualitative and quantitative analysis of the human fovea during development. Vision Res. 1986;26(6):847–855. [DOI] [PubMed] [Google Scholar]
- 52.Webb SV, Kaas JH. The sizes and distribution of ganglion cells in the retina of the owl monkey, aotus trivirgatus. Vision Res. 1976;16(11):1247–1254. 10.1016/0042-6989(76)90049-3. [DOI] [PubMed] [Google Scholar]
- 53.Stone J, Stone J, Johnston E, Johnston E. The topography of primate retina: a study of the human, bushbaby, and new- and old-world monkeys. [Case Report]. J Comp Neurol. 1981;196(2): 205–223. 10.1002/cne.901960204. [DOI] [PubMed] [Google Scholar]
- 54.DeBruyn EJ, Wise VL, Casagrande VA. The size and topographic arrangement of retinal ganglion cells in the galago. Vision Res. 1980;20(4):315–327. 10.1016/0042-6989(80)90018-8. [DOI] [PubMed] [Google Scholar]
- 55.Collins CE, Hendrickson A, Kaas JH. Overview of the visual system of tarsius. Anat Rec A Discov Mol Cell Evol Biol. 2005; 287A(1):1013–1025. 10.1002/ar.a.20263. [DOI] [PubMed] [Google Scholar]
- 56.Bringmann A. Structure and function of the bird fovea. Anat Histol Embryol. 2019;48(3):177–200. 10.1111/ahe.12432. [DOI] [PubMed] [Google Scholar]
- 57.Müller H. Über das ausgedehnte Vorkommen einer dem gelben Fleck der Retina entsprechenden Stelle bei Thieren. Naturwiss Z. 1861;2:139–140. [Google Scholar]
- 58.Müller H. Ueber das Vorhandensein zweier Foveae in der Netzhaut vieler Vogelaugen. Zehender’s Klinisches Monatsblatt. 1863;1863:438–440. [Google Scholar]
- 59.Kolmer W. Über das Auge des Eisvogels (Alcedo attis attis). Pflugers Arch Gesamte Physiol Menschen Tiere. 1924;204(1): 266–274. [Google Scholar]
- 60.Polyak S. Klüver H. The Vertebrate Visual System: Its origin, structure, and function and its manifestations in disease with an analysis of its role in the life of animals and in the origin of man. Chicago: Univ. of Chicago Press; 1957. [Google Scholar]
- 61.Oehme H. Das Auge von Mauersegler, Star und Amsel. J Ornithol. 1962;103(2–3):187–212. [Google Scholar]
- 62.Oehme H. Vergleichende untersuchungen an greifvogelaugen. Zeitschrift für Morphologie und Ökologie der Tiere. 1964;53(6): 618–635. [Google Scholar]
- 63.O’Day K. The fundus and fovea Centralis of the albatross (Diomedea Cauta Cauta-Gould). Br J Ophthalmol. 1940;24(5): 201–207. 10.1136/bjo.24.5.201. [DOI] [PMC free article] [PubMed] [Google Scholar]
- 64.Makaretz M, Levine RL. A light microscopic study of the bifoveate retina in the lizard Anolis carolinensis general observation and convergence ratios. Vision Res. 1980;20:679–686. [DOI] [PubMed] [Google Scholar]
- 65.Underwood G. On the classification and evolution of geckos. Proc Zool Soc Lond. 1954;124(3):469–492. 10.1111/j.1469-7998.1954.tb07789.x. [DOI] [Google Scholar]
- 66.Röll B. Gecko vision—retinal organization, foveae and implications for binocular vision. Vision Res. 2001;41(16):2043–2056. 10.1016/S0042-6989(01)00093-1. [DOI] [PubMed] [Google Scholar]
- 67.Tansley K. The retina of a diurnal gecko. Pflüger’s Archiv für die gesamte Physiologie des Menschen und der Tiere. 1961;272 (3):262–269. 10.1007/BF00363014. [DOI] [PubMed] [Google Scholar]
- 68.Tansley K. The gecko retina. Vision Res. 1964;4:33–37. [DOI] [PubMed] [Google Scholar]
- 69.Detwiler SR, Laurens H. Studies on the retina the structure of the retina of PHRYNOSOMA CORNUTUM. J Comp Neurol. 1920;32(3):347–356. [Google Scholar]
- 70.Schmid KL, Hills T, Abbott M, Humphries M, Pyne K, Wildsoet CF. Relationship between intraocular pressure and eye growth in chick. Ophthalmic Physiol Opt. 2003;23(1):25–33. 10.1046/j.1475-1313.2003.00085.x. [DOI] [PubMed] [Google Scholar]
- 71.Phillips JR, McBrien NA. Pressure-induced changes in axial eye length of chick and tree shrew: significance of myofibroblasts in the sclera. Investig Opthalmol Vis Sci. 2004;45(3): 758–763. 10.1167/iovs.03-0732. [DOI] [PubMed] [Google Scholar]
- 72.Genest R, Chandrashekar N, Irving E. The effect of intraocular pressure on chick eye geometry and its application to myopia. Acta Bioeng Biomech. 2012;14(2):3–8. 10.5277/abb120201. [DOI] [PubMed] [Google Scholar]
- 73.Springer AD. New role for the primate fovea: a retinal excavation determines photoreceptor deployment and shape. 1999;16 (0):629–636. [DOI] [PubMed] [Google Scholar]
- 74.Springer AD. Hendrickson aE. Development of the primate area of high acuity. 1. Use of finite element analysis models to identify mechanical variables affecting pit formation. Vis Neurosci. 2004;21(1):53–62. 10.1017/S0952523804041057. [DOI] [PubMed] [Google Scholar]
- 75.Provis JM, Dubis AM, Maddess T, Carroll J. Adaptation of the central retina for high acuity vision: cones, the fovea and the avascular zone. Prog Retin Eye Res. 2013;35:63–81. 10.1016/j.preteyeres.2013.01.005. [DOI] [PMC free article] [PubMed] [Google Scholar]
- 76.Coulombre AJ, Steinberg SN, Coulombre JL. The role of intraocular pressure in the development of the chick eye. V pigmented epithelium. Invest Ophthalmol. 1963;2:83–89. [PubMed] [Google Scholar]
- 77.Bodenstein L, Sidman RL. Growth and development of the mouse retinal pigment epithelium. I. Cell and tissue morphometrics and topography of mitotic activity. Dev Biol. 1987;121 (1):192–204. 10.1016/0012-1606(87)90152-7. [DOI] [PubMed] [Google Scholar]
- 78.Robb RM. Regional changes in retinal pigment epithelial cell density during ocular development. Investig Ophthalmol Vis Sci. 1985;26(5):614–620. [PubMed] [Google Scholar]
- 79.Robb RM. Increase in retinal surface area during infancy and childhood. J Pediatr Ophthalmol Strabismus. 1982;19(4):16–20. [DOI] [PubMed] [Google Scholar]
- 80.Lin T, Grimes PA, Stone RA. Expansion of the retinal pigment epithelium in experimental myopia. Vision Res. 1993;33(14): 1881–1885. 10.1016/0042-6989(93)90015-o. [DOI] [PubMed] [Google Scholar]
- 81.Salzmann M, Brown EVL. The anatomy and histology of the human eyeball in the Normal state. Jama. 1912;60(4):312–313. 10.1001/jama.1913.04340040060031. [DOI] [Google Scholar]
- 82.Moreno-Marmol T, Cavodeassi F, Bovolenta P. Setting eyes on the retinal pigment epithelium. Front Cell Dev Biol. 2018;6:145. 10.3389/fcell.2018.00145. [DOI] [PMC free article] [PubMed] [Google Scholar]
- 83.Eiraku M, Adachi T, Sasai Y. Relaxation-expansion model for self-driven retinal morphogenesis: a hypothesis from the perspective of bio-systems dynamics at the multi-cellular level. Bio-essays. 2012;34(1):17–25. 10.1002/bies.201100070. [DOI] [PMC free article] [PubMed] [Google Scholar]
- 84.Eiraku M, Takata N, Ishibashi H, et al. Self-organizing opticcup morphogenesis in three-dimensional culture. Nature. 2011; 472(7341):51–56. 10.1038/nature09941. [DOI] [PubMed] [Google Scholar]
- 85.Nakano T, Ando S, Takata N, et al. Self-formation of optic cups and storable stratified neural retina from human ESCs. Cell Stem Cell. 2012;10(6):771–785. 10.1016/j.stem.2012.05.009. [DOI] [PubMed] [Google Scholar]
- 86.Sanger TJ, Hime PM, Johnson MA, Diani J, Losos JB. Laboratory protocols for husbandry and embryo collection of Anolis lizards. Herpetol Rev. 2008;39(1):58–63. [Google Scholar]
- 87.Association AVM. AVMA Guidelines for the Euthanasia of Animals: 2020 Edition. Schaumburg, IL: American Veterinary Medical Association; 2020. [Google Scholar]
- 88.Conroy CJ, Papenfuss T, Parker J, Hahn NE. Use of tricaine methanesulfonate (MS222) for euthanasia of reptiles. J Am Assoc Lab Anim Sci. 2009;48(1):28–32. [PMC free article] [PubMed] [Google Scholar]
- 89.Diaz RE Jr, Anderson CV, Baumann DP, et al. Captive care, raising, and breeding of the veiled chameleon (Chamaeleo calyptratus). Cold Spring Harb Protoc. 2015;2015(10):943–949. 10.1101/pdb.prot087718. [DOI] [PubMed] [Google Scholar]
- 90.Ebbesson SO, Tang D. A method for estimating the number of cells in histological sections. J R Microsc Soc. 1965;85(4):449–464. 10.1111/j.1365-2818.1965.tb02146.x. [DOI] [PubMed] [Google Scholar]
- 91.Clarke PG. An unbiased correction factor for cell counts in histological sections. J Neurosci Methods. 1993;49(1–2):133–140. 10.1016/0165-0270(93)90117-a. [DOI] [PubMed] [Google Scholar]
- 92.Guillery RW. On counting and counting errors. J Comp Neurol. 2002;447(1):1–7. 10.1002/cne.10221. [DOI] [PubMed] [Google Scholar]
Associated Data
This section collects any data citations, data availability statements, or supplementary materials included in this article.