

Abstract
The atomic‐resolution structural information that X‐ray crystallography can provide on the binding interface between a Fab and its cognate antigen is highly valuable for understanding the mechanism of interaction. However, many Fab:antigen complexes are recalcitrant to crystallization, making the endeavor a considerable effort with no guarantee of success. Consequently, there have been significant steps taken to increase the likelihood of Fab:antigen complex crystallization by altering the Fab framework. In this investigation, we applied the surface entropy reduction strategy coupled with phage‐display technology to identify a set of surface substitutions that improve the propensity of a human Fab framework to crystallize. In addition, we showed that combining these surface substitutions with previously reported Crystal Kappa and elbow substitutions results in an extraordinary improvement in Fab and Fab:antigen complex crystallizability, revealing a strong synergistic relationship between these sets of substitutions. Through comprehensive Fab and Fab:antigen complex crystallization screenings followed by structure determination and analysis, we defined the roles that each of these substitutions play in facilitating crystallization and how they complement each other in the process.
Keywords: antibody fragments, antibody library, crystal lattice contacts, crystallization platform, protein engineering, surface entropy reduction
1. INTRODUCTION
X‐ray crystallography is a powerful means for determining structures of proteins and protein:protein interactions at atomic detail (Shi, 2014; Smyth & Martin, 2000). This level of detail is particularly valuable for the study of antibody:antigen interactions, as it can be used to characterize binding mechanisms and identify determinants of affinity and specificity (Power & Bates, 2019; Tao et al., 2019; Wu et al., 2010). In the past few decades, antibodies have emerged as effective therapeutics, and have been designed and used to treat numerous diseases, including cancers, chronic inflammatory diseases, and infectious diseases (Carter, 2006; Chen et al., 2014; Kim & Kim, 2015). High‐resolution structural information can be used to identify key residues in the paratope and epitope (the respective interaction sites in the antibody and antigen) involved in binding, and is instrumental for guiding the decisions to mutate these residues for optimization of therapeutic antibodies (Bostrom et al., 2011; Fuh et al., 2006; Wu et al., 2010). Given the immense number of characterized natural and synthetic antibodies, improved methods for crystallization of antibody: antigen complexes could have broad impact across basic research and drug development.
Structural characterization of full‐length IgGs associated with antigen is immensely challenging due to the inherent flexibility of the IgG tertiary structure; in particular, the flexibility of the hinge regions connecting the antigen‐binding fragments (Fabs) to the crystallizable fragment (Fc). To facilitate antibody:antigen complex crystallization, IgGs are typically truncated to Fabs or even smaller single‐chain variable fragments (scFvs) that contain the entire antigen‐binding site (i.e., paratope) but are less dynamic, and thus, enable more facile crystallization and structure elucidation for characterization of the paratope: epitope interface. Fabs are well‐structured, β‐sheet‐rich, heterodimers of ideal size for crystallography that can even be used to aid the process as chaperones (Canaves et al., 2004; Koldobskaya et al., 2011; Ravindran et al., 2011; Ye et al., 2008). Nevertheless, the generation of high‐quality crystals of Fab:antigen complexes remains a bottleneck for structural studies, as many complexes are recalcitrant to crystallization (Boulot et al., 1988; Ereño‐Orbea et al., 2018; Malia et al., 2011).
Crystallization involves the formation of a lattice structure supported by stable and regular anisotropic packing interactions between neighboring particles (Anon X‐Ray Crystallography and Crystal Packing Analysis, 2017; McPherson & Gavira, 2014). Certain energy barriers must be overcome for this arrangement to occur—such as the entropic cost from the loss of translational and rotational degrees of particle freedom, and a reduction in local or overall conformational flexibility (Derewenda & Vekilov, 2006; Anon X‐Ray Crystallography and Crystal Packing Analysis, 2017). Penalties to the Gibbs free energy of crystallization must be offset by those that favor the process, such as an enthalpic loss from bond formation and an entropic gain upon solvent expulsion from crystal contact sites (Derewenda & Vekilov, 2006; Anon X‐Ray Crystallography and Crystal Packing Analysis, 2017). It is therefore highly desirable to reduce the entropic cost of lattice formation by reducing unnecessary high‐entropy elements from the protein structure before crystallization.
The surface entropy reduction (SER) strategy can provide an effective means for enabling crystallization and generating superior diffraction‐quality crystals in cases where the wild‐type protein does not crystallize or provides poor quality crystals (Longenecker et al., 2001; Males & Davies, 2019; Roos et al., 2006). In principle, the SER process involves changing the composition of amino acids on the protein surface which are entropically less favorable for mediating crystal lattice contacts (Derewenda, 2010; Price et al., 2009). In practice, surface residues with relatively high side chain conformational entropy (e.g., Gln, Asn, Lys, Arg, Asp, Glu) are substituted with amino acids with smaller side chains or possessing fewer rotamer conformational states (e.g., Ala, Gly, Ser, Tyr) by site‐directed mutagenesis (Cooper et al., 2007; Longenecker et al., 2001; Price et al., 2009). The resulting SER‐modified sites are anticipated to enable sampling of different crystal lattice packing arrangements by providing additional or alternative points of contact to those in the wild‐type (WT) protein (Males & Davies, 2019).
Optimization of Fab entropy without compromising fold and function could systemically improve crystallography studies of these highly conserved proteins and their complexes. Crystallization can also be enhanced by the modification of flexible regions or their removal entirely by either site‐directed mutagenesis or limited proteolysis in situ (Derewenda, 2010). Indeed, improvement in the diffraction resolution of several Fab:antigen complexes was achieved by making substitutions in the heavy chain "elbow" region (which connects the constant and variable domains of the heavy chain in the Fab framework), resulting in a reduced Fab elbow angle range (Bailey et al., 2018; Stanfield et al., 2006). The altered conformational state that the elbow "switch" substitution confers to the Fab framework was shown to result in fewer Fab molecules in the crystallographic asymmetric unit, thus making the structures easier to solve and refine (Bailey et al., 2018).
Another approach to improving Fab crystallization was recently reported (Lieu et al., 2020). Using the wealth of Fab apo and Fab:antigen complex crystal structures available in the Protein Data Bank (PDB), a comprehensive analysis of Fab‐mediated crystallization packing sites was performed. This analysis revealed that a subset of rabbit Fab crystal structures contained a β‐sheet stacking interface between the light and heavy chain constant domains of neighboring Fab molecules in the crystal lattice. To promote this packing mechanism in human Fabs, the authors grafted the rabbit‐derived structural segment from the light chain, which they termed “Crystal Kappa,” onto the corresponding region in a human Fab framework, which resulted in the expected crystal lattice packing (Lieu et al., 2020).
In this study, we have employed the SER strategy in combination with phage display technology to identify a small group of surface substitutions that provide a human Fab framework with improved crystallizability. We then performed a comprehensive analysis of the crystallizability of Fabs containing these substitutions alone or in combination with previously reported Crystal Kappa and elbow substitutions (Bailey et al., 2018; Lieu et al., 2020) to identify highly crystallizable Fab proteins. Consequently, we have developed a platform for facile and efficient crystallization of Fab:antigen complexes using this optimized system.
2. RESULTS
2.1. Selection and characterization of Fab variants with reduced surface entropy
We aimed to further improve the crystallizability of the Crystal Kappa Fab framework (Lieu et al., 2020) by identifying positions in the light chain constant (CL) domain that may be amenable to the SER strategy (Derewenda, 2010). We compiled a panel of 43 Fab and Fab:antigen complex crystal structures with a common human framework that we and others have used for antibody humanization and generation of synthetic antibodies by phage display (Table S1). The structures were processed by the CryCo (Crystal Contact) server (Sobolev et al., 2005) to evaluate the relative frequency at which each surface residue participates in crystal lattice packing interactions in this pool. We identified six surface residues in the CL domain with relatively high intrinsic conformational entropy, and >30% crystal contact binding recurrence, and modeled them on a human Fab framework (contact residues—yellow, Figure 1a). Additionally, we identified 12 surface residues with these properties, and which neighbor the contact residues (adjacent residues—magenta, Figure 1a).
FIGURE 1.

Fab variants with SER substitutions. (a) The library design mapped onto the Fab structure. The Fab framework mainchains are shown as ribbons (PDB accession code: 3L95). The light chain is colored gray, except residues in the Crystal Kappa graft, which is colored cyan. The heavy chain is colored light blue, except the elbow region, which is colored red. Positions that were randomized in the phage‐displayed libraries are labeled with IMGT numbering (Lefranc et al., n.d.), which is used throughout, and are shown as spheres, colored yellow or magenta for contact or adjacent residues, respectively (see main text for further details). The heavy and light chain variable (VH and VL) and constant domains (CH and CL) of the Fab are indicated. (b) Library design and selection results. The wild‐type (WT) sequence is shown at the top. Each position was diversified in one of two libraries, and those in the first library are indicated by asterisks (*). The amino acid diversity generated by the libraries for each position is shown below (degenerate codons selected for each amino acid are listed in Figure S1). The library output is depicted by a sequence logo, which shows the prevalence of amino acids among clones selected for binding to the EPHA2‐ECD, the cognate antigen for Fab‐F1. (c) Fab variants chosen for characterization in crystal screens. The WT Fab sequence is shown at the top, and the sequences of the seven Fab variants (S1–7) are shown below. Dashes indicate identity with the WT sequence. The yield of protein from 1‐L of bacterial culture and the T m determined by differential scanning fluorimetry are shown to the right.
To explore in a rapid manner whether the 18 contact/adjacent positions can accommodate amino acids such as Ala, Ser, His, Tyr, and Thr, in line with the SER strategy (Cooper et al., 2007), we designed two phage‐displayed libraries. At each position to be mutated, we used a degenerate codon strategy that encoded the WT amino acid and several alternative residues (Figure 1b and Figure S1). The libraries were constructed in the context of a Fab (F1) that binds to the C‐terminal fibronectin domain (FN2) of the human receptor tyrosine kinase (RTK) EPHA2, and were subjected to binding selections for the extracellular domain (ECD) of EPHA2 (Adams et al., manuscript in preparation; Enderle et al., 2021). Positive binding clones were subjected to DNA sequence analysis and unique protein sequences were aligned to determine the prevalence of each allowed amino acid at each position, the results of which are depicted as a sequence logo (Figure 1b). Aside from D169 which was conserved as the WT, diverse sequences were observed at the targeted positions, consistent with most surface residues not contributing significantly to the stability of the protein fold.
Numerous variants representing diverse sets of substitutions were recombinantly expressed and purified from Escherichia coli and screened for yield and thermostability. The screen identified two Fab‐F1 variants (FabS1 and FabS2) with yields and melting temperatures (T m ) very similar to FabWT‐F1. Both variants share three common substitutions (Q165S, K167Y, Q217A), with FabS2 containing a fourth substitution (K163S). Based on the prevalence of substitutions at other positions, we constructed a panel of 27 additional variants containing two, three or four substitutions, in addition to the four substitutions found in FabS2 (Table S2). The panel was screened for yield and thermostability, and this process yielded five additional candidates with reasonable yields and thermostabilities as compared to FabWT‐F1 (Figure 1c). Thus, the selection and screening process resulted in a panel of seven Fab variants containing three to seven substitutions of highly flexible surface side chains with less flexible side chains, but with yields and thermostabilities comparable to FabWT‐F1. Moreover, these Fab‐F1 SER‐variants (S1‐S7) exhibited no evidence of degradation, oligomerization, or aggregation detected by size exclusion chromatography (SEC) and native gel electrophoresis (Figure S2).
2.2. Crystallization screens of Fab‐F1 variants with reduced surface entropy
With each of the seven Fab‐F1 SER‐variants containing substitutions conferring reduced surface entropy (Figure 1c), extensive crystallization screening was undertaken to gauge the relative degree of crystallizability compared with FabWT‐F1 (Figure 2a). For each, we screened 576 conditions composed of six 96‐well plates, with each plate containing one of the following: sparse matrix screen JCSG‐plus HT‐96 Eco (Molecular Dimensions), sparse matrix screen INDEX HT (Hampton Research), salt screen SaltRX HT (Hampton Research), pH screen with a varying PEG/ion environment PACT Premiere HT‐96 (Molecular Dimensions), and GRAS Screen™ 1 or 2 (Hampton Research), which are favorable for testing monoclonal antibodies. The INDEX screen was the most effective as it generated multiple crystal hits with all Fab‐F1 SER‐variants. Each of the SER‐variants provided fewer crystal hits than FabWT, except FabS1, which contained only three substitutions (Q165S, K167Y and Q217A) and provided the most hits (50% more than the FabWT framework), and notably, exhibited higher protein yield and thermostability than FabWT‐F1 (Figure 1c). Consequently, the S1 variant was taken forward for further analysis and optimization.
FIGURE 2.

Results of crystal screens for Fab variants. (a) Results for WT and SER variants (S1–S7) of Fab‐F1. The number of crystal hits (y‐axis) obtained for each Fab variant (x‐axis) are shown after screening a total of 576 conditions (96 conditions for each of the six indicated screens). (b) Aggregate results for WT and variants of Fabs‐F1, Fab‐14386, and Fab‐F4.A containing S1, Crystal Kappa (C), elbow (E), or combination substitutions. The number of crystal hits (left y‐axis) or % of crystal hits generated (right y‐axis) obtained for each set of three Fab variants (x‐axis) are shown after screening a total of 1728 conditions (96 conditions for each of the six indicated screens for each of the three Fabs) (see Figure S4 for individual Fab results). (c) Aggregate results for WT or indicated variants of Fab‐F1 in complex with EPHA2‐FN2, and the dual‐antigen‐binding Fab‐14,386 in complex with antigen‐A or ‐B. The number of crystal hits (y‐axis) or % of crystal hits generated (right y‐axis) obtained for each set of three Fab:antigen complexes with the indicated Fab framework (x‐axis) are shown after screening a total of 864 conditions (96 conditions for each of three indicated screens for each of the three Fab:antigen complexes). (See Figure S7 for individual Fab:antigen complex results). (d) For reference, a schematic representation is shown of the Fab light‐chain and heavy‐chain (colored gray or light blue, respectively) with the locations of the SER (S1–S7) substitutions, Crystal Kappa substitution, and elbow substitution, shown in ball representation and colored blue, green, or magenta, respectively.
2.3. Crystallization screens of Fab variants combining S1, crystal kappa, and heavy‐chain elbow substitutions
Next, we assessed the crystallizability of the FabWT framework versus Fab variants containing the S1 substitution (FabS1), the Crystal Kappa substitution (FabC) (Lieu et al., 2020), the heavy‐chain elbow substitution (FabE) (Bailey et al., 2018), pairwise combinations of substitutions (FabS1C, FabS1E, FabCE), or all three sets of substitutions (FabS1CE). When combining the S1 and Crystal Kappa substitutions, we used the Q165S and K167Y mutations from the FabS1 framework, but as the S1 substitution Q217A is located in the Crystal Kappa loop region, we decided to keep the Crystal Kappa sequence unchanged, for consistency with the original study (see Table S3 for more information). As another consideration, the Fab complementarity determining regions (CDRs) may contribute to and influence crystal packing interactions, so we screened three Fabs with identical frameworks but distinct CDRs and antigen recognition. Along with Fab‐F1, we screened Fab‐F4.A, which recognizes the N‐terminal cysteine‐rich domain (CRD) of Frizzled‐4 (FZD4), and a 2‐in‐1 Fab (PMID‐19299620) named 14,836, which recognizes two distinct antigens separately (termed antigen‐A and antigen‐B hereafter).
For greater ease and higher yields, Fab proteins were recombinantly expressed in mammalian Expi293 cells (instead of the E. coli expression system used for the Fab‐F1 SER‐variants) and all Fabs were purified to homogeneity without any signs of degradation, oligomerization, or aggregation detected by denaturing and native gel electrophoresis. Consistently higher yields were obtained for F1, F4.A and 14,836 Fab variants containing the S1 substitutions (Figure S3a). In addition, the S1 substitutions conferred a slight increase to the Tm as assessed by differential scanning fluorimetry (tested for Fab‐F1 variants only) (Figure S3b). For each of the three distinct paratopes, we subjected FabWT and the seven framework variants to crystallization screens with the same 576 conditions described above for the panel of SER‐Fab variants.
The number of conditions that generated crystal hits for each of the 24 Fab framework/paratope combinations were determined and plotted separately (Figure S4). To gauge the general crystallizability that each of the substitutions and their combinations confer to the Fab framework, we plotted the aggregate of crystal hits for the eight groups. In this way, each group contains three Fabs with distinct paratopes but identical frameworks (Figure 2b). This analysis showed that FabC and FabCE frameworks exhibited dramatically enhanced crystallization compared to the FabWT framework (2%, 21%, and 18% of conditions generated crystal hits for FabWT, FabC, and FabCE, respectively). Crystallization was further enhanced with the addition of the S1 substitutions (26% and 37% of conditions generated crystal hits for FabS1C and FabS1CE, respectively), and in most cases the crystal morphology also improved upon addition of the S1 substitution (Supplementary EXCEL document and Figure S5). As a result of the number of crystal hits, and taking into account crystal morphology, the apo Fab screening revealed that FabS1C and FabS1CE were the two strongest performing frameworks for enhancing crystallizability of the Fab framework.
2.4. Crystallization screens of Fab variants in complex with antigens
Next, we screened the Fab variants of F1 in complex with EPHA2‐FN2, and the Fab variants of 14,836 in complex with either antigen‐A or antigen‐B. For FabWT and each of the seven framework variants, the complex was formed by mixing Fab with antigen at a 1:2 molar ratio and at a final concentration of 7 mg/mL. Each set of the Fab:antigen combinations was subjected to the three crystallization screens that yielded the most hits for the apo Fab screens (JCSG+Eco, PACT, and SaltRX), and thus, a total of 2304 conditions were screened for each antigen (288 conditions for each of the eight Fab frameworks). Apo Fab drops were set up in parallel to evaluate whether apo Fab crystals may have formed in the complex drops by comparing crystal morphology (Data S2). In addition, for the Fab‐14,836:antigen‐A complex screens, crystal composition was verified by picking crystals directly from the 96‐well drops when possible, and after washing away precipitant, analyzing crystal composition by denaturing polyacrylamide gel electrophoresis (Figure S6). As would be expected, a small number of conditions generated putative apo Fab crystals in the complex crystallization drops (indicated by the gray bars in Figure 2c).
For the Fab‐F1:EPHA2‐FN2 complex screens, the most hits were obtained with FabC, plenty of hits were also obtained with FabS1, FabCE, FabS1C, and FabS1CE, one good hit was obtained with FabS1E, but no hits were obtained with FabWT or FabE (Figure S7a). For the Fab‐14,836:antigen‐A complex screens, a striking number of hits were obtained with FabS1CE (22% of conditions generated a crystal hit), while many hits were also obtained with FabC, FabS1C, and FabCE, and a couple of hits were obtained with FabS1E, but no hits were obtained with the other variants (Figure S7b). For the Fab‐14,836:antigen‐B complex screens, an exceptional number of crystal hits were obtained with FabS1C and FabS1CE (crystal hits observed in 32% and 40% of conditions, respectively), a couple of hits were obtained with each of the FabC and FabCE frameworks, but no hits were obtained with the other frameworks (Figure S7c).
For the Fab:antigen complexes in aggregate, the addition of the S1 substitution enhanced crystallizability: while the FabC and FabCE frameworks facilitated crystallization in 9% and 3% of the conditions, respectively, the FabS1C and FabS1CE frameworks facilitated crystallization in 14% and 23% of conditions, respectively (Figure 2c). Meanwhile, the FabWT framework did not generate any crystal hits at all for these three Fab:antigen complexes. As a result of the Fab‐14,836:antigen‐A complex crystals generated in the broad screening, and some straight‐forward crystallization optimization for the Fab‐F1:EPHA2‐FN2 and Fab‐14,836:antigen‐B complexes, all three Fab:antigen complex structures were subsequently solved by utilizing the three best performing Fab variants: FabS1CE, FabS1C, and FabC. Further details of these structures will be presented elsewhere.
2.5. Structural analysis of Fab‐F1 with FabS1 , FabC , and FabS1CE frameworks
To investigate how the S1, Crystal Kappa, and elbow substitutions—and their combinations—impact crystal lattice packing, we solved the crystal structures of Fab‐F1 with three distinct frameworks: FabS1, FabC, and FabS1CE. In the crystallization conditions which generated hits for both FabWT‐F1 and FabS1‐F1, crystals of the latter presented better morphology (i.e., possessed a smoother, non‐striated surface) (Data S2 and Figure S8). A condition from the INDEX screen with ammonium sulfate and high molecular weight PEG was selected for crystallization optimization of both FabWT‐F1 and FabS1‐F1, resulting in crystals that diffracted to 4.2 Å or 3.5 Å, respectively. The quality of the FabWT‐F1 dataset was too poor to solve with confidence. However, the FabS1‐F1 structure was solved with an orthorhombic crystal system and P212121 symmetry (Table 1). Within the asymmetric unit, FabS1‐F1 molecules form a hexameric arrangement (Figure 3a(i)), led by aromatic residues in the exposed CDRs. The S1 substitutions Q165S and K167Y, along with N170, A171, and L172 surface residues in the nearby loop region, were found to participate in several different crystal lattice packing interactions between neighboring Fab hexamers in the FabS1‐F1 structure (Table S4). In one of the FabS1‐F1 crystal lattice packing sites, hydrogen bond interactions form between the side chains of the S1 substitutions Q165S and K167Y, and residues T215*, Q216*, and T217* in a neighboring Fab CH domain (Figure 3b(i)) (NB: asterisks are used throughout the main text and Figure legends to distinguish heavy‐chain residues from light‐chain residues). Meanwhile, in another FabS1‐F1 lattice packing site, the S1 substitution K167Y interacts with the nearby L172 in the adjacent loop region of the same Fab molecule, which in turn interacts with I219* and S180* from the CH domain in a neighboring Fab molecule (Figure 3b(ii)). At a third FabS1‐F1 crystal lattice packing site, N170* and A171* residues, in the loop region adjacent to the S1 site, form a network of hydrogen bond interactions with R95*, P15* and G16* in the VH domain of a packing Fab molecule (Figure 3b(iii)). The myriad of different crystal lattice packing interactions like these ones (and others observed in the FabS1‐F1 structure) suggest that the S1 substitutions Q165S and K167Y cooperate with nearby residues N170, A171, and L172 in the Fab CL domain to provide a versatile crystal lattice packing site.
TABLE 1.
Crystallography data table.
| FabS1 F1 | FabC F1 | FabS1CE F1 | FabS1C C1 | FabS1CE‐C1:EPHA2‐CRD | FabS1CE‐C1:EPHA2‐CRD | FabE‐V1:VHH | FabC‐V1:VHH | FabCE‐V1:VHH | FabS1CE‐V1:VHH | |
|---|---|---|---|---|---|---|---|---|---|---|
| Crystallization condition | 0.2 M Ammonium sulfate | 0.2 M NaCl | 0.2 M Sodium Nitrate | 0.1 M Ammonium Acetate | 0.2 M Ammonium Chloride | 0.1 M Sodium Chloride | 4 % Tacsimate pH 4.0 | 0.2 M Potassium citrate tribasic monohydrate | 2% Tacsimate pH 5.0 | |
| 0.1 M Bis Tris HCl pH 6.5 | 0.1 M Sodium acetate pH 4.0 | 0.1 M Bis‐Tris propane pH 6.5 | 0.1 M BisTris pH 5.5 | 0.1 M BisTris pH 6.8 | 12% PEG3350 | 0.1 M Citric acid pH 3.5 | 0.1 M Na citrate tribasic dihydrate pH 5.6 | |||
| 20 % PEG 3350 | 22 % PEG 8000 | 20 % PEG 3350 | 17% PEG 10000 | 30% PEG600 | 20 % PEG 3350 | 20% PEG 3350 | 25% PEG 3350 | 16% PEG 3350 | ||
| Freezing conditions | 25 % ethylene glycol | 25 % ethylene glycol | 25 % ethylene glycol | 25 % ethylene glycol | No cryoprotection necessary | 25 % ethylene glycol | 10% Glycerol&25% PEG 1500 | 10% Glycerol | Crystallization solution | 30% Jeffamine |
| Space group | P21 21 21 | C2 | P42 21 2 | P21 | P32 2 1 | P21 | P21 | P21 21 21 | P43 21 2 | P21 21 21 |
| Unit cell parameters | ||||||||||
| Length (Å) | a = 80.8 | a = 106.7 | a = 74.0 | a = 44.7 | a = 71.4 | a = 57.7 | a = 65.8 | a = 54.5 | a = 73.6 | a = 52.2 |
| b = 189.5 | b = 73.8 | b = 74.0 | b = 73.8 | b = 71.4 | b = 182.1 | b = 119.8 | b = 74.2 | b = 73.6 | b = 72.8 | |
| c = 216.5 | c = 70.0 | c = 219.1 | c = 174.2 | c = 235.0 | c = 74.4 | c = 82.2 | c = 218.4 | c = 207.2 | c = 242.4 | |
| Angles (°) | α = β = γ = 90.0 | α = γ = 90.0 | α = β = γ = 90.0 | α = γ = 90.0 | α = β = 90.0 | α = γ = 90.0 | α = γ = 90 | α = β = γ = 90 | α = β = γ = 90 | α = β = γ = 90 |
| β = 116.5 | β = 96.4 | γ = 120.0 | β = 92.9 | β = 93.35 | ||||||
| Matthews coefficient (Å3/Da) | 2.84 | 2.53 | 3.08 | 3.02 | 2.83 | 3.17 | 2.5 | 3.5 | 2.3 | 3.7 |
| Solvent content (%) | 56.6 | 51.4 | 60 | 59.3 | 56.5 | 61.2 | 50.7 | 64.9 | 46.7 | 66.9 |
| Data collection | ||||||||||
| Resolution (Å) | 95.04–3.50 | 62.65–1.84 | 74.0–2.50 | 86.56–1.98 | 117.51–1.85 | 68.78–2.90 | 119.83–2.23 | 74.19–2.55 | 103.62–2.52 | 121.2–2.52 |
| (3.64–3.50) | (1.88–1.84) | (2.60–2.50) | (2.02–1.98) | (1.89–1.85) | (3.04–2.90) | (2.29–2.23) | (2.66–2.55) | (2.62–2.52) | (2.62–2.52) | |
| Number of unique reflections | 40,200 (4729) | 40,653 (1987) | 20,950 (2408) | 76,017 (3866) | 60,648 (3633) | 32,852 (4372) | 61,587 (4313) | 29,702 (3539) | 20,161 (2220) | 32,276 (3603) |
| Completeness (%) | 93.1 (99.0) | 96.4 (78.1) | 95.0 (100) | 96.9 (82.6) | 100 (99.3) | 97.0 (97.0) | 99.1 (93.8) | 99.7 (99.9) | 100 (99.7) | 100 (100) |
| Avg (I/σ(I)) | 7.9 (2.1) | 12.7 (1.1) | 8.1 (1.5) | 10.4 (1.8) | 28.7 (1.6) | 5.7 (1.9) | 16.1 (2.7) | 18.5 (1.0) | 19.2 (1.1) | 12.5 (0.8) |
| Rpim | 0.07 (0.41) | 0.06 (0.87) | 0.07 (0.64) | 0.06 (0.41) | 0.015 (0.46) | 0.08 (0.38) | 0.03 (0.24) | 0.03 (0.8) | 0.03 (0.51) | 0.04 (0.78) |
| Redundancy | 6.7 (6.7) | 3.8 (2.7) | 6.4 (6.7) | 3.4 (3.5) | 11.5 (11.8) | 6.6 (5.8) | 6.9 (6.2) | 5.6 (5.8) | 25.9 (26.1) | 13.1 (13.6) |
| CC1/2 | 1.00 (0.79) | 1.00 (0.37) | 1.00 (0.63) | 0.99 (0.63) | 1.00 (0.69 | 0.99 (0.78) | 0.99 (0.86) | 0.99 (0.54) | 0.99 (0.69) | 0.99 (0.37) |
| Wilson B‐factor (Å2) | 91.7 | 33.6 | 42.7 | 31.6 | 41.8 | 58.06 | 46.5 | 87.2 | 74.7 | 80.6 |
| Refinement | ||||||||||
| Fab/Fab:antigen complex molecules in the ASU | 6 | 1 | 1 | 2 | 1 | 2 | 2 | 1 | 1 | 1 |
| Resolution (Å) | 94.73–3.50 | 62.65–2.00 | 61.32–2.60 | 86.56–2.10 | 61.81–1.90 | 68.78–3.00 | 119.83–2.23 | 74.19–2.55 | 103.62–2.52 | 121.2–2.52 |
| Rwork/Rfree | 0.243/0.306 | 0.194/0.228 | 0.200/0.256 | 0.220/0.264 | 0.180/0.214 | 0.194/0.244 | 0.18/0.225 | 0.194/0.254 | 0.214/0.285 | 0.191/0.243 |
| No. atoms | ||||||||||
| Protein/peptide | 18,925 | 3157 | 3147 | 6408 | 4230 | 8217 | 8611 | 4267 | 4121 | 4319 |
| Ligand/ion | 40 | 21 | 15 | 175 | 144 | 6 | 14 | 6 | 14 | 27 |
| Water | — | 214 | 83 | 491 | 240 | 2 | 569 | 39 | 37 | 71 |
| B‐factors | ||||||||||
| Overall | 96.6 | 46.2 | 62.6 | 37.5 | 50.2 | 62.6 | 50.1 | 97.2 | 86.5 | 83.2 |
| Protein | 96.6 | 46.2 | 63.2 | 37.2 | 49.7 | 62.7 | 49.9 | 97.1 | 88.9 | 83.3 |
| Ligand/ion | 72.7 | 51.7 | 52.4 | 42.1 | 63 | 52.9 | 57.8 | 110.1 | 107.9 | 105 |
| Water | — | 45.4 | 43.4 | 39.6 | 51.6 | 41.5 | 49.8 | 98.7 | 69.6 | 75 |
| R.m.s. deviations | ||||||||||
| Bond lengths (Å) | 0.005 | 0.007 | 0.008 | 0.007 | 0.007 | 0.011 | 0.004 | 0.008 | 0.004 | 0.004 |
| Bond angles (°) | 1 | 0.86 | 1.08 | 0.97 | 0.96 | 1.21 | 1.04 | 1.1 | 1.05 | 1.12 |
| Ramachandran | ||||||||||
| Favored | 91.3 | 97.3 | 96.2 | 97.5 | 98.2 | 96.3 | 96.9 | 95.1 | 92.9 | 94.5 |
| Allowed | 8.4 | 2.7 | 3.8 | 2.3 | 1.8 | 3.7 | 3.1 | 4.72 | 6.91 | 5.5 |
| Forbidden | 0.3 | 0 | 0 | 0.2 | 0 | 0 | 0 | 0.18 | 0.19 | 0 |
FIGURE 3.
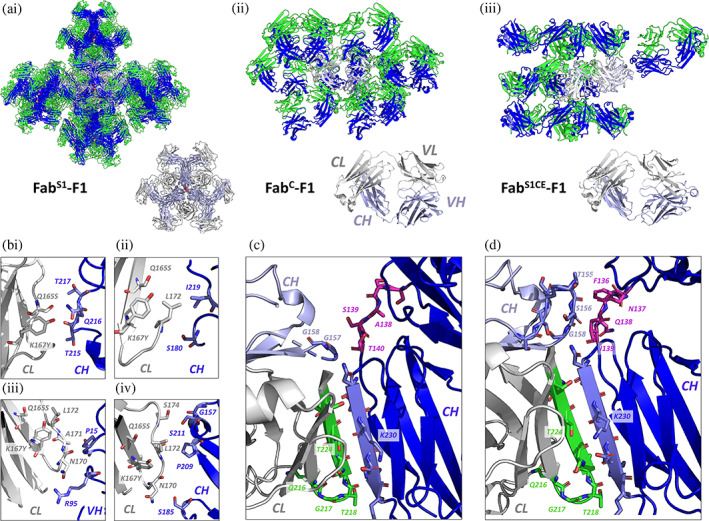
The impact of S1, Crystal Kappa, and elbow substitutions on crystal lattice packing interactions of Fab‐F1. (a) Crystal lattice packing arrangement with symmetry mates (upper panel), and asymmetric unit (lower panel), of Fab‐F1 with the following frameworks: (i) FabS1 (P212121 space group) (sulfate ions depicted as red spheres), (ii) FabC (C2 space group), and (iii) FabS1CE (P42212 space group). The heavy and light chains of the asymmetric unit are colored light blue or gray, respectively. For other selected Fab particles that form part of the crystal lattice, heavy and light chains are colored dark blue or green, respectively. The heavy and light chain variable (VH and VL) and constant domains (CH and CL) of the Fab are labeled in (ii). (b) Selected lattice packing interactions mediated by the S1 substitutions (Q165S and K167Y) and residues (N170, A171, L172, and S174) in the adjacent loop region of the Fab CL domain, in (i, ii, and iii) the FabS1‐F1, and (iv) the FabS1CE‐F1 crystal structures. (c) The β‐sheet stacking interaction (green/blue) mediated by Crystal Kappa between adjacent Fab molecules in the crystal lattice of FabC‐F1. The nearby WT elbow residues are shown in magenta. (d) The contiguous packing site in the FabS1CE‐F1 crystal lattice, formed by the Crystal Kappa signature interaction, and interactions between the elbow region (F136*, N137*, Q138*, I139*) (magenta) and residues in the packing Fab molecule CH domain (T155*, S156*, G158*). Asterisks are used to distinguish heavy‐chain residues from light‐chain residues.
After crystallization optimization, FabC‐F1 crystals were obtained in a high molecular weight PEG and low pH condition, from which a 1.95 Å dataset was collected (Table 1). In the FabC‐F1 crystal structure (solved in a C2 space group; monoclinic crystal system), the Crystal Kappa substitution enables stacking between the final N‐terminal β‐sheet structural segments of the CL and CH domains of two neighboring Fab molecules in the crystal lattice, as intended (Figure 3c) (Lieu et al., 2020). Moreover, the Crystal Kappa‐directed packing interaction in the FabC‐F1 structure overcame the CDR packing interactions that dominated the FabS1‐F1 crystal form, helping to reduce the number of Fab molecules in the asymmetric unit from six to one (Figure 3a(ii)).
In the broad crystallization screening we found that the FabS1CE framework improved crystallizability of Fab‐F1 significantly better than the FabCE and FabC frameworks, based on number of conditions which generated crystal hits (<1%, 2%, and 26% of conditions generated hits for FabCE‐F1, FabC‐F1 and FabS1CE‐F1, respectively), in addition to an improved crystal morphology, revealing the advantage of combining all three substitutions (Figure S4a and Data S2). In contrast to FabS1 and FabC, the FabS1CE framework produced good‐sized Fab‐F1 crystals directly in the broad crystallization screens (i.e., without any crystallization optimization required), and from these, a 2.6 Å dataset was collected (Table 1). The FabS1CE‐F1 crystal structure was solved in a higher symmetry space group (P42212; tetragonal crystal system) than FabC‐F1, but with the signature packing interaction of Crystal Kappa preserved (Figure 3d). In addition, the incorporation of the elbow substitution changed the elbow angle of FabS1CE‐F1 relative to FabC‐F1, as intended (Bailey et al., 2018) (Table 2). In one of the crystal lattice packing sites in the FabS1CE‐F1 structure, a network of hydrophobic and hydrogen bond packing interactions forms between S1 substitutions Q165S and K167Y, residue L127, and residues P209* and S211* in the CH domain of a packing Fab molecule. Further stabilizing the formation of this crystal lattice packing site, residues N170 and S174, in the loop region adjacent to the S1 site, form hydrogen bond interactions with residues S185* and G157*, respectively, in the packing Fab molecule. Notably, the packing interactions mediated by the S1 substitutions and residues in the nearby loop region in the Fab CL domain observed within the FabS1CE‐F1 crystal lattice are distinct from those observed in the FabS1‐F1 crystal lattice (Figure 3b, compare i, ii, and iii, with iv).
TABLE 2.
Structural information for Fab and Fab:antigen complexes. The Fab elbow (angle range expected 164–186°) is described and defined in Derewenda and Vekilov (2006) and McPherson & Gavira (2014).
| Fab/Fab:antigen complex | Mutations | Crystal system | Space group | Number of Fab/s or Fab:antigen complex/s in ASU | ASU Fab/s elbow angle (°) | PDB accession code |
|---|---|---|---|---|---|---|
| Fab F1 | S1 | Orthorhombic | P212121 | 6 | 185.2, 186.1, 184.9, 184.5, 184.6, 185.1 | 8T7F |
| C | Monoclinic | C2 | 1 | 144.6 | 8T7G | |
| S1CE | Tetragonal | P42212 | 1 | 171.8 | 8T7I | |
| Fab C1 | S1C | Monoclinic | P21 | 2 | 167.9, 140.5 | 8TS5 |
| Fab‐C1:EPHA2‐CRD complex | S1CE | Trigonal | P32 2 1 | 1 | 167.4 | 8TRS |
| S1CE | Monoclinic | P21 | 2 | 172.7, 186.4 | 8TRT | |
| Fab‐V1:VHH complex | ‐ | Monoclinic | C2 | 9 | 173.8, 175.1, 172.3, 173.2, 185.3, 172.0, 170.6, 174.7, 173.4 | 7RTH (Price et al., 2009) |
| E | Monoclinic | P21 | 2 | 172.6, 171.7 | 8T58 | |
| C | Orthorhombic | P212121 | 1 | 143.5 | 8T6I | |
| CE | Tetragonal | P43212 | 1 | 176.3 | 8T9Y | |
| S1CE | Orthorhombic | P212121 | 1 | 165.3 | 8T8I |
The FabS1CE‐F1 crystal lattice arrangement also revealed that the proximity of the Crystal Kappa packing site and junction at the elbow substitution region results in the formation of a contiguous packing site between two Fab molecules in the crystal lattice (Figure 3d). While the Crystal Kappa region facilitates packing with an adjacent Fab molecule through its signature β‐sheet stacking interaction, residues from the elbow substitution region (F136*, N137*, Q138*, I139*) concomitantly form various hydrogen bond and Van der Waals interactions with residues in the packing Fab CH domain (T155*, S156*, G158*). The packing interaction site at the elbow junction is different in the FabC‐F1 and FabS1CE‐F1 crystal lattices; in contrast to the FabS1CE‐F1 crystal structure, just one residue (G157*) in the FabC‐F1 crystal structure forms an interaction with the WT elbow region (residue T140*) (compare Figure 3c with d) (Table S4). Moreover, a significant portion of the loop region preceding residue S156* remains unresolved from the electron density in the FabC‐F1 structure, in contrast to the FabS1CE‐F1 structure in which the loop region is entirely resolved. As a result of the packing interactions mediated by residues in the elbow substitution region with the packing Fab CH domain, the mode of Fab:Fab packing induced by Crystal Kappa is further stabilized.
2.6. Crystal lattice packing in FabS1C‐C1 and FabS1CE‐C1:EPHA2‐CRD complex structures
To further test the general applicability of the engineered Fab frameworks as crystallization chaperones, we attempted to solve the structure of another previously uncrystallized Fab:antigen complex. We selected an in‐house Fab (C1) that binds to the EPHA2 cysteine‐rich domain (CRD). Guided by the results of the Fab and Fab:antigen complex screening described above (Figure 2b,c), we utilized the two best performing Fab frameworks—FabS1C and FabS1CE—to carry out a broad crystallization screening of the Fab‐C1:EPHA2‐CRD complex. Apo Fab (FabS1C‐C1 and FabS1CE‐C1) crystallization drops were set up in parallel to the Fab:antigen complex crystallization drops to evaluate whether complex or apo Fab crystals had formed by comparing morphology (Data S2). The FabS1C framework facilitated crystallization of the Fab‐C1:EPHA2‐CRD complex, with 21% of conditions generating crystal hits, while the addition of the elbow substitution to the framework (FabS1CE) enhanced crystallizability even further with an incredible 45% of conditions generating crystal hits ‐ once again revealing a strong synergistic relationship between the three sets of substitutions (Figure S9a,b, and Data S2).
In many conditions, the FabS1CE‐C1:EPHA2‐CRD complex crystals presented excellent morphology (i.e., good size, non‐striated, three‐dimensional) (Data S2 and Figure S9c) and a selection of FabS1CE‐C1:EPHA2‐CRD complex crystals were picked directly from the broad screen for diffraction studies. Subsequently, the FabS1CE‐C1:EPHA2‐CRD complex structure was solved from a 1.9 Å dataset to reveal a trigonal crystal system with P3221 crystal lattice symmetry, with just one Fab:antigen complex present in the ASU (Figure 4a(i) and Table 1). Details of the epitope:paratope interaction will be presented elsewhere (Adams et al., manuscript in preparation). Here, we focus on how the S1, Crystal Kappa and elbow substitutions all contribute to the crystal lattice packing. The Crystal Kappa substitution facilitates its distinctive β‐sheet stacking interaction between neighboring Fab constant domains in the crystal lattice (Figure S10a), while the elbow substitution restricts the Fab elbow angle to within the expected range (Table 2) (Bailey et al., 2018; Stanfield et al., 2006). Meanwhile, the S1 substitution K167Y forms a hydrophobic packing interaction against L172 in the adjacent loop region, which in turn forms hydrogen bond and hydrophobic packing interactions with V249 in the packing antigen molecule. This crystal lattice packing site is further supported by a hydrogen bond interaction between the S174 hydroxyl group of the Fab CL domain and the peptide backbone amide group of S218 in the antigen (Figure 4b(i) and Figure S11b(i)).
FIGURE 4.

Analysis of S1‐mediated crystal lattice packing interactions in FabS1CE‐C1:‐EPHA2‐CRD and FabS1C‐C1 structures. (a) Crystal lattice packing arrangement (upper panel) with symmetry mates, and asymmetric unit (lower panel) of (i) FabS1CE‐C1:EPHA2‐CRD (P3221 space group, trigonal crystal system), (ii) FabS1CE‐C1:EPHA2‐CRD (P21 space group, monoclinic crystal system), and (iii) FabS1C‐C1 (P21 space group). ASU Fab heavy‐ and light‐chains are colored light blue or gray, respectively. Symmetry mate Fab heavy‐ and light‐chains are colored dark blue and green, respectively. EPHA2‐CRD is colored magenta. The heavy‐ and light‐chain variable (VH and VL) and constant domains (CH and CL) of the Fab are labeled in (i). (b) S1 substitutions (Q165S and K167Y) and residues in the nearby loop region (N170, A171, L172. S174) cooperate to form crystal lattice packing sites in the following structures: (i) FabS1CE‐C1:EPHA2‐CRD (P3221 space group), (ii) FabS1CE‐C1:EPHA2‐CRD (P21 space group), and (iii and iv) FabS1C‐C1. NB: In the S1‐crystal lattice packing site of FabS1CE‐C1:EPHA2‐CRD (P21 space group) (ii), the K72 side chain of the packing Fab VH domain remains partially unresolved from the electron density indicating a dynamic interaction.
From the selection of crystals sent for diffraction studies, a different crystal of the FabS1CE‐C1:EPHA2‐CRD complex diffracted to 3.0 Å, and the structure was solved to reveal a monoclinic crystal system with P21 crystal lattice symmetry, with two Fab:antigen complexes present in the ASU (Figure 4a(ii) and Table 1). Once again, the Crystal Kappa substitution made its signature packing interaction (Figure S10b), and the Fab elbow angles were within the expected range (Table 2) (Bailey et al., 2018). Meanwhile the S1 substitution (Q165S and K167Y) was found to cooperate with the nearby L172 to provide a crystal lattice packing site in the CL domain, this time interacting with charged residues K72* and D69* in an adjacent Fab VH domain (Figure 4b(ii)).
To characterize the S1 and Crystal Kappa combination in the absence of the elbow substitution, FabS1C‐C1 crystals were also harvested directly from the broad crystallization screens, from which a 2.1 Å dataset was collected and the FabS1C‐C1 structure was subsequently solved with a monoclinic crystal system in a P21 space group and two Fab molecules in the ASU (Figure 4a(iii)). We found that the Crystal Kappa facilitated packing between Fab molecules as expected, but without the inclusion of the elbow substitution, the elbow angles of the Fab molecules in the ASU were 167.9 and 140.5° (the latter being outside of the expected angle range for the elbow substitution (Table 2) (Bailey et al., 2018). Furthermore, packing interactions at the elbow junction between residues in the elbow region and the neighboring Fab CH domain were limited (Figure S10c), similar to that observed in the FabC‐F1 structure (Figure 3c). In one S1 substitution‐mediated crystal lattice packing site in the FabS1C‐C1 structure, the K167Y hydroxyl group forms an interaction with the side chain of R95* from a packing Fab VL domain, while the phenol ring of the K167Y side chain packs against the L172 side chain which in turn forms a hydrophobic packing interaction with the pyrrolidine ring of P15* and a hydrogen bond interaction with the amide backbone group of G16* from a neighboring Fab molecule (Figure 4b(iii)). This crystal lattice packing site on the Fab VH domain is in a similar region to one of those observed in the FabS1‐F1 structure (Figure 3b(iii)), however, the S1 substitutions (Q165S and K167Y), together with nearby L172, accommodate a different packing position of the Fab VH domain through different interactions with residues P15* and R95*. Meanwhile, in another S1 packing site in the FabS1C‐C1 structure, K167Y, together with N170 and A171, forms a network of hydrogen bond and Van der Waals interactions with residues G16*, S93*, N92*, and G74* in an adjacent Fab VH domain (Figure 4b(iv)). Altogether, the variety of different S1‐mediated packing interactions observed in the FabS1CE‐C1:EPHA2‐CRD, FabS1C‐C1, FabS1‐F1, and FabS1CE‐F1 crystal structures (Figure 4b and Figure 3b) reveal how the S1 substitutions cooperate with nearby residues N170, A171, L172, and S174 in the Fab CL domain to provide a favorable yet adaptable site for mediating crystal lattice packing.
2.7. Structural analysis of Fab‐V1:VHH complexes with FabC , FabE , FabCE , or FabS1CE frameworks
Due to considerable technical improvements in single‐particle cryogenic electron microscopy (CryoEM) over the past few years, more structures continue to be solved at high resolution (Wang, 2022; Wang & Wang, 2017). However, CryoEM still works better with particles of larger size, with a lower size limit hovering at 50 kDa (Castells‐Graells et al., 2023; Cianfrocco & Kellogg, 2020; Liu et al., 2019; Wang & Wang, 2017). Consequently, steps have been taken to overcome this limitation by increasing the overall particle size—for instance, with the addition of protein scaffolds which bind to the protein of interest (Wu & Rapoport, n.d.; Bloch et al., 2021; Castells‐Graells et al., 2023; Liu et al., 2019).
Fab‐V1 (also known as NabFab (Bloch et al., 2021)) is a synthetic Fab (with the same human framework as all Fabs described in the previous sections) originally designed to be used as a fiducial marker and size enhancer for CryoEM studies of membrane proteins in complex with an autonomous VHH domain (also referred to as a nanobody) (Bloch et al., 2021). Fab‐V1 interacts specifically with a conserved region in the VHH scaffold, distal to the paratope. In this way, the Fab‐V1:VHH interaction does not interfere with the interactions of the VHH domain with its cognate antigen (Bloch et al., 2021). The Fab‐V1 fiducial‐assisted CryoEM strategy has been utilized to determine the structure of a VHH domain in complex with a 50 kDa membrane protein—the homodimeric Staphylococcus capitis divalent metal ion transporter (ScaDMT) (Bloch et al., 2021) (Figure 5a(i)).
FIGURE 5.

The impact of S1, Crystal Kappa, and elbow substitutions on crystal lattice packing interactions of Fab‐V1:VHH complexes. (a) Strategies to solve membrane protein:VHH complex structures. (i) The structure of ScaDMT membrane protein in complex with a VHH domain, bound to Fab‐V1 in complex with a Fab‐framework binding VHH domain (ScaDMT:VHH:Fab‐V1:VHH super‐complex), was determined by Fab‐V1‐fiducial assisted cryo‐electron microscopy (Bloch et al., 2021). (ii) The S1, Crystal Kappa, and elbow substitutions (ball representation in blue, green, and magenta, respectively), made to the Fab‐F1 framework, enhance crystallization of Fab‐F1:VHH complexes. (b) Crystal lattice packing arrangement with symmetry mates (upper panel) and asymmetric unit (lower panel) of Fab‐V1:VHH complexes with the following frameworks: (i) FabWT‐V1:VHH (C2 space group) (Price et al., 2009), (ii) FabE‐V1:VHH (P21 space group) (Sodium ions depicted as green spheres), (iii) FabC‐V1:VHH (P212121 space group), (iv) FabCE‐V1:VHH (P43212 space group), and (v) FabS1CE‐V1:VHH (P212121 space group). The Fab heavy‐ and light‐chains in the asymmetric unit are colored light blue or gray, respectively, while the VHH domain is colored magenta. For symmetry mates in the crystal lattice, heavy‐ and light‐chains are colored dark blue or green, respectively. For reference, the heavy and light chain variable (VH and VL) and constant domains (CH and CL) of the Fab are labeled in (B (iii)).
Due to certain limitations, in some cases it is not possible to obtain a high resolution structure of a membrane protein:VHH complex using CryoEM, even with the assistance of a marker such as Fab‐V1. These limitations include lack of ready access to an electron microscope or computational resources to process the data, insufficient particle adsorption to the grid (Cianfrocco & Kellogg, 2020; Xu & Dang, 2022), lack of preferred particle orientation at the air‐water interface (Chen et al., 2019; Xu & Dang, 2022), and deviations from perfect symmetry reducing the attainable resolution (Tsumoto et al., 1996). Therefore, we decided to investigate whether the crystallizability of the Fab‐V1:VHH complex is enhanced when the S1, Crystal Kappa, and elbow substitutions are incorporated into the framework, thus improving the capacity of Fab‐V1 to act as a chaperone in the crystallization of membrane protein:VHH complexes (which cannot be solved by CryoEM for instance) (Figure 5a(ii)).
Fab‐V1:VHH complexes with various frameworks—FabC, FabE, FabCE, FabS1E, and FabS1CE—were prepared and screened alongside FabWT for comparison, using various screens (JCSG+Eco, PACT, INDEX, ProComplex (NeXtal Biotechnologies) and PEG/ion HT™ (Hampton Research)) (Figure S12). For the Fab‐V1:VHH complex, the FabE, FabC, FabCE, and FabS1CE frameworks gave the highest number of hits. The FabS1E framework generated only a modest number of Fab‐V1:VHH complex hits (comparable to FabWT), but several good hits in terms of crystal morphology were obtained directly from the 96‐well screens. Considering the number of successful conditions on the one hand, and crystal morphology on the other, it is clear that the engineered frameworks dramatically increased crystallizability of the Fab‐V1:VHH complex compared with the FabWT framework.
Previously, the FabWT framework initially failed to produce suitable Fab‐V1:VHH complex crystals for data collection, and crystals were only obtained after extensive optimization with crystallization seeding (Bloch et al., 2021). The crystal structure of the FabWT‐V1:VHH complex was determined to a maximum resolution of 3.2 Å, in a low symmetry (C2) space group, containing nine complexes in the ASU (PDB accession code: 7RTH) (Bloch et al., 2021) (Figure 5b(i)). By contrast, we were able to determine the crystal structure of the Fab‐V1:VHH complex at better resolution using the FabE, FabC, FabCE, and FabS1CE frameworks (ranging 2.2–2.5 Å), with all structures containing just one complex molecule in the ASU, except for the FabE‐V1:VHH complex crystals for which the ASU contained just two complexes (Figure 5b(ii–v); Table 1). The FabC and FabS1CE frameworks yielded crystals with very similar crystal lattice packing; both structures were solved as orthorhombic crystal systems with P212121 space groups, but have a slightly different Matthew's coefficient (Å3/Da) and solvent content, presumably due to a difference in the Fab elbow angle (Tables 1 and 2). Meanwhile, the FabE and FabCE frameworks yielded crystals in monoclinic (P21 space group) and tetragonal (P43212 space group) crystal systems, respectively. Thus, our results reveal that crystal packing of Fab‐V1 in complex with the VHH domain has changed considerably by utilizing these alternative Fab frameworks, resulting in better diffracting crystals which required less optimization, and a reduction in the number of complex molecules in the ASU, in addition to increased crystal lattice symmetry in some cases, altogether making the structures easier to solve and refine.
3. DISCUSSION
We utilized the SER strategy and phage display technology to identify surface substitutions that contribute to a favorable crystal lattice packing site on a Fab framework without destabilizing the protein fold. For our initial test case Fab‐F1, incorporation of the S1 substitutions resulted in an increase in level of expression in bacteria and mammalian cell systems (Figure 1c and Figure S3a), conferred a marginal increase to the T m compared to the FabWT framework (Figure 1c), and enhanced crystallizability as evidenced by a 50% increase in the number of crystal hits, improvement in crystal morphology, and better diffraction resolution (Figure 2a; Data S2; Figure S8). Furthermore, the S1 substitutions facilitated crystallization of the Fab‐F1:EPHA2‐FN2 complex in >5% of conditions in the broad crystallization screening, while the FabWT framework did not facilitate crystallization of this complex under any conditions (Figure S7a). We also found that the S1 substitutions provide a significant enhancement to the Fab crystallizability conferred by the Crystal Kappa (Lieu et al., 2020) substitution, in the presence or absence of the elbow (Bailey et al., 2018) substitution, as evidenced by an increase in number of Fab crystal hits (Figure 2b; also see Figure S4 (compare FabC and FabS1C, and compare FabCE and FabS1CE)), and Fab:antigen complex crystal hits for two out of three complexes (Figure 2c; see Figure S7b,c), in addition to improvements in crystal morphology (larger crystals, three‐dimensional, less striated, etc.) (Data S2 and Figure S5). Furthermore, the FabC, FabE and FabCE frameworks exhibited improved yield and Tm when the S1 substitutions were also incorporated, highlighting an additional benefit (Figure S3).
The S1 substitutions and neighboring residues were found to participate in a myriad of different crystal lattice packing interactions in the Fab and Fab:antigen complex structures presented in this study (Figure 3b and Figure 4b). Moreover, by utilizing FabS1C, FabS1CE, and FabS1E frameworks, we have observed different S1‐mediated packing sites with neighboring Fab heavy chain, Fab light chain, and antigen molecules in the crystal lattice environment of other Fab and Fab:antigen complex structures (unpublished data). As shown in this study, the S1 substitutions, Q165S and K167Y, work in cooperation with residues N170, A171, L172 and S174 in the adjacent loop region to mediate interactions with nonpolar, polar and/or charged residues in packing molecule surfaces, and thus adapt to the requirements of different crystal lattice formations. As intended, by implementing the SER strategy and identifying the S1 substitutions, we have improved the capacity of the S1 site and surrounding residues to participate in crystal lattice packing interactions. While the Crystal Kappa and elbow substitutions have dominating and predictable roles in facilitating Fab/Fab:antigen complex crystallization, we propose that the S1 site is more adaptable, and forms a responsive packing interaction to support crystal lattice formation. In this way, the S1 substitutions effectively complement the Crystal Kappa and elbow substitutions.
Used independently and in pair‐wise combinations, the S1, Crystal Kappa and elbow substitutions confer advantages to Fab/Fab:antigen complex crystallization in distinct ways. However, a striking finding of this investigation was how well the three substitutions complement one another. The FabS1CE framework—containing all three substitutions—facilitated crystallization of all Fab and Fab:antigen complexes tested, and it was the leading performer overall, in terms of generating the most crystal hits with the best crystal morphology across the broad crystallization screens. After evaluating the results of our extensive crystallization screening with three apo Fab test cases (Fab‐F1, Fab‐F4.A, and Fab‐14836) and three Fab:antigen complex test cases (Fab‐F1:EPHA2‐FN2, Fab‐14,836:antigen‐A, and Fab‐14836:antigen‐B), we propose that the best Fab variant for facilitating Fab:antigen complex crystallization is FabS1CE.
The effect of the elbow substitution in reducing Fab conformational flexibility by stabilizing the elbow angle undoubtedly confers an advantage in the crystallization of some Fab:antigen complexes (Bailey et al., 2018). Indeed, the elbow substitution was key to generating better diffracting Fab‐V1:VHH complex crystals possessing higher crystal lattice symmetry and fewer molecules in the ASU, as compared to the FabWT framework (Table 1 and Figure 5b). However, the WT elbow may be considered a better alternative for some systems which benefit from greater Fab conformational flexibility. For these Fab:antigen complexes, the Fab framework with WT elbow may be better able to adapt and accommodate the spatial requirements in the crystal lattice formation, particularly when combined with the dominant Crystal Kappa substitution. Therefore, in addition to the FabS1CE framework, we recommend utilization of the FabS1C framework as a secondary option, given an adequate supply of antigen protein (Figure 6).
FIGURE 6.

The two best Fab frameworks with improved crystallizability. (a) Schematic representation of the Fab light‐chain and heavy‐chain (colored gray or light blue, respectively) with the locations of S1 (blue), Crystal Kappa (green), and elbow (magenta) substitutions highlighted. To incorporate Crystal Kappa, residues “HQGLSSP” are substituted with “QGTTS” in the CL domain (Lieu et al., 2020) (see Table S3). To incorporate the elbow substitution, “SSAST” is substituted with “FNQI” at the linker region connecting the VH and CH domains, as described (Bailey et al., 2018). To incorporate the S1 substitutions (Q165S and K167Y), the flanking residue sequence “PREAKVSWYVDNALQS” in the context of the CL domain should also be included. (b) The two best Fab frameworks for enhancing crystallization. The FabS1CE framework (left) which contains all three substitutions should be prioritized but, given an adequate supply of antigen, FabS1C should also be tried. Substituted regions are colored as in (a) and substituted resides are shown as spheres.
We must emphasize the robustness of using the FabS1CE and FabS1C frameworks for facilitating crystallization. At relatively low protein concentrations (7 mg/mL), we are now able to generate Fab:antigen complex crystal hits in numerous conditions. Notably, this hit rate is without additional manipulations such as seeding. Furthermore, we typically find diffraction‐quality crystals directly from the 96‐well screens, avoiding refinement of the crystallization conditions.
Although we expect that the S1 substitutions, Q165S and K167Y (used in conjunction with Crystal Kappa +/− elbow substitutions), are favorable for mediating crystal lattice packing interactions and facilitating crystallization of most Fab:antigen complexes, there may be a few cases where the original WT sequence is better suited at the S1 site. For instance, in some cases, Lys:Glu salt bridge interactions have been shown to not only form the basis for a crystal contact site but to also reduce the entropic cost of crystallization by a combination of local dehydration and prevention of otherwise unfavorable structural changes (Shiroishi et al., 2001; Tsumoto et al., 1996). Therefore, the third framework which we recommend using is FabC. Notwithstanding the excellent capacity of the Crystal Kappa substitution for enhancing crystallizability of the Fab framework, one caveat with using this substitution alone or in conjunction with the S1 and elbow substitutions, is that due to its dominating packing mode it could impose certain restrictions in crystal lattice packing which may lead to a high solvent content and/or disruption of the native Fab:antigen complex. In such cases, it is advisable to use the FabS1, FabE, or FabS1E frameworks to capture alternative crystal lattice packing and symmetry forms. In summary, we recommend that the best frameworks for facilitating crystallization of Fab:antigen complexes in different crystal lattice packing and symmetry formations are the following (in order of priority): FabS1CE, FabS1C, FabC, FabE, FabS1, and FabS1E.
In conclusion, the SER substitutions that we have generated can be combined with previously reported elbow (Bailey et al., 2018) and Crystal Kappa (Lieu et al., 2020) substitutions to provide a powerful toolkit for enhancing Fab and Fab:antigen complex crystallization. It is noteworthy that the S1 and Crystal Kappa substitutions reside in the constant region of the Fab. Thus, this mutation combination can be applied to any Fab of interest, regardless of source or species. By simply combining the VH and VL domains from a Fab of interest with the CL and CH domains reported here, chimeric Fabs with enhanced crystallizability can be created in a modular manner. Furthermore, while the elbow substitution has thus far only been used with kappa light chains, it has potential to be used for crystallization of Fabs containing lambda light chains. We anticipate that these strategies will greatly accelerate the elucidation of Fab:antigen complex structures of basic and therapeutic interest, and moreover, will further advance the use of Fabs as chaperones for the structural analysis of proteins and complexes that are recalcitrant to conventional crystallization.
4. MATERIALS AND METHODS
4.1. Construction and screening of phage‐displayed libraries
Phage‐displayed Fab libraries were constructed using a phagemid system, as described (Derewenda, 2010), with diversified positions and degenerate codons described in Figure 1. Phage pools representing the libraries were cycled through rounds of binding selections with EPHA2‐FN2‐Fc fusion protein immobilized on Maxisorp Immuno plates (ThermoFisher, #12‐565‐135), as described previously (Enderle et al., 2021). After five rounds of selection, individual clones were assayed for specific binding to EPHA2‐FN2‐Fc fusion protein, and positive clones were subjected to DNA sequence analysis.
4.2. Fab protein production
For bacterial expression of Fab‐F1 SER framework variants (S1‐S7), the genes encoding the Fab light and heavy chains were cloned into a bicistronic expression vector with F1 ori, AmpR, and lacIq components. E.coli BL21 (DE3) cultures harboring the expression vector were grown to 0.6 OD600 in 2xYT media supplemented with 50 μg/mL of carbenicillin, followed by induction upon addition of 1 mM IPTG and incubation overnight at 18°C. The cell pellet was harvested by centrifugation, resuspended, and lysed in lysis buffer (Phosphate Buffered Saline [PBS], 1% Triton X‐100, 250 U/L benzonase, 2 mM MgCl2, 0.1 mM phenylmethylsulphonyl fluoride, and 1 g/L lysozyme). Cellular debris was removed by centrifugation. Fab protein was purified by rProtein A Sepharose (GE Healthcare) chromatography, and after elution with Pierce™ IgG Elution Buffer, was buffer exchanged into 20 mM HEPES pH 7.5, 100 mM NaCl followed by clarification by centrifugation.
For expression of Fab‐V1 variants, genes encoding the heavy and light chains were cloned into the pRH2.2 bicistronic expression vector suitable for bacterial expression and transformed into E. coli BL21 (DE3) competent cells. Cells were grown in 2xYT media containing 100 μg/mL of ampicillin at 37°C for 2–3 h. Expression of Fabs was induced with 1 mM IPTG at 0.8–1.2 OD600, and cells were harvested by centrifugation after further growth for 3–4 h after induction. Cells were homogenized in PBS supplemented with 1 mM PMSF. The cell lysate was incubated at 63°C for 30 min prior to centrifugation that cleared lysate solution from cell debris. The cleared lysate was loaded onto a 5‐mL HiTrap Protein‐L affinity column. The column was pre‐equilibrated and washed with buffer containing 20 mM Tris HCl pH 7.5 and 500 mM NaCl. Eluted Fabs in acetic acid from Protein‐L column were loaded onto a 1‐mL Resource S cation exchange column that was pre‐equilibrated and later washed with buffer containing 50 mM Sodium Acetate pH 5.0. Fabs were eluted using a gradient of buffer containing 50 mM Sodium Acetate pH 5.0 and 2 M NaCl. Eluted fractions were concentrated against PBS.
For mammalian expression of Fabs, the genes encoding the heavy‐ and light‐chains were cloned into separate vectors, suitable for mammalian expression as described in Tao et al. (2019). Briefly, Expi293™ cell (ThermoFisher) culture was grown to a density of 2.6 × 10⁶ cell/mL in Expi293 media (Gibco) before co‐transfection with Fab heavy‐ and light‐chain expression vectors using FectoPRO® DNA transfection kit (Polyplus‐transfection). Cells were kept at 37°C, 8% CO2, 80% humidity with shaking at 125 rpm for 5–6 days to allow protein expression to proceed. Cells were pelleted by centrifugation and Fab protein was purified as described above for bacterial expression.
4.3. Differential scanning fluorimetry
Melting temperature (°C) was determined by adding SYPRO™ Orange protein stain (Thermo Fisher) to 5 μM Fab protein in PBS and performing a thermal melt of 25–95°C (0.5°C /30 s intervals), as described (Miersch et al., 2021).
4.4. Antigen protein preparation
The VHH domain was expressed and purified as described (Bloch et al., 2021). For other antigens, the gene encoding each antigen was cloned into a mammalian expression vector by bacterial homologous recombination (Fels et al., 2020). To facilitate purification, a thrombin cleavage site followed by a hexa‐histidine tag was fused to the C‐terminus of EPHA2‐FN2, EPHA2‐CRD, and antigen‐A, whereas a papain cleavage site followed by an Fc‐tag was fused to the C‐terminus of antigen‐B. Antigen expression vectors were transfected in mammalian cell culture using the Expi293 expression system (ThermoFisher # A14635), as described above. Cell culture expressing EPHA2‐CRD or antigen‐B was supplemented with 5 mM Kifunensine (MedChemExpress) to inhibit mannosidase I activity. EPHA2‐FN2, EPHA2‐CRD, and antigen‐A were purified using His 60 Ni Superflow resin (Takara), while antigen‐B was purified with rProteinA Sepharose (GE Healthcare). Affinity tags were cleaved by incubation with either thrombin (Merck) or papain (Thermo Scientific). Antigen‐B was further purified from Fc using rProteinA Sepharose (GE Healthcare), followed by deglycosylation with endoH (New England Biolabs). Purified protein was buffer exchanged into 20 mM HEPES pH 7.5, 100 mM NaCl, and clarified by centrifugation.
4.5. Preparation of Fab:antigen complexes for crystallization
Protein purity and homogeneity was assessed using both denaturing and native polyacrylamide gel electrophoresis (Mini‐PROTEAN TGX Stain‐Free Precast Gels Bio‐Rad). FabWT‐F1 and SER variants (S1–S7) were checked by size exclusion chromatography using a Superdex 200 Increase 10/300 column (Fisher Scientific) and monitoring elution at 215 nm. Fab‐F1:EPHA2‐FN2, Fab‐14836:antigen‐A, and Fab‐14836:antigen‐B complexes were prepared for crystallization screening at a 1:2 molar ratio (Fab:antigen), 7 mg/mL protein in 20 mM HEPES pH 7.5, 100 mM NaCl. The Fab‐C1:EPHA2‐CRD complex was prepared for crystallization screening at a 1:1.3 molar ratio (Fab:antigen), 7 mg/mL protein in 20 mM HEPES pH 7.5, 100 mM NaCl.
Fab‐V1:VHH complexes were prepared at a 1:1.5 molar ratio and incubated at 4°C for 2 h, followed by purification using a Superdex 200 Increase 10/300 GL column. The eluted fractions containing Fab‐V1:VHH complex in buffer (10 mM Tris–HCl pH 7.5, 150 mM NaCl) were well separated from excess of VHH domain, before pooling and concentrating to 7 mg/mL for crystallization screening.
4.6. Screening and optimization of apo Fab and Fab:antigen complex crystallization
Fab‐V1:VHH complexes were crystallized by sitting drop vapor diffusion technique using Mosquito Crystal robot (SPT Labtech) at room temperature. Crystallization was set up by mixing 0.1 μL of protein complex solution with 0.1 μL of screen solution from 50 μL reservoir solution on 96‐well plate (TTP Labtech). In addition to JCSG‐plus HT‐96 Eco and PACT Premiere HT‐96 (Molecular Dimensions), crystallization screens INDEX HT, PEG/Ion HT (Hampton Research) and ProComplex (NeXtal) were used. Crystallization plates were incubated at 19°C and manually checked by light microscopy. In total, 119 crystals of various Fab variants complexed with VHH domain were supplemented with appropriate cryoprotectant (condition dependent) before being flash‐frozen in liquid nitrogen for data collection.
For apo Fab and all other Fab:antigen complexes, a Mosquito Crystal robot (SPT Labtech) was used to set up sitting drop crystallization screens with protein: precipitant drops at 0.2 μL:0.2 μL with 40 μL reservoir solution on 96‐well plates (Hampton Research), at room temperature. Commercial screens JCSG‐plus HT‐96 Eco and PACT Premiere HT‐96 (Molecular Dimensions), SaltRX HT, INDEX HT, GRAS Screen™ 1 and GRAS Screen™ 2 (Hampton Research) were used as specified in the text. Crystallization plates were incubated at room temperature and manually checked by light microscopy.
FabS1‐F1 was subjected to refinement in Cryschem sitting drop 24‐well plates (Hampton Research), for which plate‐like crystals emerged using a crystallization liquor of 20% PEG 3350, 200 mM Ammonium Sulfate and 100 mM Bis Tris HCl pH 6.5, and from which a dataset at 3.5 Å was obtained. FabC‐F1 crystals were obtained using the sitting drop method with 22% PEG 8000, 200 mM NaCl, and 100 mM sodium acetate pH 4.0 precipitant, and from which a 1.95 Å dataset was collected after cryoprotecting with 16% PEG8000, 100 mM sodium acetate pH 4.0, 200 mM NaCl.
Crystals of FabS1CE‐F1, FabS1C‐C1, FabS1CE‐C1:EPHA2‐CRD (trigonal crystal system), and FabS1CE‐C1:EPHA2‐CRD (monoclinic crystal system) harvested directly from the broad crystallization screening conditions (PACT‐F5, JCSG+Eco‐H6 and GRAS1‐A8, respectively), diffracted to 2.6, 2.1, 1.9, and 3.0 Å, respectively (all cryoprotected with the precipitant supplemented with 25% (v/v) ethylene glycol and flash freezing in liquid nitrogen before data collection).
4.7. Data collection and structure determination and refinement
For Fab‐V1:VHH complexes, X‐ray diffraction experiments were performed at beamline 24‐ID‐C or 24‐ID‐E at the Northeastern Collaborative Access Team (NECAT) at the Advance Photon Source at Argonne National Laboratory (Argonne IL). Datasets were collected remotely from a single crystal at 100 K using web‐based remote GUI developed by NECAT team. Individual datasets were indexed, integrated with XDS (Kabsch, 2010) and scaled with Aimless (Computational C, 1994). Structures were solved by molecular replacement method using PHASER (McCoy et al., 2007) with starting model of FabWT‐V1:VHH complex monomer (PDB ID: 7RTH) (Bloch et al., 2021). Structures were refined in PHENIX (Afonine et al., 2012) or Refmac (Murshudov et al., 2011) and manually corrected in Coot (Emsley et al., 2010). The crystal contact and the surface of accessible solvent area analyses were performed by PISA (Krissinel, 2011). Structural figures were made with CCP4mg (McNicholas et al., 2011).
For all other crystals, data collection was performed at Argonne National Laboratory at beamline 24‐ID‐E (NE‐CAT). Datasets were collected remotely from a single crystal at 100 K using web‐based remote GUI developed by NECAT team. Individual datasets were indexed, integrated with XDS (Kabsch, 2010) or Mosflm, and scaled with Aimless (Computational C, 1994). The crystal structures of the FabS1‐F1, FabC‐F1, FabS1CE‐F1, FabS1C‐C1, FabS1CE‐C1‐EPHA2‐CRD (trigonal crystal system), and FabS1C‐C1, FabS1CE‐C1‐EPHA2‐CRD (monoclinic crystal system) were solved from a 3.5, 1.9, 2.6, 2.1, 1.9, and 3.0 Å dataset, respectively, by molecular replacement using PHASER (McCoy et al., 2007). Model refinement was undertaken using an iterative combination of manual re‐modeling with Coot (Emsley et al., 2010) and automated fitting and geometry optimization with Phenix.refine (Afonine et al., 2012), including use of TLS (Urzhumtsev et al., 2013) parameters.
4.8. Data deposition
Coordinates and structure factors being presented for the first time have been deposited into the Protein Data Bank under the following accession codes: FabS1‐F1 (PDB: 8T7F), FabC‐F1 (PDB: 8T7G), FabS1CE‐F1 (PDB: 8T7I), FabS1CE‐C1:EPHA2‐CRD (trigonal crystal system) (PDB: 8TRS), FabS1CE‐C1:EPHA2‐CRD (monoclinic crystal system) (PDB: 8TRT), FabS1C‐C1 (PDB: 8TS5), FabC‐V1:VHH (PDB: 8T6I), FabE‐V1:VHH (PDB: 8T58), FabCE‐F1:VHH (PDB: 8T9Y), and FabS1CE‐F1:VHH (PDB: 8T8I).
AUTHOR CONTRIBUTIONS
Heather A. Bruce: Conceptualization; Investigation; Writing—original draft; Methodology; Validation; Writing—review & editing; Visualization; Software; Formal analysis; Data curation. Alexander U. Singer: Conceptualization; Investigation; Writing—original draft; Writing—review & editing; Visualization; Validation; Methodology; Software; Formal analysis; Project administration; Supervision; Data curation. Ekaterina V. Filippova: Investigation; Validation; Methodology; Visualization; Writing—review & editing; Writing—original draft; Software; Formal analysis; Data curation. Levi L. Blazer: Conceptualization; Investigation; Writing—original draft; Writing—review & editing; Visualization; Validation; Methodology; Project administration; Supervision; Data curation. Jarrett J. Adams: Conceptualization; Writing—original draft; Writing—review & editing; Validation; Methodology; Project administration; Supervision; Data curation. Leonie Enderle: Investigation; Methodology; Validation; Visualization; Writing—original draft. Moshe Ben‐David: Conceptualization; Investigation; Writing—original draft; Methodology; Validation; Visualization; Software; Formal analysis; Data curation. Elizabeth H. Radley: Investigation; Validation; Data curation. Daniel Y. L. Mao: Resources; Investigation. Victor Pau: Investigation; Resources. Stephen Orlicky: Investigation; Resources. Frank Sicheri: Resources; Funding acquisition; Investigation. Igor Kurinov: Formal analysis; Software; Data curation; Resources. Shane Atwell: Conceptualization; Writing—review & editing. Anthony A. Kossiakoff: Conceptualization; Funding acquisition; Resources; Writing—review & editing; Project administration; Supervision. Sachdev S. Sidhu: Conceptualization; Investigation; Funding acquisition; Writing—original draft; Writing—review & editing; Methodology; Validation; Project administration; Resources; Supervision.
Supporting information
DATA S1: Supporting Information.
DATA S2: Supporting Information.
ACKNOWLEDGMENTS
We are grateful to Lia Cardarelli, Greg Martyn, Shane Miersch, and Ricky Lieu for their valuable insights and helpful advice. HAB would like to thank Paul Norman for his excellent chemistry teaching. This research was funded by Bristol‐Myers‐Squibb.
Bruce HA, Singer AU, Filippova EV, Blazer LL, Adams JJ, Enderle L, et al. Engineered antigen‐binding fragments for enhanced crystallization of antibody:antigen complexes. Protein Science. 2024;33(1):e4824. 10.1002/pro.4824
Review Editor: Jeanine Amacher
REFERENCES
- Afonine PV, Grosse‐Kunstleve RW, Echols N, Headd JJ, Moriarty NW, Mustyakimov M, et al. Towards automated crystallographic structure refinement with phenix.refine. Acta Crystallogr D Biol Crystallogr. 2012;68:352–367. [DOI] [PMC free article] [PubMed] [Google Scholar]
- Anon X‐Ray Crystallography and Crystal Packing Analysis . Solid state properties of pharmaceutical Materials. Wiley: New Jersey; 2017. p. 99–106. 10.1002/9781119264408.ch8 [DOI] [Google Scholar]
- Bailey LJ, Sheehy KM, Dominik PK, Liang WG, Rui H, Clark M, et al. Locking the elbow: improved antibody Fab fragments as chaperones for structure determination. J Mol Biol. 2018;430:337–347. [DOI] [PMC free article] [PubMed] [Google Scholar]
- Bloch JS, Mukherjee S, Kowal J, Filippova EV, Niederer M, Pardon E, et al. Development of a universal nanobody‐binding Fab module for fiducial‐assisted cryo‐EM studies of membrane proteins. Proc Natl Acad Sci U S A. 2021;118:e2115435118. 10.1073/pnas.2115435118 [DOI] [PMC free article] [PubMed] [Google Scholar]
- Bostrom J, Haber L, Koenig P, Kelley RF, Fuh G. High affinity antigen recognition of the dual specific variants of Herceptin is entropy‐driven in spite of structural plasticity. PLoS One. 2011;6:1–12. [DOI] [PMC free article] [PubMed] [Google Scholar]
- Boulot G, Guillon V, Mariuzza RA, Poljak RJ, Riott'ot M‐M, Souchon H, et al. Crystallization of antibody fragments and their complexes with antigen. J Cryst Growth. 1988;90:213–221. [Google Scholar]
- Canaves JM, Page R, Wilson IA, Stevens RC. Protein biophysical properties that correlate with crystallization success in Thermotoga maritima: maximum clustering strategy for structural genomics. J Mol Biol. 2004;344:977–991. [DOI] [PubMed] [Google Scholar]
- Carter PJ. Potent antibody therapeutics by design. Nat Rev Immunol. 2006;6:343–357. [DOI] [PubMed] [Google Scholar]
- Castells‐Graells R, Meador K, Arbing MA, Sawaya MR, Gee M, Cascio D, et al. Cryo‐EM structure determination of small therapeutic protein targets at 3 Å‐resolution using a rigid imaging scaffold. Proc Natl Acad Sci U S A. 2023;120:1–8. [DOI] [PMC free article] [PubMed] [Google Scholar]
- Chen J, Noble AJ, Kang JY, Darst SA. Eliminating effects of particle adsorption to the air/water interface in single‐particle cryo‐electron microscopy: bacterial RNA polymerase and CHAPSO. J Struct Biol. 2019;X 1:100005. [DOI] [PMC free article] [PubMed] [Google Scholar]
- Chen W, Gong R, Ying T, Prabakaran P, Zhu Z, Feng Y, et al. Discovery of novel candidate therapeutics and diagnostics based on engineered human antibody domains. Curr Drug Discov Technol. 2014;11:28–40. [DOI] [PMC free article] [PubMed] [Google Scholar]
- Cianfrocco MA, Kellogg EH. What could go wrong? A practical guide to single‐particle Cryo‐EM: from biochemistry to atomic models. J Chem Inf Model. 2020;60:2458–2469. [DOI] [PMC free article] [PubMed] [Google Scholar]
- Computational C . The CCP4 suite: programs for protein crystallography. 1994. [DOI] [PubMed]
- Cooper DR, Boczek T, Grelewska K, Pinkowska M, Sikorska M, Zawadzki M, et al. Protein crystallization by surface entropy reduction: optimization of the SER strategy. Acta Crystallogr D Biol Crystallogr. 2007;63:636–645. [DOI] [PubMed] [Google Scholar]
- Derewenda ZS. Application of protein engineering to enhance crystallizability and improve crystal properties. Acta Crystallogr D Biol Crystallogr. 2010;66:604–615. [DOI] [PMC free article] [PubMed] [Google Scholar]
- Derewenda ZS, Vekilov PG. Entropy and surface engineering in protein crystallization. Acta Crystallogr D Biol Crystallogr. 2006;62:116–124. [DOI] [PubMed] [Google Scholar]
- Emsley P, Lohkamp B, Scott WG, Cowtan K. Features and development of coot. Acta Crystallogr D Biol Crystallogr. 2010;66:486–501. [DOI] [PMC free article] [PubMed] [Google Scholar]
- Enderle L, Shalaby KH, Gorelik M, Weiss A, Blazer LL, Paduch M, et al. A T cell redirection platform for co‐targeting dual antigens on solid tumors. MAbs. 2021;13:1–18. [DOI] [PMC free article] [PubMed] [Google Scholar]
- Ereño‐Orbea J, Sicard T, Cui H, Carson J, Hermans P, Julien JP. Structural basis of enhanced crystallizability induced by a molecular chaperone for antibody antigen‐binding fragments. J Mol Biol. 2018;430:322–336. [DOI] [PubMed] [Google Scholar]
- Fels U, Gevaert K, Van Damme P. Bacterial genetic engineering by means of recombineering for reverse genetics. Front Microbiol. 2020;11:1–19. [DOI] [PMC free article] [PubMed] [Google Scholar]
- Fuh G, Wu P, Liang WC, Ultsch M, Lee CV, Moffat B, et al. Structure‐function studies of two synthetic anti‐vascular endothelial growth factor Fabs and comparison with the Avastin™ Fab. J Biol Chem. 2006;281:6625–6631. [DOI] [PubMed] [Google Scholar]
- Kabsch W. XDS. Acta Crystallogr D Biol Crystallogr [Internet]. 2010;66:125–132. https://scripts.iucr.org/cgi-bin/paper?S0907444909047337 [DOI] [PMC free article] [PubMed] [Google Scholar]
- Kim EG, Kim KM. Strategies and advancement in antibody‐drug conjugate optimization for targeted cancer therapeutics. Biomol Ther (Seoul). 2015;23:493–509. [DOI] [PMC free article] [PubMed] [Google Scholar]
- Koldobskaya Y, Duguid EM, Shechner DM, Suslov NB, Ye J, Sidhu SS, et al. A portable RNA sequence whose recognition by a synthetic antibody facilitates structural determination. Nat Struct Mol Biol. 2011;18:100–107. [DOI] [PMC free article] [PubMed] [Google Scholar]
- Krissinel E. Macromolecular complexes in crystals and solutions. Acta Crystallogr D Biol Crystallogr. 2011;67:376–385. [DOI] [PMC free article] [PubMed] [Google Scholar]
- Lefranc M‐P, Pommié C, Ruiz M, Giudicelli V, Foulquier E, Truong L, et al. Lefranc G IMGT unique numbering for immunoglobulin and T cell receptor variable domains and Ig superfamily V‐like domains. http://imgt.cines.fr [DOI] [PubMed]
- Lieu R, Antonysamy S, Druzina Z, Ho C, Kang NR, Pustilnik A, et al. Rapid and robust antibody Fab fragment crystallization utilizing edge‐to‐edge beta‐sheet packing. PLoS One. 2020;15:1–16. [DOI] [PMC free article] [PubMed] [Google Scholar]
- Liu Y, Huynh DT, Yeates TO . A 3.8 Å resolution cryo‐EM structure of a small protein bound to an imaging scaffold. Nat Commun. 2019;10:1–7. [DOI] [PMC free article] [PubMed] [Google Scholar]
- Longenecker KL, Garrard SM, Sheffield PJ, Derewenda ZS. Biological crystallography protein crystallization by rational mutagenesis of surface residues: Lys to ala mutations promote crystallization of RhoGDI. Acta Crystallogr. 2001;57:679–688. [DOI] [PubMed] [Google Scholar]
- Males A, Davies GJ. Structural studies of a surface‐entropy reduction mutant of O‐GlcNAcase. Acta Crystallogr D Struct Biol. 2019;75:70–78. [DOI] [PMC free article] [PubMed] [Google Scholar]
- Malia TJ, Obmolova G, Luo J, Teplyakov A, Sweet R, Gilliland GL. Crystallization of a challenging antigen‐antibody complex: TLR3 ECD with three noncompeting Fabs. Acta Crystallogr Sect F Struct Biol Cryst Commun. 2011;67:1290–1295. [DOI] [PMC free article] [PubMed] [Google Scholar]
- McCoy AJ, Grosse‐Kunstleve RW, Adams PD, Winn MD, Storoni LC, Read RJ. Phaser crystallographic software. J Appl Crystallogr. 2007;40:658–674. [DOI] [PMC free article] [PubMed] [Google Scholar]
- McNicholas S, Potterton E, Wilson KS, Noble MEM. Presenting your structures: the CCP4mg molecular‐graphics software. Acta Crystallogr D Biol Crystallogr. 2011;67:386–394. [DOI] [PMC free article] [PubMed] [Google Scholar]
- McPherson A, Gavira JA. Introduction to protein crystallization. Acta Crystallogr Sect F Struct Biol Cryst Commun. 2014;70:2–20. [DOI] [PMC free article] [PubMed] [Google Scholar]
- Miersch S, Li Z, Saberianfar R, Ustav M, Brett Case J, Blazer L, et al. Tetravalent SARS‐CoV‐2 neutralizing antibodies show enhanced potency and resistance to escape mutations. J Mol Biol. 2021;433:1–21. [DOI] [PMC free article] [PubMed] [Google Scholar]
- Murshudov GN, Skubák P, Lebedev AA, Pannu NS, Steiner RA, Nicholls RA, et al. REFMAC5 for the refinement of macromolecular crystal structures. Acta Crystallogr D Biol Crystallogr. 2011;67:355–367. [DOI] [PMC free article] [PubMed] [Google Scholar]
- Power CA, Bates A. David vs. Goliath: the structure, function, and clinical prospects of antibody fragments. Antibodies. 2019;8:1–31. [DOI] [PMC free article] [PubMed] [Google Scholar]
- Price WN, Chen Y, Handelman SK, Neely H, Manor P, Karlin R, et al. Understanding the physical properties that control protein crystallization by analysis of large‐scale experimental data. Nat Biotechnol. 2009;27:51–57. [DOI] [PMC free article] [PubMed] [Google Scholar]
- Ravindran PP, Héroux A, Ye JD. Improvement of the crystallizability and expression of an RNA crystallization chaperone. J Biochem. 2011;150:535–543. [DOI] [PMC free article] [PubMed] [Google Scholar]
- Roos G, Brosens E, Wahni K, Desmyter A, Spinelli S, Wyns L, et al. Combining site‐specific mutagenesis and seeding as a strategy to crystallize “difficult” proteins: the case of Staphylococcus aureus thioredoxin. Acta Crystallogr Sect F Struct Biol Cryst Commun. 2006;62:1255–1258. [DOI] [PMC free article] [PubMed] [Google Scholar]
- Shi Y. A glimpse of structural biology through X‐ray crystallography. Cell. 2014;159:995–1014. [DOI] [PubMed] [Google Scholar]
- Shiroishi M, Yokota A, Tsumoto K, Kondo H, Nishimiya Y, Horii K, et al. Structural evidence for entropic contribution of salt bridge formation to a protein antigen‐antibody interaction. The case of hen lysozyme‐HyHEL‐10 Fv complex. J Biol Chem. 2001;276:23042–23050. [DOI] [PubMed] [Google Scholar]
- Smyth MS, Martin JHJ. Review x ray crystallography. 2000. [DOI] [PMC free article] [PubMed]
- Sobolev V, Eyal E, Gerzon S, Potapov V, Babor M, Prilusky J, et al. SPACE: a suite of tools for protein structure prediction and analysis based on complementarity and environment. Nucleic Acids Res. 2005;33:39–43. [DOI] [PMC free article] [PubMed] [Google Scholar]
- Stanfield RL, Zemla A, Wilson IA, Rupp B. Antibody elbow angles are influenced by their light chain class. J Mol Biol. 2006;357:1566–1574. [DOI] [PubMed] [Google Scholar]
- Tao Y, Mis M, Blazer L, Jnr MU, Steinhart Z, Chidiac R, et al. Tailored tetravalent antibodies potently and specifically activate Wnt/frizzled pathways in cells. Organoids Mice. 2019;8:e46134. 10.7554/eLife.46134.001 [DOI] [PMC free article] [PubMed] [Google Scholar]
- Tsumoto K, Ogasahara K, Ueda Y, Watanabe K, Yutani K. Kumagai I role of salt bridge formation in antigen‐antibody interaction entropic contribution to the complex between hen egg white lysozyme and its monoclonal antibody HyHEL10*. 1996. http://www-jbc.stanford.edu/jbc/ [DOI] [PubMed]
- Urzhumtsev A, Afonine PV, Adams PD. TLS from fundamentals to practice. Crystallogr Rev. 2013;19:230–270. [DOI] [PMC free article] [PubMed] [Google Scholar]
- Wang HW. A commentary of “Cryo‐EM achieves atomic resolution” in 10 remarkable discoveries from 2020 in nature. Fundam Res. 2022;2:349–350. [DOI] [PMC free article] [PubMed] [Google Scholar]
- Wang HW, Wang JW. How cryo‐electron microscopy and X‐ray crystallography complement each other. Protein Sci. 2017;26:32–39. [DOI] [PMC free article] [PubMed] [Google Scholar]
- Wu X, Rapoport TA. Cryo‐EM structure determination of small proteins by nanobody‐binding scaffolds (Legobodies). https://www.pnas.org [DOI] [PMC free article] [PubMed]
- Wu Y, Cain‐Hom C, Choy L, Hagenbeek TJ, De Leon GP, Chen Y, et al. Therapeutic antibody targeting of individual notch receptors. Nature. 2010;464:1052–1057. [DOI] [PubMed] [Google Scholar]
- Xu Y, Dang S. Recent technical advances in sample preparation for single‐particle Cryo‐EM. Front Mol Biosci. 2022;9:1–12. [DOI] [PMC free article] [PubMed] [Google Scholar]
- Ye J‐D, Tereshko V, Frederiksen JK, Koide A, Fellouse FA, Sidhu SS, et al. Synthetic antibodies for specific recognition and crystallization of structured RNA. Proc Natl Acad Sci. 2008;105:82–87. [DOI] [PMC free article] [PubMed] [Google Scholar]
Associated Data
This section collects any data citations, data availability statements, or supplementary materials included in this article.
Supplementary Materials
DATA S1: Supporting Information.
DATA S2: Supporting Information.